707 Broadway, Suite 905, San Diego, CA 92101 P: (619) 234-6423 • F: (619) 234-7403 • www.sdcta.org
CITY OF SAN DIEGO PROPOSITION C: THE CHARGERS’ “SAN DIEGO INTEGRATED CONVENTION CENTER EXPANSION/ STADIUM AND TOURISM INITIATIVE”
August 2016
SDCTA Position:
OPPOSE
Rationale for Position: Even with optimistic and likely unrealistic assumptions and projections, overall revenue would fall significantly short of the estimated $1.15 billion, not including interest on public debt, needed by the City of San Diego to construct this integrated facility. The City of San Diego would likely have to service debt from the General Fund, which funds street repairs, programs for citizens, and other public services, in order to maintain its credit ratings and avoid higher financing charges for future debt. Title: Proposition C - San Diego Integrated Convention Center Expansion/ Stadium and Tourism Initiative Jurisdiction: City of San Diego Type: Transient Occupancy Tax (TOT or hotel tax), dedicated to specific purpose Vote: Two-thirds of Voters in the City of San Diego Status: On the November 8, 2016 General Election Ballot Issue: Tourism and Recreation Description: A 6% increase in the TOT to fund a new tourism marketing district (1%) and a new “Convention Center Expansion and Stadium Fund” (5%). Fiscal Impact: Even with optimistic and likely unrealistic assumptions and projections, overall revenue would fall short of the estimated $1.15 billion, not including interest, needed by the City of San Diego to construct this integrated facility. The City of San Diego would likely have to service debt from the General Fund, which pays for a wide range of public services, in order to maintain its credit ratings and avoid higher financing charges for future debt.
Page 1 of 36
707 Broadway, Suite 905, San Diego, CA 92101 P: (619) 234-6423 • F: (619) 234-7403 • www.sdcta.org
Introduction and Background The Chargers, a professional football team based in San Diego since 1961, have proposed a ballot initiative entitled the “San Diego Integrated Convention Center Expansion/ Stadium and Tourism Initiative” that will go before City of San Diego voters in the November 2016 General Election. This initiative proposes, in general, an increase of 6% to the City of San Diego Transient Occupancy Tax (TOT or hotel tax) to fund a new “San Diego Tourism and Marketing Fund” and the construction of a convention center annex integrated with a stadium for a professional football team in the East Village neighborhood of downtown San Diego. Estimated by the proponents to cost in aggregate approximately $1.8 billion, not including interest on bond issuances, the proposal calls for the joint funding of this combined facility. The City of San Diego would be responsible for (1) a $350 million contribution to the construction of the stadium—specifically the architectural component that integrates the stadium and convention center annex—and (2) the construction of the convention center annex. The “primary lessee” of the stadium facility—the Chargers—with the National Football League (NFL) would be responsible for a contribution of $650 million toward the construction of the stadium and any overruns associated with the stadium. The construction of this combined facility would be financed through revenue bonds issued by the City of San Diego against the anticipated General Fund revenue increases through the proposed increase to the TOT. TOT is currently 10.5%, but effectively 12.5% with the existing San Diego Tourism Marketing District (SDTMD) established in municipal code in 2008. This proposal replaces the SDTMD by replacing relevant sections of the municipal code, and it raises TOT from its existing level of 10.5% to 16.5%. Of the 6% increment, 1% would be dedicated to the SDTMD replacement in the proposal entitled the “San Diego Tourism and Marketing Fund” and the remaining 5% would be dedicated to the new “Convention Center Expansion and Stadium Fund” (CCES). History of the Relationship Between the Chargers and the City of San Diego The Chargers have been a part of the fabric of San Diego since they moved from Los Angeles in 1961. They have competed in the National Football League (NFL) since the NFL’s merger with the American Football League in 1970, and until the NFL’s recent approval allowing the Rams to move to the Los Angeles metro area, the Chargers were the only professional football team in Southern California. The Chargers have played once in the Super Bowl. When they moved to San Diego after one season in Los Angeles, the Chargers played in Balboa Stadium in Balboa Park. Balboa Stadium had been built in 1914 as part of the 1915 Panama-California Expo. The stadium had been built primarily through private contributions to the exposition. Page 2 of 36
707 Broadway, Suite 905, San Diego, CA 92101 P: (619) 234-6423 • F: (619) 234-7403 • www.sdcta.org
The Chargers have played their home games in what is now Qualcomm Stadium since 1967 (of note, Qualcomm Stadium was originally called San Diego Stadium and later Jack Murphy Stadium). The City of San Diego built this stadium and covered the entirety of the $27.75 million ($197 million in 2016 dollars) cost of construction. The Chargers had used this facility in conjunction with the Padres, San Diego’s professional baseball team, until the Padres moved to Petco Park at the turn of the century. In 1984, the City of San Diego expanded Qualcomm Stadium at a cost of $9.1 million, and in 1997, the City of San Diego renovated and expanded the stadium again, at the Chargers request, at a cost of $68 million. The Chargers and the City of San Diego have periodically renegotiated lease terms, and from the mid-1990s to 2004, the City of San Diego guaranteed the Chargers a minimum of 60,000 tickets per game. If minimums were not met, the City of San Diego had to pay the difference to the Chargers. In aggregate, the City of San Diego has paid the Chargers $36 million for this ticket guarantee. Since the mid-2000s, the Chargers have publicly expressed a desire for a modernized facility and in 2006, considered a plan to place on the ballot an initiative to transfer city-owned land at the existing Qualcomm Stadium site in exchange for their building a new stadium. While the Chargers did not move forward with a ballot initiative due to the troubled financial status of the city at the time, this interaction—sometimes caustic between the Chargers and the City Attorney at the time—led to earnest discussions amongst the Chargers, then-Mayor Jerry Sanders, and numerous other elected leaders to study and consider other sites for a new stadium for the Chargers. At that time, leaders from Escondido and Chula Vista had even intimated making potential offers to the Chargers so they would remain in the San Diego region. Ultimately, however, the Chargers renegotiated lease terms with the City of San Diego and agreed to remain until 2020, though their interest in a newer facility did not wane. In the meantime, the relationship between the City of San Diego and the Chargers continued to strain. The City Auditor issued in May 2009 an audit report entitled “The City of San Diego Faces Unique Operational and Administrative Challenges in Maintaining Qualcomm Stadium” and pointed out that the City of San Diego pays the Chargers year-to-year to play in Qualcomm Stadium. The 1997 renovation of Qualcomm Stadium failed to comply with the Americans with Disabilities Act, and the City of San Diego agreed through settlement to pay the Chargers for the lost revenue due to the reduction in seat capacity after the installation of wheelchair ramps. These public payments have been in excess of $10 million since. Additionally, the lease agreement between the City of San Diego and the Chargers has credited the Chargers for concessionary activity and property taxes, in addition to the settlement to make Qualcomm Stadium ADA compliant. Since 2007, the City of San Diego has owed the Chargers money after every season. The long-term lease agreement between the Chargers and the City of San Diego also gave the Chargers a window to terminate their lease between 1 February and 1 May of every year Page 3 of 36
707 Broadway, Suite 905, San Diego, CA 92101 P: (619) 234-6423 • F: (619) 234-7403 • www.sdcta.org
through 2020. This early termination option results in a termination fee intended to pay down the debt that financed the stadium’s renovation in 1997. This termination fee schedule created significant exposure for the city, as after 2010, the termination fee would not be adequate to cover the remaining debt. In 2011, the Chargers began suggesting that East Village would be ideal for a new site, and then-Mayor Jerry Sanders and the Chargers seemed optimistic about utilizing redevelopment to finance such a site. Statewide changes to redevelopment, however, stopped any of these ideas from coming to fruition, and the explorations to finance a new stadium for the Chargers essentially stopped during the 2012 election season. In 2013, the questioning of the legal viability of the SDTMD and its funding of an on-site expansion of the Convention Center opened an opportunity to further pursue ideas for an East Village stadium. Then-Mayor Bob Filner and the Chargers spokesperson Mark Fabiani began speaking publicly in support of a combined convention center and stadium complex in East Village. The California Coastal Commission approved plans in late 2013 to expand the existing Convention Center contiguously, along the waterfront, though the Chargers stated they might still proceed with their new East Village plans. Then in 2014 and 2015, a flurry of activities again strained the relationship between the City of San Diego and the Chargers. Soon after the resignation of then-Mayor Bob Filner over allegations of sexual harassment and subsequent election of now Mayor Kevin Faulconer, the Chargers announced their intention to pursue the East Village idea and criticized the City for its inability to maintain Qualcomm Stadium effectively. Mayor Faulconer then established a Citizens’ Stadium Advisory Group (CSAG) to propose a site and draft supporting financing framework for a new stadium. CSAG recommended pursuing Mission Valley as the site for a new stadium. The Mayor and County Supervisor Ron Roberts proposed $350 million of public funds without increasing taxes ($150 million from the county and $200 million from the city) to pursue this idea. But the Chargers did not support this concept and ceased discussions with the City/County negotiating team. During this time, the City of San Diego conducted an expedited environmental impact review of the Mission Valley site to demonstrate the city’s commitment to building a new stadium. Also at this time, the Chargers were finalizing plans to build a stadium in Los Angeles with the Oakland Raiders. This plan, however, competed with an alternative plan by the St. Louis Rams, and mistrust continued to build between the Chargers and San Diego as the Chargers filed for the “Los Angeles Chargers” trademark. The NFL ultimately approved the Rams’ proposal, by a 30-2 vote of team owners, and the Chargers were given the option to join in a lease with the Rams in future years. The Chargers decided to remain in San Diego an additional season and sought an additional $200 million from the City and County to move forward with their Mission Valley stadium proposal. When Mayor Faulconer and Supervisor Roberts balked, the Chargers turned their Page 4 of 36
707 Broadway, Suite 905, San Diego, CA 92101 P: (619) 234-6423 • F: (619) 234-7403 • www.sdcta.org
attention back to East Village. The Chargers developed a ballot initiative for a joint-use stadium and convention center annex and successfully qualified it for the ballot with an adequate number of signatures. The San Diego City Council formally approved its placement on the November 2016 ballot in July 2016, and as of the writing of this paper, Mayor Kevin Faulconer has neither indicated support nor opposition to the Chargers measure. History of SDCTA on Convention Centers and Professional Sports in San Diego While Appendix A provides a fuller account of SDCTA’s history and past positions on the original San Diego, later Jack Murphy, and now Qualcomm Stadium, Petco Park, the waterfront convention center and expansion, and the existing SDTMD, SDCTA has historically and consistently stood by these principles during previous proposals of professional sports facilities and the building and expansion of convention centers: •
•
•
SDCTA supports economic development so long as the anticipated marginal revenue from a tax increase covers the marginal costs of a proposed investment. That was why SDCTA supported the original San Diego Stadium and the building of the Convention Center along the waterfront. When a public and private entity jointly take on risk, SDCTA supports that financial risks be shared commensurate with potential financial benefits. If the public is taking on significant financial risk, the resources of the private partner should guarantee a reduction and preferably an elimination of that liability. This is why SDCTA advocated during the discussions on Petco Park that should revenue not meet goals, the team should be responsible for covering shortfalls—and the public could even seize the assets of the team if revenues were inadequate to cover debt and maintenance. SDCTA opposes financing methods where the length of the debt service does not match the expected useful life of the asset. This is why in the development of the Petco Park deal, SDCTA supported that the Padres’ lease would have to coincide with the length of the debt used to build the park.
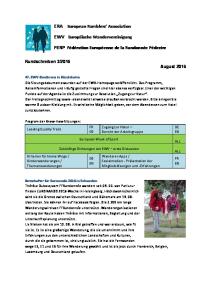
Fiscal Impact of the Chargers’ Proposal Potential Revenue and Benefits to the City of San Diego 1. Revenue from usage of a new stadium during the off-season The proposal gives the City of San Diego the opportunity to utilize the stadium during the off-season. SDCTA cannot estimate the likely revenue to be generated as there are no comparable facilities with sufficient historical data. The only benchmark by which SDCTA Page 5 of 36
707 Broadway, Suite 905, San Diego, CA 92101 P: (619) 234-6423 • F: (619) 234-7403 • www.sdcta.org
might be able to estimate margins from rental of a new stadium and connected assets, like parking, is historic data from the current Qualcomm Stadium.
Source: City of San Diego
Source: City of San Diego
On average, the City of San Diego has earned margins of approximately $2.8 million per year during the last five years on non-Chargers events. It is reasonable to assume that this figure would not change appreciably with the addition of a new stadium, as the existing Qualcomm Page 6 of 36
707 Broadway, Suite 905, San Diego, CA 92101 P: (619) 234-6423 • F: (619) 234-7403 • www.sdcta.org
Stadium has yet to reach maximum capacity on available event days. Even if there were more demand for stadium or adjacent parking spaces, the City of San Diego would likely observe decreasing, at best, or negative, at worst, margins with the doubling of capacity while both facilities offer space for non-football events and an increase in expenses with a second facility. Disregarding the above assumptions and supposing, however, that the City stops making the current Qualcomm Stadium available for non-football events and optimistically supposing the design of the new integrated facility attracts many new types of events or functions at double the historical sales rate, the City would make $280 million over the next thirty years. The table below assumes an annual inflation rate of 3.22%. Year 1 2 3 4 5 6 7 8 9 10 11 12 13 14 15 16 17 18 19 20 21 22 23 24 25 26 27 28 29 30 Total
Same Sales Rate $2,845,690.20 $2,937,321.42 $3,031,903.17 $3,129,530.46 $3,230,301.34 $3,334,317.04 $3,441,682.05 $3,552,504.21 $3,666,894.85 $3,784,968.86 $3,906,844.86 $4,032,645.26 $4,162,496.44 $4,296,528.83 $4,434,877.05 $4,577,680.09 $4,725,081.39 $4,877,229.01 $5,034,275.79 $5,196,379.47 $5,363,702.89 $5,536,414.12 $5,714,686.66 $5,898,699.57 $6,088,637.69 $6,284,691.83 $6,487,058.90 $6,695,942.20 $6,911,551.54 $7,134,103.50 $140,314,640.68
Double Sales Rate $5,691,380.40 $5,874,642.85 $6,063,806.35 $6,259,060.91 $6,460,602.67 $6,668,634.08 $6,883,364.10 $7,105,008.42 $7,333,789.69 $7,569,937.72 $7,813,689.72 $8,065,290.52 $8,324,992.88 $8,593,057.65 $8,869,754.11 $9,155,360.19 $9,450,162.79 $9,754,458.03 $10,068,551.58 $10,392,758.94 $10,727,405.78 $11,072,828.24 $11,429,373.31 $11,797,399.13 $12,177,275.38 $12,569,383.65 $12,974,117.80 $13,391,884.40 $13,823,103.08 $14,268,206.99 $280,629,281.37
2. Revenue and economic activity from events in convention center annex and stadium The Chargers have suggested through a confidential study not publicly released at the time of the writing of this analysis that the convention center annex in their measure would generate an additional 1.85 million hotel room nights over 10 years. Per year, this would be Page 7 of 36
707 Broadway, Suite 905, San Diego, CA 92101 P: (619) 234-6423 • F: (619) 234-7403 • www.sdcta.org
an additional 185,000 hotel room nights. The San Diego Convention Center Corporation reports that the existing facility and the conventions/events supported 690,588 hotel room nights in FY2015, so the Chargers’ presumption would be a 26.7% increase, and without supporting data and specific design of the proposed integrated facility, this figure is difficult to validate. Suppose, however, the figures from the Chargers commissioned study were true. It would generate approximately $70.5 million in additional TOT revenue for the CCES Fund over 30 years. See the table below: (1) Hotel room nights (2) 10.5% TOT collection for City of San Diego in FY15 (3) Associated number of hotel room nights (4) 1% of TOT per room night (5) 5% of TOT per room night (6) Per year additional TOT revenue Year 1 Assuming 3.22% inflation year-over-year - 2 3 4 5 6 7 8 9 10 11 12 13 14 15 16 17 18 19 20 21 22 23 24 25 26 27 28
185,000 $186,235,290.00 11,463,441 $1.55 $7.74 $1,431,196.99 $1,431,196.99 $1,477,281.53 $1,524,849.99 $1,573,950.16 $1,624,631.36 $1,676,944.49 $1,730,942.10 $1,786,678.44 $1,844,209.48 $1,903,593.03 $1,964,888.72 $2,028,158.14 $2,093,464.83 $2,160,874.40 $2,230,454.56 $2,302,275.19 $2,376,408.45 $2,452,928.81 $2,531,913.11 $2,613,440.72 $2,697,593.51 $2,784,456.02 $2,874,115.50 $2,966,662.02 $3,062,188.54 $3,160,791.01 $3,262,568.48 $3,367,623.19
29 30 Total
$3,476,060.65 $3,587,989.81 $70,569,133.25
Data Source Unclear - based on public statements by proponents SD Tourism Authority SD Tourism Authority Calculated: (2) ÷ (3) ÷ 10.5 Calculated: (4) x 5.0 Calculated: (1) x (5) From (6)
While the level of increased economic activity from the convention center portion of the proposal may be uncertain, there is extensive literature, summarized in Appendix B, that demonstrates football stadiums especially do not generate increased economic activity nor a significant increase in visitors. Families have finite resources to spend on recreation, and Page 8 of 36
707 Broadway, Suite 905, San Diego, CA 92101 P: (619) 234-6423 • F: (619) 234-7403 • www.sdcta.org
they spend it whether there are football games or not, substituted most often for other local leisure activities nearby. Suppose again, however, that the literature is incorrect and further suppose that every seat remaining above average historic home game attendance is filled by an out-of-town fan staying two nights in a hotel for all eight home games and two pre-season games and hotel demand is inelastic and thus unaffected by the increase in TOT. Also suppose that of average historic attendance, 25% are from out of town also staying for two nights in a hotel at every home game. The City of San Diego would then receive $152 million for the CCES Fund. (1) Average Attendance per Home Game (2) Total Available Seats in New Stadium (3) Assumed increase in out of town attendees (4) Number of Home and Pre-Season Games per Season (5) Assumed number of hotel nights (6) Number of room nights (7) 10.5% TOT collection for City of San Diego in FY15 (8) Associated number of hotel room nights (9) 10.5% TOT collection per room night (10) 5% TOT collection per room night for CCES
Year 1: Visitors x (4) x (5) x (10) Assumes 3.22% inflation year-over-year - 2 3 4 5 6 7 8 9 10 11 12 13 14 15 16 17 18 19 20 21 22 23 24 25 26 27 28 29 30
66,772 75,000 8,228 10 2 263,296 $186,235,290.00 11,463,441 $16.25 $7.74
Additional 8,228 Visitors $1,018,455.25 $1,051,249.51 $1,085,099.74 $1,120,039.95 $1,156,105.24 $1,193,331.83 $1,231,757.11 $1,271,419.69 $1,312,359.41 $1,354,617.38 $1,398,236.06 $1,443,259.26 $1,489,732.21 $1,537,701.58 $1,587,215.58 $1,638,323.92 $1,691,077.95 $1,745,530.66 $1,801,736.74 $1,859,752.67 $1,919,636.70 $1,981,449.01 $2,045,251.66 $2,111,108.77 $2,179,086.47 $2,249,253.05 $2,321,679.00 $2,396,437.07 $2,473,602.34 $2,553,252.33
Data Source NFL Chargers Calculated: (2) - (1) NFL Assumption Calculated: (3) x (4) x (5) SD Tourism Authority SD Tourism Authority Calculated: (7) ÷ (8) Calculated: (9) ÷ 10.5 x 5 Assuming 25% (16,693 of 66,772) who attend already are from out of town $2,066,246.17 $2,132,779.29 $2,201,454.79 $2,272,341.63 $2,345,511.03 $2,421,036.49 $2,498,993.86 $2,579,461.46 $2,662,520.12 $2,748,253.27 $2,836,747.03 $2,928,090.28 $3,022,374.79 $3,119,695.25 $3,220,149.44 $3,323,838.25 $3,430,865.85 $3,541,339.73 $3,655,370.86 $3,773,073.81 $3,894,566.78 $4,019,971.83 $4,149,414.93 $4,283,026.09 $4,420,939.53 $4,563,293.78 $4,710,231.84 $4,861,901.31 $5,018,454.53 $5,180,048.76
Page 9 of 36
707 Broadway, Suite 905, San Diego, CA 92101 P: (619) 234-6423 • F: (619) 234-7403 • www.sdcta.org Sum Total
Costs and expenses of operations and maintenance of the Stadium to the extent such costs and expenses are directly attributable to professional football events
$50,217,758.13 $152,099,750.89
$101,881,992.76
Relative to an estimated $1.15 billion public contribution, not including interest on public debt, these optimistic increases in TOT would still be inadequate to back the revenue bonds that would be issued to pay for this integrated facility, and the General Fund would be at risk to cover debt.
Lease Components
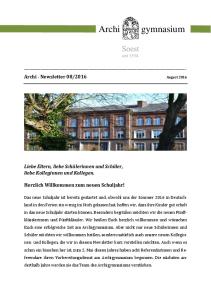
3. Lease Revenue from the Proposed Stadium Facility — and Differences in Arrangement with Padres at Petco Park The proposal does not specify the exact numerical terms of a potential lease between the Chargers and the City of San Diego, but it does lay out a general lease framework favorable to the Chargers and not the City. See the figure on the left.
Additional operating, maintenance, and capital costs for the Stadium
In summary, the City of San Diego would be reimbursed by the Chargers for the costs, both related to the stadium and additional public services, directly attributable to professional football events. The Chargers would cover operations and maintenance overruns on the stadium portion of the facility, but only after the City utilizes all revenue from other non-football events in the stadium first for operations and maintenance. The lease revenue would essentially cover city-related expenditures, and the City of San Diego earns no margins. Lease Payment by Lessee
Reasonable costs incurred by the City providing public safety and traffic management services for Stadium football events
Possessory interest taxes levied on the Stadium leasehold interest and other generally applicable City taxes or fees applicable to the Stadium
This lease framework is different from what the voters approved with the Padres at Petco Park in the Memorandum of Understanding that was a component of Proposition C in 1998. Key city protections at the time included the following: • The Padres guaranteed $300 million of private investment for redevelopment; • The Padres guaranteed rent that would be adjusted annually for CPI; • The Padres assumed responsibility for capital improvements, including an annual $250,000 contribution to the City’s park capital improvements fund; • The City of San Diego’s costs for operating expenses were capped with CPI adjustments; and • The City of San Diego’s land and infrastructure expenses were capped. The City of San Diego and the Padres also share ownership of Petco Park and certain revenue streams. In May 2012, the San Diego City Council approved a change from a 70/30 City/ Padres split of non-baseball revenue to a 30/70 share to incentivize the Padres to run more non-baseball events. That has resulted in a significant increase in the City’s non-baseball revenue to the city, almost three-times the guaranteed minimum from the Padres. Figure 1: Lease Components in Proposal (Source: SDCTA In the Chargers proposal, there is no explicit revenue sharing Analysis) Page 10 of 36
707 Broadway, Suite 905, San Diego, CA 92101 P: (619) 234-6423 • F: (619) 234-7403 • www.sdcta.org
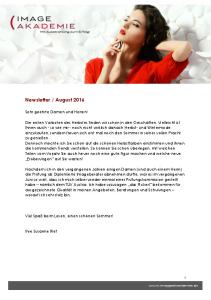
between the City of San Diego and the Chargers for non-football events in the stadium. In theory, the City would be able to keep all non-football stadium revenue to utilize how it sees fit, but the lease framework in the proposal first dedicates any non-football revenue earned by the City in the stadium to operations and maintenance before the Chargers’ lease would require their contribution to operations and maintenance. There is not a cap in operations and maintenance expenditure for either the City of San Diego or the Chargers. Potential Risks and Costs to the City of San Diego 1. Uncertainly in Costs of Integrated Convention Center/ Stadium Facility The Chargers explain that the cost of this proposed facility will be $1.8 billion in total. This is an estimate and not based on an actual architectural design. The proposal also outlines very discrete public fund allocations and amounts, even though more precise estimates remain unavailable. The figure below depicts how CCES funds must be utilized year-to-year:
Figure 2: CCES Fund Utilization in Proposal (Source: SDCTA Analysis)
Page 11 of 36
707 Broadway, Suite 905, San Diego, CA 92101 P: (619) 234-6423 • F: (619) 234-7403 • www.sdcta.org
Notable in this distribution of the CCES Fund are very specific dollar figures for the “Operating Reserve Subfund” (a $25 million maximum) and proportional distributions of remaining TOT if the stadium is completed of $10 million, $2 million, $15 million, and $2 million maxima to operations and maintenance of the convention center annex, CIP for the annex, operations and maintenance of the stadium, and CIP for the stadium, respectively. The basis of these figures is unclear when there is no specific architectural design associated with the proposal. 2. Moving the Metropolitan Transit System downtown bus yard The Metropolitan Transit System (MTS) currently operates a bus yard in the area where the proposed facility would be built, and MTS would have to be kept whole in any sale of its property. The movement of the MTS bus yard would likely cost approximately $70-$80 million, according to MTS CEO Paul Jablonski. To be kept whole, MTS would need to purchase new land and construct replacement repair and fueling facilities for its buses. City of San Diego citizens who utilize routes serviced by buses originating from this bus yard would also experience an increase in fares. According to the MTS, the annual cost of increasing one bus route by five minutes is approximately $1 million. The movement of the bus yard would lengthen numerous routes going into and out of downtown, and MTS would subsequently have to increase fares to account for the additional operational expense. 3. Continued Debt Service on Qualcomm Stadium The City of San Diego has approximately $50 million in outstanding debt from the renovation of Qualcomm Stadium in 1997. The approximate $4.9 million in annual debt service will continue for another 10 years through FY2026 and is not covered by the Chargers ballot measure. The Chargers lease agreement allows for early termination of the lease, and should they exercise that option, the City of San Diego has significant debt liability that would not be covered by the exit fee required of the Chargers.
Page 12 of 36
707 Broadway, Suite 905, San Diego, CA 92101 P: (619) 234-6423 • F: (619) 234-7403 • www.sdcta.org
4. Deferred Maintenance and Anticipated Operating Costs on Qualcomm Stadium Qualcomm Stadium has approximately $80 million worth of deferred maintenance. This is based on AECOM’s Facility Condition Assessment Report from 2011. The Chargers frequently cite the condition of Qualcomm Stadium as a reason a new stadium is necessary. This proposal raises the issue of what to do with Qualcomm Stadium. The City of San Diego anticipates that, without including debt (see #3 above), financing the capital improvements of approximately $80 million plus annual operating costs of approximately $12.8 million annually (FY2016 figure) will cost the City $240 million over the next twenty years (also assumes 2% year-over-year increases in operating support). When debt is included, that figure rises to $259 million. 5. Lease Terms and Debt Maturity The proposal authorizes the City of San Diego to issue bonds with maturity of 40 years. Simultaneously, the lease framework requires the Chargers’ lease to be at least 30 years. The proposal does not require that the length of the lease match the expected maturity of the debt. If managed poorly in negotiations, the City of San Diego could be in a similar situation with Qualcomm Stadium where there is a very real possibility of continued debt service with no marquee tenant for the facility.
Page 13 of 36
707 Broadway, Suite 905, San Diego, CA 92101 P: (619) 234-6423 • F: (619) 234-7403 • www.sdcta.org
6. Independent Taxpayer Oversight The Chargers measure contains no provisions for independent oversight. The “Independent Review Panel” in the proposal arbitrates disagreements between the City of San Diego and the Chargers on cost allocations. Other Analyses Conducted on the Measure Two other recent studies of the measure highlight multiple risks to taxpayers. An independent analysis of the Chargers measure paid for by the City of San Diego and conducted by Public Resources Advisory Group (PRAG) assesses that the true cost of the public’s share project would be at least $2.3 billion when interest on the bonds over 30 years is included. The analyses states that “...to the best of [their] knowledge, there have not been any billion-dollar TOT-backed revenue bond transactions, and a transaction of this size may well carry a size penalty.” The analysis also states that “[a] t this time, [they] believe that it is not possible for the City to know if the projected revenue stream would be sufficient to meet Overall Coverage,” which is based on the sensitivity analyses PRAG conducted on the financing. Finally, a separate study commissioned by the SDTMD says “the Convention Center annex the Chargers are proposing would generate $2.3 million more a year in additional hotel tax revenue, compared to $67 million in annual public costs.” The report completed by HVS Convention, Sports & Entertainment Facilities Consulting also indicates “the joint use of football stadiums and convention centers has been tried and largely failed in three cities - St. Louis, Indianapolis and Atlanta.” As of the writing of this analysis and despite a formal request from SDCTA, the Chargers have not shared with SDCTA the data or studies they have commissioned. Overall Fiscal Impact as Assessed Independently by SDCTA Even with optimistic assumptions and ignoring the costs to taxpayers of moving the MTS bus yard and the remaining debt on Qualcomm Stadium, the City of San Diego would not bring in adequate revenue to cover the anticipated costs associated with this proposal. • •
Optimistic calculations of non-football stadium revenue over 30 years: $281 million Optimistic TOT revenue for CCES Fund: o From increase in hotel stays due to convention center annex using Chargers’ publicly-stated assumptions: $71 million
Page 14 of 36
707 Broadway, Suite 905, San Diego, CA 92101 P: (619) 234-6423 • F: (619) 234-7403 • www.sdcta.org
• • • •
o From increase in hotel stays due to completing filling stadium from out of town visitors and assumption of 25% of current attendees from out of town: $152 million Total CCES Fund available of $504 million. Add removal of operating costs of Qualcomm Stadium: $240 million. Total overall of $744 million. Remaining shortfall of $406 million. This figure does NOT account for the additional interest that would need to paid on public debt.
The Chargers proposal would put the City of San Diego’s General Fund at significant risk. Proponents: ● ● ● ● ●
Chargers San Diego Regional Chamber of Commerce US Representative Scott Peters Building Trades Council San Diego Stadium Coalition
Proponent Arguments: a new downtown stadium would be a driver of economic activity and enhance downtown. Opponents: ● “No Downtown Stadium – Jobs and Streets First” Coalition o San Diego City Councilmember David Alvarez o San Diego City Councilmember Christopher Cate ● San Diego Tourism Authority Opponent Arguments: San Diego should not raise taxes to subsidize a billion-dollar corporation; increases to the hotel tax should be utilized for critical city services, like streets repairs and infrastructure improvements.
Page 15 of 36
707 Broadway, Suite 905, San Diego, CA 92101 P: (619) 234-6423 • F: (619) 234-7403 • www.sdcta.org
Other Sources Consulted: “2015 San Diego Chargers Media Guide.” Chargers. http://www.chargers.com/sites/chargers.com/files/embedded-files/chargers-mediaguide-2015_0.pdf. “A Closer Look at Stadium Subsidies.” AEI. https://www.aei.org/publication/a-closer-look-at-stadium-subsidies/. “Analysis of the Economic and Fiscal Impacts Generated By The Development of Petco Park.” Economic Impact Report. Convention Sports and Leisure International, July 14, 2010. http://www.sandiegobusiness.org/sites/default/files/PETCO%20Final%20Report%20(7.14.10).pdf. “Analysis of City’s Operating, Maintenance and Capital Costs at Qualcomm Stadium.” City of San Diego, August 7, 2015. http://www.voiceofsandiego.org/wp-content/uploads/2015/08/qualcommstadiumlosses.pdf. Baade, R. A., R. W. Baumann, and V. A. Matheson. “Assessing the Economic Impact of College Football Games on Local Economies.” Journal of Sports Economics 9, no. 6 (May 12, 2008): 628–43. doi:10.1177/1527002508318363. “Balboa Stadium.” Wikipedia, the Free Encyclopedia, July 15, 2016. https://en.wikipedia.org/w/index.php?title=Balboa_Stadium&oldid=729926516. “Balboa Stadium - History, Photos & More of the Former Home of the San Diego Chargers NFL Stadium.” http://www.stadiumsofprofootball.com/past/BalboaStadium.htm. Brown, Eliot. “Use of Taxpayer Money for Pro-Sports Arenas Draws Fresh Scrutiny.” Wall Street Journal, March 8, 2015. http://www.wsj.com/articles/use-of-taxpayer-money-for-pro-sports-arenas-draws-fresh-scrutiny-1425856677. Boo, Soyoung, and Miyoung Kim. “The Influence of Convention Center Performance on Hotel Room Nights.” Journal of Travel Research 49, no. 3 (August 1, 2010): 297–309. doi:10.1177/0047287509346855. Chapin, Tim. “Beyond the Entrepreneurial City: Municipal Capitalism in San Diego.” Journal of Urban Affairs 24, no. 5 (January 1, 2002): 565–81. doi:10.1111/1467-9906.00144. Coates, Dennis, Brad R. Humphreys October 27, and 2004. “Caught Stealing: Debunking the Economic Case for D.C. Baseball.” Cato Institute, October 27, 2004. http://www.cato.org/publications/briefing-paper/caught-stealing-debunking-economic-case-dcbaseball. “Convention Center Performance Review: Meetings & Conventions.” http://www.meetingsconventions.com/News/Features/Convention-Center-Performance-Review/. “The City of San Diego Memorandum: Citizens’ Stadium Advisory Group Frequently Asked Questions.” City of San Diego. https://www.sandiego.gov/sites/default/files/legacy/real-estate-assets/pdf/stadium/csagfaq.pdf. Crompton, J. L. “Economic Impact Studies: Instruments for Political Shenanigans?” Journal of Travel Research 45, no. 1 (August 1, 2006): 67– 82. doi:10.1177/0047287506288870. Cubbison, Gene. “Conv. Center Bid, Bolts Stadium Linked by Legalities.” NBC 7 San Diego. http://www.nbcsandiego.com/news/local/Convention-Center-Expansion-Bid-Bolts-Stadium-Linked-by-Legalities196224371.html. Cubbison, Gene. “State of City in Disrepair: Fit to Finance a Stadium?” NBC 7 San Diego, Feburary 26, 2015. http://www.nbcsandiego.com/news/local/State-of-City-in-Disrepair-Fit-to-Finance-a-Chargers-Stadium-288487261.html. Davila, Antonio, George Foster, and David Hoyt. “San Diego Padres: PETCO Park as a Catalyst for Urban Redevelopment.” Stanford Graduate School of Business, 2008. https://www.gsb.stanford.edu/faculty-research/case-studies/san-diego-padres-petco-parkcatalyst-urban-redevelopment. “Decoding Convention Center Occupancy | Ungerboeck Software.” Ungerboeck Software. https://ungerboeck.com/blog/decodingconvention-center-occupancy. DeMause, Neil. “Do Cities Gain From Subsidizing Sports Teams?” News. Al-Jazerra, August 21, 2013. http://america.aljazeera.com/articles/2013/8/21/pay-to-play.html. DeMause, Neil. “New Book by Harvard Prof Details $10b in Hidden Stadium and Arena Subsidies.” Field of Schemes, November 7, 2012. http://www.fieldofschemes.com/2012/11/07/4083/new-book-by-harvard-prof-details-10b-in-hidden-stadium-and-arenasubsidies/. Dillon, Liam. “The Chargers’ Shaky Stadium Estimate - Voice of San Diego.” Voice of San Diego, February 8, 2010. http://www.voiceofsandiego.org/all-narratives/chargers-stadium/the-chargers-shaky-stadium-estimate/. Dillon, Liam. “What’s Broken at Qualcomm Stadium.” Voice of San Diego, March 12, 2015. http://www.voiceofsandiego.org/topics/landuse/whats-broken-at-qualcomm-stadium/. Dillon, Liam. “Without the Chargers, Qualcomm Stadium Will Still Be a Money Pit.” Voice of San Diego, January 11, 2016. http://www.voiceofsandiego.org/topics/government/without-the-chargers-qualcomm-stadium-will-still-be-a-money-pit/. Dillon, Liam. “Fact Check: The City Pays the Chargers to Play at Qualcomm Stadium - Voice of San Diego.” Voice of San Diego, February 20, 2015. http://www.voiceofsandiego.org/all-narratives/fact/fact-check-city-pays-chargers-play-qualcomm-stadium/. Dillon, Liam. “No, a New Chargers Stadium Won’t Be Good for the Economy.” Voice of San Diego, July 15, 2015. http://www.voiceofsandiego.org/topics/economy/no-a-new-stadium-isnt-good-for-the-economy/. Dillon, Liam. “The City’s 3 Biggest Chargers Follies.” Voice of San Diego, April 17, 2016. http://www.voiceofsandiego.org/topics/government/the-citys-3-biggest-chargers-follies/. Doig, Will. “Urban Entertainment Districts: Blocks Where No One Has Fun - Salon.com.” Salon, May 19, 2012. http://www.salon.com/2012/05/19/urban_entertainment_districts_blocks_where_no_one_has_fun/. Donohue, Andrew. “Mayor: Free Chargers from Lease - Voice of San Diego.” Voice of San Diego, April 22, 2016. http://www.voiceofsandiego.org/topics/government/mayor-free-chargers-from-lease/. “Economic Expert Weighs In On Chargers Stadium Issue | NBC 7 San Diego.” NBC 7 San Diego. http://www.nbcsandiego.com/news/local/Economic-Expert-Weighs-In-On-Chargers-Stadium-Issue-292121501.html.
Page 16 of 36
707 Broadway, Suite 905, San Diego, CA 92101 P: (619) 234-6423 • F: (619) 234-7403 • www.sdcta.org Edelman, Mark. “Sports and The City: How to Curb the Professional Sports Teams’ Demands for Free Public Stadiums.” Rutgers Journal of Law and Public Policy 6, no. 1 (Fall 2008). http://www.rutgerspolicyjournal.org/sites/rutgerspolicyjournal.org/files/issues/6_1/6-1_Edelman.pdf. Erie, Steven P., Vladimir Kogan, and Scott A. MacKenzie. “Redevelopment, San Diego Style: The Limits of Public—Private Partnerships.” Urban Affairs Review 45, no. 5 (May 1, 2010): 644–78. doi:10.1177/1078087409359760. Fenich, George G. “Convention Center Development: Pros, Cons and Unanswered Questions.” International Journal of Hospitality Management 11, no. 3 (August 1, 1992): 183–96. doi:10.1016/0278-4319(92)90017-P. Fenich, George. “Convention Center Operating Characteristics.” Journal of Convention & Exhibition Management 1, no. 2–3 (June 1, 1999): 1– 25. doi:10.1300/J143v01n02_01. “FY15 Annual Report.” San Diego Convention Center Corporation. https://www.visitsandiego.com/sites/default/files/basic/SDCCC_AR-FY15.pdf. “Fiscal Year 2017-2021 Five-Year Capital Infrastructure Planning Outlook.” City of San Diego, December 7, 2015. https://www.sandiego.gov/sites/default/files/five-year_capital_infrastructure_planning_outlook.pdf. “Fiscal Year 2017-2021 Five-Year Financial Outlook.” City of San Diego, November 13, 2015. https://www.sandiego.gov/sites/default/files/legacy/fm/pdf/fy17_5year.pdf. Garcia, Alexis. “Sports Stadiums Are Bad Public Investments. So Why Are Cities Still Paying for Them?” Reason.com, March 17, 2015. http://reason.com/reasontv/2015/03/17/sports-stadiums-are-bad-public-investmen. Hitchcock, Mark. “Welcome to PETCO Park: Home of Your Enron By The Sea Padres.” University of California, Berkeley Law School. https://www.law.berkeley.edu/sugarman/PETCO_Park_and_the_Padres_____Mark_Hitchcock.pdf. Jeong, J. Y., J. L. Crompton, and R. M. Dudensing. “The Potential Influence of Researchers’ ‘Hidden’ Procedure Decisions on Estimates of Visitor Spending and Economic Impact.” Journal of Travel Research, September 27, 2015. doi:10.1177/0047287515605932. Lloyd, Jonathan. “Play-By-Play Timeline of Events.” NBC 7 San Diego, November 11, 2015. http://www.nbcsandiego.com/news/local/San-Diego-Stadium-Replacing-the-Q-Play-By-Play-Timeline-of-Events292958341.html. Lewis, Scott. “Mayor Mum, Conservatives, Hotel Industry Bash Chargers Measure.” Voice of San Diego, May 6, 2016. http://www.voiceofsandiego.org/topics/land-use/mayor-mum-but-san-diegos-conservatives-are-blasting-downtown-stadiumplans/. “Mayor Set to Negotiate Stadium Plan with Chargers.” Fox 5 San Diego, May 27, 2015. http://fox5sandiego.com/2015/05/27/mayor-setto-negotiate-stadium-plan-with-chargers/. McSwain, Dan. “Chargers Wrote This Stadium Plan, and It Shows.” The San Diego Union-Tribune. April 2016. http://www.sandiegouniontribune.com/news/2016/apr/03/chargers-stadium-downtown-tax-hike-initiative/. McSwain, Dan. “Chargers Worth $1.5B as Profit Soars.” The San Diego Union-Tribune, September 14, 2015. http://www.sandiegouniontribune.com/news/2015/sep/14/chargers-value-nfl-profit-soars-stadium/. Mecija, Melissa. “Economist Says Stadium Adds Little Value to Cities - 10News.com KGTV ABC10 San Diego.” 10News. http://www.10news.com/news/economist-says-stadium-adds-little-value-to-cities. Owen, Jeffrey. “The Intangible Benefits of Sports Teams.” Public Finance and Management 6, no. 3 (2006): 321–45. “Panama–California Exposition.” Wikipedia, the Free Encyclopedia, March 10, 2016. https://en.wikipedia.org/w/index.php?title=Panama%E2%80%93California_Exposition&oldid=709397802. “San Diego Chargers.” Wikipedia, the Free Encyclopedia, July 28, 2016. https://en.wikipedia.org/w/index.php?title=San_Diego_Chargers&oldid=731993743. “San Diego Chargers on the Forbes NFL Team Valuations List.” http://www.forbes.com/teams/san-diego-chargers/. “San Diego Regional Construction Procurement Committee - Top 4 Issues.” City of San Diego, July 8, 2014. https://www.sandiego.gov/sites/default/files/legacy/cip/pdf/reports/2014-07-08_top-4-issues.pdf. The San Diego Union-Tribune Editorial Board. “Five Years, $130M to Relocate East Village Bus Yard. At Least.” The San Diego UnionTribune. Jan 2016. http://www.sandiegouniontribune.com/news/2016/jan/13/chargers-stadium-downtown-bus-yardrelocate/. Sanders, H. T. “Convention Myths and Markets: A Critical Review of Convention Center Feasibility Studies.” Economic Development Quarterly 16, no. 3 (August 1, 2002): 195–210. doi:10.1177/08942402016003001. Sherman, Office of Councilmember Scott. “Citizen’s Initiative Whitepaper.” Voice of San Diego. http://www.voiceofsandiego.org/wpcontent/uploads/2016/05/Citizens-Initiative-White-Paper.pdf. Showley, Roger. “East Villagers Tweak Non-Stadium Plan.” The San Diego Union-Tribune, April 2, 2016. http://www.sandiegouniontribune.com/news/2016/apr/01/stadium-alternative-east-village/. Showley, Roger. “Does a New Stadium Make Economic Sense? | SanDiegoUnionTribune.com.” The San Diego Union-Tribune, February 20, 2015. http://www.sandiegouniontribune.com/news/2015/feb/20/econometer-stadium-economics/. Siegfried, John, and Andrew Zimbalist. “The Economics of Sports Facilities and Their Communities.” The Journal of Economic Perspectives 14, no. 3 (Summer 2000): 95–114. Smith, Darren. “Fred Maas on Chargers Initiative, Taxes, Roof, Parking, JMI & Why It’s Great for San Diego.” http://www.mighty1090.com/episode/fred-maas-on-chargers-initiative-taxes-roof-parking-jmi-why-its-great-for-san-diego/. Smith, Darren. “Scott Lewis on Chargers Stadium Proposal, Opponents & Biggest Questions on Project.” http://www.mighty1090.com/episode/scott-lewis-on-chargers-stadium-proposal-opponents-biggest-questions-on-project/. “Stadium Financing Options In Other Cities/States.” City of San Diego. https://www.sandiego.gov/sites/default/files/legacy/real-estateassets/pdf/stadium/stadiumfinancingoptions.pdf. “Space Available: The Realities of Convention Centers as Economic Development Strategy.” The Brookings Institution, January 2005. http://www.brookings.edu/~/media/research/files/reports/2005/1/01cities%20sanders/20050117_conventioncenters.pdf.
Page 17 of 36
707 Broadway, Suite 905, San Diego, CA 92101 P: (619) 234-6423 • F: (619) 234-7403 • www.sdcta.org Viton, Philip. “Major League Sports Stadiums and Economic Development.” presented at the CRP 4110 - Sports Stadiums, The Ohio State University, April 22, 2015. http://facweb.knowlton.ohio-state.edu/pviton/courses2/crp4110/stadiums.pdf. Waldron, Pat Garofalo and Travis. “If You Build It, They Might Not Come: The Risky Economics of Sports Stadiums.” The Atlantic, September 7, 2012. http://www.theatlantic.com/business/archive/2012/09/if-you-build-it-they-might-not-come-the-riskyeconomics-of-sports-stadiums/260900/. Wassmer, R. W., R. S. Ong, and G. Propheter. “Suggestions for the Needed Standardization of Determining the Local Economic Impact of Professional Sports.” Economic Development Quarterly, March 9, 2016. doi:10.1177/0891242416636685. Young, Joe, and Dave Summers. “Officials Approve Plan to Expand SD Convention Center.” NBC 7 San Diego. http://www.nbcsandiego.com/news/local/California-Coastal-Commission-Approves-SD-Convention-Center-Expansion227306631.html. Zaretsky, Adam. “Should Cities Pay for Sports Facilities?” Government. Federal Reserve Bank of St. Louis. https://www.stlouisfed.org/Publications/Regional-Economist/April-2001/Should-Cities-Pay-for-Sports-Facilities.
Page 18 of 36
707 Broadway, Suite 905, San Diego, CA 92101 P: (619) 234-6423 • F: (619) 234-7403 • www.sdcta.org
Appendix A: History of SDCTA on Convention Centers, Professional Sports, and the Tourism Marketing District in San Diego The San Diego County Taxpayers Association has weighed in on myriad proposals over the past 50 years to the City of San Diego and its citizens pertaining to the construction and expansion of professional sports facilities, convention centers, and the now-existing Tourism Marketing District. These proposals have varied significantly in purpose, design, and expense to the taxpayer. Original Construction of Qualcomm Stadium (originally San Diego Stadium, later Jack Murphy Stadium) Year: 1965 Total Cost: $27.75 million ($197 million in 2016 dollars) Public Contribution: $27.75 million (100%) Private Contribution: none Financing Mechanism: Lease-revenue and equity bonds amortized over 35 years Financing Plan Components: • Sales tax revenues allocated to the City’s Capital Outlay Fund • Sale of 20 acres of land in the Midway area to the State for the I-5 - I-8 interchange for a price of $1,350,000 • Revenue from the Breitbard Arena and commercial area lease (Sports Arena in Midway); estimated at the time at $189,000 annually • Lease of other city owned lands in Midway $265,000 • Stadium operating income, estimated at the time at $149,000 (without baseball) and $340,600 (with baseball) Position: Support Rationale: In conjunction with the proposal, a management consulting firm called Western Management Consultants performed an economic impact study that estimated an annual benefit of at least $25,000,000 to the City’s economic base with the Stadium creating 1,500 new jobs. The SDCTA found these results persuasive and supported the proposal on that basis. Amplifying Context: San Diego Stadium was built in part of the first wave of publicly financed sports facility construction. Prior to the 1950s, very few stadiums were financed with a majority of public funds. This changed as professional sports leagues grew steadily in stature and cities entered into the business of competing with one another to gain and retain sports franchises. Comparatively, however, these stadiums were less expensive than today’s much more technologically advanced, amenity rich projects. In the 1960s, the mean level of public Page 19 of 36
707 Broadway, Suite 905, San Diego, CA 92101 P: (619) 234-6423 • F: (619) 234-7403 • www.sdcta.org
contribution for public stadiums was $24.4 million, which would be less than $200 million in today’s dollars. In contrast, NFL stadiums built between 2006 and 2016 were built at an average cost to taxpayers of $336 million. In addition, San Diego Stadium was originally built to house both the San Diego Chargers and the San Diego Padres. Concerns over share of revenues would later lead to the teams seeking their own stadiums. Construction of Petco Park Year: 1998 Total Cost: $456.8 million ($285 million for ballpark construction, $171.8 million for land) Public Contribution: $303.8 million (66.5%) Private Contribution: $153 million (33.5%) Financing Mechanism: Lease-revenue and equity bonds under the Public Facilities Financing Authority, a joint powers authority between the City and CCDC Financing Plan Components: • $57.8 million from project-generated redevelopment funds • $21 million from San Diego Unified Port District • $153 million dollar initial contribution from the Padres • Padres to pay rent of $500,000 increased annually by CPI • Operations and maintenance paid for by the team and the City in partnership, proportional to percentage of ownership (70% City, 30% Padres) Position: Support Rationale: The SDCTA led a shadow taskforce called to study the issue and make recommendations during the negotiation process. Since the construction of San Diego Stadium, a significant amount of economic literature had been released that effectively proved that professional sports stadiums typically have little to no economic impact on a region. However, SDCTA was willing to support the project with the inclusion of certain caveats. SDCTA recommended that whatever deal the City struck should limit liability to the City and should strive to explicitly require that the project redevelop the area around it. SDCTA’s perspective at the time for supporting the project were as follows: • Supported building a ballpark-entertainment facility in the city’s downtown East Village within a newly formed ballpark district if a major portion of the development is publicly financed. • Believed the ballpark district should be formed and include only those areas with a clear nexus to the ballpark-entertainment facility and related development and that the district should not cross Harbor Drive. • Believed the Padres franchise must fill the “gap” between public and private financing of a ballpark, with a minimum Padres contribution of $100 million. Page 20 of 36
707 Broadway, Suite 905, San Diego, CA 92101 P: (619) 234-6423 • F: (619) 234-7403 • www.sdcta.org
• • • • • • • • •
•
Believed the Padres owners should operate and maintain the facility at their cost. Supported the CCDC in “packaging” the site and related infrastructure and issuing Redevelopment Area Tax Increment Bonds. Supported using the City of San Diego’s half-cent Transient Occupancy Tax revenues earmarked for a sports and entertainment center to finance a portion of the project. Supported property and TOT (hotel taxes) generated in the ballpark district being allocated for project financing Supported the City of San Diego dedicating sales tax revenues generated by the ballpark to the project’s financing. Supported a Ballpark Admissions Tax – if approved by two-thirds of the city’s voters – to be used for the project’s financing. Supported participation by the Port of San Diego in financing of ballpark and convention center (joint-use) parking facilities and other convention center-related infrastructure in or adjacent to the ballpark district. Opposed the use of future general fund revenue (except for the sports and entertainment center-designated half-cent TOT) for the ballpark-entertainment facility unless the revenue is actually generated within the ballpark district. The City should require a financial guarantee from the Padres (in addition to their financial contribution) to cover the city’s bond debt in case of revenue shortfalls to protect the city’s general fund. After the bonds are paid off, the Padres would pay an annual rent to be determined during contract negotiations. Advised that the City of San Diego be prepared to “walk away from the table” if the Padres do not agree to a revenue shortfall guarantee, based upon the principle that the party that stands to earn the entrepreneurial benefit should bear the entrepreneurial risk.
Many of these suggestions were incorporated into the final deal. All transient occupancy taxes and year over year property tax increments generated within the ballpark district were allocated toward the ballpark, creating a built-in funding mechanism to support the stadium’s construction. In addition, the Padres were required to play in the park for the length of the amortization period of the financing agreement utilized to build the park (provided the City does not refinance) or 30 years, whichever period is shorter. Amplifying Context: The legacy of the Petco Park deal is mixed. As many analysts have observed, the ballpark seems to have had an appreciable effect in reducing blight in the East Village area. Economic impact studies have noted positive impacts to the real estate market in the Ballpark district resulting from the stadium, as well as increased sales tax and transient occupancy tax revenues. The park, however, has not had a significant impact on job creation downtown, and it remains an expensive liability on the City’s balance sheet. This liability became particularly noticeable during the course of the City’s pension crisis. According to the FY 2016 Adopted Budget, the ballpark itself made $1.9 million in all non-tax revenue, Page 21 of 36
707 Broadway, Suite 905, San Diego, CA 92101 P: (619) 234-6423 • F: (619) 234-7403 • www.sdcta.org
versus $16.3 million in total expenses (including debt service and operations and maintenance). This means that the City paid $14.4 million out of the General Fund in FY 2016 toward all stadium related expenses. In 2012, the City Council voted to approve a change in the revenue sharing agreement for non-baseball events from 70% City and 30% Padres to 70% Padres and 30% City, in an effort to incentivize the Padres to more actively pursue special events. This arrangement was done in exchange for the Padres agreeing to make an average of $1 million dollars in capital improvements to the park each year rather than depositing $250,000 annually into the Ballpark Capital Expenditure Reserve Fund as specified in the original deal, as well as agreeing to increase the guaranteed minimum revenue from non-baseball events from $250,000 to $300,000. Qualcomm Stadium Expansion and Renovation Year: 1997 Total Cost: $68 million Public Contribution: $68 million Private Contribution: $17 million from Qualcomm for naming rights, which end in 2017 Financing Mechanism: Lease-revenue and equity bonds Financing Plan Components: • Backed by the general fund via projected increases in transient occupancy tax revenue • Rent renegotiations increased rent paid by Chargers, with caveats (more below) Position: Support Rationale: In its analysis of this issue, the SDCTA saw this as an issue of regular maintenance on a city owned asset. Analysis by the Association noted that the City had already paid the expense of building the stadium and reasoned that it was incumbent on the City to maintain it as a viable money making asset so long as debt service was still being paid on the structure. Because the Chargers were not constrained with a relocation guarantee, expanding the stadium to retain the team with certain guarantees in place seemed a viable alternative to building a new stadium. Amplifying Notes: SDCTA did note a potential negative outcome from one of the provisions of the expansion agreement: the ticket guarantee. In response to increased rent resulting from the expansion agreement, the Chargers required that the City guarantee that regular season games have an attendance of at least 60,000. If they did not, the City would be obliged to cover the difference in cost. In the proceeding years, average game attendance routinely fell beneath the 60,000 threshold, resulting to greater costs to the City than initially projected. While this ticket guarantee was ultimately phased out, other conditions included in Page 22 of 36
707 Broadway, Suite 905, San Diego, CA 92101 P: (619) 234-6423 • F: (619) 234-7403 • www.sdcta.org
the lease, such as the requirement that the City maintain a “state of the art” stadium, gave the team significant leverage in future negotiations pertaining to the stadium. San Diego Waterfront Convention Center The San Diego Convention Center is owned by the Port of San Diego. It was originally constructed in 1987; broke ground in 1985; accepted its first contract in 1988; opened its doors in 1989; and helped finance its expansion in 2001. The current San Diego Convention Center is 2,618,190 gross square feet. Year: 1983 (Opened November 1989) Total Cost: $ 164 million ($393 million in 2016 dollars) Public Contribution: $165 million (100%) (From the Port cash reserves) Private Contribution: none Financing Mechanism: Lease revenue bonds Financing Plan Components: • The financing plan was broken down into two phases: 1) Center redevelopment and issuance of lease revenue bonds by the Redevelopment Agency and 2) Center operations and commencement of lease payments • Financed by Port District, not the Centre City Development Corporation (CCDC) • A $117 million dollar contract was awarded to Tutor Saliba and Perini Corporation of Los Angeles by the San Diego Port Commission in 1987 • The San Diego Convention Center Corporation (quasi-public corporation) was placed in charge of facility operations by City Council. Position: Support (Prop A, 1983) Rationale: Going back at least to the 1970s, the SDCTA was a strong advocate for downtown redevelopment. Archival records note SDCTA concerns that the 92101 zip code (downtown) paid less than the City average in property tax increment per capita. SDCTA at the time observed that this could be construed to mean that the area did not “pay its own way” by equally sharing the cost of vital city services. The SDCTA viewed it as crucial to the development of the City that the Downtown region be recreated as an economic engine. To this end, SDCTA was supportive of the creation of the Centre City Redevelopment Corporation. Amplifying Context: More than 250,000 out-of-town delegates attended 49 shows and conventions in the first year of operations, spending $226 million and generating approximately $1.1 billion impact on the local economy. SDCTA assessed at the time that construction of the expanded Convention Center, which would be paid by visitors through hotel taxes known as the Transient Occupancy Tax and Page 23 of 36
707 Broadway, Suite 905, San Diego, CA 92101 P: (619) 234-6423 • F: (619) 234-7403 • www.sdcta.org
not local taxpayers, would generate $920 million a year to the local economy. It also would create 700 construction and 4,000 permanent local jobs. San Diego Waterfront Convention Center Expansion (Phase II) Year: 1998 (completed in 2001) Total Cost: $216 million for Convention Center Expansion. The budget was estimated to be $520 million. Public Contribution: $332 million (District Bonds) and $198 million (Lease Bonds) Financing Mechanism: Lease Revenue bonds and District Revenue Bonds Financing Plan Components: • Convention Center Facilities District would contribute an estimated $35.7 million (annually). • The Port of San Diego would contribute $3 million (annually). • Incremental TOT revenue anticipated to account for $3.5 million. • Yearly bond payment as a result of the expansion was $13.7 million. The City of San Diego pays $9.2 million (67%) and the Port of San Diego pays $4.5 million (33%). • Monthly projected TOT impact is $12.7 million (an IBA estimated between $5.2 million and $9.7 million. • The budget for the Expansion Project was estimated at $520 million. It is estimated approximately $33 million to $42 million is needed annually to pay for the debt service associated with the Expansion Project. • The original proposal estimated construction costs associated with the project to be $752.7 million, which included construction costs ($710.8 million) and costs to construct a pedestrian bridge ($41.9 million). Position: Support on the condition the CCFD is found legal through a validation action and the TMD covers all charges in excess of the City’s $3.5 million share. Rationale: Citing the economic benefit of almost doubling the size of the bayside facility, SDCTA assessed the project was essential to the San Diego region. Numerous analyses have stated the proposed Convention Center Expansion Project would generate additional transient occupancy tax revenues that would be more than sufficient to cover the costs associated with constructing the project. Amplifying Context: The expansion project had a statistically significant impact on property value. Starting in 2001, there was a dramatic increase in property value; however, this did not affect San Diego’s bottom line because all of the new property tax increments flowed into CCDC-controlled redevelopment accounts rather than the city’s general fund, from which it has had to make bond payments. As a result, nearly all the funds collected by the increase were spent on brick-and-mortar projects for the downtown area. Page 24 of 36
707 Broadway, Suite 905, San Diego, CA 92101 P: (619) 234-6423 • F: (619) 234-7403 • www.sdcta.org
According to studies commissioned by Port District staff on the economic impact of the Expansion Project and the proposed expansion of Hilton San Diego Bayfront Hotel on Port District revenues, the new net revenues are expected to range from approximately $3.5 million to $6.2 million annually beginning in 2018. According to a study conducted by Economic & Planning Systems, if both the Expansion Project and the Hilton Project are completed and open in 2018, new annual revenues could amount to $6.2 million. If the Hilton Project is not built simultaneously, the Port could receive between $4 and $5 million a year starting in 2018. What remains unclear though is the legality of the proposed taxing structure of the hotels within the City, which would provide a bulk of the financing associated with the Expansion Project. The City Attorney is scheduled to submit a validation action to determine if the financing plan is legal and can move forward. As well, the legality of extending the life of the Tourism Market District is in question, and with that, a potential cap on the City’s proposed $3.5 million payment towards construction. If these two factors are determined to be legal and move forward, the City’s $3.5 million investment towards construction of the Expansion Project would result in a significant return on investment, as demonstrated by the numerous studies that have been produced thus far. If these two plans fall through, the City should not continue unless the exposure is capped at an amount that would result in a positive return in TOT revenues. San Diego Tourism Marketing District Renewal Year: 2012 Description: a 39.5 year extension to the 2% self-assessment of hotel operators above the 10.5% TOT to fund the marketing of San Diego. Position: Support Rationale: Based on SDCTA’s previous support for the initial TMD program as well as the TMD’s documented success in delivering a return on investment from assessment revenues, SDCTA supported the proposed management plan and 39 1⁄2 year extension of the TMD program within the City of San Diego. SDCTA assessed the taxpayer made a 19.5:1 return on investment, and TMD alleviated $52 million in general fund expenditures.
Page 25 of 36
707 Broadway, Suite 905, San Diego, CA 92101 P: (619) 234-6423 • F: (619) 234-7403 • www.sdcta.org
Appendix B: Literature Review Summary of Findings: 1. General consensus in economic literature is that stadium projects do not provide significant economic impacts due to substitution effects. Essentially most households have a predefined limit on the amount they can spend for leisure, which they will spend on something whether there is a stadium or not. Therefore, stadiums only create extra revenue insofar as they bring in new visitors who would not have come if not for the stadium. Any positive economic impact is mitigated by opportunity cost at multiple different levels. First, stadiums are not consistent employers because they are not consistently occupied. Other commercial uses would have greater usage frequency and intensity. In addition, much of the revenue garnered from sports team operations go toward individuals such as athletes and executives, and preferred vendors who are not local to the area in which the stadium is built. Ripple effects benefiting local businesses often touted by stadium boosters must also be looked upon with scrutiny. It must be remembered that any businesses that spring up near the park in order to benefit from residual foot traffic will also have to contend with off season lull periods. 2. What information exists seems to indicate that the economic impact of convention centers is potentially overestimated. The rush of American cities to construct convention centers in the 1990s due to their perception as reliable economic engines has resulted in a glut of rentable convention space. This means that convention hosting cities are locked in a cycle of increasing amenities to compete for a pot that has not grown at the same rate. However, some studies do find positive economic impacts and see a positive correlation between convention space and hotel room nights. Stadiums: Rutgers Journal of Law & Public Policy - VOLUME 6 FALL 2008 ISSUE 1 - SPORTS AND THE CITY: HOW TO CURB PROFESSIONAL SPORTS TEAMS’ DEMANDS FOR FREE PUBLIC STADIUMS -- Marc Edelman http://www.rutgerspolicyjournal.org/sites/rutgerspolicyjournal.org/files/issues/6_1/61_Edelman.pdf Summary: The most pervasive complaint when entering into a partnership with a new sports team has been that owners pay generally thirty percent of stadium construction costs, yet are entitled to one hundred percent of stadium revenues. Since the 1970s, most local communities have paid between seventy percent and eighty percent of new stadium building costs. This started with MLB, but spread to teams in the National Football League (“NFL”), National Basketball Association (“NBA”) and National Hockey League (“NHL”). Many local communities continue to enter into these inequitable “partnerships” due to the monopoly power professional league sports have over the number of franchises in their sport, causing local communities to pay even more to keep their sports team. The excessive bargaining power of sports team allow the sports team to switch host communities at will
Page 26 of 36
707 Broadway, Suite 905, San Diego, CA 92101 P: (619) 234-6423 • F: (619) 234-7403 • www.sdcta.org
as well as the clout to credibly threaten to switch host cities if a current host fails to meet the team’s subsidy demand. Subsidized sports stadiums have gone from being an exception in the world of professional sports to something far closer to the rule. Moreover, sports team’s stadium demands continue to rise, including more stadiums and the right to keep sports facilities’ non-sports related revenues. Despite this trend, most professional team owners do not need government aid to profit due to high rate of return on team’s resale, stadium naming rights and personal seat license. 1. There are 4 types of recent proposals to curb stadium subsidies and teams’ excessive bargaining power a. Enforcing state lending of credit and public purpose doctrines; 1. Oldest and most conservative way to address the problem of business demands for public spending. 2. Lending-of-credit doctrines arise from state enactments that prohibit state and local governments from lending credit to private enterprises 3. Although the language of lending-of-credit doctrines seems on its face to prohibit publicly subsidizing professional sports facilities, courts have repeatedly found ways to avoid applying these doctrines in that context by b. Ordering league expansion; or using federal antitrust law to order the four premier sports leagues to expand their total number of teams. 1. This approach would lead to an increased supply of sports teams per league, thus better balancing team supply with community demand resulting in an end to the team’s ability to credibly threaten to relocate provided the other host communities continue to deny subsidies. However, the reviewing courts ultimately ruled in favor of the NFL teams, holding that “a professional sport league’s refusal to accept for membership a qualified applicant for a franchise in an area where no current league team is located” does not violate either Section 1 or Section 2 of the Sherman Act. c. Requiring breakup of the big leagues (divestitures); 1. By breaking up the big leagues, economic incentives for teams and leagues would change so that sports leagues would have the enticement to expand as quickly as possible to maximize league revenues, rather than keep potential host cities on hold without a team. In other words a multiple league model, each league would expand into as many markets as could support a team, and each league would place more teams into the markets that could support multiple teams. Historically a multi-league model results in one league generally having a comparative advantage that drives others out of business. Moreover, a break up of the premier leagues would first require that the Department of Justice bring a monopolization charge against the four premier sports leagues. Then, a federal court would need to hold that the leagues violated antitrust laws, and order the violation remedied by separating MLB, the NBA, NFL and NHL into smaller, competitor leagues. d. Implementing congressional statutes. 1. Over the past fifteen years, two proposals that were intended to address sports leagues’ excessive bargaining power were New York Senator Daniel Patrick Moynihan’s 1996 Stop Tax-Exempt Arena Debt Issuance Act
Page 27 of 36
707 Broadway, Suite 905, San Diego, CA 92101 P: (619) 234-6423 • F: (619) 234-7403 • www.sdcta.org
(“STADIA”), and Pennsylvania Senator Arlen Specter’s 1999 Stadium Financing and Franchise Relocation Act (“SFFRA”). Neither of these two proposals, however, ever went to a congressional vote. In addition, even if passed, neither of these proposals would have fully resolved the problem of sports stadium subsidies due to secondary and tertiary effects that would have hurt other permanent public projects such as libraries or zoos. 2. Developing an appropriate bill to curb stadium subsidies a. A congressional bill that removes the Sports Broadcasting Act’s limited antitrust exemption from any league in which at least one of its teams accepts facility funding from a local municipality, but does not provide that municipality with a pro rata share of the facility’s revenues. Such a bill would ensure that no sports team is able to extort a free ride from its local community without explicitly prohibiting local communities from funding stadium projects. b. This could be the simple bill that prevents professional sports teams from accepting a greater share of facility revenues than they pay in construction costs serves as an important step toward curbing professional sports’ excessive bargaining power. Similarly, this bill would influence sports leagues to raise capital more efficiently, and would allow communities to focus their tax spending on true public welfare projects. Parker, Clifton B. “Sports stadiums do not generate significant local economic growth, Stanford expert says”. Stanford News. July 30, 2015. https://news.stanford.edu/015/07/30/stadium-economics-noll-073015/ Synopsis: Stanford economist Roger Noll (a former senior economist for the President’s Council of Economic Advisers) says professional sports stadiums do not generate local economic growth as advertised. Noll also argues that the incremental tax revenue generated by sports events is insufficient to cover significant financial contributions the stadium costs that NFL teams expect local governments to contribute have fallen due to increased political resistance to subsidies for sports teams. Noll’s main explanation for the lack revenue is the infrequency of use. Consequently, stadiums employ fewer people and generate less taxable revenue. In both Los Angeles and Santa Clara the public contribution was responsible for providing the site, infrastructure, tax forgiveness (accounting for up to 20% of total costs), and the debt that is used to finance stadium construction. General stadium financial practices call for the debt to be repaid from the sale of stadium naming rights, personal seat licenses, rights to concessions and profit from operations. If that process is applied to both Los Angeles proposals the optimistic result has the city on the hook for up to $200 million and tax forgiveness programs for 25 to 30 years. For example, Noll pointed out, the cities of Oakland and St. Louis are still making substantial annual payments on the debts that remain for now-obsolete stadiums that were built to lure the Oakland Raiders and St. Louis Rams away from Los Angeles in the 1990s. Noll has argued these statistics will encourage shifting stadium proposals to multi-use facilities if public subsidies continue (examples include Coliseum City and Hollywood Park. One possibility is that as professional sports generate greater revenues from Internet distribution, realworld stadium attendance will shrink, leading to smaller but more luxurious facilities. Another possibility is that all future facilities will be embedded in larger commercial and residential projects, with the sports team being like an anchor tenant at a shopping center. These stadiums do not require public funding to be constructed. The concessions, stadium naming rights, rights to personal seating and premier league loans are sufficient to construct new stadiums. Yet, cities have very little
Page 28 of 36
707 Broadway, Suite 905, San Diego, CA 92101 P: (619) 234-6423 • F: (619) 234-7403 • www.sdcta.org
bargaining power with an NFL team. As long as there are cities without NFL teams that are willing to subsidize a stadium, cities will have to pay part of the cost of a new stadium Garcia, Alexis. “Sports Stadiums Are Bad Public Investments. So Why Are Cities Still Paying for Them?”. Reason.com. March 17, 2015. https://reason.com/reasontv/2015/03/17/sportsstadiums-are-bad-public-investmen Synopsis: On February 24th, 2015 the Inglewood City Council voted unanimously to approve a $1.8 billion stadium plan, yet the progress on the new privately-funded Inglewood stadium has set off a bidding war between other cities that are offering up millions in public subsidies to keep (or attract) pro-sports franchises to their area. On it’s face, the deal for the city of Inglewood is unprecedented because the Rams owner Stan Kroenke has agreed to finance construction of the stadium entirely with private funds. St. Louis responded with a proposed a billion dollar waterfront stadium financed with $400 million in tax money to keep the Rams in Missouri. While full details of the plan have yet to be released, it’s been reported that the financing would be similar to the San Francisco 49er’s deal in Santa Clara, which saw the team receive $621 million in construction loans paid for with public money. in the last 20 years, the U.S. has opened 101 new sports facilities and stadium finance experts say that almost all of them have received public funding totaling billions of dollars. Politicians generally rationalize this expense by stating that stadiums will generate economic revenue and job opportunities for the city, but Kotkin argues that stadiums are a “fanciful approach towards economic growth” and with the exception of construction the majority of jobs generated are low wage occasional work. The rationalization have detracted the focus of city government from their fundamental role of maintaining infrastructure and schools. Noll, Robert G. and Zimbalist, Andrew. “Sports, Jobs and Taxes: Are New Stadiums Worth the Cost ?”. Brookings Edu. Summer 1997. http://www.brookings.edu/research/articles/1997/06/summer-taxes-noll Synopsis: Amidst the sports construction boom economists have estimated more than $7 billion will be spent on new facilities for professional sports between 1997 and 2006. The majority of the cost will be burdened by the each host city. Sports facilities now typically cost the host city more than $10 million a year. Perhaps the most successful new baseball stadium, Oriole Park at Camden Yards, costs Maryland residents $14 million a year and about a third of the crowd at every game comes from outside the Baltimore area. (Baltimore's baseball exports are enhanced because it is 40 miles from the nation's capital, which has no major league baseball team.) Even so, the net gain to Baltimore's economy in terms of new jobs and incremental tax revenues is only about $3 million a year—not much of a return on a $200 million investment. Ten of the facilities built in the 1970s and 1980s, including the Superdome in New Orleans, the Silverdome in Pontiac, the now-obsolete Kingdome in Seattle, and Giants Stadium in the New Jersey Meadowlands, each cause an annual federal tax loss exceeding $1 million. A new sports facility has an extremely small (perhaps even negative) effect on overall economic activity and employment. No recent facility appears to have earned anything approaching a reasonable return on investment. No recent facility has been self-financing in terms of its impact on net tax revenues. Regardless of whether the unit of analysis is a local neighborhood, a city, or an entire metropolitan area, the economic benefits of sports facilities are de minimus. Sports facilities do not generate significant tourism, new industry nor net regional exports.
Page 29 of 36
707 Broadway, Suite 905, San Diego, CA 92101 P: (619) 234-6423 • F: (619) 234-7403 • www.sdcta.org
The argument for city subsidies for stadiums are that sports facilities improve the local economy through construction jobs, attendance, tourism and the “multiplier effect”( as increased local income causes still more new spending and job creation). Advocates argue that new stadiums spur so much economic growth that they are self-financing: subsidies are offset by revenues from ticket taxes, sales taxes on concessions and other spending outside the stadium, and property tax increases arising from the stadium's economic impact. However, these arguments contain bad economic reasoning (often confusing gross and net economic effect) that leads to an overstatement of the benefits of stadiums and causes community resources to be used in a LESS productive way. Productivity has the closest correlation with economic growth and an increase in productivity can arise in two ways: from economically beneficial specialization by the community for the purpose of trading with other regions or from local value added that is higher than other uses of local workers, land, and investments. Building a stadium is good for the local economy only if a stadium is the most productive way to make capital investments and use its workers. The primary cause of sports subsidies is the monopolistic structure of sports. Leagues maximize their members' profits by keeping the number of franchises below the number of cities that could support a team. In principle, cities could bargain as a group with sports leagues, thereby counterbalancing the leagues' monopoly power. In practice, this strategy is unlikely to work. Efforts by cities to form a sports-host association have failed. The temptation to cheat by secretly negotiating with a mobile team is too strong to preserve concerted behavior. Another strategy is to insert provisions in a facility lease that deter team relocation. Many cities have tried this approach, but most leases have escape clauses that allow the team to move if attendance falls too low or if the facility is not in state-of-the-art condition. the California Court of Appeals ruled that condemning a football franchise violates the commerce clause of the U.S. Constitution. In 1986, Congress apparently became convinced of the irrationality of granting tax exemptions for interest on municipal bonds that financed projects primarily benefiting private interests. The theory behind the various tax reform bills is that raising a city's cost from a stadium giveaway would reduce the subsidy. Although cities might respond this way, they would still compete among each other for scarce franchises, so to some extent the likely effect of the bill is to pass higher interest charges on to cities, not teams.The relevance of antitrust and tax reform to the problem of stadium subsidies is indirect but important. Private antitrust actions have significantly limited the ability of leagues to prevent teams from relocating. Teams relocate to improve their financial performance, which in turn improves their ability to compete with other teams for players and coaches. Hence, a team has an incentive to prevent competitors from relocating. Consequently, courts have ruled that leagues must have "reasonable" relocation rules that preclude anticompetitive denial of relocation. Baseball, because it enjoys an antitrust exemption, is freer to limit team movements than the other sports. Citizen action could provide a salient strategy for deterring sports team’s monopolistic process. Yet, despite greater citizen awareness, voters still must cope with a scarcity of teams. Fans may realize that subsidized stadiums regressively redistribute income and do not promote growth, but they want local teams. Alas, it is usually better to pay a monopoly an exorbitant price than to give up its product. Garofalo, Pat and Waldron, Travis. “If You Build It, They Might Not Come: The Risky Economics of Sports Stadiums”.The Atlantic. Sep 7,
Page 30 of 36
707 Broadway, Suite 905, San Diego, CA 92101 P: (619) 234-6423 • F: (619) 234-7403 • www.sdcta.org
2012. http://www.theatlantic.com/business/archive/2012/09/if-you-build-it-they-mightnot-come-the-risky-economics-of-sports-stadiums/260900/ Synopsis: One of the least successful NHL teams from 2011 to 2012 was the Phoenix Coyotes (Glendale, Arizona). The team is owned by the league and has relied on $25 million from the City for the 2011 and 2012 season even though the budget gap for Glendale in 2012 was about $35 million. Overall Glendale is still liable for $15 million per year for 20 years and a $12 million annual debt from construction of the arena. Even if the Coyotes were to return to the Stanley Cup Finals every year, the city would still lose $9 million annually. This trend has become so common across the majority of professional sport franchises that economists have light heartedly developed a rule for determining the actual return on building a sports arena. "Take whatever number the sports promoter says, take it and move the decimal one place to the left. Divide it by ten, and that's a pretty good estimate of the actual economic impact." These minutiae economic impacts spread (if at all) to the nearby blocks, but the spread of benefits generally does not extend to the entire metro area. One of the main reasons for the muted economic effects is the constant vacancy rates during off season months. Another reason for the poor economic performance has been the use of long-term bonds to fund the construction of stadiums, because the city becomes stuck with the debt generated for long periods of time. The use of long term bonds also makes the elimination of year-to-year contracts, such as public sector jobs and programs, easier during periods of debt. Proponent’s statistics continue to embellish attendance and the resulting unsustainable muted economic growth for the cities hosting sports team. Economist Matheson estimates that 20 percent of fans for a Major League Baseball game come from outside the local area, and that the figure for hockey games is likely much smaller. That's hardly enough to fill the local hotels or to add outside spending to the local economy in other ways, he said. Yet, the argument for stadiums continue to gain traction as cities like Glendale cut public service jobs. Clearly, cities that are already combatting debt should not enter into stadium construction proposals as that money could be used to maintain inherently governmental programs such as fire stations, police stations and libraries. When cities subsidizes sports, it reduces its ability to pay for public safety officials, public transportation, and services upon which its citizens rely. Brown. Eliot.“Use of Taxpayer Money for Pro-Sports Arenas Draws Fresh Scrutiny”. Wall Street Journal. March 8, 2015. http://www.wsj.com/articles/use-of-taxpayer-money-forpro-sports-arenas-draws-fresh-scrutiny-1425856677
Critics of using taxpayer money for new arenas and stadiums have fresh momentum as the Obama administration takes aim at the tax-exempted bond subsidies. For decades, cities and states have wooed sports teams through hefty subsidies for new arenas and stadiums, sums that have grown along with the facilities' price tags-despite the howls of economists who deem them a poor use of public money.Cities and states typically repay tax-exempt bonds over several decades with revenues from levies such as a sales or hotel tax. Investors who buy these bonds don’t have to pay taxes on their income, making the interest rates cheaper than for taxable bonds—and lowering the cost of projects. But funding pro facilities with tax-exempt bonds merely has “shifted more of the costs and risks from the private owners to local residents and taxpayers in general,” the Treasury
Page 31 of 36
707 Broadway, Suite 905, San Diego, CA 92101 P: (619) 234-6423 • F: (619) 234-7403 • www.sdcta.org
Department said in its budget proposal. Barring municipalities from issuing the bonds would save the federal government $542 million over 10 years, Treasury said. The general conclusion from empirical data has been that a city’s economy doesn’t get a bump from bringing in a new sports team or building a stadium—and scarce economic-development dollars could be put to better use with other investments. University of Maryland economist Dennis Coates argues that a new sports team or stadium does NOT create job, tax or economic growth. “Bread, circuses and leather balls”. The Economist. May 19, 2012. Print. http://www.economist.com/node/21555606 Georgia Dome is America’s largest indoor sports arena and it has hosted the Atlanta Falcons since 1992. The stadium cost $214 to build, $55 million to renovate and has supported an NFL team for 20 seasons. Of the 20 stadiums built since the Georgia Dome opened, four have been privately financed. Of the rest, the average public share is 73% of the total cost. Evidence that publicly financed stadiums generate significant economic development is shaky, particularly when the stadium houses an existing team rather than one new to the city. The Georgia Dome also hosts basketball games and trade shows as they require a enclosed space, but football attendance has been dropping, possibly because patrons would prefer to watch the game outdoors. The shifts in attendance has pressured the Falcons and the GWCC to produce a solution such as a new stadium with a retractable roof, with more general and premium seats. The estimates for the project have stabilized at $947.7 million, $498 million of which would be paid for with money coming from gambling revenue and a redirected hospitality tax from Minnesota and Minneapolis. As tickets have grown pricier and television broadcasts better, attendance at games has been falling. Moreover, around 1,500 former professional football players are suing the league and, in some cases, a helmetmaker, claiming they concealed information about neurological damage caused by repeated hits to the head. On the other hand, American football has survived scandals before and cities seem willing to bet hundreds of millions of dollars in taxpayer money that it weathers this one too. Viton, Philip A. “Major League Sports Stadiums and Economic Development”. Ohio State. April 22, 2015. http://facweb.knowlton.ohiostate.edu/pviton/courses2/crp4110/stadiums.pdf In the post-1990 years publicly funded stadiums have increased linearly from 25 new projects in the 1970s to 41 new projects, however, the amount of public participation has begun to stabilize around 70%. Up to 2011 6 out of 81 projects (7%) were wholly private, 42 out of 81 projects (52%) involved more than 75% of the funds coming from the public sector and 25 out of 81 projects (31%) were completely financed by the public sector. Premier sports leagues continue to utilize the monopolistic, excessive bargaining power and false claims of facilitating economic growth/city wellbeing to maintain the massive amounts public funding afforded to them by city, county and state governments. City wellbeing can be determined by two regressive functions that regress wellbeing on indicators of the type of stadium each area in question received. Model 1 found that none of the sports-related independent variables had statistically significant impact on personal income. Model 2 uses the same sample and years as model 1, but considers real regional income trends. The results were mixed for individual areas for example in Detroit, Kansas City and Tampa Bay, having a new stadium slightly decreased the share of personal income relative to the region. Meanwhile, in New Orleans and Seattle, the new stadium slightly increased the SMSAís share of personal income.
Page 32 of 36
707 Broadway, Suite 905, San Diego, CA 92101 P: (619) 234-6423 • F: (619) 234-7403 • www.sdcta.org
Model 2 was also applied to a pooled model, which revealed building or rehabbing a stadium has a statistically significant negative effect on the share of personal income (neither NFL or MLB had any discernible effect). The tentative conclusions of this study are mostly mixed. Hosting a sports team can lead to positive redistribution of regional personal income in favor of sports cities. However, these positive impacts are far more rare (ex - Seattle and New Orleans) and almost nonexistent in the pooled data models, therefore this data supports the claim that generally a large positive economic impact is NOT present following rehab or completion of a stadium. Both regression models have been updated to consider the new data starting in 2001 and the new style of building stadiums closer to the surrounding community and on as little land as possible. The new data revealed more positive impacts than the earlier samples, but it is still inconsistent and far from proving the positive impacts claimed by proponents of stadium construction projects. The most common positive impact resulted from adding or rehabbing a MLB stadium (most likely due to their flexibility with antitrust laws). The impacts on the quality of life from the addition or removal of a sports team is as mixed as the economic impacts. In most cities a sports stadium impacts housing markets in mixed ways (sometimes it actually lowers housing values), but the extent of the increase dissipates rapidly with distance to the stadium. The main suggestions the resulted from this study were: at least two large-crowd dates per year for every $1m of debt that the city assumes. Try to design stadiums for multi-sport use. Incorporate ancillary development into overall plan. Try to keep spectators travel within the city boundaries, by designing nearby commercial space to be safe and convenient. Do not use the suburbanñstadium model (ie the model of an out-of-the-city stadium surrounded by large parking lots). Develop a strategy to counter the monopoly power of sports leagues and player unions (For example, ensure that the municipality has some say in pricing). Encourage private participation in stadium construction and operation. Be clear about the nature of any intangible benefits, such as quality of life, that are expected to accrue. Siegfried, John and Zimbalist, Andrew. “The Economics of Sports Facilities and Their Communities.” The Journal of Economic Perspectives, Vol 14 No. 3 (Summer, 2000). http://www.csus.edu/indiv/h/howellj/econ145_s2009/Assignments/SportsStadiumFundin g.pdf Starting in 1990, the construction of 95 professional sports stadiums would cost more than $21.7 billion with public funds accounting for almost 2/3rds of the entire sum. Both the cost of stadiums and portion of public funds used in the construction have increased since the 1920s, but the most dramatic of these trends has been the portion of public spending on refurbishing sports facilities. In the 1930s, 1940s and 1970s public funds accounted for 100% of expenditures on refurbished stadiums. In the 1960s the public portion was 93.4%, 98.8% in the 1980s and 78.8% in the 1990s. The upward trend is principally a result of the excessive bargaining power sports franchises have over a city. The results were cities bid against one another, each offering better facilities at lower costs to the sports team, but the average cost of facility construction in current dollars roe from $3.8 million in the 1950s to $200 million in the 1990s.
Page 33 of 36
707 Broadway, Suite 905, San Diego, CA 92101 P: (619) 234-6423 • F: (619) 234-7403 • www.sdcta.org
Most independent empirical evidence (which relies heavily on economic impact instead of projections) shows there is no statistically significant positive correlation between sports facility construction and economic development. Yet, many consulting firms hired by sports teams or local chambers of commerce project future positive and almost inevitable economic growth via local value added, new spending and associated multipliers. These studies generally are produced using a regional and input-output regression model that depend on outdated technical coefficients which are treated as invariant to shifts in supply and demand. Cross-section studies (Baade 1994) found a far greater positive economic impact from increasing graduation rates and police than with metros that host a professional sports team. Studies by Coates and Humphreys (1999) showed a negative economic impact associated with the addition of new teams and stadiums, but this result is consistent with a higher (negative) multiplier effect (teams and consulting firms generally use a more positive multiplier). Sports teams do not cause positive economic growth for five reasons. First, the teams are relatively small businesses, while an entire premier league can have a large social presence the individual teams revenue generally account for 1% of a city’s economic output. Second, since the majority of consumers have a relatively inflexible leisure budget (inelastic) the substitution effect causes the net effect on spending in metropolitan areas to drop to zero. In other words, money a consumer spends with their family at a football game is most likely the same funds the consumer would use for another leisure activity with their family, for example bowling or attending a movie premiere. A sports team can break from this muted effect by appealing to national television contracts or other funds from the central league office and by attracting out of town spectators, however, as noted earlier local patrons make up the majority of ticket sales. Third, the majority of personal income that is generated by a professional athlete is leaked outside of the local economy. Approximately 40% of a professional athlete's income leaks to Washington D.C. and the majority of the rest is spent in the world market. Fourth, sports facilities are not expected to generate additional net output on a metropolitan area therefore, the public expenditures on the stadium generally exceed revenues generated by it. As a result the financing burden lands largely on the taxpayer and the city, but if the city is experiencing a budget deficit then it becomes incredibly likely that essential programs and infrastructure spending will be cut to maintain the contract with a sports team. Fifth, the impact a sports team has on core redevelopment is likely to be small due to infrequent game schedule and inclusive concession system. The sports teams also have a demonstrative effective or the ability to “put a city on the map”. However, this notion is not plausible becomes sports teams operate as business and will only relocate to a city that provides more business or lower costs. Policy options for counteracting these effects range from correcting monopoly abuses, including government ownership, “public utility” type regulation and injecting competition into the franchise sports industry. Carlino, Gerald A. and Coulson, N. Edward. “Should Cities Be ready for Some Football ? Assessing the Social Benefits of Hosting an NFL Team”. Business Review. 2004. https://www.phil.frb.org/-/media/research-and-data/publications/businessreview/2004/q2/brq204jc.pdf Synopsis: Rapid population growth in many metropolitan areas in the United States has made them economically viable locations for professional sports franchises such as those of Major League Baseball (MLB) or the National Football League (NFL). But since all four of the major sports leagues
Page 34 of 36
707 Broadway, Suite 905, San Diego, CA 92101 P: (619) 234-6423 • F: (619) 234-7403 • www.sdcta.org
tightly control both the creation of new franchises and the relocation of teams, cities’ demand for teams far exceeds the supply. As a result, the price cities have to pay to get teams has gone up. According to Raymond Keating, the total cost of 29 sports facilities that opened between 1999 and 2003 is expected to be around $9 billion. Keating found that taxpayers’ money financed around $5.7 billion, or 64 percent, of this $9 billion. Often, publicly funded subsidies are justified by claims that attracting or retaining sports teams more than pays for itself in increased local tax revenue by creating new jobs and more spending. More recently, local officials have come to view a downtown stadium project as an important part of the revitalization of the central city’s urban core. However, independent studies by economists often indicate that taxpayers may not be getting such a good deal. Economists have long studied the effects of an area’s quality of life on wages and the cost of housing. Past studies have found that people are willing to pay indirectly for local amenities, such as good weather, scenic views, and nearness to the ocean, in the form of higher rents and lower wages. Similarly, if people benefit from having a professional sports franchise in their community, they are presumably willing to pay for it — if not directly through the purchase of tickets, then indirectly through an increased willingness both to pay more for housing in the area and to accept lower wages. In principle, cities could set rental payments to cover all the costs associated with constructing and operating municipal stadiums. In practice, since all four major sports leagues exercise considerable control over the geographic mobility of established teams as well as over the creation of new franchises, cities do not set rental payments in this way. The costs and benefits fall into four broad categories: direct benefits, indirect benefits, construction costs, and operating expenses. The multiplier effect is a secondary effect that is becoming less influential in these models because of the difficulties in using “multiplier analysis” to assess the economic impact of professional sports team. Regardless of the method used by independent researchers, the bottom line is that subsidies to sports teams appear to be much greater than the economic benefits they generate for cities. Moreover, economists have pointed out that local spending related to professional sporting events may result in less spending on other recreational activities. The subsidies granted to professional sports teams, in some sense, suggest that civic leaders and residents view professional sports teams as valued assets of a city. Similarly, economists have noted that professional sports teams contribute to the quality of life in an area by increasing the satisfaction or happiness of residents in general, not just those who attend games. “So teams create value for local residents that owners of sports franchises cannot capture. That is, the team can’t charge a fan for just being a fan. But that doesn’t make this “external benefit” any less real.” According to this study San Diego potential increase in property taxes when hosting an NFL is $1205.3 million and it would require $134.5 million in subsidies from the city (in 1999 dollars). However, there have been zero viable proposed plans that would keep the Chargers in San Diego while costing the taxpayers only $134.5 million in subsidies. The inconsistency in data makes this author questionable. Nonetheless, the paper’s position that sports are popular, and once the qualityof-life benefits are included in the calculus, public spending on new stadiums may be a good investment for central cities and their residents. This, of course, is not the same thing as recommending that cities immediately decide to fund stadiums if only because the opportunity cost
Page 35 of 36
707 Broadway, Suite 905, San Diego, CA 92101 P: (619) 234-6423 • F: (619) 234-7403 • www.sdcta.org
of appropriating such funds is the elimination of other, possibly more worthy programs, such as building new schools. Dennis Coates and Brad R. Humphreys. Do Economists Reach a Conclusion on Subsidies for Sports Franchises, Stadiums, and Mega-Events? 2008. http://college.holycross.edu/RePEc/spe/CoatesHumphreys_LitReview.pdf Synopsis: This paper reviews the empirical literature assessing the effects of subsidies for professional sports franchises and facilities. The evidence reveals a great deal of consistency among economists doing research in this area. That evidence is that sports subsidies cannot be justified on the grounds of local economic development, income growth or job creation, those arguments most frequently used by subsidy advocates. The paper also relates survey evidence showing that economists in general oppose sports subsidies. In addition to reviewing the empirical literature, it describes the economic intuition that probably underlies the strong consensus among economists against sports subsidies. Robert A. Baade and Victor A. Matheson. Financing Professional Sport Facilities. College of the Holy Cross. 2011. http://college.holycross.edu/RePEc/hcx/MathesonBaade_FinancingSports.pdf Synopsis: Examines the issue of public financing of stadiums from multiple different angles. Most usefully, it includes a breakdown of public contribution percentages broken down by decade. Tim Chapin. Beyond the Entrepreneurial City. Journal of Urban Affairs. 2002. http://onlinelibrary.wiley.com/doi/10.1111/1467-9906.00144/epdf Synopsis: Over the last several decades the public sector has become much more innovative and entrepreneurial when pursuing downtown redevelopment, embracing characteristics previously restricted to the private sector. This article investigates this approach by reviewing a major redevelopment project in San Diego. In the course of this project the public sector acted in ways that exemplify the entrepreneurial approach to downtown redevelopment. However, rather than simply taking on an entrepreneurial role, the city's efforts are better described by the term municipal capitalism. No longer content to simply stand by after providing some resources at the outset, the public sector is now the lead player throughout the entirety of the redevelopment process, an actor as focused upon the return on investment from the project as the private sector. This article concludes with a discussion of the emerging role of the public sector as a capitalistic actor, and explores the consequences of this emergence.
Page 36 of 36