OPEC Monthly Oil Market Report
13 May 2014
Feature article:
Review of non-OPEC oil supply
Oil market highlights
1
Feature article
3
Crude oil price movements
5
Commodity markets
11
World economy
17
World oil demand
37
World oil supply
46
Product markets and refinery operations
61
Tanker market
68
Oil trade
72
Stock movements
79
Balance of supply and demand
88
Organization of the Petroleum Exporting Countries Helferstorferstrasse 17, A-1010 Vienna, Austria E-mail:
[email protected] Website: www.opec.org
Oil market highlights Crude Oil Price Movements The OPEC Reference Basket in April increased 12¢ to $104.27/b, amid marginal improvements in most component values. Crude prices were supported by firmer refining margins, ongoing supply outages, and the return of some refineries from maintenance. On average, Nymex WTI gained $1.53 to $102.03/b and ICE Brent increased 34¢ to $108.09/b. The Brent-WTI spread ended the month with an average of around $6.05/b, the narrowest since September 2013.
World Economy World economic growth in 2014 remains at 3.4%, following growth of 2.9% in 2013. The OECD growth forecast remains at 2.0%, with the US revised down and the Euro-zone slightly higher. China’s growth forecast remains at 7.5% and India’s at 5.6%. The main lift for 2014 growth is seen coming from OECD economies, while emerging markets are slowing. With the most recent weakness in some major OECD economies – mainly the US and Japan – the risk to the global growth forecast is seen currently skewed slightly to the downside.
World Oil Demand Global oil demand is expected to increase by 1.14 mb/d to reach 91.15 mb/d in 2014, unchanged from the previous report. Almost half of annual oil demand growth is seen coming from China and the Middle East. The estimate for world oil demand in 2013 was unchanged at 90.01 mb/d, representing growth of 1.05 mb/d over the previous year.
World Oil Supply Non-OPEC supply growth in 2014 was revised up marginally to stand at 1.38 mb/d. The estimate for 2013 was also adjusted slightly higher to stand at 1.35 mb/d. OPEC NGLs were revised down by 0.1 mb/d for both 2013 and 2014 to stand at 5.66 mb/d and 5.81 mb/d respectively. OPEC crude production, according to secondary sources, averaged 29.59 mb/d in April, representing an increase of 131 tb/d.
Product Markets and Refining Operations Product markets in the Atlantic Basin strengthened in April, driven by developments at the top of the barrel. Stronger gasoline demand in the US and higher export opportunities to South America led to a sharp recovery in margins. In Asia, the uptick was partially limited by the continued weakness at the bottom of the barrel.
Tanker Market Freight rates declined in April, with both dirty and clean tankers losing ground. Lower tonnage demand, refinery maintenance and holidays were the main factors behind the decline in spot freight rates. The clean tanker market was influenced by similar factors, with the East of Suez market down 4.5% and the West of Suez declining 21.5%.
Stock Movements OECD commercial stocks declined in March, driven mainly by products as crude saw a build. The deficit with the five-year average stood at 115 mb, split between crude and products. In terms of forward cover, OECD commercial stocks stood at 56.8 days, around 0.2 days less than the five-year average. Preliminary data for April shows US commercial oil stocks jumped by 47.1 mb, but remained in line with the five-year average.
Balance of Supply and Demand Demand for OPEC crude in 2013 and 2014 saw an upward revision of 0.1 mb/d each compared to the previous report. At 30.1 mb/d, demand for OPEC crude in 2013 stood 0.4 mb/d lower than in the previous year. Demand for OPEC crude in 2014 is forecast at 29.8 mb/d, down 0.4 mb/d from the 2013 level.
OPEC Monthly Oil Market Report – May 2014
1
2
OPEC Monthly Oil Market Report – May 2014
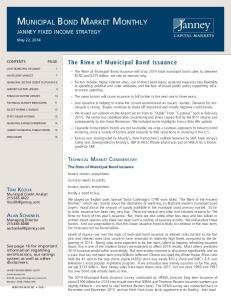
Review of non-OPEC oil supply Non-OPEC oil supply growth in 2013 has been revised up by 0.43 mb/d since the initial forecast to currently stand at 1.35 mb/d. This revision has been mainly driven by the US and Canada, which compensated for outages in some non-OPEC countries. OECD Americas has seen the highest output of all regions in 2013, averaging 18.08 mb/d and representing growth of 1.35 mb/d over the previous year. It also represents the fifth consecutive year of significant growth. Most of this has come from US tight oil supply and NGL production from shale gas, together with output from Canadian oil sands. US oil production reached 11.18 mb/d, the highest level since 1972, representing an increase of 1.14 mb/d over the previous year. Moreover, since tight oil production took off in January 2008, US total crude oil imports have dropped from 10.08 mb/d to 7.76 mb/d in December 2013 (Graph 1). The second highest growth in 2013 came from Canadian oil sands, which increased by 0.23 mb/d to average 4.01 mb/d, followed by Russia, the Sudans, China, Colombia, Kazakhstan and Brazil. Countries experiencing a decline in oil production last year were the UK and Norway with minus 80 tb/d each. Syria and Yemen also declined by 120 tb/d and 40 tb/d, respectively, while Indonesian oil supply declined by 50 tb/d, and Mexico and Azerbaijan experienced lower output of 30 tb/d each. Factors contributing to a decline in non-OPEC oil production were mainly geopolitical developments, larger-thanexpected field declines, extended maintenance, and unexpected technical failures. Graph 1: US crude oil imports vs. total oil supply, monthly basis, 2008-13 mb/d
11.73
12 11
US Canada
10.08
Brazil
10
Sudans
9
7.76
8 7
Graph 2: Annual growth for selected non-OPEC countries, 2012-14
7.60
Imports of crude oil
Total oil supply
Source: EIA.
Jul 13
Jan 13
Jul 12
Jan 12
Jul 11
Jan 11
Jul 10
Jan 10
Jul 09
Jan 09
Jul 08
Jan 08
6
2012/11
Russia China
2013/12
Syria
2014/13
UK Egypt Mexico -0.40 -0.20 0.00
mb/d 0.20
0.40
0.60
0.80
1.00
1.20
Source: OPEC Secretariat.
Spending on exploration and development throughout the world increased by 5% last year, according to an analysis of the 42 US and international oil and gas companies that accounted for approximately 39% of non-OPEC production in 2013. Over the past two years, relatively flat oil prices and rising costs have resulted in declining cash flows for these companies. Global oil supply totaled more than 90 mb/d in 2013. OPEC crude oil production, according to secondary sources, averaged 30.21 mb/d last year. OPEC NGLs rose by 0.09 mb/d to average 5.66 mb/d. As a result, the share of OPEC’s total liquids production stood at 39.9%. For 2014, non-OPEC production growth is expected to average 1.38 mb/d. Much of this growth is expected to come from non-conventional sources. US tight oil is seen growing by 0.89 mb/d, Canadian oil sands by 0.20 mb/d, and Brazil’s deep offshore and biofuels by 0.15 mb/d (Graph 2). Meanwhile, North Sea production is expected to see a continued decline; however, due to new investment, mainly in Norway, the rate of decline is expected to decrease. Unexpected outages such as at the Kashaghan field – which has pushed back production to 2016 – are likely to limit further growth in non-OPEC supply. Along with the on-going increase in non-OPEC supply, current OPEC production will contribute to fully meet expected demand, resulting in a fairly balanced market this year.
OPEC Monthly Oil Market Report – May 2014
3
4
OPEC Monthly Oil Market Report – May 2014
Crude Oil Price Movements
Crude Oil Price Movements The OPEC Reference Basket (ORB) increased 12¢ to $104.27/b in April amid marginal improvement in the value of most components. The uplift in the physical market was supported by firmer refining margins, ongoing supply outages and the return of some refineries from maintenance. Crude oil futures gained on both sides of the Atlantic as supply concerns amid escalating tensions between Moscow and Kiev increased the risk premium in the market. Prices were also supported by positive US economic data, stronger US gasoline demand and continued tight supplies at Cushing, Oklahoma. However, the gain in futures prices was capped by bearish data on China’s economy, profit-taking, and the prospect of a rebound in oil exports from Libya. On average, the Nymex WTI front-month gained $1.53 to $102.03/b, while the ICE Brent front-month increased 34¢ to $108.09/b. Data from the US Commodity Futures Trading Commission (CFTC) and ICE Exchange showed that money managers stretched their bullish bets on crude oil futures and options, restoring their net-long positions as prices increased. The front-month ICE Brent/Nymex WTI crude futures spread narrowed sharply over the month on tight crude inventories at Cushing, Oklahoma, and still low refinery runs in Europe. The prompt Brent-WTI spread ended the month at an average of around $6.05/b, after settling at $7.25/b in the previous month, the narrowest since September 2013.
OPEC Reference Basket The ORB rebounded slightly in April as most Basket component values improved marginally. Physical sweet crude oil prices were supported over the month by the recovery in demand amid significantly firmer refining margins for gasoline, particularly in the Atlantic Basin, continued disruption of North African supply, and the return of some refineries from maintenance. Graph 1.1: Crude oil price movement, 2013-14 US$/b
US$/b
OPEC Basket
WTI
05 May
28 Apr
21 Apr
14 Apr
07 Apr
31 Mar
24 Mar
17 Mar
10 Mar
03 Mar
90
24 Feb
90
17 Feb
95
10 Feb
95
03 Feb
100
27 Jan
100
20 Jan
105
13 Jan
105
06 Jan
110
30 Dec
110
23 Dec
115
16 Dec
115
09 Dec
120
02 Dec
120
Brent Dated
Seasonally strong gasoline demand coupled with a sharp drop in gasoline stocks, particularly in the US, pushed crude oil prices higher. Heavy refining turnaround in Asia
OPEC Monthly Oil Market Report – May 2014
5
Crude Oil Price Movements was responsible for part of the strength in light markets, and increasing driving demand lent further support. The ongoing crisis in Ukraine also increased the risk premium in the market. Apart from the Mediterranean market, sour crude grades were pressured most of the month by weak fuel oil and diesel refining margins as heating demand decreased, as well as by ample supply due to the release of strategic reserves and increased heavy sour crude production from Canada. On a monthly basis, the ORB improved slightly to an average of $104.27/b in April, up 12¢, or 0.12%, over the previous month. On a year-to-date basis, the Basket value stood at $104.62/b compared to the $107.28/b average of last year, $2.66 or 2.48% lower. Table 1.1: OPEC Reference Basket and selected crudes, US$/b
OPEC Reference Basket Arab Light Basrah Light Bonny Light Es Sider Girassol Iran Heavy Kuwait Export Marine Merey Murban Oriente Saharan Blend
Mar 14 104.15 104.80 102.10 109.50 107.15 108.67 104.01 103.05 104.07 93.23 107.60 94.96 108.95
Apr 14 104.27 104.87 102.11 110.19 107.39 108.80 104.32 103.13 104.53 93.99 107.75 94.73 108.09
Change Apr/Mar 0.12 0.07 0.01 0.69 0.24 0.13 0.31 0.08 0.46 0.76 0.15 -0.23 -0.86
Other Crudes Brent Dubai Isthmus LLS Mars Minas Urals WTI
107.55 104.32 98.87 104.13 100.09 113.60 106.66 100.53
107.69 104.68 101.29 104.15 98.81 111.12 106.91 102.02
0.14 0.36 2.42 0.02 -1.28 -2.48 0.25 1.49
109.85 106.52 108.68 111.60 106.76 111.68 108.71 93.71
108.08 104.50 99.19 104.31 100.31 110.97 106.84 99.49
7.02 3.42 3.23
5.67 3.54 3.01
-1.35 0.12 -0.22
16.13 -1.75 3.33
8.60 3.77 3.59
Differentials Brent/WTI Brent/LLS Brent/Dubai
Year-to-date 2014 2013 107.28 104.62 105.42 108.43 102.56 104.99 112.36 110.17 109.86 107.71 108.72 110.33 106.37 104.54 106.23 103.53 106.35 104.35 97.71 93.73 107.91 109.21 100.22 95.10 109.37 110.66
Note: Arab Light and other Saudi Arab ian crudes as well as Basrah Light preliminarily b ased on American Crude Market (ACM) and sub ject to revision. Source: Platt's, Direct Communication and Secretariat's assessments.
All Basket component values increased slightly in April, except Saharan Blend. Most Brent-related light sweet crude components edged higher, notably the Nigerian and Angolan grades, boosted by an uptick in demand on the back of stronger refinery margins and ongoing Libyan supply constraints. Firm Asian demand, noticeably from India, also supported West African crudes. The price for Mediterranean sweet crude (i.e. Algerian Saharan Blend) remained under pressure earlier in the month amid expectation of the return of Libyan crudes, strong Caspian light sweet crude export programmes and closed arbitrage to Asia.
6
OPEC Monthly Oil Market Report – May 2014
Crude Oil Price Movements Arbitrage to Asia, which frequently clears significant quantities of crude from the Mediterranean each month, has been largely closed as Asian crude prices have been pushed lower by refinery maintenance in the Asian-Pacific region. However, prices recovered late in the month amid firmer Mediterranean gasoline margins and curtailed Libyan supply. The Brent-related crudes, Saharan Blend, Es Sider, Girassol and Bonny Light, rose 5¢, on average. Latin American Basket component performances were mixed. Oriente spot prices slipped over the month following the deterioration in the US sour market, falling to their widest discount to WTI in more than five years amid deliveries from the Strategic Petroleum Reserve (SPR) and a rise in US Gulf Coast (USGC) commercial inventories. Increasing US and Canadian crude supplies in the USGC are undermining demand for Latin American grades. The displaced Latin American grades have been moving to the Asia-Pacific, but peak refinery maintenance in April and May curbed Chinese interest. Ecuador’s Oriente value dropped 23¢ compared to the previous month. Meanwhile, Venezuela’s Merey edged up 76¢ over the month, supported by its formula elements’ improved performances, particularly West Texas Sour (WTS). Additional pipeline capacity between West Texas and USGC narrowed the differentials of crude prices at Midland, home of WTS, relative to the WTI hub at Cushing. Middle Eastern spot and multi-destination grade component values improved by around 10¢ and 30¢, respectively, in April. Middle Eastern spot prices rose above the official selling price (OSP), partly driven by a cut in the latest OSPs and by expectations of higher demand when refinery maintenance ends. However, late in the month, spot differentials fell below official prices as sellers cut offers to attract more buyers. On 12 May, the ORB stood at $104.21/b, less 6¢ below the April average.
The oil futures market Crude oil futures gained on both sides of the Atlantic in April. Prices rose on concerns over the possibility of tougher sanctions on Russia and potential supply disruptions amid escalating tensions. Positive US economic data, stronger US gasoline demand and continued tight supplies at Cushing, Oklahoma, all supported prices. The gain in futures prices was capped by bearish data on China’s economy, profit taking, and the prospect of a rebound in oil exports from Libya. Crude prices also had to give back most of the gains over the month as concerns over supply disruptions from Russia eased, while crude exports continued to recover, and USGC crude inventories hit an all-time high. The Nymex WTI front-month gained $1.53 over the month to average $102.03/b in April. Compared to the same period in 2013, the WTI value is significantly higher by $5.73 or 6.10% at $99.52/b. ICE exchange Brent front-month increased 34¢ to an average of $108.09/b. Year-to-date, ICE Brent was lower in value compared to the same period last year. Its value weakened by $2.39 or 2.17% to $107.95/b from $110.34/b. Crude oil futures prices improved further in the second week of May. On 12 May, ICE Brent stood at $108.41/b and Nymex WTI at $100.59/b. Data from the US Commodity Futures Trading Commission (CFTC) showed that hedge funds and money managers stretched their bullish bets in US crude oil futures and
OPEC Monthly Oil Market Report – May 2014
7
Crude Oil Price Movements options, restoring their net long US crude futures and options positions during April as prices increased. The speculator group raised its combined futures and options positions in US crude oil contracts by 37,308 lots to 330,711 contracts over the month. Similarly, net-length positions of the speculative community in ICE Brent grew by 74,416 lots to 204,488 contracts — its highest since its record high in September 2013. Moreover, the total futures and options open interest volume in the two markets increased in April by 138,093 contracts to 4 million contracts. Graph 1.2: Nymex WTI price vs. speculative activity, 2013-14 US$/b
Graph 1.3: ICE Brent price vs. speculative activity, 2013-14
'000 Contracts
115 110
US$/b
'000 Contracts
350
120
250
300
115
200
105 100
250
95
200
110
150
105
90
95
50
100
90
0
May 13 Jun 13 Jul 13 Aug 13 Sep 13 Oct 13 Nov 13 Dec 13 Jan 14 Feb 14 Mar 14 Apr 14
80
150
Managed money net long positions (RHS) WTI (LHS) Source: CFTC.
May 13 Jun 13 Jul 13 Aug 13 Sep 13 Oct 13 Nov 13 Dec 13 Jan 14 Feb 14 Mar 14 Apr 14 May 14
85
100
100
Managed money net long positions (RHS) ICE Brent (LHS) Source: IntercontinentalExchange, Inc.
The daily average traded volume during April for Nymex WTI contracts decreased by 11,093 lots to average 546,025 contracts. Meanwhile, ICE Brent volume moved up by 8,544 lots to 570,892 contracts. The daily aggregate traded volume in both crude oil futures markets decreased slightly by 2,549 contracts in April to around 1.12 million futures contracts, equivalent to 1.12 billion b/d. The total traded volume in Nymex WTI and ICE Brent contracts was 11.47 and 11.99 million contracts, respectively, over the month.
The futures market structure The Nymex WTI front-month continues to increase its premium over the future months’ contracts amid ongoing drawdowns of crude stocks at the WTI delivery hub. Stockpiles at Cushing moved down to 25.4 mb in the week ended 25 April, according to a report by the US Energy Information Administration (EIA). Crude supplies at the hub fell for the 13th time in 14 weeks last week. This was mainly because of the continued flow of crude oil into the USGC due in part to pipelines connecting it to the Nymex delivery point at Cushing, Oklahoma, such as TransCanada’s 590 tb/d pipeline and the 400 tb/d Seaway crude pipeline. Moreover, the backwardated structure of WTI makes storing oil less appealing, causing oil to move out of storage. There is a price incentive for shippers or owners holding crude at Cushing to bring their crude out of storage. Generally, backwardation is a signal to take crude out of storage and sell it today before it loses value. As a result, the prompt-month Nymex WTI futures contract saw its premium vs. the second month contract move around 10¢ to close to 75¢/b. This backwardation in WTI’s intermonth spreads is the highest since September of last year.
8
OPEC Monthly Oil Market Report – May 2014
Crude Oil Price Movements The backwardations in the Brent market structure weakened further over the month despite elevated refinery demand due to good margins, the looming fear of supply disruptions due to conflict in the Ukraine and the enduring supply outages in Libya. The front month was pressured by decreased arbitrage to Asia, an expected increase in Libyan exports, a refinery turnaround and softening concerns over supply disorder. The spread between the second and the first month of the ICE Brent contract averaged around 15¢/b in April compared to 35¢/b in the previous month. Table 1.2: Nymex WTI and ICE Brent forward curves, US$/b Nymex WTI 25 Mar 14 25 Apr 14
1st FM 99.19 100.60
2nd FM 98.53 100.03
3rd FM 97.68 99.27
6th FM 95.02 96.82
12th FM 90.40 92.57
25 Mar 14 25 Apr 14
1st FM 106.99 109.58
2nd FM 106.81 109.13
3rd FM 106.48 108.59
6th FM 104.91 106.74
12th FM 102.51 103.96
ICE Brent
FM = future month.
The bullishness in WTI continued to narrow the transatlantic spread. The front-month Nymex WTI/ICE Brent crude futures spread narrowed sharply over the month on tight crude inventories at Cushing, Oklahoma, and low refinery runs in Europe. The return of much of the USGC refinery capacity following seasonal maintenance propped up demand for US domestic crudes, despite record inventories in the region. The prompt WTI/Brent spread ended the month at an average of around minus $6.05/b after settling at minus $7.25/b in the previous month, the narrowest since September 2013. Graph 1.4: Nymex WTI and ICE Brent forward curves, 2014 US$/b 110
US$/b 110
105
105
100
100
95
95
90 1FM
2FM
3FM
4FM
5FM
ICE Brent: 25 Mar 14 Nymex WTI: 25 Mar 14
6FM
7FM
8FM
9FM
10FM
11FM
90 12FM
ICE Brent: 25 Apr 14 Nymex WTI: 25 Apr 14
FM = future month.
The light sweet/medium sour crude spread Global sweet/sour differentials were mixed again over the month, narrowing further in Asia and Europe as differentials for most regional sweet grades fell amid ample supply and low demand, while widening continued in the USGC. The Tapis/Dubai spread in Asia narrowed as a result of an overhang of regional sweet crude that pressured Tapis following maintenance at Vietnam’s Dung Quat refinery. Maintenance at Vietnam’s 145 tb/d Dung Quat refinery has released 3 mb of
OPEC Monthly Oil Market Report – May 2014
9
Crude Oil Price Movements Vietnamese medium sweet Bach Ho crude for export. The Tapis-Dubai spread narrowed to average $6.60/b, compared to $7.05/b in the previous month, an almost 50¢ drop. In Europe, the Russian medium sour Urals discount to North Sea Dated Brent narrowed in the Mediterranean on tight sour crude supply. April Urals shipments from the Black Sea ports were up only marginally in March, while Iraqi sour Kirkuk shipments have halted again because of the shutdown of the pipeline to the Turkish port of Ceyhan. Meanwhile, Europe continued to suffer from low availability of mediumsour crude due to geopolitical factors, as well as the redirection of Russian crude away from Europe towards the Far East. On the other hand, closed arbitrage to Asia and months of strong export programmes have put substantial pressure on sweet and semi-sweet crude differentials, with local Mediterranean demand still struggling on the back of seasonal refinery maintenance. On average, the Dated Brent/Urals spread in April narrowed by 10¢ to 80¢/b. Graph 1.5: Brent Dated vs. sour grades (Urals and Dubai) spread, 2013-14 US$/b
US$/b
Dubai
05 May
28 Apr
21 Apr
14 Apr
07 Apr
31 Mar
24 Mar
17 Mar
10 Mar
03 Mar
24 Feb
17 Feb
-2
10 Feb
-2
03 Feb
0
27 Jan
0
20 Jan
2
13 Jan
2
06 Jan
4
30 Dec
4
23 Dec
6
16 Dec
6
09 Dec
8
02 Dec
8
Urals
In the US, firmer gasoline crack spreads and the need to rebuild gasoline stocks buoyed Light Louisiana Sweet (LLS). In April, LLS’ premium to sour Mars rose to its highest level this year at $5.35/b on a monthly average basis compared to $4.05/b in March, widening by $1.30. Increased supplies weighed on heavy crude in the US. Heavy Canadian crudes are reaching the Houston area through TransCanada’s 700 tb/d US Gulf Coast line. A 5 mb release of light to medium sour crude from SPR will be partly delivered in May, and the 450 tb/d Seaway Twin could begin commercial deliveries of heavy crude to the USGC in late May or June. Meanwhile, the medium sour US Gulf crude discount to WTI widened amid deliveries from the SPR and a rise in USGC commercial oil inventories to a record high. May discounts to WTI for Mars and Poseidon fell to their widest in more than five years. Furthermore, increasing US and Canadian crude supplies in the USGC are undermining demand for Colombian grades. Colombian crudes are being marketed to the USWC, and this is weighing on demand for Ecuadorean supplies.
10
OPEC Monthly Oil Market Report – May 2014
Commodity Markets
Commodity Markets Commodity prices have, on average, risen marginally in April, being driven by a slight appreciation in the energy sector and a considerable increase in base metals. In general, the different trading patterns of the past month continued, with precious metals, food-related and agricultural commodities declining. Within energy, US gas prices continued volatile trading, adjusting the price level after the cold-snap related price hike at the beginning of the year. The price rise of Nickel – due to the export ban in Indonesia – and the increase in Aluminium prices due to long wait times for physical delivery were also notable. Demand from the major emerging economies is decelerating slightly due to the economic slowdown in China. With falling global inflation, the need to hedge rising prices via investments in commodities as an asset class has also become less necessary.
Trends in selected commodity markets The price development in commodity groups was mainly influenced by energy – mainly by crude oil prices – which edged higher in April on average, before again retreating at the beginning of May. US natural gas prices, however, declined on average in April, but the on-going development in Ukraine with a view to Russian gas supply will need close monitoring. The European Union imports around 30% of its natural gas from Russia with around 15% of this supply arriving via the Ukraine. So far the impact of the situation has been relatively limited, given that storage levels are sufficient in the EU after an unusually mild winter, and with the heating season coming to an end. Underlying aspects that were driving commodity prices down were the on-going slowdown in China, with also the OECD economies facing headwind recently. The influence of political developments - mainly the situation in the Ukraine - supported energy and agricultural commodities, and the export ban on unprocessed minerals in Indonesia was supportive for base metals. The trend of falling inflation has further reduced the urgency to hedge against general price rises. Not only is inflation still below the average target levels in the major OECD economies, but it has also trended lower in China, where it fell below 2% to now stand at only 1.8%. In India it has also declined since the beginning of the year. The waning inflation in emerging economies is also the outcome of a slowdown in economic output, which itself has led to lower physical demand. As a sign of potential stabilisation of the slowdown in China, copper prices have increased marginally by 0.4% m-o-m in April, after witnessing a steep decline in recent months. The stabilisation of copper prices, however, may also be due to recent supply disruptions at the beginning of April in Chile, the world’s largest producer. The continuation of tapering monetary stimulus in the US is also forecast to put additional weight on commodity prices, due to declining investment in emerging economies and a reduction in speculative price pressure. However, volumes in futures contracts of agricultural commodities have risen considerably in the past months, accompanied by price rises. The same applies to investment volumes in livestock, while volumes in natural gas and gold have decelerated and investment volumes in copper have declined. This development has also been mirrored in past months’ price developments. The switch from some commodity investments into other asset classes has also become apparent, when reviewing the performance of large equity markets like the Standard & Poor’s 500.
OPEC Monthly Oil Market Report – May 2014
11
Commodity Markets The expectation of a slowing deceleration in China in combination with rising inflation levels in the developed economies may have been important support factors for industrial commodities recently. It remains to be seen how the near term commodity price trend will continue as, most recently, developed economies - mainly the US and Japan - were facing some headwinds as well, with exports to China also slowing significantly due to the economy’s deceleration. In Japan, the uncertainty about the outcome of the sales-tax increase is also adding concern about future growth. The agricultural sector and food-related commodities continued to be driven by specific issues. The influence of the Ukrainian crisis, in combination with weatherrelated issues in Brazil, has led to considerable price rises in recent months. Pricing pressure has abated to some extent, but could flare up again if the situation in Ukraine worsens. Base metal prices increased substantially in April. The main support came from nickel, due to the fact that the Indonesian export ban on unprocessed minerals continued. Aluminium was also up substantially in April, supported by the fact that warehouse queues are expected to remain long for some time. Table 2.1: Commodity price data, 2014 Monthly averages Commodity
% Change
Unit Feb 14
Mar 14
Apr 14
Feb/Jan
Mar/Feb
Apr/Mar
World Bank commodity price indices for low and middle income countries (2010 = 100)
Energy Coal, Australia Crude oil, average Natural gas, US Non Energy Agriculture Food Soybean meal Soybean oil Soybeans Grains Maize Wheat, US, HRW Sugar, world Base Metal Aluminum Copper Iron ore, cfr spot Lead Nickel Tin Zinc Precious Metals Gold Silver
$/mt $/bbl $/mmbtu
$/mt $/mt $/mt $/mt $/mt $/kg $/mt $/mt $/dmtu $/mt $/mt $/mt $/mt $/toz $/toz
130.6 76.3 104.8 6.0 99.8 106.2 113.1 594.0 985.0 591.0 110.3 209.3 292.3 0.4 86.9 1,695.2 7,149.2 121.4 2,108.0 14,203.6 22,820.7 2,034.5
127.9 73.3 104.0 4.9 99.8 108.0 114.0 584.0 1,002.0 500.0 114.5 222.3 323.6 0.4 84.4 1,705.4 6,650.0 111.8 2,053.1 15,678.1 23,024.3 2,007.9
128.3 72.8 104.9 4.6 100.0 107.3 112.5 566.0 999.0 516.0 113.1 222.4 324.9 0.4 87.1 1,810.7 6,673.6 114.6 2,087.1 17,373.6 23,405.2 2,027.2
3.3 -6.5 2.7 27.1 2.0 3.8 4.1 4.8 4.5 4.4 4.5 5.7 6.1 6.3 -1.5 -1.9 -2.0 -5.3 -1.6 0.7 3.4 -0.1
-2.1 -3.9 -0.8 -18.3 0.1 1.7 0.8 -1.7 1.7 -15.4 3.8 6.2 10.7 7.8 -2.8 0.6 -7.0 -7.9 -2.6 10.4 0.9 -1.3
0.3 -0.7 0.8 -5.0 0.1 -0.6 -1.3 -3.1 -0.3 3.2 -1.2 0.0 0.4 -1.6 3.1 6.2 0.4 2.5 1.7 10.8 1.7 1.0
1,299.6 20.8
1,336.1 20.7
1,298.5 19.7
4.4 4.9
2.8 -0.6
-2.8 -4.7
Source: World Bank, Commodity price data.
Energy prices have remained almost steady with a rise of 0.3% m-o-m. Natural gas, however, continued declining by 5.0% m-o-m. The agricultural sector prices were also retreating slightly, after the political uncertainties in Eastern Europe in combination with extreme weather conditions in Brazil supported price rises in the past months. Agricultural products fell by 0.6%.
12
OPEC Monthly Oil Market Report – May 2014
Commodity Markets Base metal prices increased by 3.1% m-o-m in April, with the largest rise in nickel, increasing by 10.8% m-o-m, after a rise of 10.4% m-o-m the previous month amid the Indonesian export ban. Iron ore and copper saw some stabilisation in China’s output deceleration, increasing by 2.5% m-o-m and 0.4% m-o-m, respectively, in April. Aluminium rose by 6.2% m-o-m, but has seen a correction since the beginning of May. Within precious metals, both gold and silver declined by 2.8% m-o-m and 4.7% m-o-m, respectively. Graph 2.1: Major commodity price indices, 2012-14 Index 160 140 120 100 80 60 40 20
Energy
Non-energy
Agriculture
Base metals
HH natural gas
Gold
Apr 14
Mar 14
Feb 14
Jan 14
Dec 13
Nov 13
Oct 13
Sep 13
Aug 13
Jul 13
Jun 13
Apr 13
May 13
Mar 13
Feb 13
Jan 13
Dec 12
Nov 12
Oct 12
Sep 12
Aug 12
Jul 12
Base year 2010 = 100
Jun 12
May 12
Index 160 140 120 100 80 60 40 20
Food
Source: World Bank, Commodity price data.
In April, the Henry Hub (HH) natural gas price index settled 24¢ or 5% lower at $4.6 per million British thermal units (mmbtu), after trading at an average of $4.9/mmbtu in the previous month. However, prices are still significantly higher than at the beginning of this year. US natural gas futures fell as milder weather, the return of nuclear units from spring maintenance and a healthy addition to gas in storage lessened immediate concern about ongoing low inventory levels. The US Energy Information Administration said utilities put 82 billion cubic feet (bcf) of gas into storage in the week ended 25 April, which was above analysts' forecast of 75 bcf as well as the 41-bcf injection last year and the 58-bcf five-year average injection. Gas in storage stands at 981 bcf, still an 11-year low for this time of year. That means utilities will have to inject record amounts of the fuel to rebuild stocks to a healthy level that will avoid price spikes later this year. Analysts expect utilities put much less gas into storage due to stronger-than-normal heating demand in the East and stronger-than-normal cooling demand in the West. Early estimates of injections range from 62 bcf to 70 bcf with an average of about 65 bcf. That is below the 81 bcf injection during the same period last year and the five-year normal injection of 72 bcf. May is historically the heaviest injection month of the season, making it a critical month for companies to add to storage before rising summer temperatures boost gas use by power generators to meet cooling demand.
OPEC Monthly Oil Market Report – May 2014
13
Commodity Markets Graph 2.2: Inventories at the LME '000 Tonnes
'000 Tonnes
7,000
6,800
6,800
6,600
6,600
Apr 14
Feb 14
Jan 14
Oct 13
Mar 14
7,000
Dec 13
7,200
Nov 13
7,200
Sep 13
7,400
Aug 13
7,400
Jul 13
7,600
Jun 13
7,600
May 13
7,800
Apr 13
7,800
Sources: London Metal Exchange and Haver Analytics.
Investment flows into commodities The total open interest volume (OIV) in major commodity markets in the US increased slightly by around 0.15% m-o-m to 8.7 million contracts in April as agriculture and copper OIV’s improved by 2.9% and 1.4%, respectively. Crude oil, natural gas, precious metals and livestock OIV’s were down by 0.3%, 4.9%, 4% and 5.1%, respectively. Gold OIV decreased sharply this month by 9.6%. Graph 2.3: Total open interest volume '000 contracts
'000 contracts
Apr 14
Mar 14
7,000
Feb 14
7,000
Jan 14
7,500
Dec 13
7,500
Nov 13
8,000
Oct 13
8,000
Sep 13
8,500
Aug 13
8,500
Jul 13
9,000
Jun 13
9,000
May 13
9,500
Apr 13
9,500
Source: US Commodity Futures Trading Commission.
Total net length speculative positions in commodities increased by almost 2% m-o-m to 1,636,230 contracts in April amid mixed activities, with moderate increases in crude oil positions and a significant drop in net length of natural gas and precious metals.
14
OPEC Monthly Oil Market Report – May 2014
Commodity Markets Graph 2.4: Speculative activity in key commodities, net length '000 contracts
'000 contracts
Jun 13
Agriculture
Gold
WTI
Natural gas
Livestocks
Apr 14
-100
Mar 14
-100
Feb 14
100
Jan 14
100
Dec 13
300
Nov 13
300
Oct 13
500
Sep 13
500
Aug 13
700
Jul 13
700
May 13
900
Apr 13
900
Copper
Source: US Commodity Futures Trading Commission.
Agricultural OIV was up 2.9% m-o-m to 4,418,306 contracts in April. Meanwhile, money managers’ net long positions in agriculture continue to increase by almost 10% to 915,419 lots in April. The move took place as the futures market soared 4% late in the month on fear of a possible loss of output from cane crop damage in Australia and Brazil. Graph 2.5: Speculative activity in key commodities, as % of open interest %
%
40
40
30
30
20
20
10
10
0
0
Agriculture
Gold
WTI
Livestocks
Copper
Apr 14
Mar 14
Feb 14
Jan 14
Dec 13
Nov 13
Oct 13
Sep 13
Aug 13
Jul 13
Jun 13
May 13
-10
Apr 13
-10
Natural gas
Source: US Commodity Futures Trading Commission.
Henry Hub natural gas’s OIV decreased further by 4.9% m-o-m to 1,107,492 contracts in April. Money managers decreased their net length positions again by a hefty 19% to stand at net long positions of 111,963 lots as the winter heating season demand diminished and storage rose to healthy levels.
OPEC Monthly Oil Market Report – May 2014
15
Commodity Markets Table 2.2: CFTC data on non-commercial positions, ‘000 contracts Open interest
Net length
Mar 14
Apr 14
Mar 14
% OIV
Apr 14
% OIV
1,653 1,164 4,418 547 154 712 8,649
1,648 1,107 4,547 526 156 677 8,661
310 138 835 129 -15 209 1,606
19 12 19 24 -10 29 19
317 112 915 88 -13 217 1,636
19 10 20 17 -8 32 19
Crude oil Natural gas Agriculture Precious metals Copper Livestock Total
Source: US Commodity Futures Trading Commission.
Copper’s OIV increased 1.4% m-o-m to 155,833 contracts in April as investors reduced their net shorts by 14% to 12,846 contracts. Nevertheless, weak demand from downstream sectors continued weighing on the recent performance, indicating investor's concerns about the outlook for the metal. Gold’s OIV decreased by 9.6% m-o-m to 367,755 contracts in April. Hedge funds and money managers cut their bullish bets in gold futures and options, as expectations of a stimulus cut by the Federal Reserve dented the metal's appeal as a hedge. Strong US home sales data sent gold prices briefly below key technical support at $1,270 an ounce, paring the gains made on concern about increasing violence in Ukraine. Graph 2.6: Inflow of investment into commodities, 2011-14 US$ bn 140 120 100 80 60 40 20 0 1Q
2Q
3Q
4Q
1Q
2Q
2011 Agriculture
3Q
4Q
1Q
2012 Copper
Gold
2Q
3Q
4Q
2013 Natural gas
1Q 2014
WTI crude oil
Source: US Commodity Futures Trading Commission.
16
OPEC Monthly Oil Market Report – May 2014
World Economy
World Economy Led by an improvement in the developed economies, the recovery in the global economy continues, but risks became apparent recently with industrialized economies also potentially facing some headwinds. US GDP growth in 1Q14 was reported at only 0.1%, and Japan’s ability to counterbalance its recent sales tax increase still remains uncertain amid slowing domestic demand in addition to some slack in exports. Moreover, deceleration in the emerging economies continued with Russia being negatively affected by large capital outflows due to the latest geopolitical developments, and output was also slowing in China and Brazil. India, on the other hand, continues to recover from last year’s considerable slow-down. While global growth risk is currently somewhat skewed to the downside, the global growth forecast for 2014 remains at 3.4%, after growth of 2.9% in the past year. Notable revisions in the current month’s GDP growth expectations took place for the US, falling from 2.7% to 2.4%, while the tenderly improving output growth in the Euro-zone led to an upward revision from 0.8% to 1.0%. Russia’s growth forecast was again revised down from 1.0% to 0.9%. Table 3.1: Economic growth rate and revision, 2013-14, % World
OECD
US
Japan Euro-zone
China
India
Brazil
Russia
2013E*
2.9
1.3
1.9
1.5
-0.4
7.7
4.7
2.3
1.3
Change from previous month
0.0
0.0
0.0
0.0
0.0
0.0
0.0
0.0
0.0
2014F*
3.4
2.0
2.4
1.3
1.0
7.5
5.6
2.0
0.9
Change from previous month
0.0
0.0
-0.3
0.0
0.2
0.0
0.0
0.0
-0.1
* E = estimate and F = forecast.
OECD OECD Americas US The most recent signs indicated solid and mainly consumer-led growth momentum in the US. The labour market improved, wealth factors such as the equity market and the housing market continued rising, and, consequently, consumption followed. The two main factors denting this positive trend were the cold weather in 1Q14 and some weakness in exports, mainly to China. The most recently announced 1Q14 GDP growth number of only 0.1% q-o-q seasonally adjusted annualized rate (SAAR), however, came as a surprise. Moreover, the latest release of trade statistics indicates that the US economy in 1Q14 may have even contracted. The underlying growth trend and particularly the most recent indicators for private household consumption indicate a rebound in 2Q14 and for the rest of the year, but while the negative factors behind the low growth seen in 1Q14 are being considered as temporary, this remains to be seen.
OPEC Monthly Oil Market Report – May 2014
17
World Economy While the 1Q14 number was indeed surprisingly low, the positive aspect of it was again that personal consumption expenditures increased by 3.0% after an already considerable rise of 3.3% in 4Q13. This however seems to have been influenced to a significant extent by healthcare spending due to the Affordable Care Act. Even by adjusting for this effect, consumption shows a good underlying momentum, but it certainly would be lower. Therefore, the GDP dynamic in the current quarter will need close monitoring as the US economy will indeed need a significant rebound in the 2Q to achieve the current full-year growth expectations. For the time being, positive momentum in the labour market, rising equities and continuous improvement in the housing market, together with an ongoing low interest rate environment, continue to support the expectation of a recovery in the remainder of the year from the low rate of expansion in 1Q. The labour market has continued improving. After the unemployment rate stood at 6.7% for the second consecutive month in March, it dropped to 6.3% in April. Also, non-farm payroll additions grew by 288,000 in April, and March numbers were revised up to 203,000. Negatively, the participation rate fell again to a relatively low 62.8%, matching the previous bottom level of December and considerably lower than the March number of 63.2%. On the other side, the share of long-term unemployed has improved again and now stands at 35.3%, after 35.8% in March, and substantially below the 37.0% seen in February. Moreover, the average hourly earnings grew by 2.3% y-o-y in April, comparably higher than the April inflation rate of 1.5%, creating a real net-wealth effect. These positive labour market developments might have contributed to the US Fed’s recent decision to continue its QE tapering by $10 billion. Housing prices, which also constitute a very important wealth factor for US households, have continued to rise, but the levels of the past months’ record price increases are decreasing slightly. Data from the Federal Housing Finance Agency (FHFA) show that 3Q13 price rises of 8.4% y-o-y constituted the peak level, while since then, price rises moved lower to stand at 7.7% in 4Q13 and at 6.9% in February, the latest available number. Given the expectation of further rising interest rates and with mortgages being the most influential financing tool for the sector, this is an area that will need close monitoring in the future. Given the relatively positive developments in the labour market and in household income, consumer confidence was also at high levels recently. The Conference Board consumer confidence index stood at 82.3 in April, only slightly lower than in March, when it stood at 83.9. The University of Michigan consumer sentiment index moved to 84.1 in April from 80.0 in March. This is now the highest level it has reached since July last year, when in 3Q13, the US economy expanded by 4.1%, indeed an encouraging indication.
18
OPEC Monthly Oil Market Report – May 2014
World Economy Graph 3.1: Manufacturing and non-manufacturing ISM indices Index 60
55
50
ISM manufacturing index
Apr 14
Mar 14
Feb 14
Jan 14
Dec 13
Nov 13
Oct 13
Sep 13
Aug 13
Jul 13
Jun 13
May 13
45
ISM non-manufacturing index
Source: Institute for Supply Management.
The purchasing manager’s index (PMI) for the manufacturing sector, as provided by the Institute of Supply Management (ISM), also posted a rising trend once again in April, moving to 54.9 in April after a level of 53.7 in March. Industrial production rose by a healthy 3.8% y-o-y in March, higher than 3.5% y-o-y in February. In addition, the ISM for the services sector, which constitutes more than two-thirds of the economy, rose to 55.2 in April from 53.1 in March. Given the weak 1Q14 GDP growth, the GDP growth forecast for 2014 has been revised down this month from 2.7% to 2.4%. This implies that the US economy will need to expand at more than 3% for the remainder of the year. Based on the latest indicators, this seems to be achievable, but further challenges should not be ruled out entirely as some uncertainties related to exports and domestic consumption remain.
Canada In Canada, improvements continue as well. Industrial production in February expanded by 3.8% y-o-y, slightly higher than the 3.4% y-o-y level of March. The PMI for manufacturing remains almost unchanged at 52.9 in April, after having reached 53.3 in March. The GDP growth expectation for 2014 remains unchanged at 2.3%, after growth of 2.0% in 2013.
OECD Asia-Pacific Japan After a strong recovery, the Japanese economy is facing a very important litmus test as it enters the time after the April sales tax increase. First quarter developments have indicated that consumption has been strong ahead of this event, but historic comparison shows that a sales tax increase is able to considerably drag the economy afterwards. The latest retail data have shown that there is a negative trend in consumption already materializing. While this is widely expected based on past experience, the magnitude of it is relatively uncertain and may also depend on the government’s ability to counterbalance this effect via stimulus measures and through further actions by the Bank of Japan, which will also probably introduce new or extend existing monetary supply facilities. In general, the aim of the government to reduce the large public debt pile with an increase in the sales tax should be considered a necessary move towards a healthier approach to debt management. As the fiscal room to manoeuvre, therefore, becomes more limited, the economy’s structural
OPEC Monthly Oil Market Report – May 2014
19
World Economy improvements will also gain a more important role to play to continue the current progress. The negative impact of the sales tax increase is also coming at a time when Japanese exports are being negatively affected by a slowdown in the emerging markets’ trading partners, particularly China. Export growth fell to a level of only 1.8% y-o-y in March, significantly lower than in February and in January, when exports grew by 9.5% y-o-y and 9.8%, respectively. This sharp drop translates into a monthly decline in exports of 2.7% on a seasonally adjusted base. This, in combination with a monthly drop of 3.4% in January and only a limited increase in February, leads to a decline in exports of 1.2% q-o-q in 1Q14. Domestic demand increased significantly ahead of the sales tax increase in April. Retail trade rose by 11.0% y-o-y in March, by far the largest increase in the last decade. Also, the still very strong labour market, with a remarkably low unemployment rate of only 3.6%, is supportive for consumption. It remains to be seen, however, whether the income will follow as a prerequisite for continued rising consumption as the government was successful so far in its aim to push inflation to a level of 2% by the end of 2014. Inflation stood at 1.6% y-o-y in March. So far, earnings are still lagging as they rose only by 0.4% y-o-y in 1Q14, after an increase of 0.9% y-o-y in 4Q13. Graph 3.2: Japanese consumer price index (CPI) vs. household earnings
Graph 3.3: Consumer confidence index Index
% change y-o-y
48
2%
46
1%
CPI 44
0% 42
-1%
40
Quarterly earnings
-2%
38
1Q 14
4Q 13
3Q 13
2Q 13
1Q 13
4Q 12
3Q 12
2Q 12
1Q 12
Sources: Ministry of Internal Affairs and Communications; Ministry of Health, Labour and Welfare; and Haver Analytics.
Jan 12 Mar 12 May 12 Jul 12 Sep 12 Nov 12 Jan 13 Mar 13 May 13 Jul 13 Sep 13 Nov 13 Jan 14 Mar 14
36
-3%
Sources: Cabinet Office of Japan and Haver Analytics.
Lead indicators have declined considerably. The latest PMI numbers, as provided by Markit, show that the manufacturing PMI in February stood at only below the 50 level in April at 49.4, after 53.9 in March. Also, the domestically very important services sector indicates a contraction. It stood at only 46.4 in April, significantly lower than in March, when it reached a level of 52.2. Moreover, consumer confidence also fell considerably to an index level of only 36.9 in March, from 37.6 in February. This compares to an average level for 2013 of 43.4. These indicators point to the uncertain consequences of the sales tax increase, while, at the same time, exports are also decelerating. The GDP growth estimate for 2014 remains unchanged at 1.3%, below last year’s growth level of 1.5%. Developments in domestic demand will need particularly close monitoring in the coming months to decide upon the feasibility of achieving this level.
20
OPEC Monthly Oil Market Report – May 2014
World Economy South Korea Growth in South Korea seems to be improving. Industrial production rose by 2.5% y-o-y in March, after it stood at only 1.6% y-o-y in February. Additionally, the composite leading index of the National Statistical Office, reached a new record high of 118.0 in March. The manufacturing PMI remained at 53.7 in April, compared to 47.0 in February. The growth forecast for 2014 remains unchanged at 3.1%, but given the slow-down in some of South Korea’s main trading partners in Asia, the growth pattern will need close monitoring.
OECD Europe Euro-zone Economic development in the Euro-zone is gradually improving. Output levels have improved broadly – albeit from very low levels in the past year – not only in the main economies, but even more so in the less strong peripheral economies. While Germany is leading the rebound, Italy and Spain – the third and fourth largest economies – have improved too. Mainly France is still lagging. It will be seen when it starts to expand at a higher level, but a fully-fledged recovery in the Euro-zone will definitely need its second-largest economy also to recover. Importantly, the smaller peripheral economies are also improving. Greece has just recently accessed the sovereign bond market successfully again, and Portugal has announced that it is leaving the emergency financing programme by 17 May. The two countries remaining under the support umbrella are now Greece and Cyprus. Furthermore, Greece has recently issued a 5-year bond below 5% of interest at the magnitude of €3 billion. Despite this success, the International Monetary Fund (IMF) has warned recently that the Euro-zone economies should not get complacent about this development as many uncertainties remain, and while the situation has improved significantly, it remains fragile, particularly in the bond market. While output levels have risen recently, one concern has been the low inflation level over the past months. While the European Central Bank’s (ECB) target is an inflation of around 2%, inflation in March fell to a level as low as 0.5% y-o-y. In April, it increased again to a level of 0.7% y-o-y. This low level has been highlighted by many observers to be risky as it might also turn negative and lead to a deflationary level. This assumption was calling for a more aggressive monetary supply policy by the ECB, including measures of quantitative easing. So far, the ECB has not decided to pursue these bold supply measures as it expected inflation to again edge up considerably in the medium term, but it hinted at the possibility of doing so at its upcoming June meeting. The current tender recovery may – positively - also lead to wage inflation as unemployment is falling. Furthermore, income levels seem to have bottomed out in the past months and rising wages should lead to higher core inflation. Moreover, most of the falling inflationary pressure has come from economies that had to adjust their income levels in order to increase their competitiveness. Therefore, while the core economies are currently facing relatively low inflation, deflation has so far been a phenomenon of selective peripheral economies, as can be seen below.
OPEC Monthly Oil Market Report – May 2014
21
World Economy Table 3.2: Inflation rates from selected countries in the Euro-zone Germany
France
Italy
Spain
Netherlands
Austria
1.5% 1.2%
1.4% 1.1%
1.0% 0.9%
0.1% -0.2%
0.9% 0.6%
2.0% 1.8%
Portugal
Greece
Ireland
Cyprus
Euro-zone
0.1% -0.2%
-0.6% -1.5%
0.7% 0.9%
-0.4% 0.2%
1.1% 0.9%
Feb 14 Mar 14
Feb 14 Mar 14
Source: OPEC Secretariat.
It is, however, worrisome to some extent that in most of the economies, inflation fell from February to March, but as the Euro-zone’s total inflation moved up in April, according to the first estimate, the country-specific inflation level should also be higher in most cases. Another factor to be considered here is the strong euro, which currently makes imports to the Euro-zone relatively cheap. Industrial output, excluding construction in Germany, expanded by a considerable 2.0% y-o-y in March, lower than the 3.8% y-o-y from February. Also, Spain posted a solid yet lower number of 1.2% y-o-y compared to 2.7% y-o-y in February, still a significant improvement after a decline of 0.5% in January, signalling that the economy is continuing to recover. Lending of financial intermediaries to private households has remained at around the same rate of decline in March as in February. It fell by 2.6% y-o-y, and while this is still negative on a yearly comparison, it came off its low of -3.2% in November. Graph 3.5: Euro-zone CPI and lending activity % change y-o-y
Sources: Markit and Haver Analytics.
0%
0%
-2%
-1%
-4%
CPI (LHS)
Apr 14
1%
Oct 13
Apr 14
Mar 14
Feb 14
Jan 14
Dec 13
Nov 13
Oct 13
Sep 13
Aug 13
Jul 13
Jun 13
Apr 13
May 13
46
2%
Apr 12
48
2%
Oct 11
50
4%
Apr 11
52
3%
Oct 10
Services
Oct 09
54
6%
Apr 10
Manufacturing
% change y-o-y
4%
Apr 09
56
Apr 13
Index
Oct 12
Graph 3.4: Euro-zone PMI indices
MFI lending (RHS)
Sources: Statistical Office of the European Communities, European Central Bank and Haver Analytics.
The continued high unemployment rate of 11.8% in March, the same level as in February, is a hurdle that remains a significant challenge to the economy for a faster recovery. The difference in unemployment rate levels continues to also highlight the varying speeds of recovery within the Euro-zone. Lead indicators still confirm some unevenness of the Euro-zone’s growth pattern. The latest PMI for manufacturing, as provided by Markit, stood at 53.1 in April, around the same level as in March. It reached 54.1 in Germany and moved slightly lower to 51.2 in France. In Italy, it reached 54.0, considerably higher than the March number of 52.4.
22
OPEC Monthly Oil Market Report – May 2014
World Economy The recovery in the Euro-zone has gained some traction lately, and the GDP growth forecast for 2014 has therefore been revised up to 1.0% from 0.8%, but given the continued fragility, many uncertainties remain, and the ongoing development will need close monitoring.
UK The United Kingdom’s most recent economic performance shows continued improvement and stands above the average level of most of its fellow EU countries. Industrial production increased by 2.8% y-o-y in February, higher than the January level of 2.4% y-o-y. PMI for manufacturing stood at a significant level of 57.4 in April, after 55.8 in March. The important services PMI also rose to a considerably higher level again. It reached 58.7 in April, after it had already stood at 57.6 in March. This positive development has again led to an upward revision in the 2014 GDP growth forecast, which now stands at 2.4%, 0.1 percentage points higher than in the last month.
Emerging and Developing Economies After revising it down from 2.3% to 2.0% last month, the forecast for Brazil’s GDP growth rate in 2014 is unchanged this month at 2.0%. The downward pointing signals of this month clearly suggest that this figure is skewed to the downside. However, these signals still need to be thoughtfully monitored until after the World Cup, before coming up with a further revision. Economic and political uncertainty has pushed capital out of Russia in 1Q14 at an estimated record level. The recent overall trend in economic indicators remains unpromising this month, combined with the ongoing geopolitical uncertainty in the region. Pressured currency and rising inflation could dampen consumer spending. Russia’s GDP growth in 2014 has been slightly reduced this month to 0.9%. It should be noted, however, that any forecast related to the 2014 GDP growth of Russia should have a wide range of risk due to the uncertainty over the path that geopolitical developments might take. Table 3.3: Summary of macroeconomic performance of BRIC countries GDP growth rate 2013E* 2014F* Brazil Russia India China
2.3 1.3 4.7 7.7
2.0 0.9 5.6 7.5
Consumer price index, % change y-o-y
Current account balance, US$ bn
Government fiscal balance, % of GDP
Net public debt, % of GDP
2013
2014
2013
2014
2013
2014
2013
2014
6.2 6.8 10.0 2.6
6.0 5.6 7.9 2.8
-81.4 33.3 -49.2 188.6
-77.5 19.5 -58.7 178.2
-3.2 -0.5 -5.6 -1.8
-4.0 -0.4 -5.3 -1.9
56.8 8.1 52.0 16.3
58.1 8.1 52.2 16.9
Source: OPEC Secretariat, Economic Intelligence Unit and Financial Times. *E = estimate and F = forecast.
Despite the excitement and uncertainty of the general election that is currently underway (the results of which will be known on 16 May 2014), the activity data in India continue to disappoint. The momentum in the manufacturing sector held steady, with domestic demand countering a slowdown in export orders. Encouragingly, inflation pressures eased, however that does not mean the Reserve Bank of India (RBI) can take down its inflation guards. China’s economic growth in 1Q14 was weaker than expected as a whole expanding by 7.4% y-o-y. But even this seemingly buoyant figure masks some of the underlying
OPEC Monthly Oil Market Report – May 2014
23
World Economy weakness. It seems momentum is building for Chinese exports to developed markets, signalling a brighter trade environment in 2Q14.
Brazil Exports from Brazil decelerated in April by 4.4% y-o-y. This marks the second drop in a row. At the same time, sentiment among consumers has shown further deterioration last month. The consumer confidence index reading of April dropped to its lowest since May 2009. This came while the central bank increased its benchmark interest rate by 25 basis points to 11%, aiming to curb inflation. Consumer price inflation increased in March to 5.6% despite the tightening cycle implemented since mid-2013. The unemployment rate, on the other hand, stood at 5.0% in March, far below the corresponding month in the past few years. Graph 3.6: Brazilian inflation vs. interest rate % per annum 12 11.0
9
Source: Banco Central do Brasil, Instituto Brasileiro de Geografia e Estatística and Haver Analytics.
105 Jul 13 105.8
May 09 102.1
100 95
Apr 14 104.2
Oct 13
Apr 14
Oct 12
Apr 13
Apr 12
Oct 11
90 Apr 11
Apr 13 May 13 Jun 13 Jul 13 Aug 13 Sep 13 Oct 13 Nov 13 Dec 13 Jan 14 Feb 14 Mar 14 Apr 14
7
National consumer price index (LHS) Selic rate (RHS)
115 110
8 5
Nov 13 114.7
Oct 10
5.8
120
Oct 09
5.6
10
Apr 10
6
125
Oct 08
7
11
Apr 09
10.8
Index 130
Apr 08
% change y-o-y 8
Graph 3.7: Brazilian consumer confidence index, NSA
Sources: Fundação Getúlio Vargas and Haver Analytics.
Business expectations in Brazil’s services sector reported a steep decline in April. The services PMI dropped last month to its lowest mark in three months. It posted 50.4 in April, from 51.0 a month earlier. Survey participants reported an increase in new orders, although there were mentions that tough economic conditions had weighed on growth. Business conditions in the Brazilian goods-producing economy deteriorated last month. Production was lowered in line with falling new orders, and companies cut their workforces as a consequence. The HSBC manufacturing PMI fell to 49.3 in April, down from 50.6 in March, the lowest reading in nine months. The survey signalled that export orders were broadly unchanged from March levels, while the general new business was lower. The recent deceleration captured in April’s PMI on the softening of the majority of its components suggests that the Brazilian economy lost momentum as it entered 2Q14.
24
OPEC Monthly Oil Market Report – May 2014
World Economy Graph 3.8: Brazilian unemployment rate
Graph 3.9: HSBC Brazil manufacturing PMI Index 51
% 7.0 6.5
Mar 11 6.5
Mar 12 6.2
51
Mar 13 5.7
6.0
Mar 14 50.6
50 Mar 14 5.0
5.5
50
5.0 49
Sources: Instituto Brasileiro de Geografia e Estatística and Haver Analytics.
Apr 14
Mar 14
Jan 14
Feb 14
Dec 13
Nov 13
Oct 13
Sep 13
Aug 13
Jul 13
Jun 13
Apr 13
Mar 14
Dec 13
Sep 13
Jun 13
Mar 13
Dec 12
Sep 12
Jun 12
Mar 12
Dec 11
48
Sep 11
3.5
Jun 11
49
Mar 11
4.0
Apr 14 49.3
May 13
4.5
Sources: HSBC, Markit and Haver Analytics.
After revising it down from 2.3% to 2.0% last month, the forecast for Brazil’s GDP growth rate in 2014 is unchanged this month at 2.0%. The downward pointing signals of this month clearly suggest that this figure is skewed to the downside. However, these signals still need to be thoughtfully monitored until after the World Cup before coming up with a further revision.
Russia Standard & Poor’s cut Russia’s credit rating last month following the $64 billion capital outflow in 1Q14. The rating agency lowered Russia’s sovereign debt rating to BBB-, the lowest investment grade that is just above junk status. Moreover, the new rating indicates a negative outlook as the tense geopolitical situation could lead to further money outflows of domestic and foreign capital. Last month, the central bank raised the interest rate for the second consecutive month. The key rate increased by 50 basis points to 7.5%. This move was aimed at taming the inflationary pressures from currency depreciation and lending support to the currency. Inflation jumped in April to 7.3%, from 6.9% in March. This marks the first breach to the 7.0% inflation rate since May 2013 and would put a limiting factor on the country’s household consumption. Retail sales were on an upward trend during February and March, growing by 4.0% y-o-y in March, from 3.9% y-o-y in February. Still, however, the growth in retail sales is less than the March 2013 figure of 4.5% and remained fluctuating under the 5.0% growth level since November 2012.
OPEC Monthly Oil Market Report – May 2014
25
World Economy Graph 3.10: Russian consumer price index
Graph 3.11: Russian retail sales, NSA
% change y-o-y
% change y-o-y
8%
8 7.3% 6.9%
7%
7 6
Nov 12 5.0 Mar 13 4.5
5 6%
Mar 14 4.0
4 3
Sources: Federal State Statistics Service and Haver Analytics.
Jan 14
Mar 14
Nov 13
Sep 13
Jul 13
May 13
Mar 13
Jan 13
Nov 12
Jul 12
Sep 12
Mar 12
2
May 12
Apr 13 May 13 Jun 13 Jul 13 Aug 13 Sep 13 Oct 13 Nov 13 Dec 13 Jan 14 Feb 14 Mar 14 Apr 14
5%
Sources: Federal State Statistics Service and Haver Analytics.
The unemployment rate posted 5.4% in March, notably lower than the same month of last year when it registered 5.7%. Industrial production increased at a slower rate of 1.4% in March, down from a 2.1% increase in the previous month. The Russian manufacturing sector continued to contract in April with the HSBC manufacturing PMI posting 48.5 last month, slightly up from 48.3 in March. This extends the downturn in the country’s goods-producing sector to a sixth successive month. All the main variables — output, new orders, exports, employment, backlogs and purchasing — continued to decline last month. In the meantime, the survey showed that inflationary pressures remained sharp, heavily linked to the weakening rouble exchange rate. Input price inflation eased slightly, but output price inflation hit a three-year high. Graph 3.12: Russian unemployment rate
Graph 3.13: Russian industrial production
% change y-o-y
% change y-o-y
6.5
6 4
Mar 13 5.7
6.0
2.1 1.4
2
5.5 Mar 14 5.4
5.0
0 -2
Mar 14
Jan 14
Nov 13
Sep 13
Jul 13
May 13
Mar 13
Jan 13
Nov 12
Sep 12
Jul 12
May 12
Apr 14
Feb 14
Dec 13
Oct 13
Aug 13
Apr 13
Jun 13
Feb 13
Oct 12
Dec 12
Aug 12
Jun 12
Apr 12
Sources: Central Bank od the Russian Federation and Haver Analytics.
Mar 12
-4
4.5
Sources: Federal State Statistics Service and Haver Analytics.
Economic and political uncertainty has caused a capital outflow from Russia in 1Q14 at an estimated record level. The recent overall trend in economic indicators remains unpromising this month combined with the ongoing geopolitical uncertainty in the region. Pressured currency and rising inflation could dampen consumer spending. Our forecast for Russia’s GDP growth in 2014 is slightly reduced this month to 0.9%. It should be noted, however, that any forecast related to the 2014 GDP growth of
26
OPEC Monthly Oil Market Report – May 2014
World Economy Russia should have a wide range of risk due to the uncertainty over the path that the geopolitical developments might take.
India After months of weakness and disappointment, industrial production (IP) finally gained meaningfully in January due to increasing consumer goods production. A second strong harvest was expected to boost rural demand and help engineer some turnaround in the IP cycle in January. Unfortunately, February IP thwarted those hopes. IP slumped 2.2% y-o-y, seasonally adjusted (SA), giving up all the gains incurred in January (+6%, y-o-y, SA). In terms of trade deficit, on the face of it, a widening trade deficit in March should add to the IP gloom. But there are important caveats. First, the trade deficit widened from an excessively low $9.7 billion, SA, in February to a still-very-contained $14.5 billion, SA. To put this in perspective, such a run-rate of the monthly trade deficit is consistent with an annual current-account deficit of just over 1% of GDP. Secondly, the deficit widened for the “right reasons.” Non-oil (petroleum, petroleum products and related material import growth was +17.7% y-o-y in March from -3.1% in February) and nongold (gold import growth was -18.4% y-o-y in March from -75.7% in February), which have been sluggish in recent months, reflecting weak demand impulses in India, surged for the second time in three months.
US$ mn
Mar 12 May 12 Jul 12 Sep 12 Nov 12 Jan 13 Mar 13 May 13 Jul 13 Sep 13 Nov 13 Jan 14 Mar 14
Graph 3.14: Indian merchandise trade balance
Graph 3.15: Indian industrial production breakdown % change y-o-y 20%
-6,000 10%
Feb 14
-8,000
2.2% -2.2% -3.9%
0% -10,000
-18,000 -20,000 Sources: Ministry of Commerce and Industry and Haver Analytics.
Total
Feb 14
Nov 13
Aug 13
May 13
Feb 13
Nov 12
Aug 12
-16,000
-20%
May 12
-14,000
-10%
Feb 12
-12,000
Manufacturing
Food products Sources: Central Statistical Organisation of India and Haver Analytics.
India’s GDP growth has been under 5% for the past seven quarters, while manufacturing output has fallen on a monthly basis for the past three months. Most hopes for a recovery are now pinned on a change of government. Judging by recent record-high share prices, financial markets are expecting the probable winner, Modi’s opposition Bharatiya Janata Party (BJP), to improve business conditions.
OPEC Monthly Oil Market Report – May 2014
27
World Economy Graph 3.16: Indian GDP components at market prices % change y-o-y 25% 20% 15%
Private consumption Government consumption GFCF Exports Imports
Graph 3.17: Indian GDP growth, SAAR % change y-o-y 12 10.2 10
8.3
8
6.8
10%
6
4.9
5%
3.4
4
0%
Avg. 2013 4.7%
5.8 3.9 2.9
2
-5%
0
-10% 1Q 2Q 3Q 4Q 1Q 2Q 3Q 4Q 2012
1Q 2Q 3Q 4Q 1Q 2Q 3Q 4Q 1Q 2Q 3Q 4Q 2011
2013
Sources: Central Statistical Organization of India and Haver Analytics.
2012
2013
Sources: National Informatics Centre (NIC) and Haver Analytics.
The easing inflation trend in 1Q14 has been largely driven by moderating food price pressures, but with seasonal factors kicking in, food prices appear to have reached their bottom, and further deceleration in food inflation is unlikely. India’s consumer price index (CPI) and wholesale price index (WPI) would likely re-accelerate in the next few months due to firm food prices and sticky core inflation. As it turned out, headline CPI inflation rose to 8.3% in March, from 8.05% in February. In fact, the WPI re-accelerated more than markets had expected, printing at 5.7% y-o-y, hurt by an unfavourable base effect and the fact that food prices increased more than high-frequency data had suggested. Graph 3.18: Indian inflation vs. repo rate % 12 10 8 6 4 2 0 Apr 13 May 13 Jun 13 Jul 13 Aug 13 Sep 13 Oct 13 Nov 13 Dec 13 Jan 14 Feb 14 Mar 14 Apr 14 Repo rate
Consumer price index (CPI)
Wholesale price index (WPI)
Sources: Ministry of Commerce and Industry, Reserve Bank of India and Haver Analytics.
A sharp narrowing of the current account deficit and a partial return of foreign capital has helped the Indian currency to strengthen in January–March 2014, with the Indian Rupee (INR) gaining around 4.00% vis-à-vis the US dollar between end-January and end-March. The rapid improvement in the current account has started gradually waning, with merchandise exports now showing contraction from a year ago. However, imports also continued to fall in January and February, reflecting weak domestic demand and contributing to sustained improvement in the trade balance, but
28
OPEC Monthly Oil Market Report – May 2014
World Economy in March, some progress was seen. As long as import demand remains weak, the fundamental support to the rupee from the narrowing current account will keep the currency stable. The Reserve Bank of India (RBI) is expected to intervene in order to prevent an overvaluation or avoid sharp depreciation pressures leading to the INR to be traded more range-bound (with liquidity estimates suggesting FX intervention to the tune of $7−8 billion in the month of March alone). If this persists, the INR is likely to come under pressure again. Graph 3.19: Indian current account balance US$ mn 0
1Q 2Q 3Q 4Q 1Q 2Q 3Q 4Q 12 12 12 12 13 13 13 13
Graph 3.20: Indian rupee average quarterly exchange rate Rate 85
% 0.0
80
-5,000
-1.0
-10,000
-2.0
70
-3.0
65
-4.0
60
-15,000 -20,000
75
-5.0
55
-25,000
-6.0
50
-30,000
-7.0
45
-35,000
-8.0
1Q 12
2Q 12
Current account balance (LHS) As a percent of GDP (RHS)
3Q 12
4Q 12
1Q 13
2Q 13
INR/US$
3Q 13
4Q 13
1Q 14
INR/EUR
Sources: Reserve Bank of India and Haver Analytics.
Sources: Reserve Bank of India and Haver Analytics.
Despite the excitement and uncertainty of the general election that is currently underway (the results of which will be known on 16 May), the activity data in India continue to disappoint. The momentum in the manufacturing sector held steady, with domestic demand countering a slowdown in export orders. However, a build-up in finished goods inventories could weigh on output growth in coming months in the absence of a pick-up in demand. Encouragingly, inflation pressures eased, but that does not mean that the RBI can take down its inflation guards. Graph 3.21: Indian PMIs Index 58 56 54 52
51.26
50
49.47 48.52
48 46
Manufacturing PMI
Composite PMI
Apr 14
Mar 14
Feb 14
Jan 14
Dec 13
Nov 13
Oct 13
Sep 13
Jul 13
Aug 13
Jun 13
May 13
Apr 13
Mar 13
Feb 13
Jan 13
Dec 12
Nov 12
Oct 12
Sep 12
Aug 12
Jul 12
Jun 12
May 12
Apr 12
44
PMI services and activity
Sources: HSBC, Markit and Haver Analytics.
OPEC Monthly Oil Market Report – May 2014
29
World Economy The reform momentum is stalled for a protracted period even following the formation of a new government after the May 2014 elections, which would translate into weaker investment recovery, lower foreign capital inflow, higher inflation and slower growth recovery. GDP growth is expected to remain unchanged at around 5.6% in 2014, but perhaps high inflation, sluggish investment and private consumption have become the main drag on growth.
China Growth in China slowed to 7.4% y-o-y in 1Q14, with a q-o-q growth rate of just 1.4%, the weakest growth rate since 4Q08. Net trade subtracted 1.4 percentage points (pp) from growth following a poor export performance. The contribution from investment slowed to 3.1 pp from 4.1 pp in 4Q13. Despite a fall in retail sales growth from 18.6% yo-y at the end of December to 13.5% y-o-y in March, the contribution from consumption actually increased sharply, from 3.9 pp to 5.7 pp. This makes the path for consumption this year particularly hard to forecast. A poor trade performance coupled with weak investment is behind the slowdown, while consumption growth was strong despite moderating retail sales. Growth expectations for GDP were left unchanged for this year at 7.5%, with consumption unable to make up for a weaker impetus from the external sector. There are upside risks to this forecast if the authorities lose their nerve and pursue a more traditional credit stimulus towards the end of the year. According to a State Council meeting related to the ‘mini stimulus’ subject in early April 2014, the package included extensions to existing tax breaks on small businesses, drawing attention to some of the infrastructure spending measures set out in China’s urban development plan (which stretches to 2020), and lowering the reserve requirement ratio for rural financial institutions. The government quickly switched to calling it a ‘new economic package’ to divert accusations of another credit-fuelled stimulus. The inflation rates of newly-constructed residential and commercial properties have been steadily moderating in most of the major cities. With a bank run at a small cooperative bank in March, the possibility of a slump in property prices leading to a wider banking crisis remains as China negotiates its way to a slower growth path. Graph 3.22: China yuan renminbi exchange rate to the US$ CN¥/US$
Graph 3.23: Chinese GDP growth, SAAR
Sources: State Administration of Foreign Exchange and Haver Analytics.
30
7.4
7.8
7.7
7.7
7.5
7.9
7.6
7.4
8.9
5
8.1
6.05
9.2
6
Apr 14
6.10
Feb 14
7
Dec 13
6.15
Oct 13
8
Aug 13
6.20
Jun 13
9
Apr 13
6.25
Feb 13
10
Dec 12
6.30
Oct 12
11
9.8 9.5
% change y-o-y
6.35
1Q 2Q 3Q 4Q 1Q 2Q 3Q 4Q 1Q 2Q 3Q 4Q 1Q 2011
2012
2013
2014
Source: China's National Bureau of Statistics and Haver Analytics.
OPEC Monthly Oil Market Report – May 2014
World Economy Sharp moves in China’s currency over the past few weeks have led to great uncertainty about the near-term prospects for the renminbi and the future of the exchange rate regime. Looking at the recent volatility, the renminbi is seen to now be more or less at its equilibrium value. In mid-March, the People’s Bank of China (PBoC) announced a move to widen the exchange rate band to 2% around its midpoint, from 1%. This followed a surprise depreciation of the renminbi over the previous few weeks. The exchange rate has since fallen further, to 6.25 against the dollar, taking the level back to that of March 2013. Like many things in China, the move has more than one aim. It is to stop the one-way bet on China’s currency through the carry trade. It is also a further step towards the liberalization of China’s capital account after the January 2014 Yuan appreciated to the level of February 2013. Chinese exporters are seeing stronger demand from developed markets, indicating that expected trade strengthening that failed to materialize in 1Q may help sustain growth this quarter. According to data issued by China’s General Administration for Customs, exports to the EU and US surged, growing by 15.1% y-o-y and 12% y-o-y, respectively; together, the two trade partners account for one-third of Chinese export demand. Export growth rates to Hong Kong, India, Korea and Taiwan also improved relative to a month prior, although trade with Hong Kong still shows negative growth due to false-invoicing issues from last year that authorities curtailed in May. Monthly exports to Australia and ASEAN decelerated, although they still experienced positive growth. In cumulative terms, exports to all partners except Hong Kong (which had data reliability issues through April 2013) grew by 5.4% y-o-y through April 2014. The final reading of the China Manufacturing PMI stabilised at 48.3 in April, up slightly from 48.1 in March. The latest data implied that domestic demand contracted at a slower pace but remained sluggish. Meanwhile, both new export orders and employment sub-indices contracted and were revised down from the earlier flash readings. These indicate that the manufacturing sector and the broader economy as a whole continue to lose momentum. Over the past few days, Beijing has introduced more reform measures, which could support growth by inducing more private sector investment. Bolder actions will be required to ensure the economy regains its momentum. Graph 3.24: Chinese PMIs
Graph 3.25: Chinese industrial production
Index
% change y-o-y
54
11%
52
51.4 10%
50
Mar 14 8.7%
49.5 9%
48
48.1
Sources: HSBC, Markit and Haver Analytics.
Apr 14
Feb 14
Dec 13
Oct 13
Aug 13
Apr 13
Jun 13
Feb 13
Dec 12
Oct 12
Aug 12
7%
Apr 12
Composite PMI Manufacturing PMI Services business activity
Feb 14 8.5%
8%
Jun 12
Apr 14
Mar 14
Feb 14
Jan 14
Dec 13
Nov 13
Oct 13
Sep 13
Aug 13
Jul 13
Jun 13
May 13
46
Sources: China National Bureau of Statistics and Haver Analytics.
The banking crisis could lead to a sharp slowing in GDP growth. The government deficit is expected to remain below 3% of GDP, but the economy will be supported by low-inflationary pressure, a pick-up in export growth and high external debt.
OPEC Monthly Oil Market Report – May 2014
31
World Economy
OPEC Member Countries The non-oil producing private sector in Saudi Arabia showed a further solid improvement in its operating conditions in April. The SABB HSBC PMI posted 58.5 in April, up from 57.0 in March. The survey highlighted a faster growth rate in both output and new work orders. The robust figures are mainly attributed to improving economic conditions. The survey also showed a fall in input cost inflation to a 43-month low. Meanwhile, the latest survey data signalled a further rise in inventories of raw materials and other pre-production materials. A renewed rise in job creation was reported, following a month of fractional job shedding. Inflation in Angola slowed to 7.3% in March, down from 7.5% in February 2014. This makes more room for a possible cut in lending rates to spur investment. The benchmark interest rate has been unchanged at 9.25% since November 2013. The government expects a 9% expansion in the country’s non-oil industries this year. In Ecuador, the non-oil producing sector led economic growth in 2013 by advancing 4.9% y-o-y. Despite the slowdown of GDP growth in 4Q13 to 1.2% y-o-y, the 2013 figure stood at a strong rate of 4.5%, driven mainly by gross fixed capital formation and exports. The manufacturing PMI in the United Arab Emirates (UAE) increased to an all-time high of 58.30 in April 2014 from 57.70 in March 2014. It averaged 54.77 from 2011 until 2014. Sharp output and new order growth boosted the headline PMI in April, with the respective rates of expansion the highest and joint-second highest on record. Activity rose amid reports of increased order intakes and improving market conditions, while higher sales team efforts and a good economic environment were the main reasons behind the strong rise in new business. Stronger demand led to the latest solid rise in employment levels at the UAE’s non-oil private sector companies, with 15% of the survey panel reporting increased workforce numbers. In line with the trend for total new orders, new export business rose markedly. The rate of growth in new export orders accelerated since March and was only fractionally weaker than February’s series high. Graph 3.26: Saudi Arabia and UAE: manufacturing PMIs Index 65
60
58.5 58.3
55
Saudi Arabia
Apr 14
Mar 14
Feb 14
Jan 14
Dec 13
Nov 13
Oct 13
Sep 13
Aug 13
Jul 13
Jun 13
May 13
Apr 13
Mar 13
Feb 13
Jan 13
Dec 12
Nov 12
Oct 12
Sep 12
Aug 12
Jul 12
Jun 12
Apr 12
May 12
50
UAE
Sources: SAAB, HSBC, Markit and Haver Analytics.
Other Asia In Indonesia, the Central Bureau of Statistics announced the 1Q GDP growth of 5.2% y-o-y, while market estimates averaged at 5.6%. The government last month announced plans to cut its GDP growth in 2014 to 5.8% y-o-y, down from 6.0%. Last
32
OPEC Monthly Oil Market Report – May 2014
World Economy year, the Central Bank of Indonesia implemented the most aggressive rate-tightening cycle in eight years. This policy has helped curb the current account deficit and put a ceiling on inflation. The tightening policy, however, has impacted investment. Investment increased by 14.6% y-o-y in 1Q, slower than last year’s 27%. This, in turn, is to have a negative effect on lending. Indonesia’s Financial Services Authority plans a bank lending target growth of about 17% for this year, compared with 22% last year. In addition, the moderation in the demand for commodity exports will put additional pressure on growth in 2014. Furthermore, the decision to ban exports of raw mineral ores as of January 2014 has affected the economic growth in 1Q14. Mining and quarrying have contracted by 0.4% y-o-y in 1Q. During April 2014, the operating conditions in Indonesia’s manufacturing economy showed its strongest rate of improvement in 11 months. The manufacturing PMI rose to 51.1 in April, up from 50.1 in March. Manufacturers indicated that recent floods, combined with the elections and shortages of some raw materials, led to falling output in April. However, the survey signalled a faster increase in incoming new orders and a return to growth in both staffing numbers and stocks of purchases. In Taiwan, operating conditions among manufacturers signalled the eighth successive monthly improvement in overall business conditions during April. The manufacturing PMI stood at 52.3 last month, down from 52.7 in March. The survey showed a decrease in the pace of output growth, but it remains solid. Total new business and new export orders both rose at faster rates in April. Vietnam’s manufacturing economy showed a strong expansion last month, with the PMI rising to 53.1, from 51.3 in March. The latest reading of the index represents a new series record on the back of record rises in new orders and purchasing activity. Job creation returned to growth among manufacturers last month, whereas cost inflation quickened at the sharpest pace since September 2013. Graph 3.27: Manufacturing PMIs in Other Asia Index 56 53.1 52.3
54 52
51.1 49.7
50 48 46 44
Indonesia
Taiwan
Vietnam
Apr 14
Mar 14
Feb 14
Jan 14
Dec 13
Nov 13
Oct 13
Sep 13
Aug 13
Jul 13
Jun 13
May 13
Apr 13
Mar 13
Feb 13
Jan 13
Dec 12
Nov 12
Oct 12
Sep 12
Aug 12
Jul 12
Jun 12
May 12
42
Hong Kong
Sources: HSBC, Markit and Haver Analytics.
Africa In South Africa, a three-month strike in the platinum industry together with higher imports of oil pushed the trade balance into a deficit in March 2014. The South African Revenue Service announced that the trade deficit reached 11.4 billion rand
OPEC Monthly Oil Market Report – May 2014
33
World Economy ($1.1 billion) compared with a surplus of 647 million rand in February 2014. The country posted a current account deficit of 5.8% of GDP last year. The government forecasts a gap of 5.9% of GDP this year. The country’s PMI dropped last month to a 10-month low, signalling a deterioration in operating conditions. This is the first contraction in 8 months. The headline PMI dropped from 50.3 in March to 47.4 in April, the lowest reading more than last two years. The survey showed the second successive monthly fall in activity during April and the sharpest since last September. Furthermore, new business intakes also declined in April showing the fastest pace of contraction in South Africa’s PMI history, while the rate of cost inflation was the weakest since December of last year. Graph 3.28: Manufacturing PMIs in South Africa and Egypt Index 60 55 50
49.5 47.4
45 40
South Africa
Apr 14
Mar 14
Feb 14
Jan 14
Dec 13
Nov 13
Oct 13
Sep 13
Aug 13
Jul 13
Jun 13
May 13
Apr 13
Mar 13
Feb 13
Jan 13
Dec 12
Nov 12
Oct 12
Sep 12
Aug 12
Jul 12
Jun 12
May 12
35
Egypt
Sources: Investec, IPSA, Markit, Reuters Telerate and Haver Analytics.
In Egypt, operating conditions deteriorated in April for the second month running. The PMI decreased slightly to 49.5 in April from 49.8 a month earlier. The survey showed a marginal contraction in output with a further deceleration in the intakes of new orders, while new export business had a sharper drop.
Latin America Mexico posted a $1.03 billion trade surplus in March as higher shipments of manufactured and agricultural goods offset a decline in petroleum exports and increased imports. Exports rose by 4.5% y-o-y to $33.314 billion, as non-oil sales advanced 6.9%, while oil shipments fell 11.1%. In 1Q14, exports increased by 2.9% y-o-y, and imports rose at a faster 3%. The country’s trade deficit increased to $1.19 billion. The central bank left the benchmark interest rate unchanged at 3.5% for the fifth consecutive month. Inflation in Mexico slowed to a five-month low of 3.5% in early April. Inflation expectations for 2014 have been revised downward, while those for the longer term have remained stable. The central bank noted that after a weak start of the year, economic growth was improving on rising exports and increased public spending. The manufacturing sector in Mexico showed a slight improvement in April with the PMI at 51.8, up from 51.7 in March.
34
OPEC Monthly Oil Market Report – May 2014
World Economy Graph 3.29: Mexico’s manufacturing PMI Index 58 56 54
51.8 51.7
52 50 48
Apr 14
Mar 14
Feb 14
Jan 14
Dec 13
Nov 13
Oct 13
Sep 13
Aug 13
Jul 13
Jun 13
May 13
Apr 13
Mar 13
Feb 13
Jan 13
Dec 12
Nov 12
Oct 12
Sep 12
Aug 12
Jul 12
Jun 12
May 12
46
Sources: Markit and Haver Analytics.
In Argentina, foreign direct investment decreased to $445.09 million in 4Q13, down from $777.64 million in 3Q13. Foreign direct investment in Argentina averaged $603.03 million from 2003 to 2013. Moody’s rating agency downgraded the rating of Argentina’s public debt by one step to Caa1, citing the increased risk to debt service for government bonds given a significant deterioration in the country’s foreign exchange reserves. Inflation, on the other hand, increased by around 2.6% m-o-m in March 2014, while it increased by nearly 10% when compared to the last month of 2013. In Peru, the unemployment rate decreased to 6.9% in March, down from 7% in February 2014, whereas inflation grew to 3.5% y-o-y in April, from 3.4% y-o-y a month earlier.
Transition region In Hungary, the central bank cut its benchmark interest rate last month by 10 basis points to 2.5%. Last year’s cut in the household utility prices by a total of 20% has played a significant role in reducing inflation. Consumer price inflation eased by 0.1% y-o-y in March. Hungary’s manufacturing PMI rose to 54.6 in April, from 53.7 in March, according to seasonal adjustment data. The PMI index has expanded since July of last year. The new orders index went up slightly in April and was the fifth highest value for the month since 1995. Poland’s manufacturing PMI remained in the expansion territory in April, though it fell to 52.0 from 54.0 in March. April’s reading of the index marks the lowest since July 2013. Growth rates for production, new orders, new export business and purchasing activity all slowed for the second month running, while employment in the goodsproducing sector also increased at a weaker pace. The latest survey results also indicated an absence of inflationary pressures. In April, the Czech manufacturing PMI rose to 56.5, from 55.5 in the preceding month, signalling a robust improvement among manufacturers.
OPEC Monthly Oil Market Report – May 2014
35
World Economy Graph 3.30: Manufacturing PMIs in transition region Index 60 58 56 54 52 50 48 46 44
56.5 54.6
Czech Republic
Hungary
Apr 14
Mar 14
Feb 14
Jan 14
Dec 13
Nov 13
Oct 13
Sep 13
Aug 13
Jul 13
Jun 13
May 13
Apr 13
Mar 13
Feb 13
Jan 13
Dec 12
Nov 12
Oct 12
Sep 12
Aug 12
Jul 12
Jun 12
May 12
52.0
Poland
Sources: HALPIM, HSBC, Markit and Haver Analytics.
Oil prices, US dollar and inflation In April, as in the previous month, the US dollar was relatively resilient compared to its major currency counterparts on average. Interesting developments were once again observed in the emerging market currencies. While the slight decline of the yuan continued, the Indian rupee also continued its recovery from its decline that started last year and remained at a level of only slightly above INR60/$. Compared to the major currencies, the US dollar changed only slightly on a monthly average. Compared to the euro, the US dollar fell by 0.1% in April and stood at a monthly average of $1.3812/€. Versus the Japanese yen, it gained 0.3% to reach ¥102.564/$. Compared to the pound sterling, it fell again for the fifth consecutive month by 0.7%, while compared to the Swiss franc, it increased by 0.1%. With the ongoing recovery in the US, the tapering of the US Fed, the expectation of continued monetary stimulus from the ECB and the ongoing efforts to stimulate the economy by the BoJ, and given the current slow-down in the emerging markets, the US dollar should be expected to appreciate in the coming months. However, capital inflows into the peripheral economies of the Euro-zone have kept the euro unexpectedly strong so far. In nominal terms, the price of the OPEC Reference Basket (ORB) remained almost unchanged. It rose by a monthly average of $0.12/b, or 0.1%, from $104.15/b in March to $104.27/b in April. In real terms, after accounting for inflation and currency fluctuations, the ORB rose by 0.4%, or $0.27/b, to $62.34/b from $62.07/b (base June 2001=100). Over the same period, the US dollar remained flat against the importweighted modified Geneva I + US dollar basket * while inflation fell by 0.3%.
* The ‘modified Geneva I+US$ basket’ includes the euro, the Japanese yen, the US dollar, the pound sterling and the Swiss franc, weighted according to the merchandise imports of OPEC Member Countries from the countries in the basket.
36
OPEC Monthly Oil Market Report – May 2014
World Oil Demand
World Oil Demand World oil demand is forecast to grow by 1.14 mb/d in 2014, unchanged from the previous month’s report, to average 91.2 mb/d, despite minor adjustments to data for 1Q14, accounting for most recent developments. In 2013, world oil demand is estimated to have grown by 1.05 mb/d to average 90.01 mb/d, also in line with the previous month’s assessment. The bulk of growth came from the non-OECD region, as most of the OECD still showed a contraction. Table 4.1: World oil demand in 2013, mb/d Change 2013/12 Growth % 0.33 1.39 0.36 1.92 -0.17 -1.23 -0.23 -2.63 -0.07 -0.15
Americas of which US Europe Asia Pacific Total OECD
2012 23.62 18.84 13.77 8.58 45.97
1Q13 23.73 18.98 13.22 8.94 45.89
2Q13 23.79 18.96 13.81 7.80 45.40
3Q13 24.19 19.43 13.87 8.05 46.11
4Q13 24.08 19.44 13.50 8.65 46.23
2013 23.95 19.20 13.60 8.36 45.91
Other Asia of which India Latin America Middle East Africa Total DCs
10.86 3.65 6.27 7.59 3.47 28.19
10.91 3.82 6.21 7.74 3.58 28.45
11.08 3.69 6.47 7.70 3.58 28.83
11.11 3.55 6.75 8.14 3.43 29.43
11.13 3.74 6.55 7.66 3.62 28.97
11.06 3.70 6.50 7.81 3.55 28.92
0.20 0.05 0.23 0.22 0.08 0.73
1.84 1.34 3.60 2.96 2.41 2.60
FSU Other Europe China Total "Other regions"
4.41 0.64 9.74 14.80
4.33 0.63 9.79 14.75
4.18 0.59 10.19 14.95
4.57 0.63 9.91 15.10
4.81 0.71 10.38 15.90
4.47 0.64 10.07 15.18
0.06 -0.01 0.33 0.38
1.32 -0.80 3.38 2.58
Total world Previous estimate Revision
88.96 88.96 0.00
89.09 89.09 0.00
89.17 89.18 0.00
90.64 90.64 0.00
91.10 91.10 0.00
90.01 90.01 0.00
1.05 1.05 0.00
1.18 1.18 0.00
Totals may not add up due to independent rounding.
Table 4.2: World oil demand in 2014, mb/d Change 2014/13 Growth % 0.19 0.78 0.15 0.79 -0.16 -1.15 -0.12 -1.43 -0.09 -0.20
Americas of which US Europe Asia Pacific Total OECD
2013 23.95 19.20 13.60 8.36 45.91
1Q14 23.90 19.23 13.09 8.85 45.84
2Q14 23.95 19.05 13.55 7.74 45.23
3Q14 24.39 19.56 13.74 7.91 46.05
4Q14 24.29 19.57 13.38 8.47 46.14
2014 24.13 19.36 13.44 8.24 45.82
Other Asia of which India Latin America Middle East Africa Total DCs
11.06 3.70 6.50 7.81 3.55 28.92
11.10 3.85 6.45 8.06 3.64 29.26
11.28 3.76 6.71 7.98 3.64 29.61
11.37 3.68 6.99 8.48 3.49 30.33
11.39 3.86 6.79 7.95 3.68 29.81
11.29 3.79 6.74 8.12 3.61 29.76
0.23 0.09 0.24 0.31 0.06 0.83
2.05 2.37 3.68 3.92 1.77 2.89
FSU Other Europe China Total "Other regions"
4.47 0.64 10.07 15.18
4.39 0.64 10.06 15.09
4.24 0.58 10.54 15.36
4.64 0.64 10.27 15.54
4.88 0.72 10.70 16.30
4.54 0.64 10.39 15.58
0.07 0.01 0.33 0.40
1.50 0.82 3.25 2.63
Total world Previous estimate Revision
90.01 90.01 0.00
90.19 90.19 0.01
90.21 90.21 0.00
91.92 91.92 0.00
92.25 92.24 0.00
91.15 91.15 0.00
1.14 1.14 0.00
1.27 1.27 0.00
Totals may not add up due to independent rounding.
OPEC Monthly Oil Market Report – May 2014
37
World Oil Demand Graph 4.1: Quarterly world oil demand growth tb/d 2,000 1,500 1,000 500 0 -500 -1,000 -1,500 1Q
2Q
3Q
4Q
1Q
2Q
3Q
4Q
1Q
2Q
3Q
2012
2013
2014
OECD
Non-OECD
Total world
4Q
OECD Americas US oil demand grew by 0.16 mb/d during the first four months of 2014 to stand at 19.1 mb/d, continuing an upward trend that began in the second half of 2013. Higher projected economic growth for the year is the substantial factor behind the current careful optimism for overall 2014 total oil demand growth. Nevertheless, there are also a number of factors that may impose negative effects on oil demand, such as the higher baseline in 2013, increasing vehicle fuel efficiencies, together with decreasing vehicle sizes and fuel substitution, notably with natural gas in the industrial and residential sectors. However, the risks for 2014 US oil demand are seen skewed more to the upside. Graph 4.2: US oil consumption, y-o-y changes tb/d 1,500 1,000 500 0 -500 -1,000
All other
Distillates
Apr 14
Mar 14
Feb 14
Jan 14
Dec 13
Nov 13
Oct 13
Sep 13
Jul 13
Gasoline
Aug 13
Jun 13
Apr 13
May 13
Mar 13
Jan 13
Feb 13
Dec 12
Nov 12
Oct 12
Sep 12
Jul 12
Aug 12
Jun 12
Apr 12
May 12
Mar 12
Jan 12
Feb 12
-1,500
Total oil
In the first four months of 2014, all main US product categories, with the exception of residual fuel oil and propane/propylene, rose, the bulk of which was seen in industrial and transportation fuels, especially distillates, gasoline and jet/kerosene. These figures are in line with the positive developments witnessed in improving industrial production and the economy. Continuous shrinkage in residual oil demand was once more implied by the substitution of natural gas.
38
OPEC Monthly Oil Market Report – May 2014
World Oil Demand Canada’s oil demand during the first quarter of 2014 was influenced by the colder winter, compared with last year and the seasonal norm, implying solid growth in heating fuels. Moreover, naphtha usage in the petrochemical industry was seen to be on the rise, while, during the same time-frame, demand for transportation fuels was stagnant, compared with 2013. The 2014 outlook for Canada’s oil demand is optimistic, the result of a forecast improvement in the economy. Mexico’s oil demand declined by 0.1 mb/d to 2.1 mb/d during the first quarter of 2014, as a result of a weakening economy and lower industrial production, especially reduced fuel oil and distillate demand. Nevertheless, Mexico’s oil demand is expected to recover later in the year and grow slightly – the main driver being the country’s automotive industry, which is closely dependent on sales to the US. As for 2014, the overall oil demand picture for the OECD Americas is unchanged from the previous month’s expectation with oil demand growth increasing by 190 tb/d.
OECD Europe Europe is the OECD region that has suffered the sharpest declines in oil demand during the last years, due to pending debts in a number of countries in the region and rigorous taxation on oil usage, mostly road transportation. Taxation policies on oil usage are expected to continue and most likely increase to also cover other sectors of the economy, which require oil usage, such as air transportation, and the residential and industrial sectors. The year 2014 will be no exception in these developments and will most probably mark another year of falling oil usage in Europe, although by a smaller volume compared with the previous three years. In the European Big Four, 2014 oil demand is projected to decline slightly with only the UK and Germany being in the positive. Table 4.3: Europe Big 4* oil demand, tb/d LPG Gasoline Jet/Kerosene Gas/Diesel oil Fuel oil Other products Total
Mar 14 384 1,029 745 3,146 305 1,053 6,662
Mar 13 434 1,046 724 3,201 327 962 6,694
Change from Mar 13 -50 -16 21 -54 -22 90 -32
Change from Mar 13, % -11.5 -1.6 2.8 -1.7 -6.8 9.4 -0.5
* Germany, France, Italy and the UK.
Latest Big Four available oil demand data for 1Q14 is in line with these forecasts as data for the 1Q shows a decline of more than 0.12 mb/d or around 2%. The only products seen on the rise are jet/fuel kerosene and gasoline - the latter only slightly while distillate and fuel oil requirements are declining. A similar picture can also be observed during the 1Q14 for the remaining countries of the region with declines being significantly sharper in South European nations. Weak oil demand in OECD Europe also implied shortages in the region’s refinery capacity during 2013, influencing a number of main oil-consuming countries, such as France and the UK. Data for the month of March indicates a slight decline in oil consumption in the Big Four consumers in Europe. With positive growth in the UK compensating for losses in Germany, France and Italy, oil demand declined by around 32 tb/d or just around 0.5%.
OPEC Monthly Oil Market Report – May 2014
39
World Oil Demand Some recent positive developments, however, offer optimism for likely future upward oil demand growth adjustments, such as the growth in passenger car sales for seven consecutive months from September 2013 to March 2014 and the gradual improvement in the economies of a number of countries with budget deficits. Finally, the extremely low baseline in oil demand, which has been continuously declining since 2010, could be another factor for higher oil demand growth. The overall risk for 2014 OECD oil demand growth is hence rather balanced both to the upside and to the downside. For OECD Europe, oil demand in 2014 is projected to again decrease, but at a lesser extent of 0.16 mb/d.
OECD Asia Pacific In Japan, with data up to March 2014, this year’s oil demand has been determined by slightly falling requirements in the direct use of fuel and crude oil for electricity generation, as a result of increasing substitution with natural gas and most recently coal. Declining oil usage for electricity generation, however, had been partly offset by higher naphtha and LPG demand for the petrochemical industry, in addition to strong demand for distillates for the industrial and transportation sectors. This pattern is expected to continue for the whole of 2014. However, total oil consumption in Japan grew both on a cumulative basis and for the month of March, increasing by slightly more than 20 tb/d in cumulative terms and recording exceptional growth in March, surging by more than 0.21 mb/d. The petrochemical industry will remain the driver of Japanese oil demand growth, while a number of nuclear plants for electricity generation, set to restart operations during the second half of 2014, are accounted for. The risk for 2014 Japanese oil demand growth adjustments are skewed more to the upside, depending largely on the number of nuclear plants that will come back online. Table 4.4: Japanese domestic sales, tb/d LPG Gasoline Naphtha Jet fuel Kerosene Gas oil Fuel oil Other products Direct crude burning Total
Mar 14 513 1,005 721 104 442 658 694 80 202 4,418
Change from Mar 13 48 79 -55 19 60 61 2 2 -1 213
Change from Mar 13, % 10.2 8.5 -7.1 22.8 15.7 10.2 0.2 2.3 -0.7 5.1
South Korea’s oil demand declined slightly by 0.03 mb/d to stand at 2.0 mb/d during 1Q14, compared with the same period in 2013. Additions in naphtha and jet fuel requirements have been more than offset by declines in other product demand, notably fuel and distillates. South Korean oil demand is, however, expected to recover during the remaining three quarters of 2014 and mark a slight overall growth for 2014, as a result of optimistic economic expectations. Hence, taking into consideration small additional oil demand volumes from Australia, New Zealand and Other OECD Asia Pacific countries, overall demand in the region is expected to decline in 2014, with uncertainties weighing more to the downside and largely depending on the development of Japanese oil demand and growth from the petrochemical industry.
40
OPEC Monthly Oil Market Report – May 2014
World Oil Demand For the OECD Asia-Pacific, oil demand in 2014 is projected to again decrease but to a lesser extent than in 2013, dropping by an anticipated 0.12 mb/d.
Other Asia In India, oil consumption had a mixed performance in 1Q14. The year started negatively, before bouncing back to positive growth in February and March. 1Q oil demand saw growth by 31 tb/d, around 0.8%, y-o-y. Growth was apparent in all products with the exception of fuel oil and diesel oil, which continued their sluggish performance. Fuel oil fell by more than 38 tb/d – or more than 11% - as compared with 1Q 2013. This was a result of switching from fuel oil to natural gas for some fertilizing companies. The product also declined during the month of March by 7 tb/d – or more than 2% – y-o-y. Graph 4.3: Changes in Indian oil demand, y-o-y tb/d 500 400 300 200 100 0 -100 -200
LPG
Gasoline
Kerosene
Fuel oil
Mar 14
Feb 14
Jan 14
Dec 13
Oct 13
Nov 13
Sep 13
Jul 13
Aug 13
Jun 13
Apr 13
Diesel oil
May 13
Mar 13
Jan 13
Feb 13
Dec 12
Nov 12
Oct 12
Sep 12
Aug 12
Jul 12
Jun 12
May 12
Apr 12
Mar 12
Feb 12
Jan 12
-300
Other products
Diesel oil’s performance was similar to fuel oil. Demand for the product in March declined on both a cumulative and monthly basis, which was a continuation of a downward trend that started early in 2013. Diesel oil demand fell by 24 tb/d and 27 tb/d on a cumulative and monthly basis, respectively. The two figures translated to just more than 1.5% as compared with their respective time-frame in 2013. A deceleration of diesel vehicle sales statistics, an enhanced power situation, heavy rains, the switching of industrial customers to other fuels for economic viability and the higher base line for 2013, were all factors contributing to the decline. On the other hand, consumption of LPG, gasoline and jet/kerosene rose cumulatively and on a monthly basis. LPG rose by 54 tb/d – or just below 11% – on a cumulative basis, supported by a pick-up in residential usage as logistical constraints eased, an increased number of subsided cylinders, as well as the low base line of 2013. Additionally, gasoline demand increased cumulatively by almost 6%, encouraged by expectations of declining inventories in response to likely downward price revisions, as well as an upsurge in demand for two-wheeler sales, which consume gasoline as a fuel. Two-wheeler sales reached 1.3 million units in March alone – that is growth of more than 20%. Moreover, on a cumulative basis, jet fuel benefited from increased passenger goods traffic, which lifted demand for the product into the positive by approximately 0.5%, as compared with the same quarter in 2013.
OPEC Monthly Oil Market Report – May 2014
41
World Oil Demand The main risks for 2014 Indian oil demand are pointing more towards the downside, as a result of the country’s fiscal concerns. The overall forecast remains unchanged since last month’s report ‒ with growth expectations of around 0.10 mb/d. India’s total consumption averaged 3.86 mb/d during 1Q14. Table 4.5: Indian oil demand by main products, tb/d LPG Gasoline Kerosene Diesel oil Fuel oil Other products Total oil demand
Mar 14 600 438 279 1,477 273 845 3,912
Mar 13 532 422 272 1,504 279 872 3,881
Change 69 16 7 -27 -7 -27 31
Change, % 12.9 3.7 2.7 -1.8 -2.4 -3.1 0.8
In Indonesia, latest available data for the month of February 2014, in addition to cumulative statistics (for the months of January and February only), highlight a solid development in oil demand figures, as compared with a year earlier. Cumulatively, oil consumption growth was higher by 60 tb/d, which equates to more than 4% y-o-y. Total products consumed so far in 2014 stood at around 1.36 mb/d. Growth was led by fuel oil, other products – mainly naphtha – and LPG, signifying development in industrial purposes, in addition to the residential sector. Indonesian oil demand is closely related to the ongoing budget deficits, which implicitly may curb subsidies for petroleum products and hence oil demand. Taiwan’s oil demand declined notably in February, losing almost 53 tb/d, as compared with February 2013. Cumulatively (with data for the month of January and February only), the picture is of a lesser decline as January data provided support. Cumulatively, the bulk of the decrease originated in fuel oil, jet/kerosene, gasoline and LPG usage, while diesel oil and other products experienced growth. Lower-than-expected activities in the aviation sector led to a reduction in related product consumption. On the other hand, a healthy petrochemical industry supported naphtha demand. Risks for 2014 oil demand in Other Asia have not changed since the previous month’s report and are skewed more to the downside, as a result of economic concerns in India and elsewhere in the region, mainly related to subsidies’ reduction. As for 2014, oil demand in the region is forecast to be 0.23 mb/d higher than in 2013.
Latin America Total oil consumption in Brazil averaged 2.40 mb/d on a cumulative basis for 2014 (cumulative basis here refers to January and February 2014 only) after hitting the highest total consumption levels in February. Total oil demand in Brazil recorded more than 2.51 mb/d of consumption in February, 0.25 mb/d higher y-o-y. For the first two months of the year, oil demand grew by 0.16 tb/d more than the level seen in 2013 - or more than 7%. Gains were witnessed across the whole of the product pool with the exception of fuel oil. Transportation fuels, namely gasoline and ethanol, were the products seen increasing the most with rises of more than 15% and 21%, respectively. Looking at the related car sales indicator for the same period, car sales dropped in January by 4% y-o-y before setting a substantial increase in February by close to 10%.
42
OPEC Monthly Oil Market Report – May 2014
World Oil Demand In aggregate terms, car sales rose by more than 5% y-o-y. Another significant development during the first two months was the increased consumption of diesel which gained close to 90 tb/d or more than 9%, boosted by a pick-up in construction activities ahead of the World Cup event in June. Demand for the most consumed product in Brazil is expected to remain relatively intact throughout 1Q and 2Q. Fuel oil had a mixed performance, declining considerably in January – by more than 25% - and increasing by more than 8% in February, mainly as a result of more fuel oil being burned in the power sector, due to a lack of hydropower. In cumulative terms, demand for the product fell by more than 11% y-o-y. Oil demand in Brazil is expected to pick up in 2Q, again largely due to the World Cup in June, which is expected to provide support to transportation fuels. Demand is anticipated to moderate thereafter as expectations for the Brazilian economy in general is to grow by around 2%; hence oil demand growth is expected to reach 0.14 mb/d, relatively unchanged from last month’s MOMR. Table 4.6: Brazilian inland deliveries, tb/d Feb 14
Feb 13
Change
Change, %
LPG Gasoline Jet/Kerosene Diesel Fuel Oil Alcohol
223 773 127 1,046 110 228
218 672 120 959 102 188
5 101 7 88 8 40
2.3 15.1 6.1 9.1 8.2 21.4
Total
2,508
2,258
250
11.0
In Argentina, oil consumption for the first two months of 2014 increased by around 15 tb/d, or more than 2% on accumulative basis. Gasoline, jet/kerosene, fuel oil and other products all recorded gains during the months of January and February, while LPG and diesel oil declined. Fuel oil led the gains, increasing by more than 12%, despite the falling trend of industrial production indicators. The surge in fuel oil consumption was most likely due to a shortage in the power sector. Transportation fuels were also seen on the rise with both gasoline and jet kerosene increasing, hinting towards an improvement in the sector. Diesel oil consumption was almost flat, as compared with last year. Oil demand in the country is anticipated to continue as initially expected - growing by around 22 tb/d from the 2013 level. Latin America’s oil demand growth is expected to reach 0.24 mb/d in 2014, as compared with a growth level of 0.23 mb/d a year earlier.
Middle East Oil demand growth in the Middle East in 2014 is expected to reach 0.31 mb/d, up from the estimated growth of the previous year of 0.23 mb/d. In Saudi Arabia, oil demand continued rising at a steady pace in early 2014, growing by around 0.12 mb/d or more than 6% for 1Q 2014, as compared with 1Q 2013. Total oil consumption for the same period stood at 2.05 mb/d. Most of the growth originated in industrial and power generation fuels, with fuel oil increasing by around 50 tb/d – or more than 21% – while crude oil utilized for direct burning for power generators also increased by more than 50 tb/d, or 16% y-o-y. The increased usage of these products was mainly focused on the newly commissioned desalinization plant located in the north west of Jubail and an aluminum smelter which commenced operations early this year. Saudi Arabia is expanding its water and electricity sectors to supply a growing
OPEC Monthly Oil Market Report – May 2014
43
World Oil Demand population and an expanding industrial and energy industry, which is expected to provide support to oil consumption. Similarly, transportation fuels witnessed moderate-to-strong gains, while diesel oil’s performance was subdued. Gasoline and jet kerosene increased by 3% and 12% respectively, y-o-y, highlighting the significant pick-up in the aviation sector. Expectations for oil consumption in the Kingdom will remain intact in 2Q and 3Q, before easing slightly towards the end of the year. Fuels for power generation will be maximized through the summer air conditioning season, in addition to an expected improvement in transportation fuels, coinciding with Ramadan and the Hajj season. Other countries in the region, such as Iraq, the UAE and Kuwait, are also witnessing strong demand growth, largely due to improving economic activities in their respective countries. Demand growth increased by 62 tb/d in Iraq, 40 tb/d in the UAE and by 15 tb/d in Kuwait, compared with the same period last year. Oil demand growth in the Middle East is anticipated to hit 0.29 mb/d in 2014, as compared with a growth level of 0.23 mb/d in 2013. Graph 4.4: Oil demand growth in the Middle East, y-o-y tb/d
tb/d
350
350
300
300
250
250
200
200
150
150
100
100
50
50
0
0
-50
-50 1Q12
2Q12
Saudi Arabia
3Q12
4Q12
Iran, I.R.
1Q13 Kuwait
2Q13
3Q13 UAE
4Q13 Others
China In China, despite the easing pace of the economy, the growth in oil consumption has remained steady at around 270 tb/d in 1Q14, compared with 340 tb/d in the same quarter last year. The bulk of this growth was focused on the country’s expanding transportation and petrochemical sectors. Leading to higher fuels’ consumption. jet/kerosene consumption grew the highest, in percentage terms, for 1Q14, increasing by 18%, while gasoline increased the most in terms of total demand growth, rising by more than 0.17 mb/d, as compared with the same period in 2013. In support of the latter, sales of passenger cars in February enjoyed rapid y-o-y growth of 18%, indicating healthy demand for passenger cars. The passenger car market is currently performing well since consumers are buying bigger gasoline-fueled vehicles. Also, the government's decision to eliminate subsidies for small, fuel efficient cars has speeded the trend since last year. In the petrochemical sector, where naphtha and LPG are widely used, consumption for both products rose by around 16% and 13%, respectively, in 1Q14, compared with the
44
OPEC Monthly Oil Market Report – May 2014
World Oil Demand same quarter in 2013, hinting towards adequate demand in the petrochemical industry. Additionally, new tax breaks have been announced for imported naphtha and fuel oil used as a feedstock in the petrochemical sector, in an effort by the government to support petrochemical margins and inspire demand in the sector. Graph 4.5: Chinese gasoil and gasoline demand growth, y-o-y % 25 20 15 10 5 0 -5 -10
Gasoline
Mar 14
Feb 14
Jan 14
Dec 13
Nov 13
Oct 13
Sep 13
Aug 13
Jul 13
Jun 13
May 13
Apr 13
Mar 13
Feb 13
Jan 13
Dec 12
Nov 12
Oct 12
Sep 12
Aug 12
Jul 12
Jun 12
May 12
Apr 12
Mar 12
Feb 12
Jan 12
-15
Gasoil
On the other hand, the slowing economy and industrial reform are hampering consumption of diesel oil, which relies on industrial and agriculture activities. The product fell, on a cumulative basis, by around 94 tb/d or 3% y-o-y with total consumption standing at around 3.43 mb/d. Consumption of diesel in China is expect to demonstrate a sluggish trend, partly because of rising coal imports and reduced domestic mined coal transportation, which is usually by railroad, using diesel. Additionally, diesel trucks are being replaced by other models powered by LPG or LNG. China’s oil demand is forecast to grow this year at the similar pace to 2013 by around 0.33 mb/d. Graph 4.6: Changes in Chinese apparent oil demand, y-o-y changes tb/d
tb/d
1,000
1,000
800
800
600
600
400
400
200
200
0
0
-200
-200
-400
-400
-600 Jan
Feb
Mar
Historical range
Apr
May 2011
OPEC Monthly Oil Market Report – May 2014
Jun
Jul
Aug 2012
Sep
Oct 2013
Nov
-600 Dec 2014
45
World Oil Supply
World Oil Supply Non-OPEC oil supply is estimated to have averaged 54.20 mb/d in 2013, an increase of 1.35 mb/d over a year earlier and 10 tb/d higher than in the previous MOMR, driven by strong growth from OECD Americas. In 2014, non-OPEC oil supply is projected to grow by 1.38 mb/d — up by 10 tb/d from the previous assessment — to average 55.58 mb/d. OPEC NGLs production grew by 90 tb/d to average 5.66 mb/d in 2013 and is forecast to grow by 0.15 mb/d to average 5.81 mb/d in 2014. In April 2014, OPEC production increased by 131 tb/d to average 29.59 mb/d, according to the secondary sources. As a result, preliminary data indicates that global oil supply increased by 160 tb/d in April to average 90.80 mb/d.
Non-OPEC supply Non-OPEC supply experienced upward revisions in all quarters. Non-OPEC supply is estimated to have averaged 54.20 mb/d in 2013, an increase of 1.35 mb/d over the previous year. Non-OPEC supply in 2013 saw strong growth from OECD Americas followed by Former Soviet Union (FSU), Africa, Latin America and China, while all other regions experienced declines. OECD Americas’ oil supply growth is estimated at 1.35 mb/d, up by 70 tb/d over the last MOMR, the highest on record. The largest contracts are seen coming from OECD Europe with 0.20 mb/d, non-OPEC Middle East with 0.11 mb/d, OECD Asia Pacific at 0.09 mb/d and Other Asia at 0.08 mb/d. Graph 5.1: Regional non-OPEC supply growth, y-o-y mb/d
mb/d
1.5
1.5 12/11
13/12
14/13
1.0
1.0
0.5
0.5
0.0
0.0
-0.5
-0.5 OECD America
OECD Europe
OECD Asia Pacific
Other Asia
Latin Middle East America
Africa
FSU
Non-OPEC oil supply in 2013 was revised up from 1.34 mb/d to 1.35 mb/d, due to updated historical data. The supply profile of Thailand was revised down, while upward revisions were made to the US, Malaysia, Bahrain and Egypt. Higher growth in OECD Americas was supported by tight oil developments in the US, while declines in the other regions were driven mainly by political, technical and weather-related factors. There were no changes in 2013 production and supply figures for key non-OPEC countries such as Mexico, Norway, UK, Other Europe, Australia, India, Argentina, Colombia, and China. Regionally, upward revisions were seen in OECD Americas and non-OPEC Middle East, but there were no changes on China, FSU, Africa, Latin America, Other Asia, OECD Asia Pacific and OECD Europe.
46
OPEC Monthly Oil Market Report – May 2014
World Oil Supply According to estimated data, total non-OPEC supply in the 4Q13 increased by 1.60 mb/d over the same period in the previous year. During the first and second half of 2013, non-OPEC supply increased by 0.91 mb/d and 1.78 mb/d, respectively, compared with the same periods a year earlier. On a quarterly basis, non-OPEC supply for 2013 is estimated to at 53.74 mb/d, 53.66 mb/d, 54.14 mb/d and 55.27 mb/d, respectively. Table 5.1: Non-OPEC oil supply in 2013, mb/d
Americas of which US Europe Asia Pacific Total OECD
2012 16.74 10.03 3.77 0.56 21.07
1Q13 17.63 10.61 3.63 0.45 21.71
2Q13 17.60 10.93 3.58 0.50 21.67
3Q13 18.29 11.38 3.46 0.51 22.26
4Q13 18.81 11.76 3.62 0.45 22.88
2013 18.08 11.18 3.57 0.48 22.14
Change 13/12 1.35 1.14 -0.20 -0.09 1.06
Other Asia Latin America Middle East Africa Total DCs
3.65 4.68 1.47 2.31 12.11
3.68 4.73 1.40 2.29 12.11
3.60 4.76 1.32 2.40 12.08
3.48 4.80 1.36 2.44 12.09
3.52 4.84 1.35 2.53 12.24
3.57 4.78 1.36 2.42 12.13
-0.08 0.10 -0.11 0.11 0.02
FSU of which Russia Other Europe China Total "Other regions" Total Non-OPEC production Processing gains
13.26 10.37 0.14 4.15 17.55 50.74 2.12
13.40 10.45 0.14 4.23 17.77 51.58 2.15
13.34 10.47 0.14 4.27 17.75 51.50 2.15
13.34 10.49 0.14 4.15 17.63 51.98 2.15
13.55 10.61 0.14 4.30 17.99 53.11 2.15
13.41 10.51 0.14 4.24 17.78 52.05 2.15
0.15 0.13 0.00 0.08 0.23 1.31 0.04
Total Non-OPEC supply Previous estimate Revision
52.86 52.84 0.01
53.74 53.73 0.00
53.66 53.64 0.02
54.14 54.12 0.01
55.27 55.21 0.06
54.20 54.18 0.02
1.35 1.34 0.01
In 2014, non-OPEC supply is forecast to increase by 1.38 mb/d over the previous year to average 55.58 mb/d. Current supply expectations have resulted in an upward revision of 30 tb/d to total non-OPEC supply compare to the previous MOMR. The revision comes despite the pushing back of the Kashaghan field in Kazakhstan to 2016 from the originally planned 2014. The upward adjustment to total non-OPEC supply was partially due to the carry-over of some revisions introduced to 2013 supply estimates, particularly regarding output from Bahrain and Egypt, as well as upward revisions on first quarter’s supply in the US, Canada, Norway, the UK, Australia, Malaysia, Brazil, Bahrain, Egypt and Azerbaijan. Moreover, new projects scheduled to start-up in 2014, mainly in the US, Canada, Brazil, Norway, the UK, Australia, and Russia as well as other small developments in other non-OPEC oil producers, could add to, or keep production growth steady in 2014. In addition to historical revisions, there were a few offsetting adjustments to the 2014 non-OPEC supply forecast. The total oil supply forecasts for the US, Canada, Norway, the UK, Australia, Indonesia, Egypt and Azerbaijan have been revised up for 2014, whereas the supply predictions of Other OECD Europe, Bahrain and Kazakhstan have been revised down from the previous MOMR. Non-OPEC oil supply decreased by 10 tb/d in April compared with the previous month. On a quarterly basis, non-OPEC supply in 2014 is expected to average 55.54 mb/d, 55.07 mb/d, 55.39 mb/d, and 56.34 mb/d, respectively.
OPEC Monthly Oil Market Report – May 2014
47
World Oil Supply Table 5.2: Non-OPEC oil supply in 2014, mb/d
Americas of which US Europe Asia Pacific Total OECD
2013 18.08 11.18 3.57 0.48 22.14
1Q14 19.00 11.92 3.70 0.50 23.20
2Q14 18.75 11.80 3.46 0.53 22.74
3Q14 19.15 12.10 3.30 0.51 22.95
4Q14 19.60 12.45 3.50 0.49 23.59
2014 19.13 12.07 3.49 0.50 23.12
Change 14/13 1.04 0.89 -0.08 0.03 0.98
Other Asia Latin America Middle East Africa Total DCs
3.57 4.78 1.36 2.42 12.13
3.56 4.84 1.35 2.53 12.27
3.53 4.90 1.36 2.51 12.30
3.54 4.96 1.37 2.51 12.38
3.52 5.09 1.37 2.51 12.49
3.54 4.95 1.36 2.51 12.36
-0.03 0.16 0.00 0.09 0.23
FSU of which Russia Other Europe China Total "Other regions" Total Non-OPEC production Processing gains
13.41 10.51 0.14 4.24 17.78 52.05 2.15
13.50 10.59 0.14 4.25 17.89 53.36 2.18
13.45 10.54 0.14 4.25 17.85 52.89 2.18
13.47 10.56 0.14 4.27 17.88 53.21 2.18
13.61 10.69 0.14 4.32 18.08 54.16 2.18
13.51 10.60 0.14 4.27 17.92 53.41 2.18
0.10 0.09 0.00 0.04 0.14 1.36 0.02
Total Non-OPEC supply Previous estimate Revision
54.20 54.18 0.02
55.54 55.23 0.31
55.07 54.99 0.08
55.39 55.47 -0.08
56.34 56.51 -0.17
55.58 55.55 0.03
1.38 1.37 0.01
OECD Total OECD oil supply in 2013 is estimated to grow by 1.06 mb/d to average 22.14 mb/d, indicating an upward revision of 10 tb/d since the previous report. Output in the fourth quarter reached 22.88 mb/d, with an increase of 1.26 mb/d compared with the same quarter in 2012. The upward revision came from OECD Americas, while other regions were unchanged from the last MOMR. On a quarterly basis, total OECD supply is estimated to average 21.71 mb/d, 21.67 mb/d, 22.26 mb/d, and 22.88 mb/d, respectively. Total OECD output in 2014 is expected to average 23.12 mb/d, the highest level since 2003, indicating an increase of 0.98 mb/d over 2013 and an upward revision of 0.11 mb/d since the previous report. The upward revision came from the good performance in OECD Americas, and OECD Europe, as well as Asia-Pacific in 1Q14. On a quarterly basis, total OECD supply is seen to stand at 23.20 mb/d, 22.74 mb/d, 22.95 mb/d, and 23.59 mb/d, respectively.
48
OPEC Monthly Oil Market Report – May 2014
World Oil Supply Graph 5.2: OECD’s quarterly production
Graph 5.3: OECD’s quarterly production, annual comparison
mb/d
mb/d
24
24 23
23
22 22 21 21 20 20
19 1Q
1Q11 2Q11 3Q11 4Q11 1Q12 2Q12 3Q12 4Q12 1Q13 2Q13 3Q13 4Q13 1Q14 2Q14 3Q14 4Q14
19
2Q
3Q
4Q
2011
2012
2013
2014
OECD Americas OECD Americas oil supply forecasts remain unchanged compared with the previous MOMR. In 2013, OECD Americas is estimated to average 18.08 mb/d, representing growth of 1.35 mb/d over the preceding year. In 2014, supply growth in the region is projected to increase by 1.04 mb/d — below 2013 growth, but still the highest among all non-OPEC regions — to average 19.13 mb/d. Supplies from the US and Canada are expected to grow in 2014, while output from Mexico is estimated to decline by 50 tb/d. On a quarterly basis, supply from OECD Americas is forecast to average 19.00 mb/d, 18.75 mb/d, 19.15 mb/d, and 19.60 mb/d, respectively.
US US total liquids production is estimated to increase by 1.14 mb/d to average 11.18 mb/d in 2013, representing an upward revision of 10 tb/d in terms of level, but with no changes in terms of growth, due to rounding. This revision was due to strongerthan-expected third and fourth quarters’ output. US oil production continued to perform well. US total liquids supply reached 12.28 mb/d in 2013, consisting of crude oil (7.44 mb/d), NGLs (2.56 mb/d), other liquids including biofuels (1.00 mb/d) and refinery processing gains (1.10 mb/d). On quarterly basis, US total liquids production (excluding processing gains) is estimated to average 10.61 mb/d, 10.93 mb/d, 11.38 mb/d, and 11.76 mb/d, respectively. Actual data for total liquids production in February 2014 shows an increase by 70 tb/d to average 11.91 mb/d, compared with January. Nearly 90% of US oil production growth in 2014 is seen coming from Bakken, Eagle Ford, Haynesville, Marcellus, Niobrara and the Permian Basin. The rig-weighted average of these six important areas in April 2014 was 259 b/d, where the maximum was Bakken with 492 b/d and the lowest was Haynesville with only 23 b/d. US crude oil production in February increased by 90 tb/d to average 8.03 mb/d. In North Dakota, the second-largest oil producing state, of which 92% of oil production comes from Bakken, reached an average of
OPEC Monthly Oil Market Report – May 2014
49
World Oil Supply 951 tb/d, a gain of 16 tb/d over January, produced through 9,818 wells, an increase of 79 wells over January. In Texas, total crude oil and condensate output in February increased by 50 tb/d over January at average 2.92 mb/d. The crude oil and condensate produced in Eagle Ford in February grew by 290 tb/d y-o-y to reach 1.21 mb/d, where the Permian basin had steady y-o-y output of 1.23 mb/d. US oil supply is projected to increase by 0.89 mb/d in 2014 — the highest growth among all non-OPEC countries — to average 12.07 mb/d, representing an upward revision of 40 tb/d from the previous MOMR. This revision was supported by estimated higher output in 1Q14. US crude oil production growth, primarily concentrated in the Bakken, Eagle Ford and Permian regions, is expected to continue in 2014 at a slower rate compared to 2013. Offshore production in the US Gulf of Mexico averaged 1.28 mb/d in February, representing a decline of 30 tb/d compared to January and 68 tb/d compared to a year earlier, due to operational issues that caused the Augur and Magnolia systems to be offline. In contrast, the startup of 100 tb/d of production at the Mars B platform and the startup of the 40 tb/d Na Kika phase 3 in February, allowed production to recover in the Gulf of Mexico. Production capacity in the Gulf of Mexico is expected to reach 1.37 mb/d, as another seven projects are expected to come online by the end of 2014. On a quarterly basis, US oil supply in 2014 is forecasted to average 11.92 mb/d, 11.80 mb/d, 12.10 mb/d, and 12.45 mb/d, respectively. Graph 5.4: US quarterly production
Graph 5.5: US quarterly production, annual comparison
mb/d
mb/d
13
13 12
12
11 11 10 10 9 9
8 1Q
1Q11 2Q11 3Q11 4Q11 1Q12 2Q12 3Q12 4Q12 1Q13 2Q13 3Q13 4Q13 1Q14 2Q14 3Q14 4Q14
8
2Q
3Q
4Q
2011
2012
2013
2014
Canada and Mexico Canada’s oil supply is estimated to grow by 0.23 mb/d in 2013 to average 4.01 mb/d, unchanged compared with the previous report. On a quarterly basis, Canada’s supply in 2013 is estimated to average 4.08 mb/d, 3.78 mb/d, 4.02 mb/d, and 4.14 mb/d, respectively. In 2014, Canada’s oil output is forecast to average 4.21 mb/d, representing growth of 0.2 mb/d over the previous year. Forecast production has been revised up as 1Q14 output is reported to be higher than previously expected. Canada’s oil production outlook for 2014 remains steady on a number of oil sands projects which will contribute to the growth in the short term, in particular Kearl, Suncor SAGD, and Christina Lake, as well as shale oil developments. The ramp-up of production from the Kearl oil sands
50
OPEC Monthly Oil Market Report – May 2014
World Oil Supply project, however, remains slower than initially expected. In the first quarter, Canada produced 4.20 mb/d of liquids, consisting of 1.42 mb/d in conventional crude oil, 2.07 mb/d and 0.7 mb/d of NGLs. On a quarterly basis, Canada’s supply in 2014 is expected to average 4.20 mb/d, 4.12 mb/d, 4.20 mb/d, and 4.31 mb/d, respectively. Mexico’s liquids production decreased by 30 tb/d to average 2.89 mb/d in 2013 compared with the previous year, unchanged over the last MOMR. Crude oil production data reported by PEMEX in 2013, shows that the output of the biggest oil producer field of Ku-Maloob-Zaap with approximately rate of 860 tb/d is in plateau phase, while the production at Chuc, Ligero Marino, Antonio Bermudez and Ixtal-Manik are more or less stable. Oil fields such as Cantarell, Delta Grijalva and Aceite Terciario are on the decline. On a quarterly basis, Mexico’s supply is seen to average 2.91 mb/d, 2.87 mb/d, 2.88 mb/d, and 2.90 mb/d, respectively. Mexican oil output is expected to decline by 50 tb/d in 2014 to average 2.84 mb/d, unchanged from last month’s forecast. With continuing output declines from the Cantarell and other matured oil fields, Mexico’s crude oil supply appears to be weaker than in previous years, although supported by a return from maintenance and good performance of Ku-Maloob-Zaap oil field and the startup of new projects. On a quarterly basis, Mexico’s supply is seen to average 2.87 mb/d, 2.82 mb/d, 2.84 mb/d, and 2.83 mb/d, respectively.
OECD Europe Total OECD Europe oil supply averaged 3.57 mb/d in 2013, representing a decline of 0.20 mb/d. In 2014, regional output is expected to decline, but at a slower rate of 0.08 mb/d compared to the previous year to average 3.49 mb/d, implying an upward revision of 50 tb/d over the previous MOMR. Output from the region in 1Q14, particularly from Norway and the UK, is estimated to increase by 0.13 mb/d to average 3.70 mb/d. OECD Europe is expected to see quarterly supply of 3.70 mb/d, 3.46 mb/d, 3.30 mb/d and 3.50 mb/d, respectively. Norway’s oil supply in 2013 declined by 0.08 mb/d from a year earlier to average 1.84 mb/d, unchanged from the previous MOMR. The oil fields of Grane, Gjøa, Alvheim, Heidrun and Fram experienced the main declines in 2013. On a quarterly basis, Norway’s production is seen to average 1.84 mb/d, 1.84 mb/d, 1.80 mb/d, and 1.87 mb/d, respectively. Norway invested approximately $35 billion in upstream, pipe lines and land equipment and facilities in 2013. The same level of investments is planned for this year and is expected to continue into 2018. Norway’s liquids supply is forecasted to decline by 10 tb/d in 2014 to average 1.82 mb/d. Norwegian oil supply in 1Q14 increased by 60 tb/d over the previous quarter to average 1.94 mb/d. In fact, across 1Q14, liquids production was up y-o-y by 100 tb/d, the highest in thirteen years. Over 1.5 mb/d of total production was crude oil, representing the first q-o-q increase since 2Q12. One of the reasons for the higher production in Norway is that an increasing number of wells were drilled using the Mobile Offshore Drilling Unit (MODU). Some 130 wells have been drilled by this method in 2013, an increase of 40 wells over a year earlier and the same number is expected for 2014. The Gudrun gas/condensate field was brought onstream in early April. Liquids production from Gudrun is expected to peak next year at around 65,000 b/d. Meanwhile, maintenance at the Oseberg complex (production around 150 tb/d) in the second quarter (usually May) followed by further
OPEC Monthly Oil Market Report – May 2014
51
World Oil Supply maintenance at Troll, Gulfak, Aasgard and Alveim fields is expected to affect average production in 2Q14 as well as 3Q14. In 1Q14, Norway produced 1.54 mb/d crude oil, 334 tb/d NGLs and 67 tb/d of condensate. The risk to the forecast lies in the ability of producers to limit their production shutdowns in 2014. On a quarterly basis, Norway’s production is seen to average 1.94 mb/d, 1.79 mb/d, 1.71 mb/d, and 1.86 mb/d, respectively. The UK’s oil supply registered an average of 0.87 mb/d in 2013, the lowest level since 1977 in yearly terms, representing a heavy decline of 80 tb/d, although this was approximately 50% of the previous year’s decline. This month’s estimation of the UK supply was unchanged from the previous prediction. The relatively stable profile is helped by improved reliability at the Buzzard field, which has seen a better performance over the year, following increased investment. On a quarterly basis, UK oil output in 2013 is expected to average 0.93 mb/d, 0.89 mb/d, 0.78 mb/d, and 0.89 mb/d, respectively. In 1Q14, total production rose by 80 tb/d to average 0.95 mb/d compare to 4Q13 and 20 tb/d higher than in 1Q13. Until recently, the UK’s mature North Sea fields have seen decline rates averaging around 6% a year. However, oil output slumped by more than 17% in 2011, 14% in 2012, and 8.3% in 2013 to less than 1 mb/d, exacerbated by heavy maintenance and unplanned outages. Projected production in 2014 could be lower than actual production in 2013 by 30 tb/d to average 0.84 mb/d, as supply is likely to experience fewer unplanned shutdowns in 2014 compared with 2013. The Anasuria FPSO, which draws output from four fields, is currently undergoing repairs. The Foinaven field is also likely to undergo maintenance for 30 days. Meanwhile, the Buzzard field will see heavy maintenance in June. These disruptions will impact North Sea output in the coming months, over and above the natural declines in this mature basin. On a quarterly basis, UK oil output in 2014 is expected to average 0.95 mb/d, 0.87 mb/d, 0.75 mb/d and 0.81 mb/d, respectively.
OECD Asia Pacific OECD Asia Pacific oil supply in 2013 is estimated to decrease by 90 tb/d to average 0.48 mb/d, unchanged from the previous report. Australia’s oil supply is likely to decrease by 80 tb/d in 2013 and New Zealand’s production is forecast to decline by 10 tb/d. On a quarterly basis, total OECD Asia Pacific oil supply is estimated to average 0.45 mb/d, 0.50 mb/d, 0.51 mb/d, and 0.45 mb/d, respectively. In 2014, oil supply in the region is estimated to increase by 30 tb/d to average 0.50 mb/d. On a quarterly basis, total OECD Asia Pacific oil supply in 2014 is estimated to average 0.50 mb/d, 0.53 mb/d, 0.51 mb/d, and 0.49 mb/d, respectively. Australia’s oil supply is expected to increase by 30 tb/d to an average output of 0.43 mb/d in 2014, unchanged compared with the last MOMR. Australia’s oil production outlook for 2014 remains steady on expected healthy oil supplies from new startup projects. The Montara field development operation, started in 2013, will boost oil production in 2014. It is expected to ramp-up to a peak of 30 tb/d through subsea wells. Production from other projects including Skua, Swift, and Swallow, will be co-mingled with Montara crude starting in first half 2014. All four fields produce crude with an API
52
OPEC Monthly Oil Market Report – May 2014
World Oil Supply gravity of 35–55 degrees. Probable growth in 2014 is also expected to come from a return to normal output levels. On a quarterly basis, Australia’s oil supply in 2014 is seen at 0.41 mb/d, 0.46 mb/d, 0.44 mb/d, and 0.42 mb/d, respectively.
Developing countries Total developing countries’ (DCs’) oil output reached 12.13 mb/d in 2013, representing growth of 20 tb/d over the previous year and an upward revision of 10 tb/d since the last MOMR. This was mainly due to an upward revision to 2Q13 and 4Q13 output of 12 tb/d and 21 tb/d, respectively. On a quarterly basis, total oil supply in DCs is estimated to average 12.11 mb/d, 12.08 mb/d, 12.09 mb/d, and 12.24 mb/d, respectively. Total DC oil supply is projected to grow by 0.23 mb/d to average 12.36 mb/d in 2014, unchanged from last month’s projection. This growth is mainly supported by Latin America and Africa, while Other Asia’s supply is expected to drop during the year and no changes are expected in non-OPEC Middle East. Growth in 2014 is foreseen after a significant decline in 2013, due mainly to political, technical, and weather-related factors. On a quarterly basis, total oil supply in DCs is projected to average 12.27 mb/d, 12.30 mb/d, 12.38 mb/d, and 12.49 mb/d, respectively. Graph 5.6: Developing Countries’ quarterly production
Graph 5.7: Developing Countries’ quarterly production, annual comparison
mb/d
mb/d
13.0
13.0
12.8
12.8 12.6
12.6
12.4 12.4 12.2 12.2
12.0
12.0
11.8 1Q
1Q11 2Q11 3Q11 4Q11 1Q12 2Q12 3Q12 4Q12 1Q13 2Q13 3Q13 4Q13 1Q14 2Q14 3Q14 4Q14
11.8
2Q 2011 2013
3Q
4Q 2012 2014
Other Asia Other Asia’s oil production is estimated to decrease by 80 tb/d in 2013 to average 3.57 mb/d, representing an upward revision of 10 tb/d from the previous MOMR. The revision came from higher-than-expected output in 4Q13. Other quarters in 2013 were also positively revised. On a quarterly basis, total oil supply in Other Asia is estimated to average 3.68 mb/d, 3.60 mb/d, 3.48 mb/d, and 3.52 mb/d, respectively. Total oil supply from the region is expected to drop by 30 tb/d to average 3.54 mb/d in 2014. Quarterly averages of 3.56 mb/d, 3.53 mb/d, 3.54 mb/d, and 3.52 mb/d are expected in 2014.
OPEC Monthly Oil Market Report – May 2014
53
World Oil Supply India’s oil supply was sustained at 0.87 mb/d in all quarters of 2013 and is expected to decrease by 10 tb/d in 2014 to average 0.86 mb/d, unchanged from the previous report. Thailand’s production in 2013 is expected to grow by 10 tb/d to reach 0.36 mb/d. A minor decline of 20 tb/d is foreseen in 2014 to average 0.35 mb/d. Indonesia’s oil production in the previous year averaged 0.94 mb/d, a decline of 50 tb/d over 2012. A decline of 10 tb/d is expected in 2014 to average 0.93 mb/d, flat from the previous MOMR, despite the fact that Indonesia's oil and gas industry faces difficulties in the form of land clearance issues, high decline rates at producing fields, difficulties in procuring rigs for exploration, and slow processing of operating permits by several regional governments. Aside from a brief resurgence in 2008, the country's oil production has been in steady decline since 1995. Malaysia’s liquid supply is estimated to average 0.66 mb/d in 2013, representing a drop of 10 tb/d compared with 2012. Production ,however, is expected to grow by 20 tb/d to average 0.68 mb/d in the current year. Vietnam’s production in 2013 is seen unchanged from the previous year at an average of 0.39 mb/d and is expected to drop by less than 10 tb/d this year. Brunei’s oil supply in 2013 declined by 20 tb/d to average 0.14 mb/d. A drop of more than 10 tb/d is expected in 2014 to average 0.12 mb/d.
Latin America Latin America’s liquids supply is estimated to grow by 0.1 mb/d in 2013 to average 4.78 mb/d. On a quarterly basis, Latin America’s supply is estimated to average 4.73 mb/d, 4.76 mb/d, 4.80 mb/d, and 4.84 mb/d, respectively. Supply from the region is forecast to grow by 0.16 mb/d to average 4.95 mb/d in 2014, representing the second-highest level of world growth after OECD Americas. Latin America’s 4Q14 total oil supply is expected to pass the 5 mb/d level for the first time. The other producing countries in Latin America are now in decline, and are expected to remain unchanged or see minor declines in 2014, although some growth is expected to come on-stream. On a quarterly basis, Latin America’s supply in 2014 is expected to stand at 4.84 mb/d, 4.90 mb/d, 4.96 mb/d, and 5.09 mb/d, respectively. Brazil’s liquids supply is estimated to average 2.64 mb/d in 2013, indicating an increase of 40 tb/d over the previous year and unchanged from the last MOMR. Continued offshore developments are expected to add production volumes. However, Petrobras is facing significant challenges in maintaining production levels, higher-thanexpected production declines, and a poor level of operational performance from the Campos Basin. Output growth remains marginal despite the start-up of a new FPSO in the Santos basin. The total production in 2013 increased in Roncador, Lula, Peregrino, Bauna, and Baleia Azul, while the oil fields of Marlim Sul, Marlim, Jubarte, Marlim Leste, and Barracuda declined. Updated analysis for total liquids production in Brazil in 2013 on a quarterly basis has been changed to average 2.59 mb/d, 2.63 mb/d, 2.65 mb/d, and 2.71 mb/d, respectively. The revision was due to higher-than-expected production in 4Q13, which resulted in an upward revision to all quarters and a new base for 2014 supply, which will also carry over into all quarters of 2014. Supply is expect to average 2.80 mb/d in 2014, representing growth of 0.15 mb/d and an upward revision of 10 tb/d over the last MOMR.
54
OPEC Monthly Oil Market Report – May 2014
World Oil Supply Total Brazilian liquids supply, including biofuels production, is expected to be revised higher on a quarterly basis to average 2.70 mb/d, 2.74 mb/d, 2.84 mb/d, and 2.90 mb/d, respectively. Colombia’s oil supply in 2013 grew by 70 tb/d, registering 1.03 mb/d. Oil output is expected to slow in 2014 due to more frequent attacks on oil infrastructure by rebel groups. Bomb attacks on the Cano Limon to Covenas and Bicentenario pipelines caused total liquids output to fall to 1.0 mb/d in March. Pipeline attacks are not an unusual event in Colombia, but repairs from the latest incidents have taken more than a month. Meanwhile estimated production in 1Q14 indicates that output did not drop below 1.0 mb/d. Moreover, April’s output is estimated at 1.06 mb/d. Therefore, production is expected to increase this year by 20 tb/d to average 1.05 mb/d. On a quarterly basis, Columbia’s supply is forecasted to average 1.02 mb/d, 1.06 mb/d, 1.02 mb/d, and 1.09 mb/d, respectively.
Middle East Non-OPEC Middle East oil supply is estimated to have decreased by 0.11 mb/d in 2013 from a year ago to average 1.36 mb/d, indicating an upward revision by 10 tb/d over the previous MOMR. On quarterly basis, this region could produce an average of 1.40 mb/d, 1.32 mb/d, 1.36 mb/d, and 1.35 mb/d, respectively. Middle East oil output is forecast to produce 1.36 mb/d, following a downward revision of 10 tb/d since the last MOMR, but growth is expected to remain unchanged in 2014 compared with the previous year. On a quarterly basis, Middle East supply in 2014 is seen averaging 1.35 mb/d, 1.36 mb/d, 1.37 mb/d, and 1.37 mb/d, respectively. Bahrain’s oil output in the third and fourth quarter of 2013 has been revised up by 6 tb/d and 16 tb/d, respectively. Total production in 2013 increased by 20 tb/d to 0.22 mb/d. Production in 1Q14 was also revised up by 19 tb/d to stand at 0.23 mb/d. Yearly output in 2014 is seen declining by 10 tb/d to average 0.21 mb/d. Oman’s supply in 2013 is estimated to increase by 20 tb/d to average 0.94 mb/d, unchanged from the previous estimation. Oman’s output is also expected to increase by 30 tb/d to average 0.97 mb/d in 2014. Syria’s production is expected to drop by 0.12 mb/d in 2013 to average 60 tb/d. This downward movement is due to geopolitical factors. Syrian oil production is expected to drop by another 30 tb/d in 2014. Yemen’s production in 2013 is expected to average 0.14 mb/d, a decrease of 40 tb/d from the previous year. Output in 2014 is expected to increase by 10 tb/d to average 0.15 mb/d, unchanged from last month’s report. However, continued attacks on infrastructure place the supply forecast at a high risk.
Africa Africa’s oil supply is estimated to have averaged 2.42 mb/d in 2013, an increase of 0.11 mb/d from the previous year but unchanged from the previous MOMR. Africa’s frontier plays are seen as offering the majors large-scale conventional light oil discoveries. But the outlook is mixed, with many deepwater pre-salt discoveries featuring low volumes of less desirable natural gas with limited condensates rather
OPEC Monthly Oil Market Report – May 2014
55
World Oil Supply than actual oil. On a quarterly basis, the region’s liquids supply registered an average of 2.29 mb/d, 2.40 mb/d, 2.44 mb/d, and 2.53 mb/d, respectively. The current year’s supply is expected to grow by 90 tb/d, with an upward revision of 10 tb/d compared with last month’s forecast. This could increase average output to 2.51 mb/d in 2014. On a quarterly basis, Africa’s oil supply in 2014 is expected to average 2.53 mb/d, 2.51 mb/d, 2.51 mb/d, and 2.51 mb/d, respectively. Both Sudan and South Sudan are reliant on oil revenue, which accounts for 98% of South Sudan's budget. They have had fierce disagreements over how to divide the oil wealth – at one time production was shutdown for more than a year. Some 75% of the oil lies in the South but all the pipelines run north. Eventually a three-and-a-half-year agreement on access and fees for use of export pipelines was reached. But before production could recover, it was reduced again due to ongoing internal conflicts in South Sudan. The Unity oilfields are shut down and the other fields in Upper Nile are under threat. Furthermore, there has been no significant new oil exploration in South Sudan since the original oilfields were found due to political and security risks. Total production in the Sudans in 2013 declined by 110 tb/d to average 0.23 mb/d. Following a q-o-q increase of more than 80 tb/d in 4Q13 to 0.34 mb/d, the production declined to 0.30 mb/d in 1Q14. In April, based on the preliminary information, output registered 0.29 mb/d. The Sudans total oil output in 2014 is anticipated to compensate its last year’s reduction by 0.11 mb/d to average 0.34 mb/d. On a quarterly basis, total supply in the Sudans is seen averaging 0.30 mb/d, 0.34 mb/d, 0.35 mb/d, and 0.36 mb/d, respectively. Egypt’s oil production in 2013 is estimated to increase 10 tb/d to average 0.72 mb/d, but output in 2014 is expected to drop by 30 tb/d to average 0.69 mb/d. There are no any changes on Chad and South Africa’s oil production growth in 2014, which is seen at 0.13 mb/d and 0.18 mb/d, respectively. Congo’s oil output in 2014 will decline by 10 tb/d – the same as last year – to average 0.25 mb/d. Oil production in Equatorial Guinea is forecasted to grow by 10 tb/d to average 0.33 in 2014. On the contrary, oil output in Gabon in 2014 is expected to decrease by 10 tb/d to average 0.22 mb/d.
FSU, other regions Total FSU oil supply is estimated to increase by 0.15 mb/d in 2013 compare to 2012, to average 13.41 mb/d, unchanged from the last MOMR. On a quarterly basis, total supply from the FSU in 2013 is seen to average 13.40 mb/d, 13.34 mb/d, 13.34 mb/d, and 13.55 mb/d, respectively. FSU oil supply in 4Q13 was higher than in all previous quarters at 13.55 mb/d, representing an increase of 22 tb/d over the same quarter in 2012. FSU’s major oil producers are expected to increase oil supplies in 2014. FSU’s oil output in 2014 is expected to grow by 0.1 mb/d to average 13.51 mb/d. A downward revision of 90 tb/d was made to the growth compare to the last month forecast, due to the pushing back of the Kashaghan project in Kazakhstan to 2016 or probably the second half of 2015. On a quarterly basis, FSU total oil output in 2014 is anticipated to average 13.50 mb/d, 13.45 mb/d, 13.61 mb/d, and 13.51 mb/d, respectively.
56
OPEC Monthly Oil Market Report – May 2014
World Oil Supply
Russia Russia’s liquids output is estimated to increase by 0.13 mb/d in 2013 to average 10.51 mb/d, unchanged from the previous MOMR. Development of natural declines at mature fields played an important role in the outcome of Russia’s 2013 oil supply, as expected new volumes are seen to offset anticipated declines in mature fields. Russia’s supply averaged 10.61 mb/d in the fourth quarter of 2013, representing an increase of 0.24 mb/d over the same period in 2012. On a quarterly basis, Russia’s 2013 supply is estimated to average 10.45 mb/d, 10.47 mb/d, 10.49 mb/d, and 10.61 mb/d, respectively. Enough investment is being made to slow declines in West Siberia and increase production in East Siberia to create small net production increases. Russia’s oil supply forecast in 2014 is facing uncertainty. Nonetheless, upward revisions have been made to the forecast for Russian liquids production in 2014. Total liquids supply is now forecast to rise by 90 tb/d compared with last year’s growth, climbing from 10.51 mb/d in 2013 to 10.60 mb/d in 2014, unchanged from the last MOMR. Developments offsetting declines at mature fields include Vankorskoye, Srednebotuobinskoye, the Talakanskoye group and Arkutun-Dagi. A significant increment is expected from the launch of the offshore Arkutun-Dagi field within the Sakhalin-1 project in the Far East. Russia’s liquids supply on a quarterly basis will average 10.59 mb/d, 10.54 mb/d, 10.56 mb/d, and 10.69 mb/d, respectively. Graph 5.8: Russia’s quarterly production
Graph 5.9: Russia’s quarterly production, annual comparison
mb/d
mb/d
10.8
10.8
10.7
10.7 10.6
10.6
10.5 10.5
10.4
10.4
10.3
10.3
10.2
10.2
10.1 1Q
1Q11 2Q11 3Q11 4Q11 1Q12 2Q12 3Q12 4Q12 1Q13 2Q13 3Q13 4Q13 1Q14 2Q14 3Q14 4Q14
10.1
2Q 2011 2013
3Q
4Q 2012 2014
Caspian Kazakhstan’s oil supply increased by 60 tb/d in 2013 to average 1.64 mb/d, unchanged from the previous MOMR. On a quarterly basis, supply averaged 1.68 mb/d, 1.60 mb/d, 1.61 mb/d, and 1.69 mb/d, respectively. For 2014, total production in Kazakhstan was expected to see a boost from the start-up the giant Kashagan offshore oil field, with output ramping up to 370 tb/d in 2015 from 180 tb/d initially. However, production at the field was halted last October, only weeks after it had started up, as gas leaks were detected on the pipeline that carries the gas from the offshore oil field to a processing plant onshore. Following this disruption, the
OPEC Monthly Oil Market Report – May 2014
57
World Oil Supply consortium developing Kazakhstan's giant Kashaghan oil field has concluded that pipelines carrying natural gas and oil from offshore wells for processing onshore will need to be replaced. Replacing the two 55-mile long pipelines will add to the costs of the project which is already years behind schedule and billions of dollars over budget. The supergiant field is only expected to come on stream in late 2015 or early 2016. The three fields of Tengiz, Karachaganak, and AktobeIn experienced declines through April 2013 to April 2014. The new forecast for Kazakhstan expects production to decline by 20 tb/d to average 1.62 mb/d in 2014, representing a downward revision of 100 tb/d compare to last month. On a quarterly basis in 2014, production is expected to average 1.64mb/d, 1.62 mb/d, 1.60 mb/d, and 1.61 mb/d, respectively. Azerbaijan’s oil output is estimated to decrease by 30 tb/d over the previous year to average 0.87 mb/d in 2013, unchanged from the previous MOMR. Due to the start of production at West Chirag in the Azeri sector of the Caspian Sea, production at the field is expected to reach 80 tb/d, which will be partially offset by declines at the AzeriChirag-Guneshli (ACG) fields. Total output in Azerbaijan in 2014 will average 0.87 mb/d. On a quarterly basis, supply is forecast to average 0.85 mb/d, 0.86 mb/d, 0.88, and 0.89 mb/d, respectively.
China China’s supply is estimated to grow by 80 tb/d in 2013 to average 4.24 mb/d, unchanged from the previous month’s assessment. On a quarterly basis, China’s supply in 2013 is seen to average 4.23 mb/d, 4.27 mb/d, 4.15 mb/d, and 4.30 mb/d, respectively. As mentioned in the February MOMR, new supply coming from offshore developments in 2014, such as Nanpu in the Bohai Bay and the Weizhou and Liuhua Areas of the South China Sea, will be offset by onshore declines from mature assets. Growth for 2014 is expected at 40 tb/d to average 4.27 mb/d, indicating an upward revision of 10 tb, although the 1Q14’s output was 38 tb/d lower than expected. On a quarterly basis, China’s supply in 2014 is forecast to average 4.25 mb/d, 4.25 mb/d, 4.27 mb/d, and 4.32 mb/d, respectively.
OPEC NGLs and non-conventional oils OPEC NGLs and non-conventional oils are estimated to average 5.66 mb/d in 2013, representing growth of 90 tb/d over the previous year. In 2014, OPEC NGLs and nonconventional oil are projected to average 5.81 mb/d, an increase of 0.15 mb/d over the previous year. The 2013 estimation for OPEC NGL growth was revised down by 0.15 mb/d, but the forecast for 2014 growth remains unchanged compared with the last MOMR. In absolute terms, OPEC NGLs were revised down by 0.1 mb/d for both 2013 and 2014. Table 5.3: OPEC NGLs + non-conventional oils, 2011-14
Total OPEC
58
2011 2012 5.37 5.57
Change 12/11 0.20
1Q13 5.63
2Q13 5.56
3Q13 5.77
4Q13 2013 5.66 5.66
Change Change 13/12 2014 14/13 0.09 5.81 0.15
OPEC Monthly Oil Market Report – May 2014
World Oil Supply
OPEC crude oil production According to secondary sources, total OPEC crude oil production averaged 29.59 mb/d in April, an increase of 131 tb/d over the previous month. Crude oil output increased mainly from Iraq, while production fell in other Member Countries. According to secondary sources, OPEC crude production — not including Iraq — stood at 26.29 mb/d in April, an increase of 29 tb/d over the previous month. Table 5.4: OPEC crude oil production based on secondary sources, tb/d Algeria Angola Ecuador Iran, I.R. Iraq Kuwait Libya Nigeria Qatar Saudi Arabia UAE Venezuela Total OPEC OPEC excl. Iraq
2012 1,210 1,738 499 2,973 2,979 2,793 1,393 2,073 753 9,737 2,624 2,359
2013 3Q13 1,159 1,155 1,737 1,720 516 520 2,693 2,678 3,037 2,998 2,822 2,842 928 653 1,912 1,906 732 731 9,584 10,024 2,741 2,780 2,356 2,361
4Q13 1,144 1,714 529 2,705 3,019 2,821 332 1,870 731 9,721 2,743 2,359
1Q14 Feb 14 Mar 14 Apr 14 1,134 1,144 1,126 1,165 1,610 1,641 1,567 1,598 530 530 528 532 2,774 2,786 2,785 2,769 3,219 3,477 3,196 3,298 2,793 2,799 2,778 2,775 364 330 239 238 1,887 1,903 1,876 1,867 730 731 726 738 9,702 9,790 9,556 9,579 2,746 2,744 2,746 2,731 2,341 2,335 2,339 2,304
Apr/Mar 38.8 31.2 3.5 -16.4 102.1 -3.0 -1.5 -8.5 11.5 22.5 -14.3 -35.1
31,132 30,215 30,368 29,688 29,831 30,210 29,462 29,593 28,152 27,178 27,370 26,669 26,611 26,733 26,266 26,295
130.8 28.7
Totals may not add up due to independent rounding.
Table 5.5: OPEC crude oil production based on direct communication, tb/d Algeria Angola Ecuador Iran, I.R. Iraq Kuwait Libya Nigeria Qatar Saudi Arabia UAE Venezuela Total OPEC OPEC excl. Iraq
2012 1,203 1,704 504 3,740 2,944 2,977 1,450 1,954 734 9,763 2,652 2,804
2013 3Q13 1,203 1,202 1,701 1,701 526 534 3,576 3,653 2,980 3,006 2,922 2,992 993 752 1,749 1,824 724 719 9,637 10,115 2,797 2,859 2,786 2,781
4Q13 1,208 1,625 544 3,239 2,915 2,912 332 1,706 725 9,773 2,714 2,851
1Q14 Feb 14 Mar 14 Apr 14 1,202 1,211 1,203 1,190 1,553 1,602 1,446 1,599 553 551 557 560 3,270 3,260 3,300 .. 3,106 3,410 3,089 3,073 2,898 2,917 2,860 2,927 384 405 241 222 1,892 1,885 1,892 .. 725 734 710 701 9,723 9,850 9,566 9,660 2,733 2,701 2,778 2,606 2,875 2,878 2,858 ..
32,429 31,594 32,139 30,543 30,914 31,404 30,498 29,485 28,615 29,133 27,629 27,808 27,994 27,409
.. ..
Apr/Mar -13.0 153.0 3.6 .. -16.0 67.7 -18.1 .. -9.0 94.7 -172.3 .. .. ..
Totals may not add up due to independent rounding. .. Not availab le.
OPEC Monthly Oil Market Report – May 2014
59
World Oil Supply
World oil supply Preliminary data indicates the global oil supply increased by 160 tb/d to average 90.80 mb/d in April 2014 compared with the previous month. The decrease non-OPEC supply in April was offset by an increase in OPEC production. The share of OPEC crude oil in total global production increased slightly to 32.6% in April compared with the previous month. Estimates are based on preliminary data for non-OPEC supply, while estimates for OPEC NGLs and OPEC crude production come from secondary sources. Graph 5.10: OPEC and world oil supply mb/d 32
mb/d 92
OPEC crude production (LHS)
60
Apr 14
Mar 14
Feb 14
Jan 14
Dec 13
Nov 13
Oct 13
Sep 13
Aug 13
Jul 13
Jun 13
May 13
Apr 13
Mar 13
Feb 13
87
Jan 13
27
Dec 12
88
Nov 12
28
Oct 12
89
Sep 12
29
Aug 12
90
Jul 12
30
Jun 12
91
May 12
31
World supply (RHS)
OPEC Monthly Oil Market Report – May 2014
Product Markets and Refinery Operations
Product Markets and Refinery Operations Product markets in the Atlantic Basin strengthened, driven by developments at the top of the barrel, on the back of improved gasoline demand in the US and amid some higher export opportunities to South America. Positive developments in gasoline allowed product markets in Europe to show a vibrant recovery, along with healthy middle distillates cracks supported by a relatively tightening environment due to the maintenance season in the region. The Asian market recovered slightly during April on the back of strong regional demand for light and middle distillates supporting margins, and outweighed the continued weakening seen in the bottom of the barrel. Graph 6.1: Refinery margins, 2013-14 US$/b 30
US$/b 30
WTI (US Gulf) Dubai (Singapore)
Arab Heavy (US Gulf) LLS (US Gulf)
Apr 14
Mar 14
-5
Feb 14
-5
Jan 14
0
Dec 13
5
0
Nov 13
5
Oct 13
10
Sep 13
10
Aug 13
15
Jul 13
20
15
Jun 13
20
May 13
25
Apr 13
25
Brent (Rotterdam)
US product markets strengthened during April as support stemming from firmer gasoline cracks again balanced out more lacklustre performance further down the barrel, thus allowing margins to more than recover the ground lost in the previous month. The refinery margin for WTI crude on the US Gulf Coast (USGC) rose almost $4 to average $11/b in April. Meanwhile, the margin for Light Louisiana Sweet (LLS) crude on the USGC rose to average $15/b during April, exhibiting a sharp gain of $5. European refining margins exhibited a vibrant recovery last month on the back of continuing strength at the top of the barrel, driven by gasoline supported by strong export opportunities, while middle distillates remained supported by a tightening environment. The gasoline market received support from higher buying interest from open arbitrage to the US, Africa and the Middle East. The refinery margin for Brent crude in Northwest Europe showed a sharp gain of $2.5 to average $4.2/b in April, hitting the highest level in twelve months.
OPEC Monthly Oil Market Report – May 2014
61
Product Markets and Refinery Operations The Asian market witnessed a marginal recovery over the reporting period, on the back of an improvement in the light distillate crack spreads. However, the uptick was limited by continuing weakness in fuel oil. Refinery margins in Singapore lost 40¢ in April to average $2.5/b.
Refinery operations Refinery utilization rates in the US have started to recover to very high levels ahead of the driving season with maintenance coming to the end to average 89.6% in April, an increase of 3.3 percentage points (pp) versus the previous month. This is the highest level seen this year. The return of refining capacity has led to higher gasoline output amid strong and healthy demand amid the approaching summer driving season. Graph 6.2: Refinery utilisation rates, 2013-14
US
EU-16
Japan
Apr 14
Mar 14
60
Feb 14
60
Jan 14
70
Dec 13
70
Nov 13
80
Oct 13
80
Sep 13
90
Aug 13
90
Jul 13
100
Jun 13
100
May 13
%
Apr 13
%
Singapore
European refinery margins recovered during April, supported by the bullish sentiment in gasoline in the Atlantic Basin and some tightening sentiment with low runs amid some maintenance in the region. European refinery runs averaged around 76% in March, corresponding to a throughput of 9.6 mb/d of refining capacity, more than 500 b/d lower than levels a year ago, as European refiners continue to feel pressure from increased competition and a domestic demand picture that is still not particularly bright. In Asia, scheduled maintenance continued to moderate refinery runs in several countries. Chinese refinery levels averaged 9.8 mb/d in March as product inventories were on the rise. Refinery runs in Singapore for March averaged around 97%, a full one pp lower than the previous month. Japanese throughputs averaged 78% of capacity in April, 4.5 pp lower than in March. Some refinery capacity is expected to be shut down in Japan as part of national regulations in the refinery sector, which will affect almost 450 tb/d of capacity.
62
OPEC Monthly Oil Market Report – May 2014
Product Markets and Refinery Operations
US market US gasoline demand stood at around 8.7 mb/d in April, around 100 tb/d lower than the previous month and down by 80 tb/d from the same month a year earlier. Gasoline cracks exhibited a sharp recovery in the Gulf coast on the back of strong support from the supply side, amid low inventories ahead of the driving season. The USGC gasoline prices strengthened as the strong demand in the southern US boosted low-octane gasoline values amid a tightening environment due to limited supplies. Catalytic cracker shutdowns and the switch to summer-grade gasoline also supported prices. Several gasoline cargoes were booked for Latin America from the US West Coast (USWC), mainly to Mexico and Guatemala, lending additional support to the market. The gasoline crack spread exhibited a sharp increase of more than $4 to average $30/b in April. Graph 6.3: US Gulf crack spread vs. WTI, 2013-14 US$/b
US$/b
50
50
40
40
30
30
20
20
10
10
0
0
Prem.Gasoline Unl.93
Jet/Kero
Gasoil/Diesel (0.05%S)
Apr 14
Mar 14
Feb 14
Jan 14
Dec 13
Nov 13
Oct 13
Sep 13
Aug 13
Jul 13
Jun 13
May 13
-10
Apr 13
-10
Fuel oil (1.0%S)
Middle distillate demand stood at around 3.9 mb/d in April, some 170 tb/d higher than the previous month and 90 tb/d above the same month a year earlier. Middle distillate crack spreads were underpinned by exports, especially with demand increasing from Latin America. Several diesel cargoes from the Gulf Coast were exported to Latin America, with the Caribbean, Colombia and the east coast of Mexico being the main destinations. However, the exports to Europe were limited while inventories showed a slight recovery and runs were on the rise, thus limiting any uptick and keeping the crack spread basically steady. The USGC gasoil crack remained around the same average versus the previous month around $19/b in April At the bottom of the barrel, the fuel oil crack weakened, as increasing temperatures reduced demand from power utilities and the LSFO crack lost some ground, while fuel oil stocks in PADD-1 have shown a steady recovery since slipping under 7 mb in midFebruary. The New York 1% fuel oil premium to USGC 3% fuel oil fell as milder weather set in on the East Coast. Additional pressure came from the supply side with refiners seeking to sell VGO cargoes due to higher refinery runs amid some catalytic
OPEC Monthly Oil Market Report – May 2014
63
Product Markets and Refinery Operations cracking units shutdown. The fuel oil crack in the USGC exhibited a loss of more than $1 to average minus $1.8/b during April.
European market Product markets in Europe exhibited a vibrant recovery over the month, boosted by the continuing strength at the top of the barrel with strong export opportunities to the US amid tightening market supporting the middle distillates. Gasoline cracks exhibited a sharp strengthening on the back of support from the US where a hefty draw brought inventories significantly below levels a year ago and below the five-year average, leading to a strengthening in RBOB futures. Gasoline exhibited a vibrant recovery from winter lows as the growing gasoline demand across the Atlantic was offering an outlet for European refiners. Buying interest from North Africa and the opening of the arbitrage window to the Middle East amid some refinery maintenance were also giving support. The gasoline crack spread against Brent exhibited a sharp increase of more than $4 to average $30/b in April. The crack of fellow light distillate naphtha continued improving, with demand for gasoline blending remaining a supportive factor. A stronger pull from Asia combined with the peak of the Russian refinery maintenance season also supported the market. Graph 6.4: Rotterdam crack spreads vs. Brent, 2013-14 US$/b
US$/b
30
30
20
20
10
10
0
0
Prem.Gasoline Unl.98 ppm
Jet/Kero
Gasoil 10 ppm
Apr 14
Mar 14
Feb 14
Jan 14
Dec 13
Nov 13
Oct 13
Sep 13
-30
Aug 13
-30
Jul 13
-20
Jun 13
-20
May 13
-10
Apr 13
-10
Fuel oil (1.0%S)
Middle distillate cracks recovered the ground lost during last month on the back of firmer diesel demand stemming mainly from seasonal buying from Turkey amid a tighter supply situation, particularly with low ARA gas oil stocks. Reduced inflows from India and Russia also contributed to tightening of the market. Potential gains were capped by pressure arising from the supply side with the US reopening arbitrage, which could ease the tightness The gasoil crack spread against Brent crude at Rotterdam recovered 90¢ versus the previous month’s level to average $14.4/b during April.
64
OPEC Monthly Oil Market Report – May 2014
Product Markets and Refinery Operations Looking ahead, the picture is turning slightly bearish with expectations of higher inflows from the US into the region as US refiners have been keeping distillate production high At the bottom of the barrel, fuel oil cracks weakened over the reporting month due to subdued regional demand amid pressure from the supply side with some refineries returning from maintenance as well as a potential upwards run adjustment given the recent margin uptick. Stronger refining margins limited incremental demand for upgrading unit feedstock and depressed low-sulphur straight-run fuel oil. The Northwest European fuel oil crack lost $2 versus the previous month’s level to average minus $10/b in April.
Asian market The Asian market recovered during April on the back of a positive performance at the top and middle of the barrel, which outweighed the continued weakening seen in fuel oil. The Singapore gasoline crack continued to strengthen as demand from Southeast Asia remained firm while Singapore light distillate inventories continued to ease. The demand side was supported by the buying interest seen from Vietnam, Thailand and Indonesia. Additional support stemmed from the news of a forced shutdown of a reformer unit at the Petronas-Malaka refinery. The gasoline crack spread against Dubai crude in Singapore gained 80¢ to average $13/b in April. The Singapore naphtha crack inched slightly higher during April with the support coming from lower inflows, mostly on the back of maintenance in Europe, thus lifting the regional crack. The uptick was limited by an increase in Japan´s naphtha stocks due to a lull in domestic demand resulting from the intense turnaround season at the country´s naphtha crackers. Graph 6.5: Singapore crack spread vs. Dubai, 2013-14 US$/b
US$/b 30
30
20
20
10
10
0
0
Prem.Gasoline Unl.92
Jet/Kero
OPEC Monthly Oil Market Report – May 2014
Gasoil 50 ppm
Apr 14
Mar 14
Feb 14
Jan 14
Dec 13
Nov 13
Oct 13
Sep 13
Aug 13
Jul 13
-20
Jun 13
-20
May 13
-10
Apr 13
-10
Fuel oil 180 CST (2.0%S)
65
Product Markets and Refinery Operations At the middle of the barrel, despite increasing inflows and supplies in the region. Positive demand developments allowed the gasoil crack to trend up slightly over the month. The demand side lent support with solid buying activity in the region, particularly with firming demand in India, Southeast Asia and East Africa. In addition, stronger regional demand was also reflected in Singapore’s middle distillates stock draw. The uptick was limited by pressure coming from the supply side with elevated export volumes from the Middle East following the starting of the Jubail refinery. Gas oil exports from Saudi Arabia were reportedly to be on the rise during last months. The gasoil crack spread in Singapore against Dubai gained more than $1 to average around $19.3/b in April. Looking ahead, despite increasing inflows the crack is likely to remain supported with the expected seasonal improvement demand ahead of the harvesting Chinese season. The fuel oil crack continued to weaken in Singapore as higher volumes were coming in to the region. However, the downward trend was limited by some support lent by the strong demand in Vietnam, Pakistan and India. Asian demand for power generation remained in a seasonal lull while the supply side was exerting pressure with higher inflows from Saudi Arabia and Venezuela, and inventories increasing in Singapore and China. The fuel oil crack spread in Singapore against Dubai lost more than $1 to average minus $12.9/b in April. Table 6.1: Refinery operations in selected OECD countries Refinery throughput, mb/d
US France Germany Italy UK Euro-16 Japan
Feb 14 15.23 1.04 1.86 1.28 0.99 9.83 3.70
Mar 14 15.09 1.04 1.81 1.27 1.11 9.65 3.57
Apr 14 15.72 3.63
Change Apr/Mar 0.63 0.06
Refinery utilization, % Feb 14 87.33 69.15 82.95 60.40 65.01 79.50 84.33
Mar 14 86.33 68.81 80.32 59.93 72.88 78.02 82.60
Apr 14 89.58
Change Apr/Mar 3.25
-
-
78.00
-4.60
Sources: OPEC statistics, Argus, Euroilstock inventory report, IEA, EIA/DoE, METI and PAJ.
66
OPEC Monthly Oil Market Report – May 2014
Product Markets and Refinery Operations Table 6.2: Refined product prices, US$/b
US Gulf (Cargoes FOB): Naphtha Premium gasoline (unleaded 93) Regular gasoline (unleaded 87) Jet/Kerosene Gasoil (0.2% S) Fuel oil (1.0% S) Fuel oil (3.0% S) Rotterdam (Barges FoB): Naphtha Premium gasoline (unleaded 98) Jet/Kerosene Gasoil/Diesel (10 ppm) Fuel oil (1.0% S) Fuel oil (3.5% S) Mediterranean (Cargoes FOB): Naphtha Premium gasoline* Jet/Kerosene Gasoil/Diesel* Fuel oil (1.0% S) Fuel oil (3.5% S) Singapore (Cargoes FOB): Naphtha Premium gasoline (unleaded 95) Regular gasoline (unleaded 92) Jet/Kerosene Gasoil/Diesel (50 ppm) Fuel oil (180 cst 2.0% S) Fuel oil (380 cst 3.5% S)
Feb 14
Mar 14
Apr 14
Change Apr/Mar
109.58 128.91 114.04 125.27 120.97 102.85 90.36
110.60 126.74 115.71 121.86 119.80 102.35 89.31
111.71 132.43 122.76 121.83 121.12 101.56 90.74
1.11 5.69 7.05 -0.03 1.32 -0.79 1.43
101.07 119.89 124.63 123.29 97.55 91.72
100.82 120.86 121.71 121.01 100.10 91.27
102.40 128.03 122.24 122.13 98.07 91.32
1.58 7.17 0.53 1.12 -2.03 0.05
98.45 116.41 121.99 124.05 98.88 91.58
97.86 115.23 118.48 121.46 100.69 90.48
100.23 122.87 119.82 122.04 98.72 90.17
2.37 7.64 1.34 0.58 -1.97 -0.31
102.37 119.71 116.70 122.78 124.15 96.29 94.83
102.08 119.37 116.53 119.99 122.46 95.00 93.13
103.99 121.39 117.64 120.56 123.96 93.81 91.76
1.91 2.02 1.11 0.57 1.50 -1.19 -1.37
* Cost, insurance and freight (CIF). Source: Platts and Argus Media.
OPEC Monthly Oil Market Report – May 2014
67
Tanker Market
Tanker Market In April, crude oil tanker market sentiment weakened and average spot freight rates dropped on most of the reported routes. On average, dirty tanker freight rates closed down by 4% compared to the previous month. For the VLCC sector, average spot freight rates for reported routes dropped by 5% in April, compared to the previous month, while Suezmax declined by 8% and Aframax was more stable, falling by only 1%. The general softer sentiment in spot freight rates in April came on the back of the continuous tonnage oversupply and weak demand as market activities declined, due partially to a holiday period. Clean tanker sentiment followed the same trend as dirty tanker registering suffered a drop from the previous month and last year, being under the influence of the same factors negatively affecting the whole market.
Spot fixtures OPEC spot fixtures dropped in April by 7% to stand at 12.59 mb/d. The decline came mainly as a result of a fall in Middle East to East fixtures. Outside the Middle East, fixtures decreased by 16% in April. Compared to the previous month, global fixtures dropped by 7% to stand at 18.11 mb/d. Table 7.1: Tanker chartering, sailings and arrivals, mb/d Feb 14
Mar 14
Apr 14
Change Apr/Mar
Spot Chartering All areas OPEC Middle East/East Middle East/West Outside Middle East
17.99 12.98 6.51 2.21 4.26
19.49 14.14 7.21 2.50 4.43
18.11 12.59 6.19 2.69 3.72
-1.39 -1.55 -1.02 0.18 -0.71
Sailings OPEC Middle East
23.95 17.50
24.16 17.72
23.89 17.54
-0.27 -0.19
Arrivals North America Europe Far East West Asia
9.50 12.20 8.84 4.24
10.39 12.04 8.86 4.36
9.54 12.19 8.86 4.27
-0.85 0.15 0.00 -0.10
Source: Oil Movements and Lloyd's Marine Intelligence Unit.
Sailings and arrivals OPEC sailings declined by 1% from the previous month to average 23.89 mb/d in April. Arrivals in Europe were higher, while arrivals in North America and West Asia dropped from the previous month by 8% and 2% to stand at 9.54 mb/d and 4.27 mb/d, respectively. Arrivals in Europe stood at 12.19 mb/d compared to the same month last year.
68
OPEC Monthly Oil Market Report – May 2014
Tanker Market
Spot freight rates VLCC The VLCC market continued to suffer from declining freight rates, a downtrend seen since the beginning of 2014 (with the exception of February). Affected by an obvious tonnage surplus in April, freight rates did not show any increase, despite an occasional improvement in market activity as tonnage demand was seen steady in the first decade of the month for West Africa and the Caribbean, while the Middle East market was relatively firm. Middle East to Asia tonnage demand experienced some gains for the second and third decades. Meanwhile, the VLCC market in the West was partially depressed, due to low activity as a result of the Easter holidays. For VLCCs, Middle East to East spot freight rates declined by 5%, Middle East to West rates decreased by 3% and West Africa to East rates dropped by 6% in April, compared to the previous month. On the whole, April was a slow month for the VLCC market with a limited amount of activity and the total number of fixtures on the low side. Graph 7.1: Monthly averages of crude oil spot freight rates Worldscale 180
Worldscale 180
Mediterranean/Northwest Europe (Aframax) Middle East/East (VLCC)
Apr 14
Feb 14
Mar 14
20
Jan 14
40
20
Dec 13
60
40
Nov 13
60
Oct 13
80
Sep 13
100
80
Aug 13
120
100
Jul 13
120
Jun 13
140
May 13
160
140
Apr 13
160
West Africa/USGC (Suezmax)
Table 7.2: Spot tanker crude freight rates, Worldscale
Crude Middle East/East Middle East/West West Africa/East West Africa/US Gulf Coast Northwest Europe/US Gulf Coast Indonesia/East Caribbean/US East Coast Mediterranean/Mediterranean Mediterranean/Northwest Europe
Size 1,000 DWT
Feb 14
Mar 14
Apr 14
Change Apr/Mar
230-280 270-285 260 130-135 130-135 80-85 80-85 80-85 80-85
56 35 56 59 57 97 116 85 75
43 31 44 60 56 86 100 94 89
41 30 42 56 51 87 101 93 85
-2 -1 -3 -4 -6 1 1 -2 -5
Source: Galb raith’s tanker market report and Platts.
OPEC Monthly Oil Market Report – May 2014
69
Tanker Market
Suezmax Suezmax spot freight rates followed a similar pattern to those of VLCCs. West Africa to the US spot freight rates declined by 6%, while Northwest Europe (NWE) to the US decreased by 10% in April, compared to the month before. The decline of Suezmax spot freight rates came on the back of lower tonnage demand seen in several regions. Freight rates declined despite an increase in tonnage demand for West Africa loading which indeed led to higher freight rates. However, that was short lived as freight rates dropped when demand eased off. Rates were seen declining in the Black Sea following a minimal pre-holiday rush, while transatlantic freight rates were negatively affected by lower trade. Besides the monthly drop in freight rates, rates on tankers operating on the West Africa to US routes reflected the only drop on an annual basis among all other reported routes, despite the decline being minor. Suezmax was chosen as an alternative to Aframax on a part-cargo basis when Aframax freight rates firmed.
Aframax Aframax spot freight rates ended the month with a slight drop of 1% on average, compared to the previous month. Aframax spot freight rates showed a mixed performance in April on the selected routes, lthough rate changes on all selected routes were considered minor. The Aframax market in the Mediterranean suffered from growing competition between shipowners, which led to a drop in freight rates. Aframax spot freight rates experienced small declines with Mediterranean to Mediterranean rates losing 2% and Mediterranean to Northwest Europe rates declining by 5% in April, compared to the previous month. The monthly average reflected declines, despite rate gains registered in the first half of the month as a result of some delays and increased activity in the region. However, loading cancelations at Cayhan Port and limited inquiries, due to the holidays, absorbed any increase in rates. Prompt replacements in the Caribbean firmed spot freight rates for aframax in April. However, rates then suffered a downward correction as the number of cargoes declined, while vessel availability increased. On average, Caribbean to the US Aframax spot freight rates were almost stable in April, compared to the previous month,
Clean spot freight rates Sentiment in the clean tanker market weakened in April and spot freight rates on reported routes dropped in comparison to a month earlier with the exception of tankers trading on the Singapore to East route. West of Suez clean spot freight rates registered a strong decline of 21%, while East of Suez rates edged down by 4% in April compared to the previous month. The declining trend of freight rates, which has been persisting over the past few months, continued in April, despite a number of factors that should have supported rates, such as storage ullage issues in Europe and increased naphtha shipments to Japan. In the East of Suez, the Middle East to East clean spot freight rates dropped by 11%. However Singapore to East rates showed a slight gain of 2% in April over the previous month. In West of Suez, clean spot freight rates from NWE to the US dropped by 15% from the previous month, while the drop in both reported routes in the Mediterranean was higher. Mediterranean to Mediterranean and Mediterranean to Northwest Europe freight rates dropped by 25% and 23%, respectively. The clean tanker market suffered from low trade in the Atlantic, thus low freight rates, despite higher activity by the end of the month, which was due to increased
70
OPEC Monthly Oil Market Report – May 2014
Tanker Market US gasoline imports. Inquiries in the Mediterranean were limited and the tonnage list maintained over-populated. Graph 7.2: Monthly average of clean spot freight rates Worldscale
60
60
Middle East/East
Jul 13
Northwest Europe/USEC-USGC
Apr 14
80
Mar 14
80
Feb 14
100
Jan 14
100
Dec 13
120
Nov 13
140
120
Oct 13
140
Sep 13
160
Aug 13
160
Jun 13
180
May 13
180
Apr 13
200
Worldscale 200
Mediterranean/Mediterranean
Table 7.3: Spot tanker product freight rates, Worldscale Size 1,000 DWT
Feb 14
Mar 14
Apr 14
Change Apr/Mar
30-35 30-35 33-37 30-35 30-35
102 104 126 152 163
109 112 132 171 181
97 114 112 129 139
-13 2 -20 -42 -42
Products Middle East/East Singapore/East Northwest Europe/US East Coast Mediterranean/Mediterranean Mediterranean/Northwest Europe
Source: Galb raith’s tanker market report and Platts.
OPEC Monthly Oil Market Report – May 2014
71
Oil Trade
Oil Trade According to preliminary data, US crude oil imports in April went up from the previous month by 449 tb/d to average 7.7 mb/d. US crude oil imports showed a slight decline from last year by 11 tb/d or 0.1%. On the product side, US product imports increased by 81 tb/d from the previous month, but fell on an annual basis by 464 tb/d or 20%. In March, Japan’s crude oil imports declined by 122 tb/d or 3% to average 3.8 mb/d, the lowest level this year so far. On an annual comparison, the country’s crude oil imports dropped by 336 tb/d or 8%. Japan’s oil product imports declined in March for the second consecutive month - by 61 tb/d or 9% . However, they increased from the previous year by 21tb/d or 3% to average 643 tb/d. China’s crude oil imports were lower from the previous month, falling by 558 tb/d or 9% to average 5.46 mb/d. At the same time, the country’s refineries registered lower crude runs. Annually, China’s crude imports were higher in March than in the same period a year ago by 26 tb/d, or 0.5%. India’s crude oil imports dropped in March, both on a monthly and annual basis after they reached an exceptionally high level in February. M-o-m, the drop in imports amounted to 875 tb/d or 20%, while y-o-y they saw a slight decline of 35 tb/d or 1% to average 3.49 mb/d. On the other hand, India’s oil product imports declined in March by 107 tb/d or 23% to average 363 tb/d. In an annual comparison, imports dropped by 11 tb/d or 3%.
US According to preliminary data, US crude oil imports in April were higher from the previous month’s level by 449 tb/d to average 7.7 mb/d. However, compared with last year, they lost a slight 11 tb/d or 0.1%. Year-to-date, US crude oil imports averaged 7.4 mb/d, reflecting a decline of 1610 tb/d or 2% from the same period last year. Graph 8.1: US imports of crude and petroleum products mb/d 2.5
mb/d 8.5
Others*
Propane / Propylene
Gasoline
Jet Fuel / Kerosene
Fuel Oil
Crude (RHS)
Apr 14
Mar 14
Feb 14
Jan 14
6.0
Dec 13
0.0
Nov 13
6.5
Oct 13
0.5
Sep 13
7.0
Aug 13
1.0
Jul 13
7.5
Jun 13
1.5
May 13
8.0
Apr 13
2.0
*Others: Contains natural gas liquids, liquefied refinery gases (LRG's), other liquids and all finished petroleum products except gasoline, jet fuel/kerosene, fuel oil and propane/propylene.
On the other hand, US oil product imports increased by 81 tb/d from the previous month, but dropped on an annual basis by 464 tb/d or 20%. Looking at US oil product
72
OPEC Monthly Oil Market Report – May 2014
Oil Trade exports, in April they suffered a decline of 289 tb/d or 8% m-o-m. However, they still showed an increase from last year of 332 tb/d or 11%. Consequently, US net oil imports increased in April to average 6.1 mb/d, reflecting a monthly gain of 816 tb/d. However, this represented an annual drop of 743 tb/d. As for the top oil suppliers to the US in February, Canada continued to be in first place, with crude supplies averaging 2.6 mb/d, 256 tb/d or 9% lower than in the previous month. Canada accounted for 36% of total US crude oil imports in February. Imports from Saudi Arabia were in second place, but they were also lower than in the previous month. Saudi Arabia accounted for 20% of total US crude imports with its imports lowerby 12 tb/d from a month earlier. In third position was Mexico, with a share of 11%. However its exports to the US experienced a loss of 191 tb/d or 11% from the previous month. Venezuela was the fourth top supplier to the US with a share of 10%. Its supplies averaged 757 tb/d, 14% higher than in the previous month. In an annual comparison, Canada’s and Mexico’s exports to the US declined, while all other top suppliers’ volumes were found to be higher than in the same period the year before . Graph 8.2: US exports of crude and petroleum products tb/d 5,000
tb/d 300
4,000
250 200
3,000
150 2,000
100
1,000
50
Others*
Propane / Propylene
Gasoline
Jet Fuel / Kerosene
Fuel Oil
Crude (RHS)
Apr 14
Mar 14
Feb 14
Jan 14
Dec 13
Nov 13
Oct 13
Sep 13
Aug 13
Jul 13
Jun 13
May 13
0
Apr 13
0
*Others: Contains natural gas liquids, liquefied refinery gases (LRG's), other liquids and all finished petroleum products except gasoline, jet fuel/kerosene, fuel oil and propane/propylene.
Crude oil imports from OPEC Member Countries were stable at the same level as seen the previous month, averaging 3.2 mb/d. OPEC Member Countries accounted for 44% of total US crude oil imports in February. US oil product imports from OPEC Member Countries gained 79 tb/d or 52% from the previous month to average 230 tb/d. OPEC Member Countries accounted for 12% of total US oil product imports. As to the oil product supplier share, Canada and Russia maintained their position as top suppliers to the US in February, holding shares of 31% and 19%, respectively. Canada and Russia increased their oil product exports to the US by 30 tb/d and 163 tb/d, respectively, in February from the previous month. The Netherlands was recorded as the third-largest oil product supplier to the US in February with a share of 5%of the country’s total petroleum product imports. Table 8.1: US crude and product net imports, tb/d
Crude oil Total products Total crude and products
Feb 14 6,960 -1,420 5,540
OPEC Monthly Oil Market Report – May 2014
Mar 14 7,202 -1,893 5,309
Apr 14 7,648 -1,522 6,125
Change Apr/Mar 445 371 816
73
Oil Trade
Japan In March, Japan saw a drop in its crude oil imports by 122 tb/d or 3% to average 3.8 mb/d, the lowest level so far this year. In an annual comparison, its crude oil imports dropped by 336 tb/d or 8%. As for the crude supplier share, Saudi Arabia, the United Arab Emirates (UAE) and Qatar all maintained their positions as the top crude suppliers to Japan. Their share of total crude imports accounted for 31%, 23%, and 13%, respectively. Graph 8.3: Japan’s imports of crude and petroleum products tb/d
mb/d
1,200
5
1,000
4
800
3
600 2
400
Others*
LPG
Naphtha
Fuel oil
Mar 14
Feb 14
Jan 14
Dec 13
Nov 13
Oct 13
Sep 13
Aug 13
Jul 13
Jun 13
0
May 13
0
Apr 13
1
Mar 13
200
Crude (RHS)
*Others: Contains gasoline, jet fuel, kerosene, gasoil, asphalt and paraffin wax.
Japan’s oil product imports declined in March for the second successive month - by 61 tb/d or 9% m-o-m. However, they increased from the previous year by 21 tb/d or 3% to average 643 tb/d, the lowest level since December 2013. Graph 8.4: Japan’s exports of petroleum products tb/d 700
tb/d
600
600
500
500
400
400
300
300
200
200
100
100
700
Fuel oil
Gasoil
Jet fuel
Mar 14
Feb 14
Jan 14
Dec 13
Nov 13
Oct 13
Sep 13
Aug 13
Jul 13
Jun 13
May 13
Apr 13
0
Mar 13
0
Others*
*Others: Contains LPG, gasoline, naphtha, kerosene, lubricating oil, asphalt and paraffin wax.
Concerning oil product exports, Japan’s product exports saw a decline of 100 tb/d or 2% from the previous month. However, they increased by 34 tb/d or 7% from the same month a year ago. On a year-to-date comparison, Japan’s oil product exports were 126 tb/d or 32% higher. As a result, Japan’s net oil trade dropped by 173 tb/d or 4% to average 3.9 mb/d. On an annual basis, it fell by 350 tb/d or 8%.
74
OPEC Monthly Oil Market Report – May 2014
Oil Trade Table 8.2: Japan’s crude and product net imports, tb/d
Crude oil Total products Total crude and products
Change Mar/Feb -122 -51 -173
Mar 14 3,828 105 3,933
Feb 14 3,950 156 4,106
Jan 14 3,999 254 4,253
China China’s crude oil imports dropped in March after several months of increase. In the month, domestic crude imports declined by 558 tb/d or 9% to average 5.46 mb/d. At the same time, the country’s refineries registered lower crude runs. In an annual comparison, China’s crude oil imports were higher than in the same period a year earlier by 26 tb/d or 0.5%. On a year-to-date basis, imports reflected a gain of 443 tb/d or 8%. Graph 8.5: China’s imports of crude and petroleum products tb/d
tb/d
1,600 1,400 1,200 1,000 800 600 400 200 0
7,000 6,000 5,000 4,000 3,000 2,000 1,000
Others
LPG
Naphtha
Gasoline
Diesel
Fuel Oil
Asphalt
Crude (RHS)
Mar 14
Feb 14
Jan 14
Dec 13
Nov 13
Oct 13
Sep 13
Aug 13
Jul 13
Jun 13
May 13
Apr 13
Mar 13
0
Jet Fuel
Graph 8.6: China’s exports of crude and petroleum products tb/d
tb/d
800
100 80
600
60 400 40 200
20
Others
LPG
Naphtha
Gasoline
Diesel
Fuel Oil
Asphalt
Crude (RHS)
Mar 14
Feb 14
Jan 14
Dec 13
Nov 13
Oct 13
Sep 13
Aug 13
Jul 13
Jun 13
May 13
Apr 13
0
Mar 13
0
Jet Fuel
Regarding crude import origins, Saudi Arabia, Angola and Iraq were the top three crude suppliers of crude oil to China in the month, accounting for 14%, 13% and 11%,
OPEC Monthly Oil Market Report – May 2014
75
Oil Trade respectively, of total imports. On a monthly comparison, volumes imported from Saudi Arabia and Angola were lower than in the previous month by 31% and 25%, respectively, while Iraq increased its exports to China by 8%. Iran and Oman were the fourth and fifth top suppliers to China in March with shares of 10% and 8%, respectively. China’s oil product imports declined by 171 tb/d or 8% from the previous month to average 770 tb/d, the lowest level seen since January 2010. While product imports dropped by 179 tb/d or 19% y-o-y, the country’s product exports saw a monthly and annual gain of 20% and 4.5%, respectively. China’s oil product exports reached their highest level since May 2013. Accordingly, China’s net oil trade declined by 707 tb/d or 11% on a monthly basis and fell by 121 tb/d or 2% from the previous year. Table 8.3: China’s crude and product net imports, tb/d Feb 14 5,980 218 6,198
Jan 14 6,630 628 7,258
Crude oil Total products Total crude and products
Change Mar/Feb -512 -195 -707
Mar 14 5,468 23 5,491
India India’s crude oil imports dropped In March, both on a monthly and annual basis after they reached an exceptionally high level in February. M-o-m, the drop in March was equal to 875 tb/d or 20%, while y-o-o they saw a slight decline of 35 tb/d or 1% to average 3.49 mb/d. March’s crude oil imports were the lowest for a month since July 2012. Graph 8.7: India’s imports of crude and petroleum products tb/d
tb/d
500
5,000
400
4,000
300
3,000
200
2,000
100
1,000
Mar 14
Feb 14
Jan 14
Dec 13
Nov 13
Oct 13
Sep 13
Aug 13
Jul 13
Jun 13
May 13
Apr 13
0
Mar 13
0
Others
LPG
Naphtha
Gasoline
Kerosene
Gasoil
Fuel oil
Crude (RHS)
India’s oil product imports dropped as well in March - by 107 tb/d or 23% to average 363 tb/d. From an annual standpoint, the decline equated to 11 tb/d or 3%. M-o-m, the decline in oil product imports came as a result of lower imports of fuel oil and LPG.
76
OPEC Monthly Oil Market Report – May 2014
Oil Trade Graph 8.8: India’s exports of petroleum products tb/d
tb/d
2,000
2,000
1,500
1,500
1,000
1,000
500
500
Fuel oil
Gasoil
Jet fuel
Gasoline
Naphtha
Mar 14
Feb 14
Jan 14
Dec 13
Nov 13
Oct 13
Sep 13
Aug 13
Jul 13
Jun 13
May 13
Apr 13
0
Mar 13
0
Others
With regard to India’s oil product exports, they reflected a small increase from the previous month. In March, India’s oil product exports rose by a slight 0.6% to average 1.4 mb/d the highest level in 2014 so far. However, from a year ago, they showed a loss of 74 tb/d or 5%. The monthly increase in oil product exports came as a result of naphtha exports, which increased by 13% from the previous month, while all other product exports declined. Consequently, India’s net oil trade declined by 990 tb/d or 30% m-o-m, while it was still higher from last year by 28tb/d or 1% to average 2.4 mb/d Table 8.4: India’s crude and product net imports, tb/d
Crude oil Total products Total crude and products
Jan 14 3,660 -762 2,898
Feb 14 4,367 -959 3,408
Mar 14 3,491 -1,074 2,418
Change Mar/Feb -875 -115 -990
Note: India data tab le does not include information for crude import and product export b y Reliance Industries.
FSU In March, the FSU’s total crude oil exports declined by 101 tb/d or 2% to average 6.2 mb/d. Crude oil exports through the Russian pipeline decreased by 93 tb/d or 2% to average 4.2 mb/d. Crude oil exports from the Baltics and Druzba declined by 81 tb/d or 7% for each, while exports via the Black Sea, and Kozmino increased by 12% and 0.4%, respectively. Crude oil exports by Russian rail declined by 18%, while from Russia to the Far East and by Kazakh rail they saw gains of 40% and 73%, respectively in March. On the other hand, the FSU’s total oil product exports declined in March by 191 tb/d or 5% to average 2,936 tb/d. Exports of gasoline, naphtha, VGO and gasoil all fell by between 5-24%, while fuel oil and jet volumes were higher than in the previous month.
OPEC Monthly Oil Market Report – May 2014
77
Oil Trade Table 8.6: Recent FSU exports of crude and products by sources, tb/d Mar 14 *
2013
2Q 13
3Q 13
4Q 13
1Q 14
Feb 14
740 1,546 1,032 434 4,073
752 1,647 1,020 433 4,152
738 1,409 1,063 437 3,984
699 1,554 1,055 429 4,070
673 1,314 1,010 487 3,949
661 1,355 1,044 478 4,006
738 1,274 964 480 3,913
10 190 259 111 19 703 635 240 154
9 169 261 109 21 703 714 236 182
9 194 252 120 18 707 636 222 124
9 212 282 113 18 732 609 262 134
10 91 281 113 8 827 580 241 154
11 42 226 106 13 905 588 258 165
9 73 317 114 1 834 576 233 149
Total crude exports
6,394
6,555
6,265
6,441
6,255
6,320
6,219
Products Gasoline Naphtha Jet Gasoil Fuel oil VGO Total
122 390 11 857 1,415 263 3,058
123 355 16 875 1,557 288 3,214
109 433 8 822 1,463 311 3,145
114 432 7 753 1,302 236 2,843
143 501 5 1,018 1,427 217 3,310
124 587 1 1,093 1,420 244 3,469
118 446 12 1,013 1,486 203 3,278
Total oil exports
9,451
9,769
9,410
9,284
9,566
9,789
9,497
Crude Russian pipeline Black Sea Baltic Druzhba Kozmino Total Other routes Russian rail** Kazakh rail Russian - Far East Varandey Kaliningrad CPC BTC Kenkiyak-Alashankou Caspian
* Preliminary. ** Does not include Kazakh rail. Totals may not add due to independent rounding. Sources: Nefte Transport, Glob al Markets, Argus Fundamentals, Argus FSU and OPEC Secretariat.
78
OPEC Monthly Oil Market Report – May 2014
Stock Movements
Stock Movements OECD commercial oil stocks fell in March, driven mainly by a decline in products as crude inventories rose. At 2,570 mb, they stood 115 mb below the five-year average, divided between crude (38 mb) and products (77 mb). In terms of days of forward cover, OECD commercial stocks rose by 0.2 day in February to stand at 56.8 days. This was around 2 days lower than the five-year average. Preliminary data for April shows that US total commercial oil stocks rose strongly by 47.1 mb, with both crude and products rising ‒ by 17.5 mb and 29.6 mb, respectively. At 1,084.1 mb, US commercial oil inventories were in line with the latest five-year average. Crude stocks represented a surplus of 22 mb, while products showed a deficit by almost the same amount. Chinese total commercial oil inventories fell by 10.2 mb in March, reversing the build of the previous three months. Both crude and products fell ‒ by 6.9 mb and 3.3 mb, respectively.
OECD Preliminary data for March shows that total OECD commercial oil stocks declined for the second consecutive month, by a further 17.0 mb to stand at 2,570 mb. At this level, inventories were around 115 mb less than both the last five-year average and a year ago at the same time. Within the components, commercial crude stocks were up by 4.8 mb in March, while products fell by 16.3 mb. Lower refinery runs amid refinery maintenance were behind the build in crude oil stocks. At 1,250 mb, OECD crude commercial stocks were 50 mb below the level seen at the same time the year before and 38 mb less than the last five-year average. Product stocks stood at 1,320 mb, showing a deficit of 77 mb with the seasonal norm, and 65 mb below last year at the same time. Middle distillates accounted for the bulk of the deficit with the five-year average, standing nearly 35 mb below the seasonal norm, while gasoline stocks started to improve, showing a slight deficit of 5 mb with the five-year average. The drop in OECD commercial product stocks reflected relatively robust demand in some OECD countries and higher US product exports. Graph 9.1: OECD’s commercial oil stocks mb
mb
2,850
2,850
2,800
2,800
2,750
2,750
2,700
2,700
2,650
2,650 Max/Min 2009-13
2,600
2,600
2,550
2,550
2,500 Jan
Feb
Mar
Apr
May
2013
OPEC Monthly Oil Market Report – May 2014
Jun 2014
Jul
Aug
Sep
Oct
Nov
2,500 Dec
Average 2009-13
79
Stock Movements In terms of days of forward cover, OECD commercial oil stocks fell in March by 0.3 day from February to stand at 56.8 days. This was around two days lower than both the latest five-year average and the same month a year earlier. OECD Americas forward cover was 1.9 days below the historical average at 54.0 days in March, while OECD Europe stood at 2.1 days below the seasonal average to finish the month at 66.2 days. Meanwhile, the OECD Asia-Pacific region indicated a deficit of 1.9 days, averaging 49.1 days. In March, commercial oil stocks in the OECD Americas declined by 9.6 mb to stand at 1,292 mb. At this level, inventories were 32 mb below the seasonal norm and stood 57 mb below a year ago at the same time. Within the components, the total stock-draw was attributed to products, as crude rose from the previous month. At the end of March, commercial crude stocks in the OECD Americas saw a build of 6.7 mb versus the previous month, following a build of 11 mb in February. At 676 mb, OECD Americas’ crude oil commercial stocks finished the month 10 mb above the latest five-year average, but nearly 18 mb less than a year ago at the same time. The build in commercial crude stocks was driven by lower crude refinery runs in the US, which fell by around 140 tb/d to stand at 15.1 mb/d. This corresponded to a refineries’ utilization rate of 85.9% of capacity, down from 87.3% the previous month. OECD Americas’ product stocks fell in March, declining by 16.3 mb for the third consecutive month to stand at 626 mb. At this level, they represented a deficit of 42 mb with the seasonal norm, and 39 mb below the same time a year ago. The bulk of the drop came from gasoline stocks, which fell by 13 mb, while distillate stocks remained almost unchanged. An improvement in demand, combined with higher US product exports, were behind the fall in product stocks. The distillate market remained tight, indicating a deficit of 24 mb with the latest five-year average, while gasoline stocks remained at around the seasonal norm. In March, OECD Europe’s commercial oil stocks fell by 6.8 mb for the second consecutive month to stand at 897 mb. At this level, OECD Europe’s commercial stocks stood 68 mb below the seasonal norm and 26 mb less than a year ago at the same time. Within the components, crude and product stocks fell by 3.3 mb and 3.5 mb, respectively. At 368 mb, OECD Europe’s crude stocks stood 30 mb below the five-year average and 9 mb less than during the same period last year. The fall in crude oil inventories came mainly from lower supply. However, reduced refinery crude runs amid spring turnarounds limited a further drop in crude stocks. In contrast, OECD Europe’s commercial product stocks fell in March for the second consecutive month to stand at 530 mb. At 530 mb, OECD Europe’s commercial product inventories showed a deficit of 31 mb with the seasonal norm and stood 17 mb lower than a year ago at the same time. Lower refinery output was behind the decline in OECD Europe’s commercial product stocks. Commercial inventories in the OECD Asia-Pacific declined by 0.6 mb in March to stand at 380 mb. At this level, they were 32 mb below the same period a year ago and 14 mb below than the latest five-year average. Within the components, crude stocks rose by 1.4 mb, while products declined by 2.0 mb. Crude inventories ended the month of March at 216 mb and stood 24 mb below a year ago and 17 mb lower than the seasonal norm. The OECD Asia-Pacific’s total product inventories showed a deficit of 9 mb compared with a year ago, but indicated a surplus of 3 mb with the seasonal norm.
80
OPEC Monthly Oil Market Report – May 2014
Stock Movements Table 9.1: OECD’s commercial stocks, mb
Crude oil Products Total
Jan 14 1,234 1,359 2,594
Feb 14 1,245 1,342 2,587
Mar 14 1,250 1,320 2,570
Change Mar 14/Feb 14 4.8 -21.8 -17.0
Mar 13 1,300 1,385 2,685
56.7
57.2
56.8
-0.3
59.1
Days of forward cover
EU plus Norway Preliminary data for March shows that European oil stocks fell by 6.8 mb, reversing the stock-draw of the previous two months to stand at 1,074.7 mb. With this stockdraw, European stocks stood 13.1 mb or 1.2% lower than the same time a year ago and 45.0 mb or 4.0% below the latest five-year average. The total stock-draw came from both crude and products, with declines of 3.3 mb and 3.5 mb, respectively. European crude inventories fell in March, reversing the build of the previous month to stand at 461.7 mb. Despite the stock-draw, crude inventories remained 2.4 mb or 0.5% above the same period last year, but still 9.5 mb or 2.0% below the latest five-year average. The fall in crude oil inventories came mainly as a result of lower supply, especially from North Africa and the Middle East regions. A decline in refinery crude runs amid spring turnarounds limited a further drop in crude stocks. Indeed, crude runs were 300 tb/d lower in March, compared with February, averaging around 9.53 mb/d. Graph 9.2: EU-15 plus Norway’s total oil stocks mb
mb
1,180
1,180
1,160
1,160
1,140
1,140
Max/Min 2008-12
1,120
1,120
1,100
1,100
1,080
1,080
1,060
1,060
1,040 Jan
Feb
Mar
Apr
May
2013
Jun 2014
Jul
Aug
Sep
Oct
Nov
1,040 Dec
Average 2009-13
OECD Europe’s product stocks fell by 3.5 mb in March, reversing the build of the previous three months. At 613.0 mb, European stocks were 15.5 mb or 2.5% below the same level a year ago and 35.5 mb or 5.5% below the seasonal norm. Within products, the picture was mixed; residual fuel oil stocks rose, while gasoline, distillate and naphtha inventories showed declines. Gasoline stocks fell by 1.2 mb, reversing the build of the previous three months, ending March at 113.1 mb. At this level, gasoline stocks showed a deficit of 6.2 mb or 5.2% below a year ago and were 3.1 mb or 2.6% less than the seasonal norm. The drop in gasoline stocks mainly reflected lower refinery output. Higher gasoline exports to the US also contributed to the stock-draw.
OPEC Monthly Oil Market Report – May 2014
81
Stock Movements Distillate stocks fell in March by 2.3 mb, reversing three consecutive months of build to stand at 398.6 mb. Despite this decline, distillate stocks indicated a surplus of 8.6 mb or 2.2% with a year ago, and were 4.8 mb or 1.2% above the five-year average. The drop came from lower refinery output. But weaker domestic demand for heating oil during a mild winter in Europe limited further stock-draws in distillates, keeping inventories above a year ago during the same period. In contrast, residual fuel oil stocks rose by 0.3 mb in March to end the month at 77.2 mb. At this level, they were 11.8 mb or 13.3% below the same time a year ago and 23.8 mb or 23.6% less than the seasonal average. The build in residual fuel oil inventories could be attributed to a decline in marine bunker fuel. Naphtha stocks fell by 0.4 mb in March to stand at 24.2 mb, showing a deficit of 6.0 mb or 19.9% with a year ago and 23.8 mb or 36.0 % below the latest five-year average. Table 9.2: EU-15 plus Norway’s total oil stocks, mb
Crude oil Gasoline Naphtha Middle distillates Fuel oils Total products Total
Jan 14 459.2 112.2 24.6 396.8 78.1 611.7 1,071.0
Feb 14 464.9 114.2 24.6 400.9 76.8 616.6 1,081.5
Mar 14 461.7 113.1 24.2 398.6 77.2 613.0 1,074.7
Change Mar 14/Feb 14 -3.3 -1.2 -0.4 -2.3 0.3 -3.5 -6.8
Mar 13 459.3 119.3 30.2 390.0 89.0 628.5 1,087.8
Source: Argus and Euroilstock.
US Preliminary data for April shows that US total commercial oil stocks rose strongly by 47.1 mb, reversing the decline of the previous month to stand at 1,084.1 mb. Despite this build, US commercial oil inventories stood 26.5 mb or 2.4% below a year ago during the same period, but were in line with the latest five-year average. Within the components, both crude and products rose - by 17.5 mb and 29.6 mb, respectively. US commercial crude stocks saw a build of 17.5 mb in April and showing four consecutive months of improvement to stand at 397.6 mb, after reaching nearly 400 mb in the week ending 25 April, the highest level on record. At this level, US crude oil commercial stocks finished the month at 1.7 mb or 0.4% above the five-year average and were 22.8 mb or 6.1% higher than a year ago at the same time. The build in commercial crude stocks was driven mainly by higher imports, which increased by more than 400,000 b/d to average 7.7 mb/d. Higher US crude oil production - reaching 8.3 mb/d - the highest level since 1988, also contributed to the build in US commercial crude oil stocks. However, the increase of 140,000 b/d in crude refinery runs limited a further build in crude inventories. At 15.7 mb/d, refineries operated at 89.6% of capacity, up from 86.3% in the previous month. While total US commercial crude oil stocks rose in April, inventories at Cushing, Oklahoma dropped by 3.2 mb, to end the month at 24.0 mb, around 26.0 mb lower than in the same period a year ago.
82
OPEC Monthly Oil Market Report – May 2014
Stock Movements Graph 9.3: US weekly commercial crude oil stocks mb
mb
400
400
380
380
360
360
340
340 Max/Min 2009-13
320
320
300
300
280
280 1
4
7
10
13
16
19
22
2013
25
28
31
34
37
2014
40
43
46
49
52
Average 2009-13
Total product stocks rose by 29.6 mb in April, reversing the fall of the previous six months. At 686.5 mb, US product stocks stood 28.2 mb or 3.9% below a year ago at the same time and showed a deficit of 22.1 mb or 3.1% with the seasonal norm. Gasoline and residual fuel oil stocks rose, while all other products saw a build, with the bulk coming in other unfinished products. Graph 9.4: US weekly gasoline stocks mb 245
mb 245
235
235
225
225
215
215
205
205 Max/Min 2009-13
195
195
185
185
175
175 1
4
7
10
13
16
19
22
2013
25 2014
28
31
34
37
40
43
46
49
52
Average 2009-13
Gasoline stocks declined by 2.4 mb in April, following a fall of 12.6 mb in March. At 213.2 mb, gasoline stocks were 7.9 mb or 3.6% lower than in the same period a year ago, but remained in line with the latest five-year average. The total drop in US gasoline stocks occurred in the first two weeks of the month. In the last two weeks of April, gasoline stocks saw a build as refiners were seen boosting gasoline production in preparation of the driving season. Distillate stocks rose by 1.0 mb in April to stand at 114.0 mb. At this level, distillate stocks were 4.1 mb or 3.4% below a year ago and remained 22.1 mb or 16.2% lower than the seasonal average. The build in middle distillate stocks came mainly from higher output, which increased by around 240 tb/d to average 4.6 mb/d. The increase in distillate apparent demand limited a further drop in distillate stocks.
OPEC Monthly Oil Market Report – May 2014
83
Stock Movements Residual fuel oil stocks fell by 0.7 mb to end April at 35.8 mb, which was 4.4 mb or 11% lower than a year ago and 2.6 mb or 6.7% below the seasonal norm. In contrast, Jet fuel stocks rose by 3.4 mb to stand at 39.1 mb, down by 2.3 mb or 5.4% from the same month a year ago and 2.6 mb or 6.7% below the latest five-year average. Table 9.3: US onland commercial petroleum stocks, mb Mar 14 380.1 215.6 113.0 36.5 35.6 1,037.0 696.0
Feb 14 373.3 228.2 112.9 36.7 38.3 1,047.0 696.0
Crude oil Gasoline Distillate fuel Residual fuel oil Jet fuel Total SPR
Apr 14 397.6 213.2 114.0 35.8 39.1 1,084.1 692.9
Change Apr 14/Mar 14 17.5 -2.4 1.0 -0.7 3.4 47.1 -3.1
Apr 13 395.9 221.1 118.1 40.2 41.3 1,110.5 696.0
Source: US Department of Energy’s Energy Information Administration.
Japan In Japan, total commercial oil stocks fell slightly by 0.6 mb in March, following a drop of 7.8 mb in February. At 147.5 mb, Japanese oil inventories were 20.6 mb or 12% below what they were a year ago and 19.2 mb or 11.5% lower than the five-year average. Within the components, crude stocks rose by 1.4 mb, while products fell by 2.0 mb. Japanese commercial crude oil stocks rose in March, reversing the previous month’s slight stock-draw to stand at 90.2 mb. At this level, they were 8.5 mb below a year ago at the same time and remained 8.9 mb below the five-year average. The stock-draw in crude oil was driven by lower crude runs, which fell by around 122 tb/d or 3.1% to average nearly 3.8 mb/d. At this level, they were 0.6% higher than the previous year at the same time. Japanese refiners were running at 82.6% of capacity in March, around 2.5 pp lower than in the previous month, but 1.7 pp more than in the same period a year ago. Lower crude oil imports limited a further build in crude oil stocks. Indeed, crude oil imports fell by 123 tb/d or 3.1% to average 3.8 mb/d. At this level, they were 8.1% less than in the same period last year. Direct crude burning in domestic power plants declined by nearly 33% in March, compared with the previous month, averaging 189 tb/d, but showing an increase of 2.3% over the same period a year ago. Graph 9.5: Japan’s commercial oil stocks mb
mb
190
190
180
180
170
170
160
160 Max/Min 2008-12
150
150
140 Jan
Feb
Mar 2013
84
Apr
May
Jun 2014
Jul
Aug
Sep
Oct
Nov
140 Dec
Average 2009-13
OPEC Monthly Oil Market Report – May 2014
Stock Movements Japan’s total product inventories fell by 2.0 mb in March, for the second consecutive month. At this level, product stocks showed a deficit of 12.1 mb or 17.4% compared with a year ago at the same time and remained below the five-year average by a deficit of 10.4 mb or 15.3%. Lower refinery throughput, combined with reduced product imports, contributed to the drop in product inventories. Within products, the picture was mixed; gasoline and distillates went down, while residual fuel oil and naphtha witnessed a stock-build. Gasoline stocks fell by 1.2 mb in March, reversing the build of the previous two months to stand at 11.7 mb, which was 2.2 mb or 15.6% less than the same time the previous year and 2.2 mb or 15.7% below the five-year average. A rise of 25.7% in domestic sales, combined with an increase of 6.7% in exports, was behind the stockdraw. Distillate stocks fell by 4.4 mb in March for the seventh consecutive month to finish at 21.2 mb, which was 7.0 mb or 25.0% below the same period a year ago and 5.4 mb or 20.4% lower than the seasonal average. All distillate components experienced a drop in March. Jet fuel inventories fell by 4.9% on the back of stronger domestic sales, which almost doubled in March, when compared with the previous month. Kerosene stocks fell by 10%, driven by lower production, combined with reduced exports. Gasoil inventories went down by 25% on the back of an increase of 25% in domestic sales. Total residual fuel oil stocks rose by 1.9 mb to end the month of March at 14.7 mb, which was 1.7 mb or 10.5% lower than a year ago and 1.2 mb or 7.8% below the fiveyear average. Within the fuel oil components, fuel oil A stocks rose by 5.1%, and fuel oil B.C stocks increased by 21%. The build in residual oil could be attributed to lower domestic sales, combined with higher output. Naphtha stocks rose by 1.7 mb, finishing the month of March at 9.7mb, indicating a deficit of 1.2 mb or 10.8% with a year ago and 1.5 mb or 13.6% below the seasonal norm. The stock-build came from lower domestic sales, which declined by nearly 9%. Table 9.4: Japan’s commercial oil stocks*, mb
Crude oil Gasoline Naphtha Middle distillates Residual fuel oil Total products Total**
Jan 14 89.2 12.0 8.6 31.1 14.9 66.7 155.9
Feb 14 88.8 13.0 8.0 25.6 12.8 59.3 148.1
Mar 14 90.2 11.7 9.7 21.2 14.7 57.3 147.5
Change Mar 14/Feb14 1.4 -1.2 1.7 -4.4 1.9 -2.0 -0.6
Mar 13 98.7 13.9 10.9 28.2 16.4 69.4 168.1
* At end of month. ** Includes crude oil and main products only. Source: Ministry of Economy, Trade and Industry, Japan.
OPEC Monthly Oil Market Report – May 2014
85
Stock Movements
China The latest information for March shows that Chinese total commercial oil inventories fell by 10.2 mb, reversing the build of the previous three months to stand at 410.3 mb. At this level, inventories were nearly 25 mb above last year at the same time. Within the components, both commercial crude and product stocks fell - by 6.9 mb and 3.3 mb, respectively. The fall in commercial crude stocks to a level of 140.8 mb came mainly from lower crude imports, which declined by around 560,000 b/d, averaging 5.5 mb/d; however, reduced refinery runs limited a further crude stock-draw. Total product stocks in China also went down in March to stand at 169.8 mb, representing a surplus of 4.5 mb with a year ago at the same time. Within the products, the picture was mixed; diesel indicated a drop of 5.2 mb, while gasoline and kerosene stocks rose by 1.2 mb and 0.7 mb, respectively. An improvement in diesel oil demand in March was behind the drop in diesel stocks. Table 9.5: China’s commercial oil stocks, mb
Crude oil Gasoline Diesel Jet kerosene Total products Total
Jan 14 237.5 59.6 76.5 14.5 150.6 388.1
Feb 14 247.7 65.8 92.1 15.2 173.1 420.8
Mar 14 240.8 67.0 86.9 15.9 169.8 410.6
Change Mar 14/Feb 14 -6.9 1.2 -5.2 0.7 -3.3 -10.2
Mar 13 220.5 61.9 89.9 13.4 165.2 385.8
Source: OPEC Secretariat analysis.
Singapore and Amsterdam-Rotterdam-Antwerp (ARA) At the end of March, oil product stocks in Singapore fell by 0.7 mb, reversing the build of the previous two months to stand at 42.2 mb. Despite this drop, product stocks in Singapore represented a surplus of 4.4 mb or 11.6% over the same period the previous year. Within products, the picture was mixed; light and middle distillates saw a decline, while residual fuel saw a build. Light distillate stocks fell by 2.8 mb in March, reversing the builds seen during the previous three months, to stand at 11.02 mb. At this level, stocks stood 0.1 mb or 1.2% higher than a year ago during the same period. At the same time, middle distillate stocks fell by 0.2 mb, ending March at 10.1 mb, but remaining 0.1 mb or 0.6% above a year ago during the same period. In contrast, residual fuel oil stocks rose slightly by 2.3 mb in March on the back of lower bunker demand in the region. At 20.9 mb, residual fuel oil stocks remained 4.2 mb or 25.3% above the same period last year. Product stocks in Amsterdam-Rotterdam-Antwerp (ARA) fell by 2.0 mb in March, reversing the build of the previous three months. At 29.9 mb, product stocks in ARA stood 5.4 mb or 15.3% below a year ago at the same time. Within the products, the picture was mixed; gasoline and naphtha experienced builds, while gasoil, residual fuel oil and jet fuel oil suffered declines. Gasoline stocks rose by 0.8 mb in March to stand at 9.2 mb, which was 1.0 mb or 12.4% higher than the same period last year. This stock-build was driven by higher arrivals. Naphtha stocks rose by 0.8 mb in March, reversing the drop of the previous month. At 1.6 mb, naphtha stocks were 0.7 mb higher than last year at the same time. In contrast, fuel oil stocks fell by 0.5 mb to end the month of March at 4.0 mb, indicating
86
OPEC Monthly Oil Market Report – May 2014
Stock Movements a deficit of 1.7 mb or almost 30.0% with a year earlier. Gasoil stocks fell by 2.6 mb in March, reversing the build of the previous two months to stand at 12.7 mb. At this level, they were 6.2% or 30% below last year at the same time. The drop came mainly from higher exports. Jet fuel oil stocks fell by 0.4 mb, ending March at 3.1 mb. Despite this stock-draw, jet fuel stocks were 0.7 mb or 31% higher than a year ago during the same period. The drop in jet fuel stocks in March could be attributed to an expected increase in demand from the aviation sector ahead of the Easter holiday.
OPEC Monthly Oil Market Report – May 2014
87
Balance of Supply and Demand
Balance of Supply and Demand Demand for OPEC crude in 2013 was revised up by 0.1 mb/d from the previous report to stand at 30.1 mb/d — 0.4 mb/d lower than the 2012 level. In 2014, demand for OPEC crude also saw an upward revision of 0.1 mb/d to average 29.8 mb/d, 0.4 mb/d less than one year earlier.
Estimate for 2013 Demand for OPEC crude in 2013 was revised up by 0.1 mb/d, driven mainly by a downward revision for OPEC NGLs. The first and the third quarters were revised up by 0.1 mb/d, while the second quarter saw an upward revision of 0.2 mb/d. The fourth quarter remained unchanged from the previous report at 0.1 mb/d. Total demand for OPEC crude stood at 30.1 mb/d in 2013, representing a decrease of 0.4 mb/d from 2012. The first quarter was 0.2 mb/d higher than the same period in 2012, while the second was lower by 0.1 mb/d. The third and fourth quarters experienced a negative growth of 0.7 mb/d and 0.8 mb/d, respectively. Table 10.1: Summarized supply/demand balance for 2013, mb/d 2012 88.96
1Q13 89.09
2Q13 89.17
3Q13 90.64
4Q13 91.10
2013 90.01
52.86 5.57 58.42
53.74 5.63 59.37
53.66 5.56 59.22
54.14 5.77 59.90
55.27 5.66 60.92
54.20 5.66 59.86
Difference (a-b)
30.53
29.72
29.96
30.73
30.17
30.15
OPEC crude oil production Balance
31.13 0.60
30.22 0.50
30.59 0.63
30.37 -0.37
29.69 -0.49
30.21 0.07
(a) World oil demand Non-OPEC supply OPEC NGLs and non-conventionals (b) Total supply excluding OPEC crude
Totals may not add up due to independent rounding.
Forecast for 2014 Demand for OPEC crude in 2014 was also revised up by 0.1 mb/d from the previous report, reflecting a downward adjustment in OPEC NGLs as world oil demand and nonOPEC supply remained unchanged. The first quarter was revised down by 0.1 mb/d, while the second and the third quarters were revised up by 0.1 mb/d and 0.2 mb/d, respectively. The fourth quarter was revised up by 0.3 mb/d. The demand for OPEC crude is projected to be 29.8 mb/d in 2014, representing a decrease of 0.4 mb/d from the previous year. The first and the second quarters are estimated to show a decline of 0.8 mb/d and 0.6 mb/d, respectively, versus the same period one year ago. The third quarter is expected to remain unchanged, while the fourth quarter is forecast to drop by 0.2 mb/d versus the same quarter last year. Table 10.2: Summarized supply/demand balance for 2014, mb/d (a) World oil demand Non-OPEC supply OPEC NGLs and non-conventionals (b) Total supply excluding OPEC crude
2013 90.01 54.20 5.66 59.86
1Q14 90.19 55.54 5.71 61.25
2Q14 90.21 55.07 5.77 60.84
3Q14 91.92 55.39 5.84 61.22
4Q14 92.25 56.34 5.91 62.25
2014 91.15 55.58 5.81 61.39
Difference (a-b)
30.15
28.94
29.37
30.70
30.00
29.76
OPEC crude oil production Balance
30.21 0.07
29.83 0.89
Totals may not add up due to independent rounding.
88
OPEC Monthly Oil Market Report – May 2014
Balance of Supply and Demand Graph 10.1: Balance of supply and demand mb/d
mb/d
32
32
31
31
30
30
29
29
28
28
27
27
26
26 1Q13
2Q13
3Q13
4Q13
OPEC crude production
OPEC Monthly Oil Market Report – May 2014
1Q14
2Q14
3Q14
4Q14
Required OPEC crude
89
Table 10.3: World oil demand and supply balance, mb/d 2010
2011
OECD
47.0
46.5
Americas
24.1
24.0
Europe
14.7
14.3
8.2
8.2
DCs
26.5
FSU
4.2
Other Europe China
2012
1Q13
2Q13
3Q13
4Q13
46.0
45.9
45.4
46.1
46.2
45.9
23.6
23.7
23.8
24.2
24.1
23.9
13.8
13.2
13.8
13.9
13.5
13.6
8.6
8.9
7.8
8.1
8.7
8.4
27.3
28.2
28.5
28.8
29.4
29.0
4.3
4.4
4.3
4.2
4.6
4.8
0.6
0.6
0.6
0.6
0.6
0.6
0.7
0.6
0.6
0.6
0.6
0.7
0.6
9.0
9.4
9.7
9.8
10.2
9.9
10.4
10.1
10.1
10.5
10.3
10.7
10.4
87.3
88.1
89.0
89.1
89.2
90.6
91.1
90.0
90.2
90.2
91.9
92.2
91.1
OECD
20.0
20.2
21.1
21.7
21.7
22.3
22.9
22.1
23.2
22.7
22.9
23.6
23.1
Americas
15.0
15.5
16.7
17.6
17.6
18.3
18.8
18.1
19.0
18.8
19.1
19.6
19.1
Europe
4.4
4.1
3.8
3.6
3.6
3.5
3.6
3.6
3.7
3.5
3.3
3.5
3.5
Asia Pacific
0.7
0.6
0.6
0.4
0.5
0.5
0.5
0.5
0.5
0.5
0.5
0.5
0.5
DCs
12.7
12.6
12.1
12.1
12.1
12.1
12.2
12.1
12.3
12.3
12.4
12.5
12.4
FSU
2013
1Q14
2Q14
3Q14
4Q14
45.8
45.2
46.0
46.1
45.8
23.9
23.9
24.4
24.3
24.1
13.1
13.5
13.7
13.4
13.4
8.8
7.7
7.9
8.5
8.2
28.9
29.3
29.6
30.3
29.8
29.8
4.5
4.4
4.2
4.6
4.9
4.5
2014
World demand
Asia Pacific
(a) Total world demand Non-OPEC supply
13.2
13.2
13.3
13.4
13.3
13.3
13.5
13.4
13.5
13.5
13.5
13.6
13.5
Other Europe
0.1
0.1
0.1
0.1
0.1
0.1
0.1
0.1
0.1
0.1
0.1
0.1
0.1
China
4.1
4.1
4.2
4.2
4.3
4.1
4.3
4.2
4.3
4.3
4.3
4.3
4.3
Processing gains
2.1
2.1
2.1
2.2
2.2
2.2
2.2
2.2
2.2
2.2
2.2
2.2
2.2
52.4
52.4
52.9
53.7
53.7
54.1
55.3
54.2
55.5
55.1
55.4
56.3
55.6
5.0
5.4
5.6
5.6
5.6
5.8
5.7
5.7
5.7
5.8
5.8
5.9
5.8
(b) Total non-OPEC supply and OPEC NGLs
57.3
57.8
58.4
59.4
59.2
59.9
60.9
59.9
61.2
60.8
61.2
62.2
61.4
OPEC crude oil production (secondary sources)
29.2
29.8
31.1
30.2
30.6
30.4
29.7
30.2
29.8
Total supply
86.6
87.6
89.6
89.6
89.8
90.3
90.6
90.1
91.1
Balance (stock change and miscellaneous)
-0.7
-0.5
0.6
0.5
0.6
-0.4
-0.5
0.1
0.9
Commercial
2,679
2,606
2,664
2,685
2,680
2,719
2,590
2,590
2,570
SPR
1,565
1,536
1,547
1,562
1,558
1,564
1,565
1,565
1,567
Total
4,244
4,142
4,212
4,247
4,238
4,282
4,155
4,155
4,137
871
825
879
942
871
878
909
909
954
Total non-OPEC supply OPEC NGLs + non-conventional oils
OECD closing stock levels (mb)
Oil-on-water
Days of forward consumption in OECD Commercial onland stocks
58
57
58
59
58
59
56
57
57
SPR
34
33
34
34
34
34
34
34
35
Total
91
90
92
94
92
93
91
91
91
Memo items FSU net exports (a) - (b)
9.1
8.9
8.8
9.1
9.2
8.8
8.7
8.9
9.1
9.2
8.8
8.7
9.0
29.9
30.3
30.5
29.7
30.0
30.7
30.2
30.1
28.9
29.4
30.7
30.0
29.8
Note: Totals may not add up due to independent rounding.
90
OPEC Monthly Oil Market Report – May 2014
Table 10.4: World oil demand/supply balance: changes from last month's table* , mb/d 2010
2011
2012
1Q13
2Q13
3Q13
4Q13
2013
1Q14
2Q14
3Q14
4Q14
2014
World demand OECD
-
-
-
-
-
-
-
-
-
-
-
-
-
Americas
-
-
-
-
-
-
-
-
-
-
-
-
-
Europe
-
-
-
-
-
-
-
-
-
-
-
-
-
Asia Pacific
-
-
-
-
-
-
-
-
-
-
-
-
-
DCs
-
-
-
-
-
-
-
-
-
-
-
-
-
FSU
-
-
-
-
-
-
-
-
-
-
-
-
-
Other Europe
-
-
-
-
-
-
-
-
-
-
-
-
-
China
-
-
-
-
-
-
-
-
-
-
-
-
-
(a) Total world demand
-
-
-
-
-
-
-
-
-
-
-
-
-
World demand growth
-
-
-
-
-
-
-
-
-
-
-
-
-
OECD
-
-
-
-
-
-
-
-
0.3
0.1
-
-
0.1
Americas
-
-
-
-
-
-
-
-
0.2
-
-
-
0.1
Europe
-
-
-
-
-
-
-
-
0.1
0.1
-
-
-
Non-OPEC supply
Asia Pacific
-
-
-
-
-
-
-
-
-
-
-
-
DCs
-
-
-
-
-
-
-
-
-
-
-
-
-
FSU
-
-
-
-
-
-
-
-
-
-0.1
-0.1
-0.2
-0.1
Other Europe
-
-
-
-
-
-
-
-
-
-
-
-
-
China
-
-
-
-
-
-
-
-
-
-
-
-
-
Processing gains
-
-
-
-
-
-
-
-
-
-
-
-
-
Total non-OPEC supply
-
-
-
-
-
-
-
-
0.3
0.1
-0.1
-0.2
-
Total non-OPEC supply growth
-
-
-
-
-
-
-
-
0.3
0.1
-0.1
-0.2
-
OPEC NGLs + non-conventionals
-
-
-
-0.1
-0.2
-
-0.2
-0.1
-0.2
-0.2
-0.1
-0.1
-0.1
(b) Total non-OPEC supply and OPEC NGLs
-
-
-
-0.1
-0.2
-
-0.1
-0.1
0.1
-0.1
-0.2
-0.3
-0.1
OPEC crude oil production (secondary sources)
-
-
-
-
-
-
-
-
-0.1
Total supply
-
-
-
-0.1
-0.2
-
-0.1
-0.1
0.1
Balance (stock change and miscellaneous)
-
-
-
-0.1
-0.2
-
-0.1
-0.1
0.1
Commercial
-
-
-
-
-
-
6
6
-
SPR
-
-
-
-
-
-
-
-
-
Total
-
-
-
-
-
-
7
7
-
-
-
-
47
-
-
-
-
-
OECD closing stock levels (mb)
Oil-on-water
Days of forward consumption in OECD Commercial onland stocks
-
-
-
-
-
-
-
-
-
SPR
-
-
-
-
-
-
-
-
-
Total
-
-
-
-
-
-
-
-
-
Memo items FSU net exports
-
-
-
-
-
-
-
-
-
-0.1
-0.1
-0.2
-0.1
(a) - (b)
-
-
-
0.1
0.2
-
0.1
0.1
-0.1
0.1
0.2
0.3
0.1
* This compares Table 10.3 in this issue of the MOMR with Table 10.3 in the April 2014 issue. This table shows only where changes have occurred.
OPEC Monthly Oil Market Report – May 2014
91
Table 10.5: OECD oil stocks and oil on water at the end of period 2011
2012
2013
1Q12
2Q12
3Q12
4Q12
1Q13
2Q13
3Q13
4Q13
1Q14
2,606
2,664
2,590
2,657
2,688
2,730
2,664
2,685
2,680
2,719
2,590
2,570
1,308
1,365
1,315
1,335
1,362
1,385
1,365
1,349
1,377
1,402
1,315
1,292
Europe
905
902
893
943
913
917
902
923
893
903
893
897
Asia Pacific
392
397
382
379
413
428
397
413
409
413
382
380
1,536
1,547
1,565
1,536
1,539
1,542
1,547
1,562
1,558
1,564
1,565
1,567
Americas
697
696
697
697
697
696
696
697
697
697
697
697
Europe
426
436
451
426
429
433
436
452
452
453
451
453
Closing stock levels, mb OECD onland commercial Americas
OECD SPR
Asia Pacific
414
415
417
414
413
414
415
413
409
413
417
417
4,142
4,212
4,155
4,194
4,227
4,272
4,212
4,247
4,238
4,282
4,155
4,137
825
879
909
787
812
844
879
942
871
878
909
954
57
58
57
58
59
59
58
59
58
59
57
57
Americas
55
57
55
57
57
58
58
57
57
58
55
54
Europe
66
66
67
68
66
67
68
67
64
67
68
66
Asia Pacific
46
47
46
47
50
49
44
53
51
48
43
49
33
34
34
34
34
33
34
34
34
34
34
35
Americas
29
29
29
30
29
29
29
29
29
29
29
29
Europe
31
32
34
31
31
32
33
33
33
34
34
33
OECD total Oil-on-water
Days of forward consumption in OECD OECD onland commercial
OECD SPR
Asia Pacific OECD total
92
48
50
51
51
50
47
46
53
51
48
47
54
90
92
91
92
92
92
92
94
92
93
91
91
OPEC Monthly Oil Market Report – May 2014
Table 10.6: Non-OPEC supply and OPEC natural gas liquids, mb/d
US Canada Mexico OECD Americas* Norway UK Denmark Other OECD Europe OECD Europe Australia Other Asia Pacific OECD Asia Pacific Total OECD Brunei India Indonesia Malaysia Thailand Vietnam Asia others Other Asia Argentina Brazil Colombia Trinidad & Tobago L. America others Latin America Bahrain Oman Syria Yemen Middle East Chad Congo Egypt Equatorial Guinea Gabon South Africa Sudans Africa other Africa Total DCs FSU Russia Kazakhstan Azerbaijan FSU others Other Europe China
2010 2011 2012 8.6 9.0 10.0 3.5 3.8 3.4 3.0 2.9 2.9 15.0 15.5 16.7 2.1 2.0 1.9 1.4 1.1 1.0 0.2 0.2 0.2 0.6 0.7 0.7 4.1 3.8 4.4 0.6 0.5 0.5 0.1 0.1 0.1 0.7 0.6 0.6 20.0 20.2 21.1 0.2 0.2 0.2 0.9 0.9 0.9 1.0 1.0 1.0 0.7 0.7 0.7 0.3 0.3 0.4 0.4 0.4 0.4 0.2 0.2 0.2 3.7 3.6 3.7 0.7 0.7 0.7 2.7 2.6 2.6 0.8 0.9 1.0 0.1 0.1 0.1 0.3 0.3 0.3 4.6 4.7 4.7 0.2 0.2 0.2 0.9 0.9 0.9 0.4 0.4 0.2 0.3 0.2 0.2 1.5 1.8 1.7 0.1 0.1 0.1 0.3 0.3 0.3 0.7 0.7 0.7 0.3 0.3 0.3 0.3 0.3 0.2 0.2 0.2 0.2 0.5 0.4 0.1 0.2 0.3 0.3 2.6 2.6 2.3 12.7 12.6 12.1 13.2 13.2 13.3 10.1 10.3 10.4 1.6 1.6 1.6 1.0 0.9 1.1 0.4 0.4 0.4 0.1 0.1 0.1 4.1 4.1 4.2
3Q13 4Q13 2013 11.4 11.8 11.2 4.0 4.1 4.0 2.9 2.9 2.9 18.3 18.8 18.1 1.8 1.9 1.8 0.9 0.9 0.8 0.2 0.2 0.2 0.7 0.7 0.7 3.6 3.6 3.5 0.4 0.4 0.4 0.1 0.1 0.1 0.5 0.5 0.5 22.3 22.9 22.1 0.1 0.1 0.1 0.9 0.9 0.9 0.9 0.9 0.9 0.6 0.7 0.7 0.4 0.4 0.4 0.4 0.4 0.4 0.2 0.2 0.2 3.5 3.5 3.6 0.7 0.7 0.7 2.7 2.6 2.6 1.0 1.0 1.0 0.1 0.1 0.1 0.3 0.3 0.3 4.8 4.8 4.8 0.2 0.2 0.2 0.9 0.9 0.9 0.0 0.1 0.1 0.1 0.1 0.1 1.4 1.3 1.4 0.1 0.1 0.1 0.3 0.3 0.3 0.7 0.7 0.7 0.3 0.3 0.3 0.2 0.2 0.2 0.2 0.2 0.2 0.3 0.3 0.2 0.3 0.3 0.3 2.4 2.5 2.4 12.1 12.2 12.1 13.3 13.5 13.4 10.5 10.6 10.5 1.6 1.6 1.7 0.9 0.8 0.9 0.4 0.4 0.4 0.1 0.1 0.1 4.2 4.1 4.3
Change Change 13/12 1Q14 2Q14 3Q14 4Q14 2014 14/13 0.9 1.1 11.9 11.8 12.1 12.5 12.1 0.2 4.2 4.1 4.2 4.3 4.2 0.2 2.8 -0.1 2.8 2.8 2.8 0.0 2.9 1.3 19.0 18.8 19.1 19.6 19.1 1.0 1.8 0.0 1.9 1.8 1.7 -0.1 1.9 -0.1 0.9 0.9 0.8 0.8 0.8 0.0 0.0 0.0 0.2 0.2 0.2 0.1 0.2 0.7 0.6 0.7 0.7 0.7 0.0 0.0 -0.2 3.7 3.5 3.3 3.5 3.5 -0.1 0.4 0.5 0.4 0.4 0.0 0.4 -0.1 0.0 0.1 0.1 0.1 0.1 0.1 0.0 0.0 0.5 0.5 -0.1 0.5 0.5 0.5 1.1 23.2 22.7 22.9 23.6 23.1 1.0 0.1 0.1 0.1 0.1 0.0 0.0 0.1 0.0 0.9 0.9 0.9 0.9 0.9 0.0 0.9 0.0 0.0 0.9 0.9 0.9 0.9 0.0 0.7 0.7 0.7 0.7 0.7 0.0 0.0 0.3 0.3 0.3 0.3 0.3 0.0 0.0 0.4 0.4 0.4 0.4 0.4 0.0 0.0 0.2 0.2 0.2 0.2 0.2 0.0 3.5 -0.1 3.6 3.5 3.5 3.5 0.0 0.7 0.7 0.7 0.7 0.0 0.0 0.7 2.9 0.0 2.7 2.7 2.8 2.8 0.2 1.0 0.0 0.1 1.0 1.1 1.0 1.1 0.0 0.1 0.1 0.1 0.1 0.1 0.0 0.0 0.3 0.3 0.3 0.3 0.3 0.0 5.0 5.1 4.9 0.2 0.1 4.8 4.9 0.0 0.2 0.2 0.2 0.2 0.2 0.0 1.0 1.0 1.0 0.0 0.0 1.0 1.0 -0.1 0.0 0.0 0.0 0.0 0.0 0.0 0.0 0.1 0.2 0.2 0.2 0.2 0.0 1.4 1.4 1.4 1.4 0.0 -0.1 1.3 0.0 0.1 0.1 0.1 0.1 0.1 0.0 0.3 0.3 0.2 0.2 0.3 0.0 0.0 0.0 0.7 0.7 0.7 0.7 0.7 0.0 0.3 0.0 0.0 0.3 0.3 0.3 0.3 0.0 0.2 0.2 0.2 0.2 0.2 0.0 0.0 0.2 0.2 0.2 0.2 0.2 0.0 0.4 0.4 0.3 0.1 0.1 0.3 0.3 0.0 0.0 0.3 0.4 0.4 0.4 0.4 2.5 0.1 2.5 2.5 2.5 2.5 0.1 0.0 12.3 12.3 12.4 12.5 12.4 0.2 0.1 13.5 13.5 13.5 13.6 13.5 0.1 0.1 10.6 10.5 10.6 10.7 10.6 0.1 0.1 1.6 1.6 1.6 1.6 1.6 0.0 0.0 0.8 0.9 0.9 0.9 0.9 0.0 0.0 0.4 0.4 0.4 0.4 0.4 0.0 0.0 0.1 0.1 0.1 0.1 0.1 0.0 0.1 4.3 4.3 4.3 4.3 4.3 0.0
Non-OPEC production
50.2
50.3
50.7
52.0
53.1
52.0
1.3
53.4
52.9
53.2
54.2
53.4
1.4
Processing gains Non-OPEC supply OPEC NGL OPEC non-conventional OPEC (NGL+NCF) Non-OPEC & OPEC (NGL+NCF)
2.1 52.4 4.9 0.1 5.0
2.1 52.4 5.2 0.1 5.4
2.1 52.9 5.4 0.2 5.6
2.2 54.1 5.5 0.2 5.8
2.2 55.3 5.4 0.2 5.7
2.2 54.2 5.4 0.2 5.7
0.0 1.3 0.1 0.0 0.1
2.2 55.5 5.5 0.2 5.7
2.2 55.1 5.5 0.2 5.8
2.2 55.4 5.6 0.3 5.8
2.2 56.3 5.6 0.3 5.9
2.2 55.6 5.6 0.3 5.8
0.0 1.4 0.1 0.0 0.2
57.3
57.8
58.4
59.9
60.9
59.9
1.4
61.2
60.8
61.2
62.2
61.4
1.5
* Chile has been included in OECD Americas. Notes: Totals may not add up due to independent rounding.
OPEC Monthly Oil Market Report – May 2014
93
Table 10.7: World Rig Count
US Canada Mexico Americas
2010 2011 2012 2013 1,541 1,881 1,919 1,761 347 423 366 354 97
94
106
Change 13/12 2Q13 3Q13 4Q13 1Q14 Mar 14 -158 1,761 1,769 1,758 1,780 1,803 -12 154 348 379 526 449
106
1,985 2,398 2,391 2,221
0
107
100
101
Apr 14 1,835 203
Change Apr/Mar 32 -246
93
88
87
-1
-170 2,023 2,217 2,238 2,400
2,340
2,125
-215
Norway
18
17
17
20
2
19
21
18
17
21
21
0
UK
19
16
18
17
-1
17
16
14
15
17
20
3
Europe
94
118
119
135
16
133
140
133
135
148
151
3
Asia Pacific
21
17
24
27
3
28
24
25
28
26
28
2
-151 2,184 2,382 2,396 2,563
Total OECD
2,100 2,532 2,534 2,383
2,514
2,304
-210
Other Asia
248
239
217
219
2
224
216
219
230
232
224
-8
Latin America
205
195
180
166
-14
170
159
168
164
170
178
8
Middle East
156
104
110
76
-33
78
69
86
84
81
85
4
19
2
7
16
9
15
15
24
27
28
30
2
628
540
513
477
-36
487
459
497
504
511
517
6
-187 2,670 2,841 2,894 3,067
3,025
2,821
-204
Africa Total DCs Non-OPEC rig count
2,727 3,072 3,047 2,860
Algeria
25
31
36
47
11
48
48
47
49
44
49
5
Angola
9
10
9
11
2
10
12
14
16
14
16
2
Ecuador
11
12
20
26
6
26
27
26
25
25
25
0
Iran**
52
54
54
54
0
54
54
54
54
54
54
0
Iraq**
36
36
58
83
25
80
93
92
89
90
89
-1
Kuwait**
20
57
57
58
1
58
58
57
60
60
60
0
Libya**
16
8
12
15
3
15
14
14
15
12
8
-4
Nigeria
15
36
36
37
1
40
34
36
35
34
33
-1
Qatar
9
8
8
9
1
8
10
8
11
11
11
0
Saudi Arabia
67
100
112
114
3
114
111
115
125
127
129
2
UAE
13
21
24
28
4
27
28
30
30
30
31
1
Venezuela
70
122
117
121
3
122
121
121
121
123
113
-10
342
494
542
602
60
601
611
614
629
624
618
-6
3,069 3,566 3,589 3,462
-127 3,271 3,452 3,508 3,696
3,649
3,439
-210
Oil
1,701 2,257 2,654 2,611
-43 2,490 2,595 2,631 2,819
2,797
2,661
-136
Gas
1,325 1,262
OPEC rig count Worldwide rig count* of which:
Others
43
49
886
746
-140
673
747
769
780
754
681
-73
52
109
57
112
114
110
99
100
99
-1
Note: Totals may not add up due to independent rounding. na: Not available. Sources: Baker Hughes Incorporated & Secretariat's estimates.
94
* Excludes China and FSU. ** Estimated figure when Baker Hughes Incorporated did not reported the data.
OPEC Monthly Oil Market Report – May 2014
Contributors to the OPEC Monthly Oil Market Report Editor-in-Chief Omar S. Abdul-Hamid, Director, Research Division email:
[email protected]
Editor Hojatollah Ghanimi Fard, Head, Petroleum Studies Department email:
[email protected]
Analysts Crude Oil Price Movements
Eissa Alzerma email:
[email protected]
Commodity Markets
Eissa Alzerma email:
[email protected] Joerg Spitzy email:
[email protected]
World Economy
Afshin Javan email:
[email protected] Imad Alam Al-Deen email:
[email protected] Joerg Spitzy email:
[email protected]
World Oil Demand
Hassan Balfakeih email:
[email protected]
World Oil Supply
Mohammad Ali Danesh email:
[email protected]
Product Markets and Refinery Operations
Elio Rodriguez email:
[email protected]
Tanker Market and Oil Trade
Anisah Almadhayyan email:
[email protected]
Stock Movements
Aziz Yahyai email:
[email protected]
Technical and editorial team
Aziz Yahyai email:
[email protected] Douglas Linton email:
[email protected]
Data services Adedapo Odulaja, Head, Data Services Department (
[email protected]), Pantelis Christodoulides (World Oil Demand and Stock Movements), Klaus Stoeger (World Oil Supply), Harvir Kalirai (World Economy), Mouhamad Moudassir (Product Markets and Refinery Operations), Mohammed Sattar (Crude Oil Price Movements), Anna Gredinger (Tanker Market and Oil Trade)
Editing, production, design and circulation Jerry Haylins, Alvino-Mario Fantini, Maureen MacNeill, Scott Laury, Viveca Hameder, Hataichanok Leimlehner, Evelyn Oduro-Kwateng, Andrea Birnbach
OPEC Monthly Oil Market Report – May 2014
95
Disclaimer
The data, analysis and any other information contained in the Monthly Oil Market Report (the “MOMR”) is for informational purposes only and is not intended as a substitute for advice from your business, finance, investment consultant or other professional. The views expressed in the MOMR are those of the OPEC Secretariat and do not necessarily reflect the views of its Governing Bodies and/or individual OPEC Member Countries. Whilst reasonable efforts have been made to ensure the accuracy of the MOMR’s content, the OPEC Secretariat makes no warranties or representations as to its accuracy, currency reference or comprehensiveness, and assumes no liability or responsibility for any inaccuracy, error or omission, or for any loss or damage arising in connection with or attributable to any action or decision taken as a result of using or relying on the information in the MOMR. The MOMR may contain references to material(s) from third parties whose copyright must be acknowledged by obtaining necessary authorization from the copyright owner(s). The OPEC Secretariat shall not be liable or responsible for any unauthorized use of third party material(s). All rights of the Publication shall be reserved to the OPEC Secretariat, including every exclusive economic right, in full or per excerpts, with special reference but without limitation, to the right to publish it by press and/or by any communications medium whatsoever, including Internet; translate, include in a data base, make changes, transform and process for any kind of use, including radio, television or cinema adaptations, as well as sound-video recording, audio-visual screenplays and electronic processing of any kind and nature whatsoever. Full reproduction, copying or transmission of the MOMR is not permitted in any form or by any means by third parties without the OPEC Secretariat’s written permission, however the information contained therein may be used and/or reproduced for educational and other noncommercial purposes without the OPEC Secretariat’s prior written permission, provided that OPEC is fully acknowledged as the copyright holder.
96
OPEC Monthly Oil Market Report – May 2014
OPEC Basket average price
US$/b
up 0.12 in April
April 2014
104.27
March 2014
104.15
Year to date
104.62
April OPEC crude production
mb/d, according to secondary sources
up 0.13 in April
April 2014
29.59
March 2014
29.46
Economic growth rate
per cent
World
OECD
US
Japan
Euro-zone
China
India
2013
2.9
1.3
1.9
1.5
–0.4
7.7
4.7
2014
3.4
2.0
2.4
1.3
1.0
7.5
5.6
Supply and demand 2013
mb/d
12/13
2014
13/14
World demand
90.0
1.0
World demand
91.1
1.1
Non-OPEC supply
54.2
1.3
Non-OPEC supply
55.6
1.4
5.7
0.1
OPEC NGLs
5.8
0.2
30.1
–0.4
29.8
–0.4
OPEC NGLs Difference
Difference
OECD commercial stocks
mb
Mar 14/Feb 14
Jan 14
Feb 14
Mar 14
Crude oil
1,234
1,245
1,250
4.8
1,300
Products
1,359
1,342
1,320
–21.8
1,385
Total
2,594
2,587
2,570
–17.0
2,685
56.7
57.2
56.8
–0.3
59.1
Days of forward cover
Next report to be issued on 12 June 2014.
Mar 13