OPEC Monthly Oil Market Report
12 October 2015
Feature article:
Non-OPEC oil supply development
Oil market highlights
1
Feature article
3
Crude oil price movements
5
Commodity markets
12
World economy
17
World oil demand
34
World oil supply
43
Product markets and refinery operations
65
Tanker market
72
Oil trade
76
Stock movements
84
Balance of supply and demand
93
Organization of the Petroleum Exporting Countries Helferstorferstrasse 17, A-1010 Vienna, Austria E-mail:
[email protected] Website: www.opec.org
Oil market highlights Crude Oil Price Movements The OPEC Reference Basket averaged $44.83/b in September, representing a decline from the previous month of 63¢. Fundamentals factors that have weighed on the market for more than a year have persisted, but are starting to show signs of alleviation. ICE Brent averaged $48.54/b, a gain of 33¢ over the previous month, and Nymex WTI averaged $45.47/b, up $2.58. The Brent-WTI spread narrowed sharply from $5.32/b to $3.07/b.
World Economy World economic growth remains unchanged at 3.1% for 2015 and 3.4% for 2016. OECD growth also remains unchanged for both years at 2.0% and 2.1%, respectively. Key emerging economies are increasingly facing challenges and while the growth forecast for China and India remains unchanged, both Brazil’s and Russia’s growth have been revised down by 0.2 percentage points for 2015 and 2016.
World Oil Demand World oil demand growth in 2015 is foreseen to rise by 1.50 mb/d, following an upward revision of around 40 tb/d, mostly due to better-than-expected data in 3Q15. Total oil demand is now forecast at 92.86 mb/d. In 2016, world oil demand is anticipated to rise by 1.25 mb/d, following a downward revision of 40 tb/d, mainly to reflect the high base-line effect. As a result, world oil demand is forecast to reach 94.11 mb/d.
World Oil Supply Non-OPEC oil supply growth in 2015 now stands at 0.72 mb/d, following a downward revision of 0.16 mb/d from the previous report, attributed mainly to a downward adjustment in the US. For 2016, non-OPEC oil supply is expected to show a clear contraction of 0.13 mb/d, following a downward revision of 0.29 mb/d compared to the previous assessment. OPEC NGLs are expected to grow by 0.17 mb/d in 2016, following growth of 0.19 mb/d this year. In September, OPEC crude production increased by 109 tb/d to average 31.57 mb/d, according to secondary sources.
Product Markets and Refining Operations Product markets in the Atlantic Basin weakened during September due to a sharp drop in the gasoline crack spread following the end of the US driving season. Combined with increasing inventories, this caused the refinery margins to fall in the region. Asian margins strengthened on the back of tightening sentiment, fuelled by the onset of regional refinery maintenance and a downward correction in Dubai crude prices.
Tanker Market Dirty vessel spot freight rates saw mixed movements in September, with VLCCs showing the strongest growth. Compared to the previous month, VLCC and Suezmax spot freight rates increased by 27% and 5%, respectively, while Aframax rates declined. Chartering activities in the Middle East and West Africa, along with port delays, supported the gains. In the clean tanker market, West of Suez activities were behind the marginal increase in spot freight rates, while East of Suez rates remained weak.
Stock Movements OECD commercial oil stocks rose further in August to stand at 2,933 mb. At this level, inventories were around 194 mb higher than the five-year average. Crude and products showed a surplus of around 167 mb and 27 mb, respectively. In terms of days of forward cover, OECD commercial stocks stood at 63.3 days in August, some 4.5 days higher than the five-year average.
Balance of Supply and Demand Demand for OPEC crude in 2015 is estimated to stand at 29.6 mb/d, 0.3 mb/d higher than the previous report and 0.6 mb/d above the previous year’s level. In 2016, demand for OPEC crude is forecast at 30.8 mb/d, an increase of 0.5 mb/d over the previous report and around 1.2 mb/d higher than the current year.
OPEC Monthly Oil Market Report – October 2015
1
2
OPEC Monthly Oil Market Report – October 2015
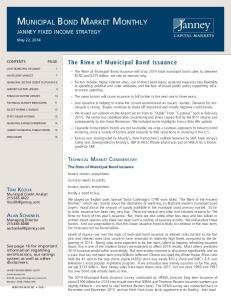
Non-OPEC oil supply development Last year, non-OPEC oil supply witnessed a record-high growth of 2.24 mb/d. OECD Americas saw the highest output of all regions with an increase of 1.92 mb/d, much of which came from non-conventional sources. Actual data for the first half of this year shows non-OPEC supply grew by 1.77 mb/d, before dropping to 0.42 mb/d in the third quarter, according to preliminary data (Graph 1). This declining trend has been driven mainly by the low oil price environment, with prices down by around 50% since 3Q14. As a result, the oil industry has experienced a rapid fall in global upstream spending, down by more than 20%, with North America cutting as much as 35% (Graph 2). This has led to lower activity – less drilling and the delay or cancellation of new projects – which has put pressure on production growth. Moreover, the current price environment has incentivized the entire oil industry to become more efficient and cost effective. Graph 1: Non-OPEC supply growth, y-o-y
Graph 2: Global exploration & production spending US$ bn
mb/d 3.0 2.5 2.0 1.5 1.0 0.5 0.0 -0.5 -1.0 -1.5
700
20%
600
2014
500
2015
400 35%
300 200 4Q 2014
1Q
2Q
3Q
4Q*
2015
* Forecast. Source: OPEC.
100 0 World
North America
* Forecast. Source: Barclays Research.
The case of tight oil supply provides a clear example. With the decline in oil prices, rig counts were reduced by half and US shale producers took steps to increase efficiency and cost saving. Smaller operators active in tight oil have been particularly impacted by low prices, as they are usually pressed for cash. Many companies have also attempted to endure by hedging their crude output, as well as securing new loans. More recently, accessing credit has become more challenging as the decline in oil prices has diminished the value of companies’ collateral. This has resulted in less cash available for capex, leading to an evident acceleration in the decline in production in 3Q15. In light of these developments, US liquids output in the last quarter of this year is expected to show a contraction of 0.15 mb/d quarter-on-quarter and by 0.33 mb/d year-on-year, down from 1.91 mb/d in 4Q14. In terms of non-OPEC supply, the impact of lower oil prices on production has resulted in the supply growth forecast being downwardly revised to 0.72 mb/d in 2015, some 0.6 mb/d less than the initial forecast and well below the previous year. In 2016, the postponing or cancelling of upstream projects will likely continue, resulting in contraction of 0.13 mb/d in non-OPEC supply. US oil supply in 2016 is expected to decline by 0.1 mb/d. Production in FSU, Africa, Middle East and OECD Europe is also expected to fall. In contrast, Brazil’s output is projected to increase, although at a slower pace as a number of anticipated projects have been deferred. The 2016 forecast for non-OPEC supply is associated with a high level of uncertainty. Oil price fluctuations and technical challenges – such as unplanned shutdowns and sharper-than-expected decline rates – along with geopolitical conditions could affect non-OPEC supply in the coming year. While the increase in non-OPEC supply last year was more than twice that of global oil demand growth, this relationship is expected to flip this year before widening further in 2016 so that world oil demand growth exceeds the change in non-OPEC supply. This should reduce the excess supply in the market and lead to higher demand for OPEC crude. Required OPEC crude in 2016 is expected to average 30.8 mb/d, with the second half of the year reaching as high as 31.4 mb/d, resulting in more balanced oil market fundamentals.
OPEC Monthly Oil Market Report – October 2015
3
4
OPEC Monthly Oil Market Report – October 2015
Crude Oil Price Movements
Crude Oil Price Movements The OPEC Reference Basket (ORB) slipped slightly, hovering around the level of $45/b for the entire month. The numerous fundamental factors that have been negatively affecting the oil market for more than a year continue to loom, but have started to show signs of alleviation, as demand picked up and stocks were drawn in some regions and as clearance of the overhang in West African crude made good progress. M-o-m, the ORB dropped by a marginal 63¢ to $44.83/b, but q-o-q it plunged to its worst level in six years and remained significantly lower y-o-y. Crude oil futures were up after two months of steep declines. ICE Brent settled up 33¢ at $48.54/b, while Nymex WTI jumped by $2.58 to $45.47/b. Compared to a year ago, both remain significantly lower year-to-date at $51/b and $56.61/b, respectively. Speculators’ overall bullish bets on crude oil grew over the month as long positions in futures and options rose, while the group's short positions, or bets on lower oil prices, fell. The Brent premium over WTI eased considerably over the month, by more than $2, as the US marker was supported by inventory draws at its pricing hub, while Brent was pressured by oversupply. The Brent-WTI (transatlantic) spread narrowed from $5.30/b in August to $3.05/b in September, its narrowest since January.
OPEC Reference Basket The ORB slipped slightly over the month as its value seems to be bottoming out around the low levels reached in the previous month, hovering around the $45/b-level for the entire month. Meanwhile, the numerous fundamental factors that have been negatively affecting the oil market for more than a year continue to loom, but have started to show signs of alleviation, particularly as regards oversupply. The oil glut eased somewhat as demand picked up in some regions while stocks were drawn, particularly in the US midcontinent. Additional contributing factors included the clearance of the overhang in West African crude, which made good progress, as well as stagnating oil production growth. For the quarter, the ORB plunged to its lowest level since the first quarter of 2009 during the financial crisis. Beside the ongoing oversupply pressure on the oil market, economic turmoil, particularly in China, and a significant decline in global equity and commodity markets helped to depress oil prices further in the third quarter. China’s industrial sector – the engine of the country’s energy demand – performed more poorly than expected over the quarter. Graph 1.1: Crude oil price movement, 2015 US$/b
US$/b
70
70
65
65
60 60
55 50
55
45
50
40 45
35
OPEC Basket
OPEC Monthly Oil Market Report – October 2015
WTI
02 Oct
25 Sep
18 Sep
11 Sep
04 Sep
28 Aug
21 Aug
14 Aug
07 Aug
31 Jul
24 Jul
17 Jul
10 Jul
03 Jul
26 Jun
19 Jun
12 Jun
05 Jun
29 May
22 May
15 May
08 May
40
01 May
30
Brent Dated
5
Crude Oil Price Movements On a monthly basis, the ORB fell by a marginal 63¢ to average $44.83/b. For the quarter, it slipped by a hefty $11.73 or almost 20% to $48.16/b, compared to its almost $60/b value in 2Q15. Compared to a year ago, the ORB value is lagging at $52.79/b versus the $103.78/b year-to-date value of 2014. Global oil benchmarks were mixed in September, with the spot value of Dated Brent and WTI expanding by 89¢ and $2.71, respectively, while Dubai fell by $2.49. This resulted in a diverse performance for the Basket components, where Brent-related crude values improved, while the Dubai and multi-destination grades saw their prices deteriorating. The Dubai marker value saw a correction, from the previous unusual spread relative to Brent that made it higher in value than Brent, despite the latter being lighter and sweeter crude. The Brent/Dubai spread flipped back from -90¢/b to +$2.23/b in September, amid the return of a steeply contangoed market structure coupled with much less liquidity in the Asian spot crude market. Ample supply weighed on the Middle East crude market, although improving refining margins and the opportunity for floating storage provided some support. On the other hand, spot differentials for African Brent-related crudes continued to improve on slightly more robust sales amid steady demand from European refiners and some buying from the United States, which has picked up due to a lower premium of Brent to WTI. Several Atlantic Basin refiners delayed their seasonal maintenance to capitalize on healthy margins. Asian tender-related buying was also supportive late in the month. Brentrelated West and Northern African light sweet Basket components, Saharan Blend, Es Sider, Girassol and Bonny Light increased in value by 90¢ or 2% to $47.77/b in September. Middle Eastern spot components and multi-destination grades slipped by about 50¢ and $1.20 to settle at $47.38/b and $44.39/b, respectively. For the Latin American ORB components, Merey was down by $1.13 or 1.4%, while Oriente edged up by about $1.30 or 3.2%, gaining some support from the improving US crude oil market. On 9 October, the OPEC Reference Basket was up at $48.80/b, $3.97 above the September average.
6
OPEC Monthly Oil Market Report – October 2015
Crude Oil Price Movements Table 1.1: OPEC Reference Basket and selected crudes, US$/b Aug 15 45.46 46.52 44.32 47.07 45.82 47.42 46.25 45.28 46.98 35.26 48.83 39.75 47.17
Sep 15 44.83 45.56 43.41 48.01 46.71 48.01 44.62 43.96 45.88 34.13 48.88 41.03 48.36
Change Sep/Aug -0.63 -0.96 -0.91 0.94 0.89 0.59 -1.63 -1.32 -1.10 -1.13 0.05 1.28 1.19
Other Crudes Brent Dubai Isthmus LLS Mars Minas Urals WTI
46.72 47.87 46.56 47.07 42.52 42.46 46.22 42.77
47.61 45.38 47.71 48.64 43.10 42.05 47.19 45.48
0.89 -2.49 1.15 1.57 0.58 -0.41 0.97 2.71
106.54 103.98 99.84 103.63 99.60 106.95 105.41 99.77
55.36 54.38 54.01 55.32 51.34 52.67 55.07 50.98
Differentials Brent/WTI Brent/LLS Brent/Dubai
3.95 -0.35 -1.15
2.13 -1.03 2.23
-1.82 -0.68 3.38
6.77 2.92 2.56
4.38 0.04 0.98
OPEC Reference Basket Arab Light Basrah Light Bonny Light Es Sider Girassol Iran Heavy Kuwait Export Marine Merey Murban Oriente Saharan Blend
Year-to-date 2015 2014 103.78 52.79 104.74 53.21 101.85 51.17 108.50 55.96 106.02 54.31 106.86 56.09 103.86 52.30 102.91 51.61 103.80 54.11 93.96 44.66 106.97 56.90 94.05 47.90 107.20 55.60
Note: Arab Light and other Saudi Arab ian crudes as well as Basrah Light preliminarily b ased on American Crude Market (ACM) and sub ject to revision. Sources: Platt's, Direct Communication and Secretariat's assessments.
The oil futures market Crude oil futures were up after two months of steep declines, despite the fact that the year-long imbalance in oil supply and demand fundamentals has not changed profoundly. Some overhung crudes found homes, while demand picked up in some regions and production was lower in others, but the glut of oil remained. This was coupled with worries about top energy consumer China, which continues to cap oil prices at the current low levels. This month, the largest gain came from Nymex WTI futures supported by positive US economic data, slowing shale oil production growth and consecutive weeks of inventory draws at the pricing hub of the contract. The global ICE Brent future contract gains were limited by China’s lower-than-expected economic performance and the ongoing oil oversupply. For the quarter, both futures plunged by almost a hefty 20% to their lowest level in six years as the glut in oil, economic turbulence in China and disappointing equity and commodity markets pressured the market. ICE Brent ended the month up slightly by 33¢ or less than 1% to stand at $48.54/b. Nymex WTI improved m-o-m by $2.58 or 6% to settle at $45.47/b. Quarterly, Brent and WTI futures averaged $51.17/b and $46.43/b in 3Q15, down by $12.33 and $11.50 from 2Q15, respectively. Compared to 2014, Nymex WTI and ICE Brent were at $41.39/b and $50.41/b, lower by $51 and $56.61, respectively.
OPEC Monthly Oil Market Report – October 2015
7
Crude Oil Price Movements Crude oil futures prices improved in the second week of October. On 9 October, ICE Brent stood at $52.65/b and Nymex WTI at $49.63/b. Hedge fund managers' overall bullish bets on US crude grew over the month. Long positions in futures and options of WTI held by money managers, including hedge funds, rose by 10,408 contracts to 266,678 lots by the end of the month, data from the US Commodity Futures Trading Commission (CFTC) showed. The group's short positions, or bets on lower oil prices, fell by 44,330 contracts to 112,764 lots as more took profit from WTI prices that firmed at around $45/b after sinking to a 6-1/2 year bottom below $38/b a month ago. As a result, money managers' net length rose by 54,738 contracts from the previous month at 99,176 lots. Similarly in ICE Brent, speculators increased net length ICE Brent futures and options by 27,531 contracts to 168,913 lots over the month, InterContinental Exchange (ICE) data showed. This comes as a result of dropping 22,708 short contracts and accumulating 4,823 longs. The long contracts stood at 268,665 lots while shorts stood at 99,208 lots. On the other hand, the total futures and options open interest volume in the two markets declined 33,414 lots to 5.05 million contracts. Graph 1.3: ICE Brent price vs. speculative activity, 2014-2015
'000 Contracts
US$/b 100
350
90
300
80
250
70
200
60
150
50 30
50 Sep 14 Oct 14 Nov 14 Dec 14 Jan 15 Feb 15 Mar 15 Apr 15 May 15 Jun 15 Jul 15 Aug 15 Sep 15
40
100
Managed money net long positions (RHS) WTI (LHS) Source: CFTC.
US$/b 110 100 90 80 70 60 50 40 30
'000 Contracts 350 300 250 200 150 100 50 0
Sep 14 Oct 14 Nov 14 Dec 14 Jan 15 Feb 15 Mar 15 Apr 15 May 15 Jun 15 Jul 15 Aug 15 Sep 15
Graph 1.2: Nymex WTI price vs. speculative activity, 2014-2015
Managed money net long positions (RHS) ICE Brent (LHS) Source: IntercontinentalExchange, Inc.
The average daily traded volume during September for Nymex WTI contracts decreased by 115,424 lots to average 798,718 contracts. Similarly, ICE Brent daily traded volume slid by 115,056 contracts to 650,664 lots. The daily aggregate traded volume in both crude oil futures markets decreased by 230,481 lots to stand at around 1.5 million futures contracts, equivalent to approximately 1.5 billion barrels per day. The total traded volume in Nymex WTI was down sharply at 16 million contracts, and similarly ICE Brent was lower at 13.7 million lots.
8
OPEC Monthly Oil Market Report – October 2015
Crude Oil Price Movements
The futures market structure The contango structure in WTI eased significantly in September, indicating that the US market may be coming out of a lengthy oil surplus. At the end of the month, the price of the cash WTI prompt month rallied to trade at parity with next month’s delivery. That was its tightest spread since last November, when the crude market flipped into a contango. The tighter spread is partly the result of an unexpected decline in stockpiles at Cushing, as US output fell faster than expected and favourable profit margins that have prompted refiners to run at high rates for a longer period, particularly as fuel demand remains robust. Stocks at Cushing have fallen in the past five weeks to the end of the month, the longest running decline since late April, when inventories were coming off a record high. The WTI contango narrowed by about 40¢, where (M1-M3) decreased to $1/b. In the Brent market, the contango widened by 15¢, with (M1-M3) at $1.65/b amid ample supply as North Sea crude oil output rose to its highest in just over two years in October. Ample supply also came from Nigeria, whose light sweet crude oil competes with oil from the North Sea. The maintenance delay of the Buzzard field, the largest of the four North Sea crudes used in the global Brent oil benchmark, also boosted supplies. This is despite around 6 million barrels of Forties heading to South Korea in October and good refinery intake amid healthy refining margins. Graph 1.4: Nymex WTI and ICE Brent forward curves, 2015 US$/b 60
US$/b 60
55
55
50
50
45
45
40
40
35 1FM
2FM
3FM
4FM
5FM
6FM
ICE Brent: 24 Aug 15 Nymex WTI: 24 Aug 15
7FM
8FM
9FM
10FM
11FM
35 12FM
ICE Brent: 24 Sep 15 Nymex WTI: 24 Sep 15
FM = future month.
Meanwhile, the Middle East crude market structure, represented by Dubai, flipped back to a steep contango from the previous month’s artificial backwardation created by aggressive buying by Chinese companies in the Platt’s pricing assessment window. A weak Asian spot market, along with ample supplies, enforced the contango structure despite improving refining margins in the Asian region. For the month, Dubai’s backwardation market structure of the previous month flipped back into a contango where M1 is at steep $2.25/b discount to M3 from a 37¢/b premium. The Brent premium over WTI eased considerably over the month by more than $2, supporting the US imports of West African crudes. The US marker was supported as inventories at its pricing hub saw repeated stock draws over the entire month, from previous record highs, while Brent was pressured by oversupply. The Brent-WTI (transatlantic) spread narrowed by $2.25 from $5.30/b in August to $3.05/b in September, the narrowest since January.
OPEC Monthly Oil Market Report – October 2015
9
Crude Oil Price Movements Table 1.2: Nymex WTI and ICE Brent forward curves, US$/b Nymex WTI 24 Aug 15 24 Sep 15
1st FM 38.24 44.91
2nd FM 38.93 45.48
3rd FM 39.65 46.18
6th FM 41.66 48.17
12th FM 44.59 50.36
24 Aug 15 24 Sep 15
1st FM 42.69 48.17
2nd FM 43.49 48.86
3rd FM 44.29 49.59
6th FM 46.44 51.69
12th FM 49.79 54.60
ICE Brent
FM = future month.
The light sweet/medium sour crude spread The sweet/sour spread widened sharply in all regions except in Europe, where they narrowed slightly. In Asia, the sweet/sour spread, represented by the Tapis/Dubai spread, put an end to its seven-month-long narrowing trend as the Brent/Dubai spread headed back to normal levels, whereas Dubai stands at a discount of over $2/b to Brent. This wider Brent/Dubai gap somewhat affected the arbitrage economics related to the Atlantic Basin light sweet crudes, particularly West African, heading to Asia, supporting local crudes such as Tapis. Improving Asia-Pacific refinery demand amid rising refinery margins also supported light sweet grades in the region. In contrast, Dubai flipped into a contango amid rising supply and weak spot demand as the previous month’s aggressive buying by Chinese companies in the Platts pricing assessment market on close (MOC) mechanism faded. The Dubai crude discount to Tapis jumped by a hefty $3.25 to $4.25/b. This would theoretically make Dubai-related sour crudes more attractive to Asian-Pacific refiners, rather than regional light sweet crude. Graph 1.5: Brent Dated vs. Sour grades (Urals and Dubai) spread, 2015 US$/b
US$/b
Dubai
02 Oct
25 Sep
18 Sep
11 Sep
04 Sep
28 Aug
21 Aug
14 Aug
07 Aug
31 Jul
24 Jul
17 Jul
-4
10 Jul
-4
03 Jul
-2
26 Jun
-2
19 Jun
0
12 Jun
0
05 Jun
2
29 May
2
22 May
4
15 May
4
08 May
6
01 May
6
Urals
In Europe, the Urals medium-sour crude discount to Brent eased further in October, supported by a rally in short supplies seen earlier in the month. Russian loading volumes from the Black Sea port of Novorossiysk were thin in September, leading to a rally in the grade. Meanwhile, the Atlantic Basin sweet crude market was pressured by ample supplies from the North Sea as well as volumes from West Africa. The Urals Med discount of 50¢/b in August to Dated Brent eased to around 40¢/b in October, narrowing by about 10¢.
10
OPEC Monthly Oil Market Report – October 2015
Crude Oil Price Movements In the US Gulf Coast (USGC), the Light Louisiana Sweet (LLS) premium over mediumsour Mars increased by $1 to $5.55/b. Meanwhile, nearly all US crude values weakened relative to WTI, particularly along the USGC, as the spread between Brent and WTI narrowed significantly. The LLS premium to WTI dropped by $1.15, from $4.30/b to $3.15/b, while the Mars discount to WTI widened by a hefty $2.15 to $2.40/b under WTI. Further weakness in the medium-sour grades came amid falling refinery margins and weak demand.
OPEC Monthly Oil Market Report – October 2015
11
Commodity Markets
Commodity Markets Energy commodity prices averaged slightly higher in September after the previous month’s fall. Meanwhile, in the group of non-energy commodities, agricultural prices generally declined, while base metal prices advanced on rebounds in aluminium and copper. In the group of precious metals, gold advanced after the US Federal Reserve delayed interest rate hikes.
Trends in selected commodity markets During September, the US dollar declined against the euro and the yen, while it continued to appreciate against emerging market currencies. However, it reversed some of its gains following the September meeting of the US Federal Reserve (Fed) at which interest rates were left unchanged. This, in fact, provided support to the group of precious metals as expectations for real interest rates diminished, thereby supporting gold prices. However, the Fed’s acknowledgement of weaknesses in emerging markets put pressure on the group of base metals commodities in the second half of the month. Metal prices advanced mainly in the first half of September, helped by announcement of copper output cuts by Glencore and bolstered by lower expected sales from Freeport McMoRan operations in Indonesia. However, prices continued to be under pressure as manufacturing prospects in the largest metal consumer, China, remained weak in September. The manufacturing Purchasers Managers’ Index (PMI) continues to be in the contraction territory for China at 47.2 versus 47.3 in August. Meanwhile, in major developed economies, the expansion of the sector has slowed. In the US, the PMI declined to 50.2, close to the no-change level of 50. Additional declines were observed for the Euro-zone (52.0 versus 52.3 in the previous month) and Japan (51.0 versus 51.7 in August). Additional recovery in China’s property market was registered in August with new home prices advancing in 35 of the 70 largest cities – versus 31 the previous month, according to the National Bureau of Statistics. However, it has not yet translated into fast investments in real estate, which have grown at 3.5% y-o-y from January to August versus growth of 4.3% y-o-y from January to July. Agricultural prices declined on average in September, with drops in the groups of food, beverages and raw materials. The US Department of Agriculture increased its forecast of global ending stocks for wheat on strong production from EU countries. Meanwhile, it decreased its estimations for soybeans and corn, although global ending stocks are forecast to remain high, which could limit their upside potential. Sugar prices advanced after sharp drops in the previous two months due to concerns about dry conditions for sugar cane crops in the world’s second producer, India, and lower sugar output in Brazil as reported by the sugarcane industry association, UNICA. Moreover, the recent announcement of increases in transport fuel prices in Brazil could potentially make ethanol production more attractive, in comparison with sugar production. Energy prices advanced on average in September, due to a recovery in crude oil prices after sharp drops in the previous month. However, natural gas and coal prices mainly decreased. Natural gas storage continued to increase, both in the US and Europe, ahead of the winter season. In Europe, total inventories in the Euro-zone’s 28 member countries were at 81.5% of capacity at the end of the month versus 73.2%, as reported by Gas Infrastructure Europe. Meanwhile, in the US, underground storage at the end of September remained both above the previous five-year average and last year’s levels.
12
OPEC Monthly Oil Market Report – October 2015
Commodity Markets Table 2.1: Commodity price data, 2015 Monthly averages Commodity
% Change
Unit Aug 15
Sep 15
Jul/Jun
Aug/Jul
Sep/Aug
68.8 59.1 54.3 2.8 83.0 90.8 92.3 415.0
59.5 58.6 45.7 2.8 79.9 87.5 87.9 394.0
59.6 54.2 46.3 2.6 79.1 85.9 86.2 386.0
-9.9 0.5 -11.4 2.2 -1.4 0.7 1.7 6.4
-13.6 -0.9 -15.9 -2.4 -3.7 -3.6 -4.8 -5.1
0.2 -7.5 1.3 -4.2 -1.1 -1.9 -1.9 -2.0
751.0 405.0 91.0 179.6 197.4 0.3 72.7 1,639.5 5,456.8 52.0 1,763.0 11,413.1 15,071.5 2,000.7
730.0 381.0 83.8 162.6 179.8 0.3 68.3 1,548.1 5,127.3 56.0 1,703.6 10,386.0 15,163.8 1,807.6
721.0 368.0 82.3 165.6 172.7 0.3 69.1 1,589.6 5,217.3 57.0 1,684.3 9,937.6 15,453.3 1,720.2
-5.3 2.0 3.0 7.7 -5.9 3.0 -5.2 -2.9 -6.5 -17.5 -3.6 -11.0 0.0 -3.9
-2.8 -5.9 -7.9 -9.5 -8.9 -10.4 -6.1 -5.6 -6.0 7.7 -3.4 -9.0 0.6 -9.6
-1.2 -3.4 -1.9 1.9 -4.0 3.1 1.2 2.7 1.8 1.8 -1.1 -4.3 1.9 -4.8
1,128.3 15.1
1,117.9 14.9
1,124.8 14.8
-4.5 -6.4
-0.9 -0.7
0.6 -1.3
Jul 15 World Bank commodity price indices (2010 = 100)
Energy Coal, Australia Crude oil, average Natural gas, US Non-energy Agriculture Food Soybean meal Soybean oil Soybeans Grains Maize Wheat, US, HRW Sugar, world Base Metal Aluminum Copper Iron ore, cfr spot Lead Nickel Tin Zinc Precious Metals Gold Silver
$/mt $/bbl $/mmbtu
$/mt $/mt $/mt $/mt $/mt $/kg $/mt $/mt $/dmtu $/mt $/mt $/mt $/mt $/toz $/toz
Source: World Bank, Commodity price data.
Average energy prices advanced by 0.2% m-o-m, mainly due to a 1.3% rise in crude oil. Natural gas prices declined in the US by 4.2% m-o-m, while average import prices in Europe were down by 3.5%. Agricultural prices decreased for the second consecutive month, down by 1.9%, with drops of 1.9%, 2.1% and 1.7%, respectively, in the groups of food, beverages (cocoa, coffee and tea) and raw materials (timber, cotton, rubber and tobacco). Wheat decreased by 4.0% on higher estimations for EU harvests, while soybeans, soy oil and soymeal decreased by 3.4%, 1.2% and 2.0%, respectively, on the forecast of large global soybean stocks. Natural rubber declined by 5.5% due to the continuing increase in inventories, due to low oil prices. Average base metal prices recovered some ground advancing by 1.2%, with mixed movements across group components. Aluminium and copper advanced by 2.7% and 1.8%, respectively, on the announcement of supply cuts. Meanwhile, average iron ore prices advanced by 1.8% m-o-m, but further gains are likely to be capped on weaknesses in steel output. Precious metals prices showed mixed trends, with gold prices advancing by 0.6% on average, supported by lower real interest rates following the decision of the US Fed to delay interest rate hikes. Meanwhile, silver prices declined by 1.3% m-o-m.
OPEC Monthly Oil Market Report – October 2015
13
Commodity Markets Graph 2.1: Major commodity price indices, 2013-2015 Index 150
Index 150 Base year 2010 = 100
Energy
Non-energy
Agriculture
Base metals
HH natural gas
Gold
Sep 15
Aug 15
Jul 15
Jun 15
May 15
Apr 15
Mar 15
Jan 15
Feb 15
Dec 14
Nov 14
Oct 14
Sep 14
Aug 14
Jul 14
Jun 14
Apr 14
May 14
50
Mar 14
50
Feb 14
75
Jan 14
75
Dec 13
100
Nov 13
100
Oct 13
125
Sep 13
125
Food
Source: World Bank, Commodity price data.
In September, the Henry Hub natural gas index decreased. The average price was down 11¢ or 4.2% to $2.65 per million British thermal units (mmbtu) after trading at an average of $2.76/mmbtu the previous month. The US Energy Information Administration (EIA) said utilities put 98 billion cubic feet (Bcf) of gas into storage during the week ending 25 September. This was close to market expectations of a 100 Bcf increase. Total working gas in storage stood at 3,538 Bcf, which was 15% higher than at the same time in the previous year and 5% higher than the previous five-year average. The EIA noted that temperatures during the reported week were warmer than both the previous year and the 30-year average. Graph 2.2: Inventories at the LME '000 Tonnes
'000 Tonnes
1,000
5,000 4,500 4,000 3,500 3,000 2,500 2,000 1,500 1,000 500 0
800 600 400 200
Copper
Lead
Nickel
Tin
Zinc
Sep 15
Aug 15
Jul 15
Jun 15
May 15
Apr 15
Mar 15
Feb 15
Jan 15
Dec 14
Nov 14
Oct 14
Sep 14
0
Pr. Aluminium (RHS)
Sources: London Metal Exchange and Thomson Reuters.
14
OPEC Monthly Oil Market Report – October 2015
Commodity Markets
Investment flows into commodities Open interest volume (OIV) decreased in September for select US commodity markets such as agriculture, copper, natural gas, oil and precious metals, while it increased for crude oil and livestock. Meanwhile, speculative net length positions increased for crude oil, natural gas and precious metals, but decreased for agriculture, copper and livestock. Graph 2.3: Total open interest volume '000 contracts
'000 contracts
Sep 15
Aug 15
Oct 14
Jul 15
7,000
Jun 15
7,000
May 15
7,500
Apr 15
7,500
Mar 15
8,000
Feb 15
8,000
Jan 15
8,500
Dec 14
8,500
Nov 14
9,000
Sep 14
9,000
Source: US Commodity Futures Trading Commission.
Agriculture’s OIV declined marginally by 3.3% m-o-m to 4,619,727 contracts in September. Meanwhile, money managers reduced their net long positions by 63% to 62,389 lots. Graph 2.4: Speculative activity in key commodities, net length '000 contracts 600
'000 contracts 600 400
400
200
200
0
0
Agriculture
Gold
WTI
Natural gas
Livestocks
Sep 15
Aug 15
Jul 15
Jun 15
May 15
Apr 15
Mar 15
Feb 15
Jan 15
Dec 14
-400
Nov 14
-400
Oct 14
-200
Sep 14
-200
Copper
Source: US Commodity Futures Trading Commission.
Henry Hub’s natural gas OIV decreased by 5.4% m-o-m to 913,282 contracts in September. Money managers increased their net short positions by 24% to reach 162,596 lots, on lower demand for power generation.
OPEC Monthly Oil Market Report – October 2015
15
Commodity Markets Graph 2.5: Speculative activity in key commodities, as% of open interest %
%
40
40
30
30
20
20
10
10
0
0
Gold
WTI
Livestocks
Sep 15
Aug 15
Jul 15
Jun 15
May 15
Apr 15
Feb 15
Jan 15
Oct 14
Agriculture
Mar 15
-20
Dec 14
-20
Nov 14
-10
Sep 14
-10
Copper
Natural gas
Source: US Commodity Futures Trading Commission.
Copper’s OIV decreased by 15.4% m-o-m to 155,316 contracts in September. Money managers decreased their bearish net short positions to 6,631 lots from 27,995 contracts, on the announcement of supply cuts by Glencore. Table 2.2: CFTC data on non-commercial positions, ‘000 contracts Open interest
Crude oil Natural gas Agriculture Precious metals Copper Livestock Total
Net length
Aug 15
Sep 15
Aug 15
% OIV
Sep 15
% OIV
1,695 966 4,779 610 184 483 8,716
1,664 913 4,620 572 155 495 8,420
97 -131 169 5 -28 44 156
6 -14 4 1 -15 9 2
140 -163 62 35 -7 35 103
8 -18 1 6 -4 7 1
Source: US Commodity Futures Trading Commission.
Precious metals’ OIV decreased by 6.2% m-o-m to 572,005 contracts in September. Money managers’ net long position increased six times to 35,254 lots on lower expectations for real interest rates in the US. Graph 2.6: Inflow of investment into commodities, 2013-2015 US$ bn 120 100 80 60 40 20 0 1Q
2Q
3Q
4Q
1Q
2Q
2013 Agriculture
3Q
4Q
1Q
2014 Copper
Gold
2Q
Jul
Aug
2015 Natural gas
WTI crude oil
Source: US Commodity Futures Trading Commission.
16
OPEC Monthly Oil Market Report – October 2015
World Economy
World Economy The global GDP growth forecast remains unchanged at 3.1% for 2015 and at 3.4% for 2016. The OECD is forecast to hold up well at 2.0% this year and 2.1% in the coming year, unchanged from the previous month. However, challenges in emerging and developing economies remain apparent. While the growth forecasts for China and India remain unchanged, those for both Brazil and Russia have been revised down for 2015 and 2016. There is some upside potential, mainly from the OECD and India, potentially leading to higher global growth, however numerous uncertainties remain, skewing the risk to the downside. Most importantly, the decelerating growth momentum in China and the declining trend in Russia and Brazil will need close monitoring. Moreover, some fragility in the Euro-zone remains, while the strength of the US growth trend also remains to be seen. Japan will need to manage a balancing act between fiscal tightening and, at the same time, stimulating its economy. Geopolitical issues and their potential spill-over into the real economy also constitute a challenge. Finally, central bank policies in different countries will be an influential factor, amid lower global inflation and, most importantly, the Fed’s decision on interest rate decision. Table 3.1: Economic growth rate and revision, 2014-2015, % World
OECD
US
Japan Euro-zone
China
India
Brazil
Russia
2015*
3.1
2.0
2.5
0.8
1.5
6.8
7.4
-2.2
-3.2
Change from previous month
0.0
0.0
0.0
0.0
0.2
0.0
0.0
-0.2
-0.2
2016*
3.4
2.1
2.6
1.2
1.5
6.4
7.6
-0.5
0.6
Change from previous month
0.0
0.0
0.0
0.0
0.0
0.0
0.0
-0.2
-0.2
*Forecast.
OECD OECD Americas US The US GDP of the 2Q15 has been revised up from an already high 3.7% q-o-q seasonally adjusted annualised rate (SAAR) to 3.9% q-o-q SAAR. This may also be due to some rebound from the considerably weaker 1Q, which grew at only 0.6% q-o-q SAAR. Despite this effect, the US economy is still being relatively well supported by an improving labour market, healthy private household consumption and a generally well recovered economic environment. Personal consumption expenditures remain the backbone of the US economy and have held up well, growing by 1.8% q-o-q and by 3.6% q-o-q in the 1Q and the 2Q, respectively. There has been some concern over the recent weeks about the impact of a slow-down in China’s economy. However, exports from the US to China account for only a fraction of total GDP. Importantly, the Federal Reserve Board (Fed) kept its interest rate unchanged. However, it has reiterated the likelihood of raising interest rates before the year-end. As its most recent decision showed, this will also depend on the development of the global economy. The international dimension of an interest rate hike has become more
OPEC Monthly Oil Market Report – October 2015
17
World Economy important. However, it is expected that the Fed will primarily consider the domestic economy as the main guideline for such a hike. Among the many aspects the Fed is following, the most important ones are certainly inflation, developments in the labour market and general economic well-being. These indicators remain somewhat mixed. Meanwhile, core-inflation – excluding food and energy prices – remains healthy at 1.8% y-o-y and total inflation stands at 0.2% y-o-y. The labour market has continued improving, but job creation has slowed. Non-farm payrolls increased by 142,000, less than expected, whilst the August number was revised down from 173,000 to 136,000. Moreover, average hourly earnings growth dropped to 0% m-o-m and the labour force participation rate in September was at the lowest level since 1977. While GDP growth in the 2Q15 was very high, in 1Q15 it was considerably lower. In addition, growth in 2H15 is forecast to remain at a healthy, but not extreme, level of around 2.4% on average. In combination with the slow-down in emerging economies, this situation seems to lower the odds for a near-future rate hike. House prices, which constitute a very important wealth factor for US households, have continued to hold up very well. Compared to last year, they rose by more than 5% each month since the beginning of this year and peaked in July, according to the latest available data from the Federal Housing Finance Agency (FHFA). In July, prices rose by 5.8% y-o-y. Also, home sales continued at healthy rates. Existing home sales stood at an annualised 5.3 million in August, 270,000 lower than in July. Also, new home sales increased by 552,000 in August, higher than the 522,000 seen in July. In comparison, this stood against an average of 440,000 and 430,000 in 2013 and 2014, respectively. Given the positive developments in the labour market, consumer confidence stood at solid levels. The Conference Board Consumer Confidence Index rose to 103.0 in September from 101.3 in August. However, the Purchasing Manager’s Index (PMI) for the manufacturing sector, provided by the Institute of Supply Management (ISM), declined again to a sensitive level of 50.2 from 51.1 in August. This, indeed, will need close monitoring in the near term. Graph 3.1: Manufacturing and non-manufacturing ISM indices Index 65 60 56.9 55 50.2
50
ISM manufacturing index
Sep 15
Aug 15
Jul 15
Jun 15
May 15
Apr 15
Mar 15
Feb 15
Jan 15
Dec 14
Nov 14
Oct 14
Sep 14
45
ISM non-manufacturing index
Sources: Institute for Supply Management and Haver Analytics.
The US economy seems to have expanded at a healthy level. However, some of the indicators point at a continuation of current moderate growth levels. Also, challenging budgetary negotiations and decisions on raising the debt ceiling in the US Congress lie ahead. After considering all the challenges, the growth forecast remains unchanged at 2.5% for 2015 and 2.6% for 2016.
18
OPEC Monthly Oil Market Report – October 2015
World Economy Canada Canada is still experiencing a considerable slow-down, given significant weakness in its exports and the significant challenges from the energy sector due to low oil prices. However, some indicators have improved after subdued 1H15 growth. After Industrial production was clearly negative in the 2Q15 at -2.3% y-o-y, monthly growth in July improved to 1.3%. However, the weak trend seems to continue, based on the latest PMI for manufacturing for September, which stood at 48.6 after 49.4 in August. This is again clearly below the growth-indicating level of 50. As most of this soft trend has already been anticipated in the current GDP growth forecast, it remains unchanged at 0.7% for 2015 and at 1.9% for the next year.
OECD Asia-Pacific Japan Japan’s economy remains in a challenging situation. While the unprecedented stimulus programme is ongoing, the outcome has so far not entirely delivered what was initially expected. Domestic demand remains moderate, amid clearly falling inflation. Also, industrial production and exports remain sluggish. The domestic services sector provides healthy support to the economy and, given the extremely low unemployment rate, wage increases might soon be necessary. This again could then filter through via rising consumption. While this remains to be seen, growth in China is expected to remain low. This may impact Japan’s exports in the near future. Also, the obvious fiscal adjustments remain a sensitive subject, as last year’s rise in the sales tax, and the postponement of another rise from this year to 2016, have clearly indicated. It remains challenging for the government to raise its tax income in order to reduce its fiscal deficits and debt level, without overly negative ripple effects on the economy. Low inflation, however, still constitutes a challenge. It stood at only 0.2% y-o-y in August, lower than the July level of 0.3% y-o-y and June’s 0.4% y-o-y. Hence, it clearly shows a negative trend. While deflationary pressures form energy and food are obvious, the headline series (excluding energy and food prices) remains low at only 0.8% y-o-y in August. Amid low inflation, real income is declining further. Average monthly earnings fell by 0.4% y-o-y in July. This is the seventh consecutive month of decline. However, given the very tight labour market with an unemployment rate of only 3.4%, this may soon turn positive. Japanese exports slowed down again in August. After a rise of 7.6% y-o-y in July, export growth retraced again to 3.1% y-o-y in August. Industrial production remained sluggish recently. It was flat in July and rose only by 0.1% y-o-y in August. Also, domestic demand slowed down. Retail trade increased by 0.8% y-o-y in August after a rise of 1.8% y-o-y a month earlier.
OPEC Monthly Oil Market Report – October 2015
19
World Economy Graph 3.2: Japanese retail trade
Graph 3.3: Japanese PMI indices Index
% change y-o-y
54
6 4 2 0 -2 -4 -6 -8 -10 -12
0.8%
Services PMI
53 52 51.4 51.0
51 50 49 Manufacturing PMI
47
Sep 14 Oct 14 Nov 14 Dec 14 Jan 15 Feb 15 Mar 15 Apr 15 May 15 Jun 15 Jul 15 Aug 15 Sep 15
Jul 15
Sources: Ministry of Economy, Trade and Industry and Haver Analytics.
Aug 15
Jun 15
Apr 15
May 15
Mar 15
Feb 15
Jan 15
Dec 14
Nov 14
Oct 14
Sep 14
Aug 14
48
Sources: Markit, Japan Materials Management Association and Haver Analytics.
The latest PMI numbers, as provided by Markit, show that the lead indicators also point at some weakening manufacturing activity. August’s manufacturing PMI retraced to 51.0 from 51.7 in July. While there is potentially some further upside coming from domestic demand, declining wages remain a concern. In consideration of currently slowing domestic demand, challenges facing the export market and low industrial activity, the GDP growth estimates for 2015 and 2016 remain unchanged at 0.8% and 1.2%, respectively.
South Korea While the economic performance of South Korea remains sluggish in the 1H15, it now seems to again gain traction slightly. Industrial production rose by 1.1% y-o-y in August, after a rise of only 0.1% y-o-y in July. Also, exports recovered to a growth level of 3.1% y-o-y in August after a decline of 2.2% y-o-y in July. The latest PMI numbers for manufacturing are mirroring the weak, but slowly recovering, growth trend for the normally dynamic economy. September’s PMI stood at 49.2, significantly better than the 47.9 in August and the 47.6 in July, although all are clearly below the growth indicating level of 50. As most of this weak momentum has already been anticipated, the GDP growth forecast remains unchanged at 2.3% for 2015 and 2.7% for 2016.
OECD Europe Euro-zone The situation in the Euro-zone remains broadly positive – and more positive than anticipated over the past months. 1H15 GDP growth turned out higher than expected, despite the Greek debt crisis. This positive momentum is mainly supported by the recovering peripheral economies – most importantly, Italy and Spain, the third and fourth largest economies of the Euro-zone. The positive underlying momentum so far has been reflected in the latest industrial production number, which increased by 1.2% y-o-y in July, 1.3% y-o-y in June and 1.4% y-o-y in May. The capacity utilisation rate remained at a considerable level of 81.1% in 3Q15, after 81.2% in 2Q15. Moreover, retail sales performed very well, with a yearly growth rate of 2.7% y-o-y in July, coming from 1.7% y-o-y in the previous month. Challenges in the labour market, however, remain. The unemployment rate remained at 11.0%, after June had been revised slightly upwards to 11.0% from 10.9%.
20
OPEC Monthly Oil Market Report – October 2015
World Economy While the ECB continues with its liquidity programme and has pointed out that it may even increase its current programme if necessary, inflation remains not only extremely low, but has turned negative again in September, when it stood at -0.1% y-o-y. Higher inflation was recorded only for May at 0.4% y-o-y. Since then, it has declined again. On a positive note, core inflation (excluding energy and food) has remained at a more healthy 0.9% y-o-y in September for the third consecutive month. Moreover, the support of the ECB for credit lending remains considerable. Loan growth was positive for every month in the current year. In both August and July it grew by 1.6%, the highest rate in 2015. Some improvements are visible in the PMI indicators as well. The latest September manufacturing PMI remained at a healthy 52.1, close to August’s level of 52.3. Graph 3.4: Euro-zone PMI indices
Graph 3.5: Euro-zone consumer price index and lending activity
Index
54
53.7
3.0 2.0 1.0 0.0 -1.0 -2.0 -3.0 -4.0
3.0 2.0
Sources: Markit and Haver Analytics.
CPI (LHS)
Sep 15
Mar 15
Sep 14
Sep 14 Oct 14 Nov 14 Dec 14 Jan 15 Feb 15 Mar 15 Apr 15 May 15 Jun 15 Jul 15 Aug 15 Sep 15
Manufacturing PMI
Mar 14
-1.0
Sep 13
50
Mar 13
0.0
Sep 10
51
Sep 12
1.0
Mar 12
52.1
52
Mar 11
53
49
% change y-o-y
4.0
Services PMI
Sep 11
55
% change y-o-y
MFI lending (RHS)
Sources: Statistical Office of the European Communities, European Central Bank and Haver Analytics.
The recovery in the Euro-zone continues slowly, but uncertainties remain. Given the stronger-than-expected GDP growth numbers for the 1H15, the forecast has been revised upwards to 1.5% from 1.3% for the current year. For 2016, growth remains unchanged at 1.5%.
UK Growth in the UK remains solid. While growth is forecast to remain firm in 2015 and 2016, the rising sovereign debt level is an element that will probably need closer monitoring in the coming year. However, for the time being, the output data remains healthy though signs of some deceleration appear. Industrial production increased by 2.5% y-o-y in August, up from 0.6% growth a month earlier. This solid, but slightly softening trend has also been confirmed in the latest PMI numbers for the manufacturing sector, which stood at an almost unchanged, though slightly lower, 51.5 in September, compared to 51.6 in August and 51.9 in July. In general, GDP growth this year seems to be well supported. Its forecast – unchanged from last month – is 2.5% for both 2015 and 2016.
OPEC Monthly Oil Market Report – October 2015
21
World Economy
Emerging and Developing Economies The slump in private consumption and investment has led the economy of Brazil to contract by 1.9% and 2.6% y-o-y, respectively, in the first two quarters of this year. The unemployment rate also worsened in the eight months to August, reaching its highest reading since March 2010. The GDP growth forecast for 2015 and 2016 have been slightly pared back due to the continuing downward trend seen since the beginning of this year. The economy is anticipated to decelerate by 2.2% and 0.5% in 2015 and 2016, respectively. In Russia, the services PMI survey revealed that firms were optimistic about new orders in the coming year. Household consumption is expected to continue to be challenged by strong price pressures in the services sector, leading firms to increase their own charges, putting more upwards pressure on inflation. The GDP growth forecasts are slightly lower this month, with -3.2% for 2015 and 0.6% for 2016. India’s growth acceleration over the last few quarters was being helped by a large terms of trade shock in the form of oil and commodity price declines that have boosted urban consumption and bolstered weak corporate margins. It seems that growth will remain strong in India in the coming quarters, owing to a pro-business administration, higher infrastructure spending and cheaper energy. However, weak demand, low capacity utilisation and high leverage are impediments to reviving the private corporate investment cycle, while lower crude oil and commodity prices have helped to rein in fiscal and current account deficits. Meanwhile, inflation and slack global growth has hurt India's exports. Growth in China continues to slow, although this steady slowdown is in sharp contrast to the narrative of collapse present in most public commentary over the past several months. The acceleration of the services sector in 1H15, especially in the 2Q, was an important offset to the slowdown in the manufacturing sector. However, with turnover on the stock market down because of the plunge in prices since June, the financial sector should add much less to GDP growth in the 2H, having contributed nearly onethird to nominal GDP growth in the 1H. Table 3.2: Summary of macroeconomic performance of BRIC countries GDP growth rate
Brazil Russia India China
Consumer price index, % change y-o-y
Current account balance, US$ bn
Government fiscal balance, % of GDP
Net public debt, % of GDP
2015*
2016*
2015
2016
2015
2016
2015
2016
2015
2016
-2.2 -3.2 7.4 6.8
-0.5 0.6 7.6 6.4
8.9 15.3 5.6 1.7
6.1 7.8 5.9 2.4
-64.2 65.3 -32.4 416.0
-64.5 68.3 -44.3 354.7
-7.3 -2.9 -3.4 -2.6
-5.9 -2.5 -3.1 -2.8
66.4 12.7 48.3 16.6
70.0 14.7 46.9 18.4
Sources: OPEC Secretariat, Consensus Economics, Economic Intelligence Unit, Financial Times and Oxford. *Forecast.
22
OPEC Monthly Oil Market Report – October 2015
World Economy
Brazil The Central Bank of Brazil kept its benchmark interest rate unchanged last month at 14.25%, its highest level in nine years. With inflation increasing to its highest since December 2003 at 9.9% y-o-y in August, the monetary tightening cycle started in October 2014 has met with little success in preventing fast growth in consumer prices amid economic shrinkage. The inflation rate of 9.9% is far above the upper limit of 6.5% set by the Central Bank. In August, the value of exports from Brazil dropped 24% y-o-y for the thirteenth month in a row, following the 19.5% decline in July. However, Brazil’s trade surplus improved in August to $2.69 billion, up from the same month last year of $1.16 billion, as exports fell at a slower pace than imports. Imports decreased 33.7% y-o-y in August to $12.8 billion, down from $19.3 billion a year ago. Imports of fuels and lubricants shrank 64.9%, and purchases of raw materials and intermediate goods fell 32.8%. Also, consumer and capital goods contracted 21.9% and 21.5%, respectively. Imports from Africa, Middle East and Eastern Europe shrank 64.6%, 56.9% and 43.5%, respectively. Imports from Argentina and the US contracted 39.9% and 31.8% each. Purchases from the Euro-zone also declined by 27.6% and from China went down by 22.1%. The weaker real has lent some support to exports, while discouraging imports. Imports have also been hit by lower domestic demand. The Brazilian real depreciated 11.2% m-o-m in September, accumulating a loss of around 41.2% of its value against the dollar since the beginning of the year. Graph 3.6: Brazilian inflation vs. interest rate % change y-o-y 11 9 8
% change y-o-y 0% -5% -10%
12
7
11
5
10
Sep 14 Oct 14 Nov 14 Dec 14 Jan 15 Feb 15 Mar 15 Apr 15 May 15 Jun 15 Jul 15 Aug 15 Sep 15
6
National consumer price index (LHS) Selic rate (RHS) Sources: Banco Central do Brasil, Instituto Brasileiro de Geografia e Estatística and Haver Analytics.
-15% -20% -25%
-24.3%
-30%
Aug 14 Sep 14 Oct 14 Nov 14 Dec 14 Jan 15 Feb 15 Mar 15 Apr 15 May 15 Jun 15 Jul 15 Aug 15
10
% per annum 15 14.3 14 9.9 13
Graph 3.7: Brazilian exports
Source: Ministério do Desenvolvimento, Indústria e Comércio Exterior and Haver Analytics.
The unemployment rate in Brazil increased further in August to 7.6% y-o-y in August from 7.5% in the previous month, the highest since March 2010. This marks the eighth consecutive increase in the rate of unemployment. Increasing unemployment rate together with rising inflation and high interest rates have further pressured the consumer confidence in September. The consumer confidence index registered another record low reading last month of 75.9 from 79.1 in the previous month.
OPEC Monthly Oil Market Report – October 2015
23
World Economy Graph 3.8: Brazilian unemployment rate
Graph 3.9: Brazilian consumer confidence index Index
% 7.6%
8.0
110
7.5
105
7.0
100
6.5
95
6.0
90
5.5
85
5.0
80
Sources: Instituto Brasileiro de Geografia e Estatística and Haver Analytics.
Sep 15
Aug 15
Jul 15
Jun 15
May 15
Apr 15
Mar 15
Jan 15
Feb 15
Dec 14
Oct 14
75.9
Sep 14
Jul 15
Aug 15
Jun 15
May 15
Apr 15
Mar 15
Feb 15
Jan 15
Dec 14
Oct 14
70
Nov 14
3.5
Sep 14
75
Aug 14
4.0
Nov 14
4.5
Sources: Fundação Getúlio Vargas and Haver Analytics.
The GDP growth forecasts for 2015 and 2016 have been slightly pared back due to the continuing downward trend seen since the beginning of this year. The economy is anticipated to decelerate by 2.2% and 0.5% in 2015 and 2016, respectively.
Russia The Russian central bank kept its benchmark interest rate unchanged last month at 11.0%. The interest rate at the beginning of the year stood at 17.0%. The ruble depreciated 2.5% m-o-m in September, following a 14.2% depreciation in August. The ruble has depreciated nearly 22% since January 2015. Inflation increased 15.8% y-o-y in August, up from 15.6% in July. The unemployment rate has remained unchanged at 5.3% in August from July.
% change y-o-y 6.0
16
5.8
14
5.6
12
5.4
Sources: Federal State Statistics Service, Central Bank of Russia and Haver Analytics.
Aug 15
Jul 15
Jun 15
May 15
Apr 15
Aug 14
Aug 15
Jul 15
Jun 15
May 15
Apr 15
Mar 15
Feb 15
Jan 15
Dec 14
Nov 14
Oct 14
4.6
Sep 14
4
Aug 14
4.8
Mar 15
5.0
6
Jan 15
8
5.2
Feb 15
Interest rate 11.0%
Dec 14
10
5.3%
Nov 14
Inflation rate 15.8%
Oct 14
% 18
Graph 3.11: Russian unemployment rate
Sep 14
Graph 3.10: Russian inflation vs. interest rate
Sources: Central Bank od the Russian Federation and Haver Analytics.
The manufacturing sector registered a slight slowdown in operating conditions in September, with the manufacturing PMI rising to 49.1, notably up from August’s 47.9. The survey showed an ongoing import substitution effect amid a depreciating ruble. On
24
OPEC Monthly Oil Market Report – October 2015
World Economy the other side, however, it showed a continued increase in input prices making firms increase their output prices. This indicates intensified price pressures due to exchange rate factors. Both production and new business posted fractional growth last month, while the falling backlog of orders led to another drop in job creation. Operating conditions in the services sector, on the other hand, recorded a modest improvement last month as the services PMI returned to a level above the neutral line of 50. The index registered 51.3 in September, up from 49.1 a month earlier. The survey also indicated that firms were optimistic about new orders in the coming year. Household consumption is expected to continue to be challenged by strong price pressure on the services sector, leading firms to increase their own charges, putting more upwards pressure on inflation. GDP growth forecasts are slightly lower this month at -3.2% and 0.6% for 2015 and 2016, respectively.
India India’s growth acceleration over the last few quarters was helped by a large terms of trade ‘shock’ in the form of oil and commodity price declines that boosted urban consumption and bolstered weak corporate margins. However, over the last month, two negative shocks have challenged the positive terms of the earlier terms of trade shock: first, the regional and emerging market growth disappointments that threaten exports; and second, the drought that began with September’s rainfall levels coming in at a whopping 24% below normal, which then threaten to further weigh down the rural economy. Growth will remain strong in India in the coming quarters owing to the probusiness administration, as well as higher infrastructure spending and cheaper energy. On the whole, the economies of the Association of South-East Asian Nations (ASEAN) have been hit this year by capital outflows, lower commodity prices and currency weakness. Over the medium-term they will benefit from greater economic integration, overdue structural reforms and the arrival of companies seeking cheaper labour than in China. Graph 3.12: Indian GDP growth, SAAR
8%
7.1% 6.4%
7%
7.5% 7.0%
5 0
5.3%
-5
5%
1%
1Q 15 2Q 15
1Q 14 2Q 14 3Q 14 4Q 14
1Q 13 2Q 13 3Q 13 4Q 13
1Q 12 2Q 12 3Q 12 4Q 12
0%
Sources: National Informatics Centre (NIC) and Haver Analytics.
Sep 15
Jul 15
Aug 15
Jun 15
Apr 15
May 15
Mar 15
Jan 15
Feb 15
2%
Dec 14
Sep 14
3%
Oct 14
-10
4%
Nov 14
6%
Graph 3.13: Indian inflation vs. Repo rate % 10
% change y-o-y 9%
Repo rate Consumer price index (CPI) CPI lower target bond CPI higher target bond Wholesale price index (WPI) WPI confort zone Sources: Ministry of Commerce and Industry, Reserve Bank of India and Haver Analytics.
A sluggish global economic growth rate spurred the Reserve Bank of India (RBI) to cut interest rates by a larger-than-expected 50 basis points at the end of September 2015. This raised hopes that lower borrowing costs would finally jolt the private sector back into an investment mode. Citing an array of global woes, including a slowdown in China, the RBI cut the benchmark repo rate to 6.75 %. This reduction is the fourth rate cut since the start of the year, when it stood at 8%. It seems that the reasons behind
OPEC Monthly Oil Market Report – October 2015
25
World Economy the cut are: the double-dip in commodity prices over the summer, muted pricing power and episodic increases in food prices, despite a large monsoon deficit. These have created substantial downside risks to the RBI’s 6% inflation target for January 2016. A more modest change had been predicted following the sharp recent falls in the CPI and WPI, boosted by lower commodity prices. The larger adjustment cheered investors, pushing Indian stocks (as measured by the S&P Bombay Stock Exchange Sensitive Index) – which had opened down 1.33% – back into positive territory. It seems that more domestic demand is needed to substitute for weakening global demand, so that the domestic investment cycle can pick up. Also, India needs to restart investment, since corporate investment has been weak. The RBI has said it now expects inflation to hit 5.8% by January 2016, slightly below its interim target of 6%. Graph 3.14: Indian rupee exchange rate Index 0.04
Rate 70 65
0.02
60 0.00
55
US$ bn 30 20 10 0 -10 -20 -30 -40 -50
22
-13 -34
Aug 14 Sep 14 Oct 14 Nov 14 Dec 14 Jan 15 Feb 15 Mar 15 Apr 15 May 15 Jun 15 Jul 15 Aug 15
Sep 15
Jun 15
Mar 15
Dec 14
Sep 14
Jun 14
Mar 14
Dec 13
50
Sep 13
-0.02
Graph 3.15: Indian trade balance
INR/US$ volatility (LHS) INR/US$ exchange rate (RHS)
Exports
Sources: Ministry of Commerce and Industry, Reserve Bank of India and Haver Analytics.
Imports
Trade balance
Sources: Ministry of Commerce and Industry and Haver Analytics.
Industrial production in terms of food products and beverages in July declined sharply because the monsoon has been 14% below normal for the June-September period. This is a rare instance of that vital weather system failing for the second consecutive year. Graph 3.17: Indian industrial production breakdown
Index 56 54 51.5 51.3 51.2
52 50 48
Sep 14 Oct 14 Nov 14 Dec 14 Jan 15 Feb 15 Mar 15 Apr 15 May 15 Jun 15 Jul 15 Aug 15 Sep 15
46
Composite Services business activity Manufacturing Sources: HSBC, Markit and Haver Analytics.
26
% change y-o-y 20% 15% 10% 5% 0% -5% -10% -15%
Jul 14 Aug 14 Sep 14 Oct 14 Nov 14 Dec 14 Jan 15 Feb 15 Mar 15 Apr 15 May 15 Jun 15 Jul 15
Graph 3.16: Indian PMIs
Total IP
Manufacturing IP
Food products IP Sources: Central Statistical Organisation of India and Haver Analytics.
OPEC Monthly Oil Market Report – October 2015
World Economy Dipping to a seven-month low of 51.2 in September (August: 52.3), India’s PMI was consistent with a marginal improvement in business conditions across the sector. That said, the PMI averaged 52.1 for the 3Q. Despite having been supported by sustained increases in new work, the growth of Indian manufacturing production in September was weighed down by a difficult economic climate. Nonetheless, the region’s growth prospects for the 3Q are encouraging. According to PMI data, the manufacturing sector looks set to provide a stronger contribution to GDP than it did in the 2Q. Slower increases in new business inflows have hindered the ability of firms to recruit. The sector’s labour market was squeezed in September as companies attempted to minimize operating costs. This bodes ill for the economy in the near-term and suggests that manufacturers’ expectations for future output growth is clouded with uncertainty. Goods producers benefitted from a downward swing in commodity prices, while input costs decreased for the second month running in September, a situation not seen since the financial crisis. This provided firms with more room for price negotiation and selling prices were lower on average, improving the competitiveness of manufacturers. The GDP growth expectation for 2015 and 2016 was kept unchanged at 7.4% and 7.6%.
China Growth in China continues to slow, although this steady slowdown is in sharp contrast to the collapse narrative in most public commentary over the past several months. The coming months will be uneven for China, but some of the concerns are exaggerated. The links between the stock market and the real economy are relatively weak, and less than 20% of household wealth is in shares. While the industrial sector has slowed sharply, dragging down exports, the services sector now accounts for a larger share of the economy, and it is expanding at a more rapid pace. Broad economic growth remained slow but stable in China during August. It seems the Chinese economy has entered a new phase that is different from the high-speed growth pattern exhibited in the past. Infrastructure investment, a main focus of growth stabilization efforts, has failed to pick up enough to help offset the slowdown in manufacturing and real estate investment. Recent policy adjustments have been aimed at supporting infrastructure investment and any impact, though likely modest, should be evident in 4Q15 and 1Q16. However, the trigger for downward pressure is concern about the service sector. The service sector acceleration in 1H15, especially in 2Q, was an important offset to the slowdown in the manufacturing sector. However, with turnover on the stock market down because of the plunge in prices since June, the financial sector should add much less to GDP growth in 2H, having contributed nearly one-third to nominal GDP growth in 1H. In addition, net exports may become a drag on growth. In addition, there are several reasons to be cautious about China’s multi-year growth outlook. First, the adjustment in overcapacity industries including steel, cement and aluminium, will still take years to complete. Second, despite an encouraging recovery in housing transactions and housing prices, new residential construction activity remains weak and real estate investment is likely to contract in 2016.
OPEC Monthly Oil Market Report – October 2015
27
World Economy Graph 3.18: Chinese GDP growth rate, SAAR
Graph 3.19: Chinese foreign direct investment (FDI) % change y-o-y 10
% change y-o-y 8.5% 8.0%
7.7%
0.3
8 7.7%
6 7.3%
7.5%
2.5
4
4.2
2 7.0%
7.0%
0
Sources: China's National Bureau of Statistics and Haver Analytics.
2Q 15
1Q 15
4Q 14
3Q 14
2Q 14
1Q 14
Net exports of goods and services Gross capital formation Final consumption expenditure
1Q 15 2Q 15
1Q 14 2Q 14 3Q 14 4Q 14
1Q 13 2Q 13 3Q 13 4Q 13
1Q 12 2Q 12 3Q 12 4Q 12
6.0%
4Q 13
6.5%
3Q 13
2Q 13
-2
Sources: China National Bureau of Statistics and Haver Analytics.
Foreign direct investment (FDI) growth into China through August grew 8.9%, compared with 7.7% through July, according to data published by the Ministry of Commerce on 16 September. That compares with 1.7% growth in FDI into China in 2014. FDI into services continues to drive growth, expanding 20.1% during the first eight months of the year compared with 16% through July. Meanwhile, contractions in FDI bound for agriculture and manufacturing moderated in August. (The data for July showed that there were significant accelerations in FDI into special purpose machinery manufacturing, utilities, transportation services, wholesale and retail services, resident services and healthcare services compared with three months ago. Divergences and accelerations may also reflect the impact of changing market access – given that in April, China further liberalised its FDI regime. Fiscal easing has supported investment and it seems it is likely to remain largely focused on infrastructure spending, with more projects being brought forward. However, spending on health, education and social security are growing at double-digit rates. The central government has targeted an overall spending increase of 10.6% this year.
Units
% change y-o-y
3,000
60% 50% 40% 30% 20% 10% 0% -10% -20%
2,500 2,000 1,500 1,000 500
Aug 14 Sep 14 Oct 14 Nov 14 Dec 14 Jan 15 Feb 15 Mar 15 Apr 15 May 15 Jun 15 Jul 15 Aug 15
0
Units
% change y-o-y
160 140 120 100 80 60 40 20 0
40% 30% 20% 10% 0% -10% -20%
Approved FDI, units (RHS)
Utilised FDI, US$100 mn (RHS)
% change y-o-y (LHS)
% change y-o-y (LHS)
Sources: China National Bureau of Statistics and Haver Analytics.
28
Graph 3.21: Chinese capital utilised FDI
Aug 14 Sep 14 Oct 14 Nov 14 Dec 14 Jan 15 Feb 15 Mar 15 Apr 15 May 15 Jun 15 Jul 15 Aug 15
Graph 3.20: Chinese approved FDI
Sources: China National Bureau of Statistics and Haver Analytics.
OPEC Monthly Oil Market Report – October 2015
World Economy While the liberalisation was incremental from a macroeconomic perspective, it provided substantially improved market access in selected manufacturing and service sectors. Further market access improvements, at a gradual pace, are likely to keep FDI growth reasonably fast in some long-closed sectors over the medium- to long-term. In spite of the devaluation in mid-August, the trade-weighted CNY is still around 6% stronger than a year ago. With the US dollar forecast to continue strengthening in anticipation of the first rate hike by the Fed, depreciation pressures will persist. Although policymakers are unlikely to let the CNY weaken soon, given the bad experience with the initial move, the forecast is that it will fall to 6.7 per US dollar by the 2Q16. Graph 3.22: Chinese sectorial FDI US$ 16 14 12 10 8 6 4 2 0
Graph 3.23: Chinese yuan and US dollar exchange rate
% change y-o-y 30% 20% 10% 0%
Aug 15
Jul 15
Jun 15
May 15
Apr 15
Mar 15
-10%
FDI (LHS) Agriculture Services
Index CN¥/100US$ 640 0.004 635 0.002 630 0 625 -0.002 620 -0.004 615 -0.006 610 -0.008 -0.01 605 600 -0.012 595 -0.014 Sep Nov Jan Mar May Jul Sep 14 14 15 15 15 15 15
FDI, cumulative Manufacturing
Exchange rate (LHS) Volatility (RHS) Sources: State Administration of Foreign Exchange and Haver Analytics.
Sources: China National Bureau of Statistics and Haver Analytics.
China recorded a trade surplus of $602.36 billion in August 2015. China’s balance of trade averaged $73.41 billion from 1983 until 2015, reaching an all-time high of $606.19 billion in February 2015. Exports in China increased to $1,968.83 billion in August from $1,949.34 billion in July 2015. Imports in China decreased to $1,366.47 billion in August from $1,518.30 billion in July 2015. Graph 3.25: Chinese capital utilised FDI, NSA
Jul 15
Sep 15
May 15
Jan 15
Mar 15
Nov 14
Sep 14
Jul 14
May 14
Mar 14
Jan 14
Nov 13
Sep 13
% change y-o-y 8 6 4 2 0 -2 -4 -6 -8
CPI CPI lower target bond PPI Official interest rate Sources: China National Bureau of Statistics and Haver Analytics.
OPEC Monthly Oil Market Report – October 2015
US$ bn 250 200 150 100 50 0 -50 -100 -150 -200 -250
197
60
-137
Aug 14 Sep 14 Oct 14 Nov 14 Dec 14 Jan 15 Feb 15 Mar 15 Apr 15 May 15 Jun 15 Jul 15 Aug 15
Graph 3.24: Chinese CPI and PPI
Exports
Imports
Trade balance
Sources: China Customs and Haver Analytics.
29
World Economy The latest survey data signalled the quickest deterioration in operating conditions faced by Chinese manufacturers since March 2009. Total new work fell at its quickest rate in over three years, partly driven by a steeper fall in new export business. As a result, companies cut output at their sharpest rate in six-and-a-half years, while staff numbers fell at their quickest pace since the start of 2009. Reduced production schedules also prompted firms to lower their purchasing activity again in September, while disappointing sales led to the strongest increase in stocks of finished goods in over three years. On the price front, both input costs and output charges fell at sharper rates. Adjusted for seasonal factors, the manufacturing PMI registered 47.2 in September, down fractionally from 47.3 in August. Also, service sector activity decreased but remains higher than the threshold amount. The health of the sector has now deteriorated in each of the past seven months. Furthermore, the latest deterioration was the most marked since March 2009. Graph 3.26: Chinese PMIs
Graph 3.27: Chinese industrial production
Index
% change y-o-y
53 52
9%
Composite PMI
8%
51 50
7%
49
6.1%
48 Manufacturing PMI
6%
47.2
Aug 15
Jul 15
Jun 15
Apr 15
May 15
Mar 15
Feb 15
Jan 15
Dec 14
Oct 14
Nov 14
Sep 14 Oct 14 Nov 14 Dec 14 Jan 15 Feb 15 Mar 15 Apr 15 May 15 Jun 15 Jul 15 Aug 15 Sep 15 Sources: HSBC, Markit and Haver Analytics.
Sep 14
5%
46
Aug 14
47
48.0
Sources: China National Bureau of Statistics and Haver Analytics.
The GDP growth expectations remain unchanged at 6.8% for 2015 and 6.4% for 2016.
OPEC Member Countries In Saudi Arabia, the GDP grew by 3.8% y-o-y in 2Q15, following growth of 2.3% in 1Q15, according to data by the Central Department of Statistics and Information. Operating conditions in the non-oil private sector remained robust in September despite the fall the PMI to 56.5 last month from 58.7. The rates of growth in production and new businesses received remain marked. The survey also revealed the strongest growth in new export orders in six months. In September, the performance of the non-oil private sector in the United Arab Emirates was strong, with the PMI posting 56.0, slightly lower than August’s 57.1. The increased output and new business were again the key drivers of growth, while improvements in employment and input stocks also supported the index. New export orders, however, dropped last month for the first time since May 2010.
30
OPEC Monthly Oil Market Report – October 2015
World Economy Graph 3.28: Saudi Arabia and UAE: PMIs Index 65
60 56.5 56.0
55
Saudi Arabia
Sep 15
Aug 15
Jul 15
Jun 15
May 15
Apr 15
Mar 15
Feb 15
Jan 15
Dec 14
Nov 14
Oct 14
Sep 14
Jul 14
Aug 14
Jun 14
May 14
Apr 14
Mar 14
Feb 14
Jan 14
Dec 13
Nov 13
Oct 13
Sep 13
50
UAE
Sources: SAAB, HSBC, Markit and Haver Analytics.
Other Asia In Indonesia, a trade surplus of $430 billion was recorded in August after posting a trade deficit in the same month of last year. Imports dropped more than exports. Exports fell by 12.3% y-o-y in August, while imports decreased 17.1% over the same period. The manufacturing sector witnessed another deterioration in September. The manufacturing PMI registered 47.4 last month, from August’s 48.4. In mid-September, the central bank of Thailand kept its benchmark interest rate unchanged at 1.5%. In 2Q15, the country’s private sector confidence and spending have been weighed down by continued contraction in exports of goods, a result of a slowdown in the Chinese and other Asian economies, as well as sluggish household income. In Vietnam, the manufacturing PMI slipped into the contraction territory in September for the first time in 25 months, posting a value of 49. Production and new business both declined last month, while input prices had a notable fall. Graph 3.29: Manufacturing PMIs of Indonesia and Vietnam Index 56 54 52 50
49.5
48
47.4
46
Vietnam
Sep 15
Aug 15
Jul 15
Jun 15
May 15
Apr 15
Mar 15
Feb 15
Jan 15
Dec 14
Nov 14
Oct 14
Sep 14
Aug 14
Jul 14
Jun 14
May 14
Apr 14
Mar 14
Feb 14
Jan 14
Dec 13
Nov 13
Oct 13
Sep 13
44
Indonesia
Sources: HSBC, Markit and Haver Analytics.
OPEC Monthly Oil Market Report – October 2015
31
World Economy
Africa In South Africa, lower sales of minerals and higher oil imports caused a widening of the trade deficit to around 9.9 billion South African rand in August, up from 1.1 billion rand in July. This marks the highest trade deficit since the beginning of the year. Exports fell 5.9% m-o-m, while imports increased 3.6% over the same period. The country’s private sector sent another negative signal through the PMI reading of September. The index declined to 47.9 last month, from 49.3 a month earlier on the back of sharp decline rates in each output, new business and purchasing activity. Moreover, employment showed a decline for the first time in four months. Graph 3.30: PMIs in South Africa and Egypt Index 54 52 50.2
50 48
47.9
46
South Africa
Sep 15
Aug 15
Jul 15
Jun 15
May 15
Apr 15
Mar 15
Feb 15
Jan 15
Dec 14
Nov 14
Oct 14
Sep 14
44
Egypt
Sources: Emirates NBD, Standard Bank, Markit and Haver Analytics.
In Egypt, the headline consumer price index was recorded at 7.9% in August, down from 8.4% in the previous month. The country’s non-oil private sector was sustained in September, though at a slower pace. The PMI reported a value of 50.2 in September, from its eight-month high reading of August at 51.2. The survey results suggested that output and new orders rose at slower paces.
Latin America The GDP of Argentina expanded 2.3% y-o-y in 2Q14, from a growth of 2.1% in 1Q15, marking the fastest rate of growth since 3Q13. The faster growth was mainly driven by the 10.3% increase in public spending. Gross Fixed Capital Formation (GFCF) improved by 4.6% y-o-y, while private consumption barely increased by 0.7% over the same period. In Chile, the central bank decided to leave its benchmark interest rate on hold at 3% in September as the economy remains weak together with higher expectations for inflation. The country’s GDP growth slowed to 1.9% y-o-y in 2Q15, down from 2.5% y-o-y in the previous quarter. Growth in private consumption was slower at 1.6% in 2Q15, from 1.9% in the preceding quarter. Government consumption also posted a notably slower growth rate of 3.7% in 2Q15, down from 5.7%. In addition, GFCF shrank by nearly 3%, following a 1.9% fall in 1Q15, while both exports and imports were lower by 4.9% and 5.1%, respectively.
32
OPEC Monthly Oil Market Report – October 2015
World Economy
Transition region In the Czech Republic, the manufacturing sector remained on a strong growth path in September, according to the manufacturing PMI. The index posted 55.5 last month, from 56.6 in August. The survey results showed another, though slight, increase in new orders. The trend for 3Q15 is the strongest since 2Q11. The country’s GDP growth picked up in 2Q15 registering 4.4%, up from 4.0% in the previous quarter. In Poland, while the manufacturing PMI remained in the expansion territory in September, it was its lowest reading in 12-month period of positive readings. The survey showed weak growth rates of production and new business. The country’s economic growth slowed to 3.6% y-o-y in 2Q15 from 3.7% in the previous quarter.
Oil prices, US dollar and inflation In September, the US dollar declined versus the euro and the yen, while it strengthened compared to the Swiss franc and the pound sterling on average. It rose by 0.4%, compared to the Swiss franc and by 1.6% versus the pound sterling, but declined by 0.8% against the euro and fell by 2.4% compared to the yen. While last month’s major development in the foreign exchange markets was the surprise adjustment of the Chinese yuan, it is notable that again in September it fell by 0.5% on average compared to the US dollar. While this is a relatively minor adjustment, this development will need further close monitoring. Amid a weakening economy, the Brazilian real fell again considerably against the US dollar on average in September. It fell again by 11% m-o-m, after a 9.0% m-o-m decline on average in August. Also, the Russian ruble continued its decline in September, albeit at a slower pace as it fell by 2.5% m-o-m, compared to a decline of 14.2% m-o-m compared to the US dollar in August. The major uncertainty about an interest rate hike in the US is currently keeping the US dollar from further rising. With low inflation/deflation in both the Euro-zone and Japan and an ongoing unprecedented stimulus programme in both economies, as well as in China, the US dollar is forecast to remain well supported at least in the short-term. In nominal terms, the price of the OPEC Reference Basket (ORB) fell by a monthly average of $0.63, or 1.4%, from $45.46/b in August to $44.83/b in September. In real terms, after accounting for inflation and currency fluctuations, the ORB declined by 1.8%, or $0.55, to $30.22/b from $30.76/b (base June 2001=100). Over the same period, the US-dollar fell by 0.5% against the import-weighted modified Geneva I + US dollar basket * while inflation declined by 0.1%.
* The ‘modified Geneva I+US$ basket’ includes the euro, the Japanese yen, the US dollar, the pound sterling and the Swiss franc, weighted according to the merchandise imports of OPEC Member Countries from the countries in the basket.
OPEC Monthly Oil Market Report – October 2015
33
World Oil Demand
World Oil Demand World oil demand growth for 2015 was adjusted higher by 40 tb/d as a result of better-than-expected performance from OECD Americas, Europe, Other Asia and China in 3Q15. As a result, 2015 world oil demand growth currently stands at 1.50 mb/d, with total global consumption of 92.86 mb/d. For 2016, world oil demand growth was adjusted lower by 40 tb/d, mainly to reflect a high baseline effect in OECD Americas. World oil demand growth is now anticipated to be 1.25 mb/d, with total global consumption at around 94.11 mb/d.
World oil demand in 2015 and 2016 Table 4.1: World oil demand in 2015, mb/d Change 2015/14 % Growth 0.36 1.49 0.38 1.93 0.17 1.29 -0.11 -1.31 0.43 0.93
Americas of which US Europe Asia Pacific Total OECD
2014 24.19 19.43 13.40 8.16 45.75
1Q15 24.25 19.60 13.48 8.77 46.49
2Q15 24.13 19.47 13.60 7.72 45.44
3Q15 24.82 19.99 13.81 7.58 46.20
4Q15 24.99 20.15 13.40 8.16 46.55
2015 24.55 19.81 13.57 8.05 46.17
Other Asia of which India Latin America Middle East Africa Total DCs
11.42 3.79 6.60 8.14 3.78 29.95
11.46 4.01 6.40 8.24 3.88 29.99
11.95 3.98 6.66 8.21 3.87 30.68
11.76 3.78 7.00 8.74 3.79 31.29
11.70 3.99 6.74 8.15 3.94 30.53
11.72 3.94 6.70 8.34 3.87 30.63
0.30 0.15 0.10 0.19 0.09 0.68
2.60 4.03 1.48 2.37 2.38 2.26
FSU Other Europe China Total "Other regions"
4.54 0.65 10.46 15.66
4.39 0.66 10.44 15.49
4.23 0.62 11.06 15.91
4.63 0.65 10.66 15.95
4.94 0.74 11.19 16.87
4.55 0.67 10.84 16.06
0.01 0.02 0.37 0.40
0.20 2.41 3.58 2.55
Total world Previous estimate Revision
91.35 91.33 0.02
91.97 91.93 0.04
92.04 92.03 0.02
93.44 93.28 0.15
93.96 93.90 0.06
92.86 92.79 0.07
1.50 1.46 0.04
1.65 1.60 0.05
Totals may not add up due to independent rounding.
OECD Americas The latest US monthly data for July shows a solid increase in oil demand by around 0.7 mb/d or around 4% y-o-y, higher than the observed average trend in growth since the beginning of 2015. Total product demand stood at 20.40 mb/d. Gasoline requirements accounted for the largest share of oil demand and grew strongly by almost 0.2 mb/d, an increase of around 2% y-o-y, with the support of a lower fuel oil price environment. Distillate demand stayed flat during July y-o-y, while jet fuel requirements registered solid growth, backed by increased travel during the traditional holiday season. Some increases were seen in residual fuel oil, mainly as a result of the previous year’s lower baseline. Based on data available for three quarters of 2015 – monthly data until July and preliminary weekly data for August and September – US oil demand seems to have grown by around 0.4 mb/d, with gasoline requirements being the product category most on the rise and distillates on the decline, compared with the same period the previous year. Moreover, some declines were registered in residual fuel oil demand.
34
OPEC Monthly Oil Market Report – October 2015
World Oil Demand For the remainder of 2015 and 2016, US oil demand is expected to be strongly determined by gasoline usage in the road transportation sector and fuel price levels. Higher-than-expected gasoline consumption, especially in 2H15, has set a high baseline for 2016 consumption. As a result, some downward revisions were made to 2016 oil demand estimates. The overall risk for US oil demand remained balanced from the previous month – upside risks originate in the pace of projected growth of the economy and oil usage in the road transportation sector, while fuel substitution and vehicle efficiencies dominate downside risks. Graph 4.1: US oil consumption, y-o-y changes
All other
Distllates
Gasoline
Sep 15
Aug 15
Jul 15
Jun 15
May 15
Apr 15
Mar 15
Jan 15
Feb 15
Dec 14
Nov 14
Oct 14
Sep 14
Aug 14
Jul 14
Jun 14
May 14
Apr 14
Mar 14
Feb 14
Jan 14
Dec 13
Nov 13
Oct 13
Sep 13
tb/d 1,400 1,200 1,000 800 600 400 200 0 -200 -400 -600
Total oil
Expanding Mexican manufacturing activity in August 2015, in combination with low fuel prices, have led to increases in oil demand with residual fuel oil and gasoline accounting for the bulk of these decreases. The risks for Mexican oil demand in 2015 and 2016 are skewed slightly to the upside, but depend on the overall economic development. In Canada, oil demand in July decreased y-o-y. Gains in jet fuel have been more than offset by sharp declines in requirements for all other main product categories. Canadian oil demand for 2015 and 2016 is projected to remain roughly at 2014 levels, marking only marginal increases, with risks equally distributed between the upside and the downside, depending on developments in the economy. Graph 4.2: Quarterly world oil demand growth tb/d 2,000 1,500 1,000 500 0 -500 -1,000 1Q
2Q
3Q
4Q
1Q
2Q
2014 OECD
3Q
2015 forecast Non-OECD
OPEC Monthly Oil Market Report – October 2015
4Q
1Q
2Q
3Q
4Q
2016 forecast Total world
35
World Oil Demand In 2015, OECD Americas’ oil demand is expected to grow by 0.36 mb/d compared with a year earlier. For 2016, the region’s oil demand is projected to increase by 0.29 mb/d compared with 2015.
OECD Europe European oil demand remained strong for another month, with increases of around 0.3 mb/d in August y-o-y; the majority of countries in the region saw positive demand growth. Data for the first eight months of 2015 showed increasing European Big 4 oil demand by approximately 0.11 mb/d, equating to 1.7% y-o-y, taking total demand to 6.70 mb/d, with diesel, jet fuel, LPG and residual fuel oil seeing positive growth and gasoline remaining flat compared with the same period one year ago. Gains in transportation fuels are in line with the positive momentum in auto sales, which showed solid increases of around 11% during August y-o-y and large expansions into all major auto markets. General expectations for the region’s oil demand during 2015 continued to improve over the previous month’s projections but continue to be subject to risks from high taxation polices for oil use and fuel substitution. The main factors that could push oil demand up are expected economic growth, a low historical baseline and the low fuel price environment, the latter despite existing high taxation. For 2016, expansion in OECD Europe’s major economies in view of the low oil price environment is the major assumption. From a product point of view, transportation fuels, particularly diesel and gasoline, are projected to lead oil consumption. On the other hand, some uncertainties linked to the economic development as well as fuel substitution and efficiencies in the road transportation sector remain negative contributors to oil demand in the region next year. OECD Europe’s oil demand is projected to grow by 0.17 mb/d in 2015, while in 2016 oil demand will marginally decline, by comparison. Table 4.2: Europe Big 4* oil demand, tb/d LPG Gasoline Jet/Kerosene Gas/Diesel oil Fuel oil Other products Total
Aug 15 345 1,118 933 3,103 284 934 6,717
Aug 14 339 1,115 834 3,038 262 1,029 6,618
Change from Aug 14 Change from Aug 14, % 5 1.5 3 0.2 100 12.0 64 2.1 23 8.6 -96 -9.3 99 1.5
* Germany, France, Italy and the UK.
OECD Asia Pacific Preliminary data implies that Japanese oil demand rose by 0.12 mb/d, which equates to a hike of around 4% y-o-y in August; the first month to see a rise since 1Q14 and following a sharp decline in July. Total product consumption stood at 3.53 mb/d in August. The picture was promising in all product categories, with the only exception being residual fuel oil. Naphtha and LPG requirements for the petrochemical industry, as well as jet fuel, constituted the largest share of increases. Growth in gasoline and diesel requirements in the road transportation sector also continued, while the picture
36
OPEC Monthly Oil Market Report – October 2015
World Oil Demand remained negative regarding volumes required for direct burning of fuel oil. Direct burning of crude oil, however, showed increases y-o-y, despite the re-opening of the first nuclear plant in the country, as exceptionally warm weather in some areas increased cooling needs. The restart of an additional reactor at Sendai is expected to take place by the end of 2015, pending successful completion of further inspections. The outlook for 2015 and 2016 Japanese oil demand remained unchanged from the previous month’s forecasts, with risks continuing to be skewed toward the downside, mainly as a result of a weakening economic forecast. Moreover, projections for 2016 assume a strong likelihood that a number of nuclear plants will rejoin operation. In South Korea, available data for July indicates a slight increase of 20 tb/d or around 1% compared with the same month a year earlier. Total product consumption stood at 2.34 mb/d in July. All main product categories were on the rise compared with July 2014, with the exception of residual fuel oil, particularly LPG, gasoline, diesel and naphtha requirements. The outlook for South Korean oil consumption during 2015 and 2016 remains unchanged and positive compared with the previous month’s projections. OECD Asia Pacific’s oil consumption is projected to fall by 0.11 mb/d in 2015 and continue to drop in 2016, to a larger extent, by 0.14 mb/d y-o-y. Table 4.3: Japanese domestic sales, tb/d LPG Gasoline Naphtha Jet fuel Kerosene Gasoil Fuel oil Other products Direct crude burning Total
Aug 15 349 1,032 772 123 96 568 404 50 138
Change from Aug 14 12 21 46 30 5 20 -32 -4 25
Change from Aug 14, % 3.6 2.1 6.4 32.4 5.5 3.6 -7.4 -7.1 21.6
3,532
123
3.6
Other Asia Indian oil demand has been demonstrating robust growth y-o-y and this continued to be the case through August. Demand for petroleum products rose strongly, increasing by around 0.24 tb/d or 7% y-o-y, taking total demand to 3.62 mb/d. There has been excellent growth in all products y-o-y with the exception of fuel oil. LPG demand was higher by 41 tb/d or around 8% y-o-y, driven by cylinder subsidies, logistical ease in some bottlenecks and a switch from other products to LPG. Gasoline demand reached 0.5 mb/d in spite of slower passenger vehicle sales growth than in previous months – it increased by 6% in August from double-digit figures seen earlier in the year. This upward trend encouraged the Indian Oil Corporation Ltd (IOC) and the Hindustan Petroleum Corporation Limited (HPCL) to actively continue importing gasoline. Indeed, imports have been substantially higher in 2015, averaging around 30 tb/d for the January–July period, and expectations are high that this trend will continue for the remainder of the year. Another supporting factor for gasoline consumption was lower retail gasoline prices, which were reduced further in September – the fourth time since May. They dropped to $0.92/litre in August from $1.20/litre for the same month one year earlier and from $1.05/litre in July as reported by the IOC.
OPEC Monthly Oil Market Report – October 2015
37
World Oil Demand Graph 4.3: Changes in Indian oil demand, y-o-y tb/d 400 300 200 100 0 -100 -200
LPG
Gasoline
Kerosene
Diesel oil
Fuel oil
Aug 15
Jul 15
Jun 15
May 15
Apr 15
Mar 15
Feb 15
Jan 15
Dec 14
Nov 14
Oct 14
Sep 14
Jul 14
Aug 14
Jun 14
May 14
Apr 14
Mar 14
Feb 14
Jan 14
Dec 13
Nov 13
Oct 13
Sep 13
Aug 13
-300
Other products
Diesel demand also increased in August, rising by 79 tb/d or around 6% y-o-y. Less rain than anticipated led to an increase in diesel consumption in the agricultural sector, in addition to the late arrival of seasonal monsoon rains in August of the previous year, which led to reduced diesel demand and a lower base of comparison. Support also stemmed from the industrial sector, as the manufacturing PMI stood at 52.6 points in August, increasing for the third consecutive month. Fuel oil demand weakened by around 10 tb/d or minus 4% y-o-y, largely as a result of natural gas substitution in the power and fertilizer sectors. Going forward, expectations for Indian oil demand in 2016 are firm at this stage, with also a slight appreciation in the overall economy expected to positively affect oil demand data. Table 4.4: Indian oil demand by main products, tb/d LPG Gasoline Kerosene Diesel oil Fuel oil Other products Total oil demand
Aug 15 556 495 270 1,427 228 646
Aug 14 516 448 269 1,348 236 570
Change 41 47 1 79 -9 76
Change, % 7.9 10.6 0.4 5.9 -3.7 13.3
3,622
3,387
235
6.9
The latest July data for Indonesia shows a rise of around 30 tb/d or 2% y-o-y, with growing requirements for industrial and transportation fuels (gasoline, diesel and jet). Developments in manufacturing data supported industrial fuel requirements. In Thailand, oil demand rose in July, showing an increase of around 35 tb/d, which equates to around 4% y-o-y, mainly driven by transportation fuels. The key issues for the Other Asia region include budget deficits and the effects of subsidy removal on oil products. For 2016, oil demand projections for Other Asia remain as stated the previous month, with major assumptions hinting at improved economic activity over the current year, while the effect of subsidy reduction is assumed to be less than it has been in past years. In terms of products, the middle of the barrel is anticipated to lead growth, followed by transportation fuels.
38
OPEC Monthly Oil Market Report – October 2015
World Oil Demand Other Asia’s oil demand is anticipated to grow by 0.30 mb/d y-o-y in 2015 and by 0.29 mb/d in 2016.
Latin America August oil demand data for Brazil was once again disappointing compared with the same month of the previous year. Oil demand growth shrank by 0.10 mb/d or around 4% y-o-y, taking year-to-date oil demand growth levels into negative territory. Total oil demand stood at 2.44 mb/d in August. Fuel oil and most transportation fuels – with the exception of ethanol – were the main drivers behind the decline. Gasoline declined by 85 tb/d, which equates to more than 11%, marking the seventh decrease in 2015. Moreover, passenger vehicle sales showed slower economic momentum in the country, with August sales data reflecting lower growth by more than 20% y-o-y. On the other hand, ethanol consumption rose significantly, increasing by more than 0.10 mb/d or more than 48% y-o-y, as drivers in Brazil preferred to switch from gasoline to more competitively priced ethanol. Ethanol demand growth was exceptional in 2015, on a y-o-y basis. Diesel demand eased compared with the same month one year ago, declining by around 68 tb/d or more than 6% y-o-y, primarily because manufacturing and industrial activities are slowing in tandem with sluggish overall economic conditions. Jet/kerosene fuel demonstrated a slight decline of around 3 tb/d or 3% y-o-y. Fuel oil demand experienced the largest losses, dipping by around 44 tb/d, which equals a decrease of 36% y-o-y as the result of a high baseline, along with easing industrial production and power generation demand. The risks for 2015 oil demand in the region are currently skewed to the downside, with anticipation of a declining economy in Brazil, while expectations for 2016 oil demand growth remain at the same levels anticipated one month earlier. Table 4.5: Brazilian inland deliveries, tb/d Aug 15
Aug 14
Change
Change, %
LPG Gasoline Jet/Kerosene Diesel Fuel oil Alcohol
234 668 126 1,018 77 319
240 753 129 1,086 121 215
-6 -85 -3 -68 -44 104
-2.5 -11.3 -2.7 -6.3 -36.1 48.2
Total
2,442
2,544
-102
-4.0
In Argentina, oil demand continued to grow amid some economic recovery. All transportation fuels (gasoline, jet/kerosene and diesel oil) rose, by 6%, 3% and 6%, respectively. The latest Ecuadorian data for August reflected lower oil requirements compared with the same month one year ago by around 24 tb/d or 9%; gasoline and fuel oil requirements declined, while LPG was the only product that saw positive growth. Projections for 2016 oil demand growth in Latin America are in line with the previous month’s expectations, reflecting slightly better expectations for economic development compared with 2015, and providing some support for oil demand projections going forward. Brazil is assumed to be the main contributor to growth, with transportation fuels leading.
OPEC Monthly Oil Market Report – October 2015
39
World Oil Demand Latin American oil demand is expected to grow in 2015 by 0.10 mb/d and increase to reach 0.13 mb/d in 2016.
Middle East August oil demand in Saudi Arabia increased by 0.1 mb/d or around 5% y-o-y, to reach 2.86 mb/d. All products experienced growth with the exception of diesel oil, for which demand shrank by around 7% y-o-y. Jet/kerosene, fuel oil, LPG and direct crude for burning grew by more than 10% y-o-y. Strong growth in the transportation sector was supported by the end of summer holidays, especially in aviation, while demand growth for fuel oil and direct crude for burning can be largely attributed to additional summer power generation requirements, which tend to peak as a result of additional air conditioning usage. Demand growth for fuel oil increased by 56 tb/d y-o-y, leading to total consumption for the product of 0.46 mb/d. Additionally, demand growth for direct crude for burning reached 80 tb/d and total consumption for the product remained at the same levels as the previous month, around 0.85 mb/d. Oil demand increased significantly in Iraq for yet another month, marking the third consecutive month of a healthy rise in oil requirements y-o-y. Total demand rose by more than 25% or 0.15 mb/d y-o-y in August. Total oil demand, in absolute terms, is now around 0.75 mb/d after reaching as low as 0.52 mb/d in April this year. Aviation jet/kerosene was sharply higher in percentage terms, mainly as the result of a low baseline. Fuel oil for power generation also recorded significant gains of around 42 tb/d or more than 30% y-o-y. Graph 4.4: Oil demand growth in the Middle East, y-o-y tb/d
tb/d
500
500
400
400
300
300
200
200
100
100
0
0
-100
-100 1Q12 2Q12 3Q12 4Q12 1Q13 2Q13 3Q13 4Q13 1Q14 2Q14 3Q14 4Q14 1Q15 2Q15 Saudi Arabia
Iran, I.R.
Kuwait
UAE
Others
In 2016, oil demand growth in the Middle East is anticipated to be at the same levels as highlighted in the previous month’s report, as economic activities are expected to gain momentum over 2015 levels. Demand is foreseen to be led by Saudi Arabia, with transportation fuels, petrochemical feedstock and crude oil for direct use projected to contribute to product growth. However, geopolitical concerns are expected to have a negative impact on oil consumption in certain countries. Middle East oil demand for 2015 is expected to grow by 0.19 mb/d, while oil demand in 2016 is projected to increase by 0.21 mb/d.
40
OPEC Monthly Oil Market Report – October 2015
World Oil Demand
China Chinese oil consumption continued its upward momentum through August, growing by around 0.49 mb/d y-o-y and led by sizable increases in gasoline and LPG use. Total consumption stood at 10.72 mb/d during the month. Lower gasoline retail prices, improvements in year-to-date car sale statistics – especially for sports-utility vehicles (SUV) models – and the commissioning/ramping up of operations for new propane dehydrogenation (PDH) plants in the country were major contributors to this growth. Gasoline demand was higher by around 0.39 mb/d, which equates to around 17% y-o-y, also stimulated by robust SUV sales, despite a contraction in overall car sales. SUV sales have been rising on a y-t-d basis, increasing by more than 45% for the first seven months of the year and giving gasoline consumption a good buffer going forward. According to statistics and analysis from the Chinese Association of Automobile Manufacturers (CAAM), year-to-date data sales of passenger cars reached 12.9 million units, up by around 3% y-o-y. SUV models recorded double-digit growth as did multi-purpose vehicle (MPV) models. MPV sales increased by around 10% compared with the same period in 2014. Additionally, gasoline retail prices were lower than the previous August, decreasing to $0.73/l compared with $1.10/l in August of 2014 and from $0.79/l the previous month, as reported by the National Bureau of Statistics of China. Graph 4.5: Chinese gasoil and gasoline demand growth, y-o-y % 20 15 10 5 0 -5 -10
Gasoline
Aug 15
Jul 15
Jun 15
May 15
Apr 15
Mar 15
Feb 15
Jan 15
Dec 14
Nov 14
Oct 14
Sep 14
Aug 14
Jul 14
Jun 14
May 14
Apr 14
Mar 14
Feb 14
Jan 14
Dec 13
Nov 13
Oct 13
Sep 13
Aug 13
-15
Gasoil
LPG demand rose by around 0.13 mb/d y-o-y, which equates to more than 13% y-o-y, supported by the Yantai Wanhua Chemical plant ramping up its new 0.75 million tonne/year PDH unit since early July. Jet/kerosene demand increased by 37 tb/d or around 7% y-o-y despite fears of slower economic activity. August diesel demand remained almost flat, predominantly as a result of limitations in construction activity. Fuel oil dipped by almost 90 tb/d or around 15% from August’s levels in 2014. This increase is largely attributed to strict import quotas and maintenance programmes undertaken by teapot refineries, which are major consumers of fuel oil in China. The overall 2015 picture slightly improved over the previous month as a healthy petrochemical segment and robust gasoline consumption provided support to overall demand. Projections for oil demand development in 2016 remain unchanged from one month ago. The outlook is assuming transportation and industrial fuels will lead the product mix in 2016, with GDP growth lower than in 2015, a continuation of fuel quality programmes targeting lower emissions and continued fuel substitution.
OPEC Monthly Oil Market Report – October 2015
41
World Oil Demand Graph 4.6: Changes in Chinese apparent oil demand, y-o-y changes tb/d
tb/d
1,000
1,000
800
800
600
600
400
400
200
200
0
0
-200
-200
-400
-400
-600 Jan
Feb
Mar
Apr
May
Historical range
Jun
Jul
Aug
2014
Sep
Oct
2015*
Nov
-600 Dec
2016*
* Forecast.
For 2015, Chinese oil demand is anticipated to grow by around 0.37 mb/d, while expectations for 2016 are in the range of 0.30 mb/d. Table 4.6: World oil demand in 2016, mb/d Change 2016/15 % Growth 0.29 1.19 0.25 1.26 -0.01 -0.08 -0.14 -1.69 0.15 0.31
Americas of which US Europe Asia Pacific Total OECD
2015 24.55 19.81 13.57 8.05 46.17
1Q16 24.54 19.86 13.49 8.62 46.66
2Q16 24.45 19.75 13.59 7.58 45.62
3Q16 25.10 20.24 13.79 7.45 46.34
4Q16 25.26 20.38 13.37 8.03 46.66
2016 24.84 20.06 13.56 7.92 46.32
Other Asia of which India Latin America Middle East Africa Total DCs
11.72 3.94 6.70 8.34 3.87 30.63
11.76 4.16 6.55 8.45 3.97 30.73
12.24 4.12 6.79 8.42 3.96 31.42
12.05 3.92 7.12 8.96 3.88 32.00
11.99 4.14 6.88 8.36 4.04 31.27
12.01 4.08 6.84 8.55 3.96 31.36
0.29 0.15 0.13 0.21 0.10 0.73
2.48 3.68 2.00 2.55 2.49 2.40
FSU Other Europe China Total "Other regions"
4.55 0.67 10.84 16.06
4.45 0.68 10.77 15.89
4.29 0.64 11.35 16.28
4.68 0.67 10.96 16.31
4.99 0.76 11.48 17.24
4.60 0.69 11.14 16.43
0.05 0.02 0.30 0.38
1.14 2.99 2.80 2.34
Total world Previous estimate Revision
92.86 92.79 0.07
93.28 93.24 0.04
93.32 93.32 0.00
94.65 94.56 0.09
95.17 95.18 0.00
94.11 94.08 0.03
1.25 1.29 -0.03
1.35 1.39 -0.04
Totals may not add up due to independent rounding.
42
OPEC Monthly Oil Market Report – October 2015
World Oil Supply
World Oil Supply Non-OPEC oil supply is estimated to average 57.24 mb/d in 2015, an increase of 0.72 mb/d over the previous year. Growth was revised down by 0.16 mb/d from last month’s estimation, on the prediction that US supply declines are likely to accelerate, given the persistently low oil prices. OECD Americas and Africa oil supply were revised down, whereas in other regions, particularly OECD Europe, Other Asia, Latin America and the FSU, supply figures were revised up, partially offsetting the downward revisions. Non-OPEC oil supply in 2016 is now forecast at an average of 57.11 mb/d, a contraction of 0.13 mb/d from 2015 levels. This is 0.29 mb/d lower than the previous MOMR’s forecast and is based on an expected steeper production decline in US shale plays, and legacy wells outnumbering newly drilled wells, as well as the negative effects of capex cuts in different regions of the world. Production of OPEC NGLs is forecast to grow by 0.19 mb/d and 0.17 mb/d to average 6.01 mb/d and 6.18 mb/d in 2015 and 2016, respectively. In September, OPEC production increased by 109 tb/d to average 31.57 mb/d, according to secondary sources. As a result, preliminary data indicates that global oil supply decreased by 0.34 mb/d in September to average 94.16 mb/d.
Forecast for 2015 Non-OPEC supply US tight oil production – the main driver of non-OPEC supply growth – has been declining since May 2015. This downward trend should accelerate in 2H15 and 1H16, given various factors including persistently low oil prices, highly leveraged balance sheets, and increasingly costly debt, coupled with a more cautious approach by equity investors who will limit the availability of cash to allow producers to sustain operations. Hence, the number of newly-drilled wells is decreasing and the number of active drilling rigs has declined by around half. Furthermore, the high decline rates for tight oil wells pose a serious problem for legacy wells as, within three to five years, these wells produce less than 20% of their initial production capacity. The US and Canada combined saw the highest output of all non-OPEC countries with growth of 2 mb/d in 2014, which mostly came from unconventional sources of shale and tight plays, as well as oil sands. However, persistently low oil price levels have caused the US shale oil sector to shrink. Shale drillers in the US have slashed spending and cut the number of workers this year as prices have fallen. The Chesapeake Energy Corporation, the second-largest producer of natural gas and the eleventh largest producer of combined oil and natural gas liquids in the US, has cut 15% of its workforce. Chevron is cutting 1,500 jobs worldwide as part of its drive to reduce internal costs at multiple operating units and in the corporate sector. Statoil has also implemented further cost reductions in the current year. The company previously estimated 2015 capital expenditure at $18 billion, down around 10% from the previous estimate of $20 billion. But the target has now been reduced further to $17.5 billion. Oilfield service companies, such as Schlumberger and Halliburton, have also seen job cuts as crude prices began plummeting last year. However, other majors and the large US independents have tried to hold on to their employees on the grounds that it is difficult
OPEC Monthly Oil Market Report – October 2015
43
World Oil Supply to rehire skilled workers once the market turns and companies get ready to ramp up operations again. Outside North America, for instance in the UK, the current climate remains unattractive to investors, given the low oil prices, the steep decline rates, the high decommissioning costs and the general unfavorable fiscal regime. Graph 5.1: Regional non-OPEC supply growth, y-o-y mb/d
mb/d
2.0
2.0 14/13
15/14
16/15
1.6
1.6
1.2
1.2
0.8
0.8
0.4
0.4
0.0
0.0 -0.4
-0.4 OECD America
OECD Europe
OECD Asia Pacific
Other Asia
Latin Middle East America
Africa
FSU
Non-OPEC oil supply growth will decelerate sharply in 2015, from the tremendous growth of 2.24 mb/d achieved in 2014, to grow by only 0.72 mb/d to average 57.24 mb/d. This represents a decline of 0.19 mb/d from the previous report. US shale producers will not be able to raise the capital they need to sustain their production and this will cause such a sharp decline in US oil output in 2016. It is true that the US oil and gas industry has made progress in improving efficiencies and lowering costs, but crude prices below $45/b are having an impact. Canadian producers are also struggling to tolerate the low oil prices. It is expected that around seven major projects in the oil sands will be delayed or put on hold until prices recover. However, enough projects are continuing to realize growth in 2016, albeit at a very modest level. Nevertheless, higher-than-expected oil production from non-OPEC producers outside North America was seen during 2Q15 and 3Q15. Production in the North Sea, China, Asia, Latin America and Russia and even recently in Oman, indicates there is still room for growth in other prospective regions. China is considering opening up further conventional oil and natural gas exploration acreage to the private sector, following a recent licensing round in areas that previously failed to attract much interest. China collects a 6% resource tax on oil and gas output, but the government may allow local officials to start to set their own rates since the oil price fall has hit their coffers hard. Non-OPEC supply growth is expected to experience a decrease of 0.89 mb/d in 2H15. Uncertainties in relation to non-OPEC production in the near-to-short term, such as the US tight oil decline rate, Brazil’s financial issues, Middle East geopolitics and IOCs’ downward spending revisions, all indicate further downward risk for the remainder of 2015. Another indication of uncertainty in the production growth outlook of non-OPEC oil producers in the coming months will be the number of active rigs around the world, particularly in regions where the oil production breakeven point is much higher than the current oil price – from unconventional sources or deep offshore and the North Sea.
44
OPEC Monthly Oil Market Report – October 2015
World Oil Supply Table 5.1: Non-OPEC oil supply in 2015, mb/d
Americas of which US Europe Asia Pacific Total OECD
2014 20.09 12.97 3.60 0.51 24.20
1Q15 20.92 13.66 3.69 0.43 25.04
2Q15 20.56 13.87 3.77 0.45 24.77
3Q15 20.41 13.51 3.58 0.48 24.46
4Q15 20.36 13.36 3.61 0.46 24.44
2015 20.56 13.60 3.66 0.45 24.68
Change 15/14 0.47 0.63 0.06 -0.05 0.48
Other Asia Latin America Middle East Africa Total DCs
3.48 5.01 1.34 2.36 12.19
3.62 5.23 1.30 2.40 12.55
3.61 5.16 1.25 2.38 12.40
3.53 5.11 1.23 2.29 12.16
3.50 5.11 1.22 2.29 12.12
3.56 5.15 1.25 2.34 12.31
0.08 0.15 -0.09 -0.03 0.12
FSU of which Russia Other Europe China Total "Other regions" Total Non-OPEC production Processing gains
13.55 10.68 0.13 4.29 17.97 54.36 2.16
13.68 10.74 0.13 4.33 18.14 55.73 2.19
13.59 10.76 0.13 4.39 18.11 55.28 2.19
13.54 10.76 0.13 4.34 18.01 54.64 2.19
13.55 10.74 0.13 4.34 18.02 54.59 2.19
13.59 10.75 0.13 4.35 18.07 55.05 2.19
0.04 0.07 0.00 0.06 0.10 0.70 0.02
Total non-OPEC supply Previous estimate Revision
56.52 56.55 -0.03
57.91 57.96 -0.05
57.47 57.65 -0.18
56.82 56.92 -0.10
56.77 57.20 -0.43
57.24 57.43 -0.19
0.72 0.88 -0.16
OECD Total OECD oil supply in 2015 is expected to grow by 0.48 mb/d to average 24.68 mb/d, a downward revision of 0.18 mb/d from the previous MOMR. Output in 2Q15 and 3Q15 was revised down by 0.12 mb/d to average 24.77 mb/d and 0.16 mb/d to average 24.46 mb/d, respectively. Y-o-y growth in 2015 is expected to come from OECD Americas and OECD Europe with 0.47 mb/d and 0.06 mb/d, respectively, while OECD Asia Pacific is forecast to decline by 0.05 mb/d compared to last year. On a quarterly basis, total OECD supply in 2015 is estimated to average 25.04 mb/d, 24.77 mb/d, 24.46 mb/d and 24.44 mb/d, respectively.
OECD Americas OECD Americas’ oil supply in 2015 is estimated to average 20.56 mb/d, showing growth of 0.47 mb/d y-o-y and representing a downward revision of 0.2 mb/d from the previous month’s report. Supply in the US and Canada is expected to grow in 2015, while Mexico will decline. On a quarterly basis, OECD Americas’ oil supply in 2015 is expected to average 20.92 mb/d, 20.56 mb/d, 20.41 mb/d and 20.36 mb/d, respectively.
US Until this year, US oil output was growing at the fastest rate on record, adding around 1 mb/d of new supply each year, thanks to the introduction of new drilling techniques that have released oil and gas from shale formations. However, recent data shows that US output has already begun to decline after reaching a peak of 9.6 mb/d in April, although production in some big shale patches, including North Dakota, has held
OPEC Monthly Oil Market Report – October 2015
45
World Oil Supply steady, based on actual data. Hence, US total oil supply is anticipated to grow by 0.63 mb/d to average 13.60 mb/d in 2015, representing a downward revision of 0.15 mb/d from the previous month’s report. US actual liquids production was registered at 13.83 mb/d in July, indicating a decline of 0.03 mb/d m-o-m. At the same time, US total crude oil production increased by 0.09 mb/d to average 9.36 mb/d following two months of decline in May and June. In Texas, the two main tight oil plays, Permian and Eagle Ford, showed declines of 12 tb/d m-o-m to average 3.45 mb/d in July. Oil production from the Gulf of Mexico increased by 147 tb/d to average 1.58 mb/d, while output in North Dakota, mainly from Bakken in the Williston Basin was steady at around 1.2 mb/d in July. While the latest EIA monthly data for July showed a 94 tb/d m-o-m increase in crude output, the fact is this was entirely due to rising GoM production, following the completion of heavy maintenance work across May and June. Graph 5.2: US annual liquids production and annual growth mb/d
Percentage
16 14 12 10 8 6 4 2 0 -2
13.60
13.54
0.63
2009
2010
2011
US annual production
2012
2013
Y-o-y growth
2014
-0.06 2016 2015 (forecast) (forecast)
18% 16% 14% 12% 10% 8% 6% 4% 2% 0% -2%
% change y-o-y growth (RHS)
Source: OPEC Secretariat.
Oil production from Alaska was also more or less stagnant at an average of 0.45 mb/d. In a more longer-term development, Royal Dutch Shell announced that it was giving up on efforts to produce oil and gas in Alaska’s Arctic waters. The company has spent more than $7 billion exploring for oil in Alaska's Arctic, going through a years-long regulatory gauntlet and attracting criticism from environmental groups. Shell pushed forward in the hope of finding a big new source of future revenue and establishing expertise and a presence in the Arctic, which geologists estimate holds a quarter of the world’s undiscovered conventional oil and gas. The company also held the hopes of the state of Alaska, which has seen oil production and revenues decline sharply in recent years, as well as the US oil industry in general, which looked to Alaska's offshore Arctic as the next source of oil big enough to keep the country among the top three oil producers. But Shell, drilling to 6,800 feet about 80 miles offshore in the Chukchi Sea off Alaska's northwest coast and supported by a 28-vessel flotilla, was not able to find much. The average of US crude oil production in August and September, based on the EIA weekly report, indicates a decline of about 0.33 mb/d compared to the average output (weekly data) of June and July. Therefore, it is expected that US liquids production in 3Q15 will decline by 0.36 mb/d over 2Q15 to average 13.51 mb/d and then fall by another 0.15 mb/d in 4Q15 to 13.36 mb/d. Four out of seven major US shale plays are expected to see a decline of 80 tb/d with production settling at 5.20 mb/d in October compared to September, according to the EIA data. The data focuses on the Bakken, Eagle Ford, Haynesville, Marcellus, Niobrara, Permian and Utica sites, which altogether accounted for 95% of the US oil production increases. The monthly drop will
46
OPEC Monthly Oil Market Report – October 2015
World Oil Supply again be led by Eagle Ford, where output is expected to fall by 62 tb/d in October to settle at 1.42 mb/d. Production from the Bakken site in October is forecast to fall by 21 tb/d to 1.18 mb/d. However, production in the Permian basin has continued to grow, with output expected to increase by 23 tb/d to reach 2.02 mb/d in October. Overall, based on the downward trend observed since May, total US production is forecast to continue declining in coming months. US liquids q-o-q changes compared to other non-OPEC supply can be seen in the graph below. Graph 5.3: US liquids vs. non-OPEC supply, q-o-q growth mb/d 1.0 0.8 0.6 0.4 0.2 0.0 -0.2 -0.4 -0.6 -0.8 -1.0
0.70 0.22 0.10 0.13 -0.03
0.10
0.21 -0.66
-0.36
-0.05
0.52 0.11
0.18 0.04
-0.15
-0.29
1Q15
-0.45
-0.65
2Q15
3Q15
US liquids growth
4Q15
1Q16
0.07 0.04
-0.11 -0.22
0.03
2Q16
3Q16
Non-OPEC supply excl. US
0.18
4Q16
Total liquids growth
Source: OPEC Secretariat.
US oil rig count Graph 5.4: US total rig count by selected basin
Graph 5.5: Total US rig count
Rig count
Rig count
600
2,500
500
2,000
400
1,500
300 200
1,000
100
500
Eagle Ford
Permian
Williston
Source: Baker Hughes.
0
7 Nov 14 26 Nov 14 19 Dec 14 9 Jan 15 30 Jan 15 20 Feb 15 13 Mar 15 2 Apr 15 24 Apr 15 15 May 15 5 Jun 15 26 Jun 15 17 Jul 15 7 Aug 15 28 Aug 15 18 Sep 15
7 Nov 14 26 Nov 14 19 Dec 14 9 Jan 15 30 Jan 15 20 Feb 15 13 Mar 15 2 Apr 15 24 Apr 15 15 May 15 5 Jun 15 26 Jun 15 17 Jul 15 7 Aug 15 28 Aug 15 18 Sep 15
0
Source: Baker Hughes.
According to Baker Hughes’ latest weekly report, the total drilling rig count outside North America in September increased by 3 units to 1,140 rigs – 183 less than in September 2014. The average US rig count for September was 840, down by 43 from August and lower by 1,090 (57%) y-o-y. Moreover, comparison details of US rig activities registered at 2 October 2015 can be seen in the table below.
OPEC Monthly Oil Market Report – October 2015
47
World Oil Supply Table 5.2: US rotary rig count Oil and gas split Oil Gas
Change M-o-m -48 -7
Y-o-y -977 -135
Y-o-y, % -61 -41
-24 -5
-51 -4
-1,074 -39
-58 -54
83 609 117
-3 -20 -6
-2 -50 -3
-126 -732 -255
-60 -55 -69
809
-29
-55
-1,113
-58
2 Oct 15 614 195
W-o-w -26 -2
Location Land Offshore
776 33
Drilling type Directional Horizontal Vertical US drilling total Source: Baker Hughes.
On a quarterly basis, US oil supply in 2015 is expected to average 13.66 mb/d, 13.87 mb/d, 13.51 mb/d and 13.36 mb/d, respectively. Graph 5.6: US quarterly production
Graph 5.7: US quarterly production, annual comparison
mb/d
mb/d
15
15 14
14
13 13 12 12 11 11
10
10
9 1Q
1Q13 2Q13 3Q13 4Q13 1Q14 2Q14 3Q14 4Q14 1Q15 2Q15 3Q15 4Q15 1Q16 2Q16 3Q16 4Q16
9
2Q
3Q
4Q
2013
2014
2015
2016
Canada and Mexico Oil supply in Canada is expected to grow by 0.05 mb/d in 2015 to average 4.36 mb/d y-o-y, a downward revision of 40 tb/d from the previous month. Final June data shows conventional output fell in June by 0.17 mb/d y-o-y to 1.19 mb/d, the lowest level since August 2012. Moreover, output of NGLs declined to 0.69 mb/d. The onshore rig count fell to just 70 rigs in September, lower y-o-y by 152, suggesting conventional declines have continued. Preliminary estimates place July Canadian output lower m-o-m by 70 tb/d to average 4.23 mb/d. In June, output from Canada’s oil sands increased by 0.43 mb/d to settle at 2.41 mb/d, driven by a 90 tb/d y-o-y increase in Syncrude's joint-venture upgrader production. While August saw Canadian output remain flat m-o-m, production from Syncrude's 0.33 mb/d upgrader likely declined by 0.2 mb/d in September, due to an unplanned outage. This has been further compounded by reduced rates at Nexen’s Long Lake upgrader. It was forced to cut output by the Alberta Energy Regulator, following a safety inspection which revealed unsafe pipelines.
48
OPEC Monthly Oil Market Report – October 2015
World Oil Supply Canadian output in 2Q15 was lower y-o-y by 60 tb/d at 4.13 mb/d. Canadian oil output in 2Q15 unexpectedly saw a huge decline by 0.47 mb/d compared to 1Q15, which was not only due to the seasonal pattern, but also as a result of a wildfire in Alberta. It is worth mentioning that 8 projects out of 13 have started up in Canada so far in 2015. The implemented projects are: 1. 2. 3. 4. 5. 6. 7. 8.
Thick wood – Sunshine A1 Cold Lake Nabiye Foster Creek F Foster Creek G Rush Lake South White Rose extension project (offshore) Kearl Mining project with peak capacity 220 tb/d Surmont 2, in situ/SAGD project, capacity 118 tb/d
April 2015 April 2015 January 2015 April 2015 May 2015 Late June 2015 Mid-June 2015 September 2015
The other five major oil sands projects have been delayed or put on hold until prices recover. But enough projects are continuing to realize growth in 2016, albeit at a very modest level. In mid‐June, Imperial Oil announced the start‐up of the 110 tb/d expansion at its Kearl mining project, ahead of the original schedule that was slated for year‐end. If capacity is reached, the Kearl project is expected to produce 220 tb/d. In September, ConocoPhillips delivered first oil at its Surmont 2 in situ facility, the largest SAGD project undertaken to date. Production is expected to ramp up through 2017, adding approximately 118 tb/d to gross capacity. Canada’s overall rig count at the end of September decreased by 24 units to reach a total of 182. The number of active rigs in Alberta, the main state for oil sands production, also decreased by nine rigs to 120 units. Nevertheless, Alberta’s rigs were down by around 53% y-o-y, and Canada’s overall rig count fell by 205 rigs. On a quarterly basis, Canada’s oil supply in 2015 is expected to average 4.60 mb/d, 4.13 mb/d, 4.29 mb/d and 4.42 mb/d, respectively. Graph 5.8: Canada’s annual liquids production and annual growth mb/d
Percentage
5
4.48
4.36
4
8% 6%
3 4% 2 2%
1 0.05
0.12
2015 (forecast)
2016 (forecast)
0
0% 2009
2010
2011
Canada annual production
2012
2013
Y-o-y growth
2014
% change y-o-y growth (RHS)
Source: OPEC Secretariat.
Mexico’s liquids production in 2015 is expected to decline significantly by 0.21 mb/d to average 2.60 mb/d. Liquids output in 3Q15 increased by 10 tb/d to average 2.60 mb/d, but preliminary data shows that crude output increased by 40 tb/d to average 2.26 mb/d in the same quarter, although output in August and September declined
OPEC Monthly Oil Market Report – October 2015
49
World Oil Supply slightly compared to July. Mexico’s oil supply in 3Q15 declined by more than 6% (170 tb/d) over the same quarter a year earlier. Mexico also produced 0.33 mb/d of NGLs in 3Q15. Output from the Ku-Maloob-Zaap cluster (KMZ) fell below 0.77 mb/d, the lowest level since November 2008 and likely due to unplanned maintenance works. Y-o-y the figure was down by 85 tb/d, the steepest decline in over 10 years. Cantarell’s decline was back to 0.1 mb/d in August, while the y-o-y fall at Ligero Marino doubled m-o-m to 43 tb/d. Moreover, Pemex conducted works at the 49 tb/d light crude producing Samaria field in the second half of August, which offset the recovery in Chuc (where output returned to y-o-y growth for the first time in six months) and Ixtal’s output after the fire at the Abkatun oil platform in April. September has seen crude output remain broadly flat m-o-m, with the y-o-y decline easing to 0.12 mb/d, although KMZ’s production has recovered back to 0.84 mb/d. Mexican state oil company Pemex has received final approval from the country's energy ministry for its plans to seek farm-out partners for several oil fields. In late September, the CNH, Mexico's upstream regulator, assessed Pemex's requests to farm out stakes in 12 oil fields, which would be divided into seven contracts, and determined that the plans were in the national interest. The farm-outs would be Pemex's first since a 2013 constitutional reform ended its 76-year oil and gas monopoly. Pemex had originally planned to farm-out stakes in 10 upstream projects by the end of 2015, as part of the country's first post-reform bid round, which was launched last year. The first auction, for 14 shallow-water exploration blocks, took place in July 2015 and saw just two blocks awarded. The most recent one, for five other shallow water blocks with certified reserves, was held in late September and saw three blocks taken up. The farm-out auction is now generally expected sometime next year. Graph 5.9: Mexico’s annual liquids production and annual growth mb/d
Percentage
3.5
0%
3.0
2.60
2.50
-1%
2.5
-2%
2.0
-3%
1.5
-4%
1.0
-5%
0.5
-6%
0.0
-7%
-0.5 2009
2010
2011
Mexico annual production
2012
2013
Y-o-y growth
2014
-0.09 -0.21 2015 2016 (forecast) (forecast)
-8%
% change y-o-y growth (RHS)
Source: OPEC Secretariat.
On a quarterly basis, Mexico’s oil supply in 2015 is seen to average 2.65 mb/d, 2.55 mb/d, 2.60 mb/d and 2.58 mb/d, respectively.
50
OPEC Monthly Oil Market Report – October 2015
World Oil Supply
OECD Europe Total OECD Europe oil supply, which grew by 20 tb/d to average 3.60 mb/d in 2014, is expected to grow again this year – by 60 tb/d – to average 3.66 mb/d. This is due to the exploitation of new projects that have started up as well as from several field rampups in Norway and the UK. Moreover, supply growth in 2015 was revised up by 10 tb/d due to an upward revision in 3Q15 by 80 tb/d from the previous MOMR. OECD Europe in 2015 is estimated to see quarterly supply of 3.69 mb/d, 3.77 mb/d, 3.58 mb/d and 3.61 mb/d, respectively. Norway’s oil supply is expected to increase by 30 tb/d from the previous year to average 1.92 mb/d in 2015, unchanged from the previous MOMR. According to data from the Norwegian Petroleum Directorate (NPD), preliminary production figures for August show an average daily production of about 1.92 mb/d of oil, NGLs and condensate. Average daily liquid production in August entailed 1.56 mb/d of oil, 0.32 mb/d of NGL and 0.04 mb/d of condensate. Oil production was 4% above the level seen in August last year. NPD also mentioned that oil production was about 13.5% above its forecast for the month. On a quarterly basis, Norway’s oil production in 2015 is seen to average 1.93 mb/d, 1.93 mb/d, 1.90 mb/d and 1.93 mb/d, respectively. Graph 5.10: Norway’s annual liquids production and annual growth mb/d
Percentage
2.5
1.94
1.92
4% 2%
2.0
0%
1.5
-2%
1.0
-4%
0.5
0.03
0.02
0.0
-6% -8%
-0.5
-10% 2009
2010
2011
Norway annual production
2012
2013
Y-o-y growth
2014
2015 2016 (forecast) (forecast)
% change y-o-y growth (RHS)
Source: OPEC Secretariat.
The UK’s oil supply is estimated to grow by 50 tb/d to an average of 0.91 mb/d in 2015 y-o-y, unchanged from the previous MOMR. UK liquids production in August was pegged at 0.82 mb/d, a decrease of 0.1 m/d m-o-m, and partially due to reduced condensate output from the Britannia gas field and the fact the Elgin-Franklin field was shut for 10 days in early August. Preliminary estimates for 3Q15 show a drop of 0.13 mb/d compared to 2Q15, but nevertheless higher by 0.17 mb/d than in the same quarter last year. With lower maintenance at Buzzard than during last year, output remained higher y-o-y (+0.35 mb/d) for the fifth consecutive month. It is expected that September should see output rebound, with the Forties loading programme rising by 91 tb/d m-o-m to 0.44 mb/d. Output will also be supported by the return of the 8 tb/d Tern field in mid-August, which had been out of commission for maintenance since June. Meanwhile, planned works at Buzzard have been postponed from October to November, pushing October output to a two-year high. The Cladhan field—expected to produce around 17 boe/d—is slated to achieve first oil in October.
OPEC Monthly Oil Market Report – October 2015
51
World Oil Supply On a quarterly basis, UK oil output in 2015 is estimated to average 0.93 mb/d, 1.00 mb/d, 0.87 mb/d and 0.87 mb/d, respectively. Graph 5.11: UK annual liquids production and annual growth mb/d
Percentage
1.6 1.4 1.2 1.0 0.8 0.6 0.4 0.2 0.0 -0.2 -0.4
10% 0.91
0.91
5% 0% -5% -10%
0.05 0.00
-15% -20%
2009
2010
2011
UK annual production
2012
2013
Y-o-y growth
2014
2015 2016 (forecast) (forecast)
% change y-o-y growth (RHS)
Source: OPEC Secretariat.
OECD Asia Pacific OECD Asia Pacific’s oil supply is expected to decline by 50 tb/d in 2015, averaging 0.45 mb/d and unchanged from the previous month. On a quarterly basis, total OECD Asia Pacific oil supply in 2015 is expected to average 0.43 mb/d, 0.45 mb/d, 0.48 mb/d and 0.46 mb/d, respectively. Australia’s oil supply is slated to decline this year by 50 tb/d to average 0.37 mb/d. Crude oil and condensate output, according to national data, is likely to have increased by 10 tb/d in July to 0.35 mb/d, but output of NGLs was reported steady at 61 tb/d. Therefore, total liquids supply in July was pegged at 0.41 mb/d. According to the latest information from Australian Petroleum Statistics in July, crude oil and condensate production from six basins is declining. Total annual output of these six basins during 2010-14 declined from 161 mb to 120 mb.
Developing countries Total oil output from developing countries (DCs) will reach an average of 12.31 mb/d in 2015, an increase of 0.12 mb/d compared to growth of 0.21 mb/d in 2014 and an upward revision of 10 tb/d from the previous MOMR. On a quarterly basis, total oil supply in DCs is estimated to average 12.55 mb/d, 12.40 mb/d, 12.16 mb/d and 12.12 mb/d, respectively.
52
OPEC Monthly Oil Market Report – October 2015
World Oil Supply Graph 5.12: Developing countries’ quarterly production
Graph 5.13: Developing countries’ quarterly production, annual comparison
mb/d
mb/d
12.6
12.6
12.5
12.5 12.4
12.4
12.3 12.3
12.2
12.2
12.1
12.1
12.0
12.0
11.9
11.9
11.8 1Q
1Q13 2Q13 3Q13 4Q13 1Q14 2Q14 3Q14 4Q14 1Q15 2Q15 3Q15 4Q15 1Q16 2Q16 3Q16 4Q16
11.8
2Q 2013 2015
3Q
4Q 2014 2016
Other Asia Other Asia’s oil production is predicted to increase by 80 tb/d in 2015 to average 3.56 mb/d, an upward revision of 20 tb/d from the previous MOMR. Oil output in Malaysia, Thailand, Vietnam and Asia others is expected to grow by 0.11 mb/d, while production in India and Indonesia will decrease by 20 tb/d and 10 tb/d, respectively. Brunei’s output is expected to remain steady. On a quarterly basis, Other Asia’s oil supply in 2015 is estimated to stand at 3.62 mb/d, 3.61 mb/d, 3.53 mb/d and 3.50 mb/d, respectively.
Latin America Latin America’s oil supply is estimated to grow by 0.15 mb/d to average 5.15 mb/d in 2015, an upward revision of 10 tb/d from the previous MOMR. Latin America was the second-highest driver of growth in 2014 among all the non-OPEC regions. Brazil is the main driver of growth in 2015 by 0.18 mb/d, along with a small increase in Colombia, while oil production in other Latin American countries is expected to decline by 30 tb/d. On a quarterly basis, Latin America’s oil supply in 2015 is expected to stand at 5.23 mb/d, 5.16 mb/d, 5.11 mb/d and 5.11 mb/d, respectively. Brazil’s liquids supply is expected to average 3.04 mb/d in 2015, an increase of 0.18 mb/d over the previous year and unchanged from the previous MOMR. Brazilian crude oil and NGLs production in August rose m-o-m by 70 tb/d to 2.57 mb/d. Biofuels output in August was also steady at 0.53 mb/d. A record level of liquids output was pegged at 3.12 mb/d. The increase came from the ramp-up of the 0.15 mb/d FPSO Cidade de Itaguaí in the Lula field, whilst the return of platforms from maintenance also helped. In the year-to-August, production growth has averaged 0.27 mb/d, compared to 0.24 mb/d for all of 2014. On a quarterly basis, Brazil’s oil supply in 2015 is estimated to stand at 3.06 mb/d, 3.02 mb/d, 3.05 mb/d and 3.04 mb/d, respectively.
OPEC Monthly Oil Market Report – October 2015
53
World Oil Supply Graph 5.14: Brazil’s annual liquids production and annual growth mb/d
Percentage
3.5
12%
3.15
3.04
3.0
10%
2.5
8%
2.0
6%
1.5
4%
1.0 0.5
0.18
0.11
2% 0%
0.0 -0.5
-2% 2009
2010
2011
Brasil annual production
2012
2013
Y-o-y growth
2014
2015 2016 (forecast) (forecast)
% change y-o-y growth (RHS)
Source: OPEC Secretariat.
Middle East Middle East oil supply is estimated to decrease by 0.09 mb/d in 2015 from the previous year to average 1.25 mb/d, unchanged from the previous MOMR. The Middle East supply forecast is associated with a very high level of risk, mainly due to political factors, which could dramatically change the outlook in either direction. Oman’s oil production is expected to grow by 30 tb/d to average 0.98 mb/d, while Bahrain and Yemen are expected to see declines by 20 tb/d and 0.10 mb/d to average 0.21 mb/d and 0.04 mb/d, respectively in 2015. On a quarterly basis, Middle East oil supply in 2015 is seen to average 1.30 mb/d, 1.25 mb/d, 1.23 mb/d and 1.22 mb/d, respectively.
Africa Africa’s oil supply is projected to average 2.34 mb/d in 2015, a decline of 30 tb/d y-o-y and a downward revision of 30 tb/d from the previous MOMR. In 2015, oil production from Equatorial Guinea and the Sudans is expected to grow by 10 tb/d each to average 0.29 mb/d each. While Chad, Congo and Africa Others will see supply declines, other countries such as Egypt, Gabon and South Africa will show steady production in 2015. On a quarterly basis, Africa’s oil supply in 2015 is expected to average 2.40 mb/d, 2.38 mb/d, 2.29 mb/d and 2.29 mb/d, respectively.
FSU, other regions Total FSU oil supply is expected to increase by 40 tb/d in 2015 to an average of 13.59 mb/d, an upward revision of 10 tb/d from the previous month’s estimation. In 2015, oil production in Russia will increase, while output in Kazakhstan, Azerbaijan and FSU others is expected to decrease. On a quarterly basis, total FSU oil supply in 2015 is seen to average 13.68 mb/d, 13.59 mb/d, 13.54 mb/d and 13.55 mb/d, respectively.
54
OPEC Monthly Oil Market Report – October 2015
World Oil Supply
Russia Russian oil supply in 2015 is expected to grow by 70 tb/d to average 10.75 mb/d. September output rose to a post-Soviet record of 10.83 mb/d, up 60 tb/d m-o-m. Total production of crude and condensate increased by 60 tb/d to average 10.15 mb/d. The increase continues to be led by Gazprom, Bashneft and PSA operators, as their output is biased towards condensate. Graph 5.15: Russia’s annual liquids production and annual growth mb/d
Percentage
12
10.75
3.0%
10.69
10
2.5%
8
2.0% 1.5%
6
1.0%
4
0.5%
2
0.0%
0.07
0
-0.5%
-2 2009
2010
2011
Russia annual production
2012
2013
Y-o-y growth
2014
2015 (forecast)
-0.06 2016 (forecast)
-1.0%
% change y-o-y growth (RHS)
Source: OPEC Secretariat.
On a quarterly basis, Russia’s 2015 supply is expected to average 10.74 mb/d, 10.76 mb/d, 10.76 mb/d and 10.74, mb/d, respectively. Graph 5.16: Russia’s quarterly production
Graph 5.17: Russia’s quarterly production, annual comparison
mb/d
mb/d
10.8
10.8
10.7
10.7
10.6 10.6 10.5 10.5 10.4 1Q
1Q13 2Q13 3Q13 4Q13 1Q14 2Q14 3Q14 4Q14 1Q15 2Q15 3Q15 4Q15 1Q16 2Q16 3Q16 4Q16
10.4
2Q 2013 2015
3Q
4Q 2014 2016
Caspian Kazakhstan’s oil supply is expected to decrease by 20 tb/d over the previous year to average 1.60 mb/d in 2015, a downward revision of 10 tb/d from the previous MOMR. Kazakhstan’s August output declined m-o-m by a steep 86 tb/d to 1.51 mb/d, the lowest level since October 2014. This was due to a 0.1 mb/d decline in Tengiz output. Preliminary supply data for 3Q15 indicates a decline by 50 tb/d to 1.55 mb/d. Lower investment in mature onshore fields such as Uzen and Emba is weighing on the
OPEC Monthly Oil Market Report – October 2015
55
World Oil Supply country’s operations. Indeed, evidence suggests some smaller Kazakh producers have already shut in wells due to poor economics. Azeri oil supply is anticipated to decline by 10 tb/d to average 0.86 mb/d in 2015, unchanged from the previous MOMR and indicating steady production in the year. Azerbaijan’s August output fell by 20 tb/d m-o-m to 0.84 mb/d, as the country’s largest field, BP’s ACG complex, entered decline. Planned maintenance at the Chirag platform for 20 days starting 20-22 October, will also weigh in 4Q15.
China China’s supply is expected to grow by 60 tb/d over the previous year to average 4.35 mb/d in 2015, unchanged from the previous month due to strong output in 2Q15, continued in 3Q15. Oil output increased by 10 tb/d m-o-m to average 4.37 mb/d in August, although China’s output recorded a high in June at 4.45 mb/d. The increase has been led entirely by CNOOC’s new field startups, with the company’s output up by 19% y-o-y in 1H15. On a quarterly basis, China’s supply in 2015 is estimated to average 4.33 mb/d, 4.39 mb/d, 4.34 mb/d and 4.34 mb/d, respectively. Graph 5.18: China’s annual liquids production and annual growth mb/d 5.0 4.5 4.0 3.5 3.0 2.5 2.0 1.5 1.0 0.5 0.0 -0.5 2009
2010
2011
China annual production
2012
2013
Y-o-y growth
2014
Percentage 8% 4.36 4.35 7% 6% 5% 4% 3% 2% 1% 0.06 0.02 0% -1% 2015 2016 (forecast) (forecast)
% change y-o-y growth (RHS)
Source: OPEC Secretariat.
Forecast for 2016 Non-OPEC supply Non-OPEC oil supply in 2016 is expected to contract by 0.13 mb/d over the current year to average 57.11 mb/d. This expectation was revised down by 0.29 mb/d from the previous MOMR due to the carry-over of the downward revisions of US and Canada output in 2015 to the next year. The revision is also due to minor downward revisions in some countries’ production forecasts, due to cancellation or postponement of future projects. The weak growth trend estimated for 2015 is expected to persist, leading to a contraction in 2016. The forecast contraction is supported by declines from the OECD at -0.04 mb/d and the FSU at -0.16 mb/d. On a regional basis, OECD Americas, OECD Europe, the Middle East and Africa are each expected to decline in 2016 by 0.03 mb/d, while and FSU’s production will decline by 0.16 mb/d. The other regions – OECD Asia Pacific, Other Asia, Latin America and
56
OPEC Monthly Oil Market Report – October 2015
World Oil Supply China – are expected to be the main contributors of non-OPEC incremental growth with 0.02 mb/d, 0.06 mb/d, 0.04 mb/d and 0.02 mb/d, respectively. On a quarterly basis, non-OPEC oil supply in 2016 is projected to stand at 56.99 mb/d, 56.87 mb/d, 56.94 mb/d and 57.64 mb/d, respectively. The forecast for non-OPEC supply in 2016 is associated with a high level of risk. According to a Barclays report, global upstream spending is now expected to decline by 20% in 2015, followed by another 3-8% decline in 2016 according to preliminary estimates, which would be the first time since 1986/87 that consecutive annual declines in spending were recorded. Barclays notes that previously, after almost every year that saw a decline, spending increased by more than 10% the following year. This seems no longer to be the case. Barclays believes North American spending is expected to decline by 35% in 2015, with 2016 down by a preliminary 10-15%. With regard to international spending, Barclays estimates a decline in 2015 of 14%, and preliminary 2016 down by 0-5%. From a regional perspective, Middle East spending (+6%) is expected to be the only area of growth, while Latin America is expected to decline by 9% and all other regions (Russia/Asia/Africa/Europe) are slated to fall by 15-20%. Offshore spending is expected to decline 20-25% in 2016, driven by day rate reductions, contract cancellations and delayed deliveries for rigs. IOCs represent around 30% of contracted offshore rigs and Barclays expects IOC spending internationally will be down by 18% in 2015 and likely down by a similar amount in 2016. Table 5.3: Non-OPEC oil supply in 2016, mb/d
Americas of which US Europe Asia Pacific Total OECD
2015 20.56 13.60 3.66 0.45 24.68
1Q16 20.41 13.40 3.69 0.46 24.56
2Q16 20.45 13.50 3.60 0.48 24.53
3Q16 20.50 13.53 3.54 0.48 24.53
4Q16 20.76 13.71 3.72 0.46 24.94
2016 20.53 13.54 3.64 0.47 24.64
Change 16/15 -0.03 -0.06 -0.03 0.02 -0.04
Other Asia Latin America Middle East Africa Total DCs
3.56 5.15 1.25 2.34 12.31
3.56 5.10 1.24 2.31 12.21
3.60 5.13 1.23 2.31 12.28
3.65 5.21 1.22 2.30 12.38
3.69 5.32 1.22 2.28 12.50
3.63 5.19 1.23 2.30 12.34
0.06 0.04 -0.03 -0.03 0.04
FSU of which Russia Other Europe China Total "Other regions" Total Non-OPEC production Processing gains
13.59 10.75 0.13 4.35 18.07 55.05 2.19
13.55 10.73 0.13 4.34 18.02 54.79 2.20
13.39 10.65 0.13 4.35 17.87 54.68 2.20
13.34 10.64 0.13 4.36 17.84 54.74 2.20
13.46 10.73 0.13 4.41 18.00 55.44 2.20
13.43 10.69 0.13 4.36 17.93 54.91 2.20
-0.16 -0.06 0.00 0.02 -0.14 -0.14 0.01
Total non-OPEC supply Previous estimate Revision
57.24 57.43 -0.19
56.99 57.45 -0.46
56.87 57.28 -0.40
56.94 57.42 -0.48
57.64 58.20 -0.56
57.11 57.59 -0.48
-0.13 0.16 -0.29
OPEC Monthly Oil Market Report – October 2015
57
World Oil Supply
Revisions to the 2016 forecast Oil supply growth forecasts in the OECD region were revised down by 0.34 mb/d to -0.04 mb/d in 2016, compared to a month ago. The US was revised down by 0.28 mb/d to -0.06 mb/d due to expected accelerated declines in 2H15 which are carried over to 2016. DCs’ growth forecasts have also been changed, but in the reverse direction – revised up by 30 tb/d to 0.04 mb/d. Actually, DCs’ expected growth will offset the OECD’s declines in 2016. As a result, 2016 oil supply will contract due to FSU oil supply declines by 0.16 mb/d, which will be partially compensated by China and higher processing gains to reach -0.13 mb/d. On a quarterly basis, all quarters were revised down by 0.46 mb/d, 0.40 mb/d, 0.48 mb/d and 0.56 mb/d, respectively.
OECD Total OECD oil supply in 2016 is expected to decline by 0.04 mb/d to average 24.64 mb/d, revised down in absolute supply by 0.52 mb/d as well as in growth by 0.34 mb/d from the previous MOMR. The y-o-y decline in the OECD in 2016 is expected to come from OECD Americas by 30 tb/d and OECD Europe by 30 tb/d, while OECD Asia Pacific is expected to grow by 20 tb/d compared to the previous year. On a quarterly basis, total OECD supply in 2016 is estimated to average 24.56 mb/d, 24.53 mb/d, 24.53mb/d and 24.94 mb/d, respectively.
OECD Americas OECD Americas oil supply in 2016 is estimated to average 20.53 mb/d, showing a decline of 30 tb/d y-o-y and representing a downward revision of 0.33 mb/d from the previous month’s report. The US and Mexico are both expected to see declines, while Canada’s supply is forecast to grow by 0.12 mb/d. On a quarterly basis, OECD Americas oil supply in 2016 is expected to average 20.41 mb/d, 20.45 mb/d, 20.50 mb/d and 20.76 mb/d, respectively.
US US total oil supply is anticipated to decline by 60 tb/d to average 13.54 mb/d in 2016, representing a downward revision of 0.28 mb/d from the previous MOMR. US liquids production for 2016, based on 2015 output assumptions, is shown in the following table and graph. Moreover, according to US field development and new projects’ startups in 2016, around 0.47 mb/d of added volume is expected to come on-stream in the next year. Table 5.4: US liquids production breakdown in 2015 and 2016, tb/d Production type Tight crude Gulf of Mexico crude Other crude Unconventional NGL Other NGL Biofuels + Other liquids US total supply (excluding processing gains)
2014
2015*
Change 2015/14
2016*
Change 2015/16
3,972 1,397 3,345 1,594 1,420 1,238
4,270 1,590 3,310 1,760 1,430 1,238
298 193 -35 166 10 0
4,170 1,680 3,220 1,790 1,450 1,228
-100 90 -90 30 20 -10
12,966
13,598
632
13,538
-60
Note: * = Forecast. Source: US Department of Energy.
58
OPEC Monthly Oil Market Report – October 2015
World Oil Supply The breakdown indicates that the main component of US oil output – tight crude – will decline from the last estimated growth of around 0.30 mb/d in 2015 to contract by 0.10 mb/d in 2016, affected by the low oil price environment. It is also expected that out of total new planned oil production capacity from six new projects expected to come on-stream in 2016 in the Gulf of Mexico, only 90 tb/d will be added to GoM’s output in the next year. Production of NGLs from unconventional sources of tight formations and also conventional NGLs are expected to grow by 30 tb/d and 20 tb/d, respectively. On a quarterly basis, total US supply in 2016 is estimated to average 13.40 mb/d, 13.50 mb/d, 13.53 mb/d and 13.71 mb/d, respectively. Graph 5.19: Trend of US oil production’s components in 2005-2016 tb/d 15,000 12,500 10,000 7,500 5,000 2,500 0 2005
2006
2007
2008
2009
2010
2011
2012
2013
2014
2015* 2016**
Tight crude
Gulf of Mexico crude
Other crudes
Unconventional NGL
Other NGL
Biofuels + Other liquids
Note: * = Estimate and ** = Forecast. Source: US Department of Energy and OPEC analysis.
Canada and Mexico Oil supply in Canada is expected to grow by 0.12 mb/d in 2016 to average 4.48 mb/d y-o-y, a downward revision of 50 tb/d from the previous month and partially due to higher expected declines in conventional output and uncertainties over the materialization of new projects. It is expected that around 0.2 mb/d from mostly projects’ ramp-ups, new oil sands production from the 28 tb/d Mackay River phase 1 and some other small projects such as Foster Creek phase G, Edam East and West, Vawm and Jackfish that will come onstream in 2016. On a quarterly basis, total Canadian oil supply on 2016 is estimated to average 4.45 mb/d, 4.44 mb/d, 4.47 mb/d and 4.57 mb/d, respectively. Mexican oil production in 2016 is expected to decline at a slower pace of 90 tb/d to average 2.50 mb/d, an upward revision of 10 tb/d from the previous MOMR. On a quarterly basis, total Mexican oil supply in 2016 is estimated to average 2.55 mb/d, 2.50 mb/d, 2.50 mb/d and 2.47 mb/d, respectively.
OECD Europe Total OECD Europe oil supply is expected to decline by 30 tb/d to average 3.64 mb/d in 2016, a downward revision of 10 tb/d from the previous MOMR and mainly due to the downward revision in Other OECD Europe’s future output. OECD Europe is estimated to see quarterly oil supply in 2016 of 3.69 mb/d, 3.60 mb/d, 3.54 mb/d and 3.72 mb/d, respectively.
OPEC Monthly Oil Market Report – October 2015
59
World Oil Supply Norway’s oil supply is expected to grow by 20 tb/d from the previous year to average 1.94 mb/d in 2016, unchanged from the previous MOMR. It is expected that around 0.24 mb/d will be added to Norway’s 2016 production through mostly project ramp-ups, for example from Gudrun, Aasgard LP, Valemo, the infill drilling project of Troll, Goliat, Knarr and other small projects, plus the new project of Edward Grieg, adding 40 tb/d. On a quarterly basis, total Norwegian oil supply in 2016 is estimated to average 1.96 mb/d, 1.93 mb/d, 1.90 mb/d and 1.96 mb/d, respectively. The UK’s oil production in 2016 is expected to remain flat to average 0.91 mb/d, unchanged from the previous MOMR. It is expected that around 0.15 mb/d of new volume will be added from oil field ramp-ups as well as from new small production sites such as Cygnus, Alder, Stella, Cayley, Shaw, Barra, Morrone, Ythan and Aviat as they come on-stream. On a quarterly basis, total UK oil supply in 2016 is estimated to average 0.92 mb/d, 0.87 mb/d, 0.86 mb/d and 0.99 mb/d, respectively.
OECD Asia Pacific OECD Asia Pacific’s oil supply is expected to grow by 20 tb/d in 2016 to average 0.47 mb/d, unchanged from the previous month’s forecast. Australia’s oil supply will grow by 40 tb/d to average 0.41 mb/d. On a quarterly basis, total OECD Asia Pacific oil supply in 2016 is estimated to average 0.46 mb/d, 0.48 mb/d, 0.48 mb/d and 0.46 mb/d, respectively.
Developing countries Total DCs’ oil output will grow by 40 tb/d to average 12.34 mb/d in 2016, indicating an upward revision of 30 tb/d, mainly due to the upward revision in African countries’ production in the year. On a quarterly basis, total DCs’ oil supply in 2016 is estimated to average 12.21 mb/d, 12.28 mb/d, 12.38 mb/d and 12.50 mb/d, respectively.
Other Asia Other Asia’s oil production is predicted to increase by 60 tb/d in 2016 to average 3.63 mb/d with growth revised up by 10 tb/d from the previous MOMR. Oil output in Malaysia, Indonesia and Asia others is expected to increase, while production in Vietnam and Brunei will decline. Oil production in India and Thailand will be stagnant in the year. On a quarterly basis, Other Asia’s oil supply in 2016 is expected to stand at 3.56 mb/d, 3.60 mb/d, 3.65 mb/d and 3.69 mb/d, respectively.
60
OPEC Monthly Oil Market Report – October 2015
World Oil Supply
Latin America Latin America’s oil supply is estimated to grow by 40 tb/d to average 5.19 mb/d in 2016, unchanged from the previous MOMR. Latin America has been the secondhighest driver of growth in recent years among all non-OPEC regions, but due to few Brazilian projects coming online in 2016, remarkable growth is not foreseen. Despite this, Brazil is still the main driver of growth in this region in 2016, while oil production in other Latin American countries is expected to decline. On a quarterly basis, Latin America’s oil supply in 2016 is expected to stand at 5.10 mb/d, 5.13 mb/d, 5.21 mb/d and 5.32 mb/d, respectively. The pace of growth in Brazil is expected to slow substantially in 2016 to 0.11 mb/d to average 3.15 mb/d as the pullback in investment in the mature Campos basin by Petrobras weighs along with an already high base. In fact, some of the largest fields in the Campos are already registering steep declines. For example, the Marlin field, which produced 0.24 mb/d in 2014, has declined by more than 30% this year (partly maintenance-related). Nineteen new production units will be installed in the Santos Basin pre-salt area by the end of 2018. Between January 2013 and March 2014 alone, Petrobras made 49 new discoveries, including 15 in pre-salt. Petrobras’ strong results in pre-salt exploration are due to its in-depth knowledge and technological excellence in ultra-deep water exploration. Brazil’s biofuel production is expected to grow by only 20 tb/d in 2016, although the average production in 2015 will reach 0.58 mb/d, indicating 40 tb/d growth. On a quarterly basis, oil supply in Brazil in 2016 is expected to stand at 3.05 mb/d, 3.09mb/d, 3.20 mb/d and 3.27 mb/d, respectively.
Middle East Middle East oil supply is estimated to decrease by 0.03 mb/d in 2016 from the previous year to average 1.23 mb/d, unchanged from the previous MOMR. There is no expectation for growth or decline in oil supply in Bahrain, Oman and Syria, while oil output in Yemen is expected to decline to a negligible level of 10 tb/d in 2016. Moreover, the Middle East supply forecast is associated with a very high level of risk, mainly due to political factors, which could dramatically change the outlook in either direction. On a quarterly basis, Middle East oil supply in 2016 is seen to average 1.24 mb/d, 1.23 mb/d, 1.22 mb/d and 1.22 mb/d, respectively.
Africa Africa’s oil supply is projected to decline by 30 tb/d to average 2.30 mb/d in 2016 y-o-y, an upward revision of 20 tb/d from the previous MOMR. Oil production in Congo and Africa other is expected to grow, while others are forecast to decline, with the exception of South Africa, which should remain steady. On a quarterly basis, Africa’s oil supply in 2016 is forecast to average 2.31 mb/d, 2.31 mb/d, 2.30 mb/d and 2.28 mb/d, respectively.
OPEC Monthly Oil Market Report – October 2015
61
World Oil Supply
FSU and other regions Total FSU oil supply is expected to decline by 0.16 mb/d in 2016 to average 13.43 mb/d, an upward revision of 60 tb/d from the previous month’s estimation and mainly due to an upward revision to Russian output in 2016. Oil production in Russia, Kazakhstan, Azerbaijan and FSU others will decrease in 2016. On a quarterly basis, total FSU oil supply in 2016 is seen to average 13.55 mb/d, 13.39 mb/d, 13.34 mb/d and 13.46 mb/d, respectively. Russian oil supply is expected to decrease by 0.06 mb/d to average 10.69 mb/d in 2016, with growth revised up by 50 tb/d from the previous MOMR. On a quarterly basis, total oil supply from Russia in 2016 is seen to average 10.73 mb/d, 10.65 mb/d, 10.64 mb/d and 10.73 mb/d, respectively. Oil production in Kazakhstan will decline by 30 tb/d to average 1.57 mb/d in 2016, an upward revision of 10 tb/d from the previous month’s forecast. Different sources have said that the giant Kashagan project was unlikely to start production before mid-2017. Azerbaijan’s oil production is predicted to decline by 40 tb/d to average 0.82 mb/d in 2016 without any changes in the forecast over the previous MOMR. Lower prices are likely to accelerate declines in Azeri production in 2016 compared to 2015. Other Europe’s oil supply is estimated to remain flat from 2012 to average 0.14 mb/d and continue at this level in 2016.
China China’s oil supply is expected to grow by 20 tb/d over the previous year to average 4.36 mb/d in 2016. Expected growth was revised down by 40 tb/d from the previous month. With sharp capex cutbacks, particularly by Sinopec and PetroChina, output is set to decline in 2016. On a quarterly basis, total oil supply from China in 2016 is seen to average 4.34 mb/d, 4.35 mb/d, 4.36 mb/d and 4.41 mb/d, respectively.
OPEC NGLs and non-conventional oils Output of OPEC natural gas liquids (NGLs) and non-conventional liquids is estimated to average 6.01 mb/d in 2015, representing growth of 0.19 mb/d over the previous year. In 2016, production of OPEC NGLs and non-conventional liquids is projected to average 6.18 mb/d, an increase of 0.17 mb/d over 2015. There are no changes in the 2015 estimation and 2016 predictions for OPEC NGLs and non-conventional liquids compared to the previous MOMR. Table 5.5: OPEC NGLs + non-conventional oils, 2013-2016
Total OPEC
62
2013 2014 5.65 5.83
Change 14/13 0.18
1Q15 5.86
2Q15 5.94
3Q15 6.13
4Q15 2015 6.13 6.01
Change Change 16/15 15/14 2016 0.19 6.18 0.17
OPEC Monthly Oil Market Report – October 2015
World Oil Supply
OPEC crude oil production According to secondary sources, total OPEC crude oil production increased by 0.11 mb/d to average 31.57 mb/d in September. Crude oil output increased mostly in Iraq, Nigeria and UAE, while production in Saudi Arabia showed the largest drop of 48 tb/d. According to secondary sources, September OPEC crude oil production, not including Iraq, stood at 27.43 mb/d, an increase by 29 tb/d over the previous month. Table 5.6: OPEC crude oil production based on secondary sources, tb/d Algeria Angola Ecuador Iran, I.R. Iraq Kuwait Libya Nigeria Qatar Saudi Arabia UAE Venezuela Total OPEC OPEC excl. Iraq
2013 1,159 1,738 516 2,673 3,037 2,822 928 1,912 732 9,586 2,741 2,389
2014 1,151 1,660 542 2,766 3,265 2,774 473 1,911 716 9,683 2,761 2,373
1Q15 2Q15 3Q15 Jul 15 Aug 15 Sep 15 1,112 1,107 1,108 1,100 1,114 1,112 1,746 1,716 1,757 1,770 1,740 1,762 551 546 543 541 545 542 2,779 2,828 2,855 2,853 2,859 2,853 3,454 3,868 4,118 4,148 4,062 4,143 2,748 2,726 2,718 2,702 2,724 2,728 382 450 380 394 375 371 1,886 1,816 1,854 1,797 1,865 1,900 679 667 659 651 661 667 9,809 10,252 10,277 10,332 10,273 10,225 2,817 2,838 2,886 2,880 2,877 2,902 2,367 2,376 2,369 2,371 2,367 2,369
Sep/Aug -2.0 22.0 -3.6 -6.0 80.1 4.1 -4.1 34.6 6.0 -48.2 24.3 2.0
30,231 30,075 30,330 31,190 31,524 31,540 31,462 31,571 27,194 26,809 26,877 27,322 27,406 27,391 27,400 27,429
109.2 29.1
Totals may not add up due to independent rounding.
Table 5.7: OPEC crude oil production based on direct communication, tb/d Algeria Angola Ecuador Iran, I.R. Iraq Kuwait Libya Nigeria Qatar Saudi Arabia UAE Venezuela Total OPEC OPEC excl. Iraq
2013 1,203 1,701 526 3,576 2,980 2,922 993 1,754 724 9,637 2,797 2,786
2014 1,193 1,654 557 3,117 3,110 2,867 480 1,807 709 9,713 2,794 2,683
1Q15 2Q15 3Q15 Jul 15 Aug 15 Sep 15 1,141 1,147 1,159 1,160 1,153 1,163 1,766 1,784 .. 1,797 1,729 .. 550 544 538 538 537 539 3,017 3,103 3,170 3,130 3,180 3,200 3,064 3,351 3,744 3,718 3,760 3,755 2,850 2,838 2,870 2,820 2,890 2,900 411 .. .. .. .. .. 1,762 1,622 1,793 1,776 1,746 1,857 687 647 640 613 643 663 9,878 10,401 10,285 10,361 10,265 10,226 2,948 2,973 3,030 3,061 3,027 3,002 2,722 2,683 2,645 2,659 2,647 2,630
31,599 30,682 30,793 28,619 27,572 27,729
.. ..
.. ..
.. ..
.. ..
.. ..
Sep/Aug 10.0 .. 1.9 20.0 -5.0 10.0 .. 111.0 19.9 -38.9 -25.0 -16.1 .. ..
Totals may not add up due to independent rounding. .. Not availab le.
OPEC Monthly Oil Market Report – October 2015
63
World Oil Supply
World oil supply Preliminary data indicates that global oil supply decreased by 0.34 mb/d to average 94.16 mb/d in September compared to the previous month. The decline was due to a drop in non-OPEC supply by 0.44 mb/d. The share of OPEC crude oil at 33.5% of total global production increased by 0.2% in September, compared to a month earlier. Estimates are based on preliminary data for non-OPEC supply and OPEC NGLS, while OPEC crude production is reported according to secondary sources. Graph 5.20: OPEC and world oil supply mb/d 32
mb/d 96
OPEC crude production (LHS)
64
Sep 15
Aug 15
Jul 15
Jun 15
May 15
Apr 15
Mar 15
Feb 15
Jan 15
Dec 14
Nov 14
89
Oct 14
25
Sep 14
90
Jul 14
26
Aug 14
91
Jun 14
27
May 14
92
Apr 14
28
Mar 14
93
Feb 14
29
Jan 14
94
Dec 13
30
Nov 13
95
Oct 13
31
World supply (RHS)
OPEC Monthly Oil Market Report – October 2015
Product Markets and Refinery Operations
Product Markets and Refinery Operations Product markets in the Atlantic Basin weakened during September due to a sharp drop in the gasoline crack spread following the end of the US driving season. This, along with increasing inventories, caused refinery margins to fall within the region. Meanwhile, Asian margins strengthened on the back of tightening sentiment fuelled by the onset of the refinery maintenance season in the region and the downward correction seen in Dubai crude prices. Graph 6.1: Refinery margins, 2014-2015 US$/b
US$/b
WTI (US Gulf) Dubai (Singapore)
Arab Heavy (US Gulf) LLS (US Gulf)
Sep 15
Aug 15
-5
Jul 15
-5
Jun 15
0
May 15
0
Apr 15
5
Mar 15
5
Feb 15
10
Jan 15
10
Dec 14
15
Nov 14
15
Oct 14
20
Sep 14
20
Brent (Rotterdam)
US product markets had been receiving strong support in previous months from the healthy performance of US gasoline demand. However, with the end of the driving season in the US, the typical seasonal slowdown in gasoline demand has started to exert pressure on the gasoline market in the Atlantic Basin. The sharp loss suffered by the gasoline crack spread, along with the weakening seen across the barrel caused refinery margins to plunge to hit the lowest level seen this year. On the US Gulf Coast (USGC), the refinery margin for Light Louisiana Sweet (LLS) crude averaged $6.8/b in September, losing $4.7, while the margin for WTI crude lost almost $6, to average around $4/b. Product markets in Europe exhibited a weak performance in September, due to pressure coming from the supply side with increasing inflows to the region amid a lack of export opportunities impacting the top and bottom of the barrel and causing refinery margins to fall. The refinery margin for Brent crude in Northwest Europe averaged $6/b in September, losing more than $2 versus the previous month. Asian product markets continued showing a sharp recovery during September on the back of improvements seen in the crack spreads across the barrel, as product margins were supported by the tightening sentiment fuelled by the onset of the maintenance season in the region, easing the concern about product oversupply. Refinery margins in Singapore exhibited a sharp recovery of more than $3 to average $5.9/b in September. The downward correction in the Dubai crude prices played the main role in this recovery.
OPEC Monthly Oil Market Report – October 2015
65
Product Markets and Refinery Operations
Refinery operations Refinery utilization rates in the US continued at high level in September, despite plentiful domestic products and the end of the driving season. Refinery utilization averaged around 91% in September, corresponding to 16.2 mb/d, a level 500 tb/d lower than a month earlier, impacted by the maintenance season, mainly in US Gulf Coast (USGC) and the mid-continent. High refinery runs have led to the continuing accumulation of product inventories in the Atlantic Basin and refiners could cut crude runs in coming weeks, responding to weakening refining margins and high inventories. Graph 6.2: Refinery utilisation rates, 2014-2015
US
EU-16
Japan
Sep 15
Aug 15
60
Jul 15
60
Jun 15
70
May 15
70
Apr 15
80
Mar 15
80
Feb 15
90
Jan 15
90
Dec 14
100
Nov 14
100
Oct 14
%
Sep 14
%
Singapore
European refinery runs averaged around 88.9% of refining capacity in August, corresponding to a throughput of 10.4 mb/d, down by 100 tb/d from the previous month, and at a similar level to the same month a year ago. European refineries have been increasing throughputs in recent months, however a correction in runs could be expected, given the record-high inventories amid a lack of gasoline exports and the weakening in the refinery margins during the last weeks. Asian refinery utilization has been mixed with some countries like South Korea and Japan cutting the runs due to lower margins, while Chinese and Indian refineries have been increasing their throughputs. Chinese refinery throughputs averaged around 10.5 mb/d during September, 200 tb/d higher than in July and Indian refineries increased their runs in preparation for the strong demand at the end of the monsoon season. Refinery runs in Singapore for August averaged around 83%, around 10 pp lower than in the previous month. Meanwhile, Japanese throughputs dropped to 82% of capacity in September, around 6 pp lower than in the previous month. With the onset of autumn maintenance peaking in October in the region, refinery runs should be impacted, which could help to balance the market, as high inventory levels in Singapore have been exerting pressure on the market.
US market US gasoline demand stood at around 9.1 mb/d in September, some 450 tb/d lower than the previous month and 240 tb/d higher than in the same month a year earlier. During the previous months, the healthy performance of US gasoline demand encouraged high refinery runs and maximizing gasoline production. However, with the end of the summer driving season, the gasoline crack spread has suffered a sharp loss of more than 25$/b since July.
66
OPEC Monthly Oil Market Report – October 2015
Product Markets and Refinery Operations During September, the gasoline crack weakened on the combination of softer seasonal demand, the switch to cheaper winter RVP grade and high supply, which has caused inventories to continue to rise to reach levels well above the five-year average. The gasoline crack spread suffered a sharp loss of more than $17 to average $20/b in September, the lowest level seen since January this year. Graph 6.3: US Gulf crack spread vs. WTI, 2014-2015 US$/b
US$/b
60
60
50
50
40
40
30
30
20
20
10
10
0
0
Prem.Gasoline Unl.93
Jet/Kero
Gasoil/Diesel (0.05%S)
Sep 15
Aug 15
Jul 15
Jun 15
May 15
Apr 15
Mar 15
Feb 15
Jan 15
Dec 14
Nov 14
Oct 14
-10
Sep 14
-10
Fuel oil (180c)
Middle distillate demand stood at around 3.8 mb/d in September, around 80 tb/d higher than in the previous month and 150 tb/d lower than in the same month a year earlier. The middle distillate market continued to be pressured from the supply side by higher output seen in the previous months amid seasonally weaker domestic demand. Nevertheless, demand has started to show a slight improvement this month, on the back of the harvest period in the agricultural sector and some demand for heating oil stocking ahead of winter. Middle distillate inventories have continued their rising trend, building by around 1.7 mb during September, remaining above the five-year average. However, they have stopped rising since the mid of September and the anticipated lower production due to some refinery maintenance could reverse the upward trend in inventories. The USGC gasoil crack lost more than $2 versus the previous month to average around $13/b in September. With the winter season ahead, some early winter stock- building is expected, mainly in higher sulphur distillates in the US East Coast (USEC), which could provide some support to the market in coming weeks. At the bottom of the barrel, the fuel oil market continued to weaken in September, due to lower domestic demand, as the weaker gasoline has dented the fluid catalytic cracking (FCC) units’ margins, thus limiting demand for vacuum gasoil (VGO) within the region. Another bearish factor has been the ample regional availability and high inventory levels, causing the fuel oil crack on the US Gulf Coast (USGC) to lose more than $3 in September. Further losses were limited by some export opportunities to Panama.
OPEC Monthly Oil Market Report – October 2015
67
Product Markets and Refinery Operations
European market Product markets in Europe exhibited a weak performance in September, due to pressure from the supply side with increasing inflows to the region amid a lack of export opportunities, which caused inventories to be on the high side and made refinery margins fall. The gasoline market suffered sharp losses during September, due to pressure coming from the supply side as refineries have been running at high throughputs in the last months, which has led to a high level of gasoline inventories in the region. With the end of the summer driving season, requirements from the USEC have been falling since the beginning of September. Another bearish factor has been the reduction seen in the European exports to West Africa. These fewer export opportunities, along with European gasoline production rising with the higher refinery runs, has caused inventories to be on the high side and continued exerting pressure on European gasoline cracks. The gasoline crack spread against Brent lost more than $7 to average around $23/b in September. The light distillate naphtha crack retained the ground recovered last month, on the back of some arbitrage opportunities to Asia, however any uptick was limited by the onset of the cracker maintenance season in Europe, which is expected to reduce demand for naphtha in the petrochemical sector. Graph 6.4: Rotterdam crack spreads vs. Brent, 2014-2015 US$/b
US$/b
40
40
30
30
20
20
10
10
0
0
Prem.Gasoline Unl.98 ppm
Jet/Kero
Gasoil 10 ppm
Sep 15
Aug 15
Jul 15
Jun 15
May 15
Apr 15
Mar 15
Feb 15
Jan 15
Dec 14
-20
Nov 14
-20
Oct 14
-10
Sep 14
-10
Fuel oil (1.0%S)
The gasoil market continued to be pressured by the supply side, with gasoil inventories in Europe remaining high. However, the gasoil crack spread managed to keep the ground recovered in the previous month, on the back of strong demand reported from Germany. Low water levels on the Rhine limiting the barge movements temporarily fuelled tightening sentiment amid the onset of the maintenance season in the region and scheduled maintenance in Russian refineries, which cut ultra-light sulphur diesel (ULSD) exports to Europe. However, any potential uptick was offset by bearish sentiment fuelled by the ARA hub inventories rising to record highs amid Middle Eastern exports to Europe remaining steady and the expected increase in US exports and India to the region.
68
OPEC Monthly Oil Market Report – October 2015
Product Markets and Refinery Operations The gasoil crack spread against Brent crude at Rotterdam retained the ground recovered during the previous month to continue averaging around $14/b in September. At the bottom of the barrel, the fuel oil market continued weak due, to oversupply and limited arbitrage opportunities to Asia. Inventories in the ARA hub remained above average levels and continued exerting pressure on the market. Another bearish factor has been the increasing inflows over the region, mainly from Russia, despite the expected heavy maintenance there. The Northwest European fuel oil crack lost more than 2$ versus the previous month’s level to average around minus $13.7/b in September.
Asian market The Asian market continued showing a sharp recovery during September on the back of improvements seen in the crack spreads across the barrel. Product margins were supported by tightening sentiment fuelled by the onset of the maintenance season in the region, easing concerns about product oversupply. The fall in crude prices also played a role in this recovery. The Singapore gasoline crack recovered some ground during September, on the back of stronger regional demand, mainly from China and India. Additionally, the refinery maintenance season has started to weigh on local supplies, which allowed light distillates inventory levels in Singapore to drop around 10% during September, thus giving further support to the gasoline market. Any additional uptick was capped by expectations of lower requirements from the key regional gasoline importing country (Indonesia) with the startup of the Pertamina refinery units scheduled for October. The gasoline crack spread against Dubai crude in Singapore gained more than $2 versus the previous month, to average $16/b in September. The Singapore naphtha crack continued recovering ground in September, supported by stronger demand, with Taiwan’s petrochemical crackers hitting 90% of utilization. Another supporting factor was the expected decreasing inflows to the region. The naphtha crack spread recovered by around $3/b during September.
OPEC Monthly Oil Market Report – October 2015
69
Product Markets and Refinery Operations Graph 6.5: Singapore crack spread vs. Dubai, 2014-2015 US$/b
US$/b 30
30
20
20
10
10
0
0
Prem.Gasoline Unl.92
Jet/Kero
Gasoil 50 ppm
Sep 15
Aug 15
Jul 15
Jun 15
May 15
Apr 15
Mar 15
Feb 15
Jan 15
Dec 14
-20
Nov 14
-20
Oct 14
-10
Sep 14
-10
Fuel oil 180 CST
At the middle of the barrel, the gasoil market, which had been pressured by the oversupply environment in the region, has shown a recovery in September on the back of support from higher regional gasoil requirements amid tightening sentiment, fuelled by the onset of a heavy maintenance season. Despite Singapore inventories remaining on the high side, the expected stronger regional seasonal demand supported the gasoil market with stocking ahead of the winter season amid higher consumption seen in India with the end of the monsoon season. The gasoil crack spread in Singapore against Dubai gained more than $3 versus the previous month, to average around $15.6/b in September. In the Asian fuel oil market, fundamentals remained weak during September with continued pressure from plentiful supplies with Singapore’s inventories continuing to rise by almost 10%, amid expectations of higher inflows to the region with falling freight rates seen in the last weeks. However, despite the oversupply environment, the fuel oil cracks managed to improve somewhat during September, on the back of falling crude prices. The fuel oil crack spread in Singapore against Dubai recovered around $1 to average around minus $9/b in September. The downwards correction seen in the Dubai crude prices played the main role in that recovery.
70
OPEC Monthly Oil Market Report – October 2015
Product Markets and Refinery Operations Table 6.1: Refined product prices, US$/b Aug 15
Sep 15
Change Sep/Aug
50.54 80.68 68.70 59.06 57.98 35.68 35.18
52.10 65.82 57.62 59.14 58.30 34.90 34.49
1.57 -14.86 -11.08 0.09 0.31 -0.77 -0.69
109.97 127.77 117.33 120.93 118.71 98.09 89.56
62.32 83.75 72.73 68.24 67.70 47.22 44.43
44.38 77.52 60.18 60.66 35.24 35.80
45.30 70.72 61.35 61.41 33.88 34.41
0.92 -6.80 1.17 0.75 -1.37 -1.39
100.81 123.11 122.03 119.82 94.84 90.41
52.64 79.58 70.29 69.94 43.84 44.50
42.33 70.26 58.01 62.21 36.31 35.76
43.00 63.02 59.18 63.34 34.49 34.26
0.67 -7.24 1.17 1.13 -1.81 -1.50
98.52 118.64 119.32 120.51 95.90 90.19
49.65 73.64 67.46 71.67 45.43 44.29
45.76 66.00 61.95 57.08 60.04 39.04 37.36
46.81 65.24 61.59 58.99 60.94 37.37 36.58
1.04 -0.77 -0.37 1.92 0.90 -1.67 -0.78
102.64 118.57 115.70 119.22 121.01 94.73 92.93
54.30 72.57 69.37 68.16 69.70 49.80 48.07
US Gulf (Cargoes FOB): Naphtha* Premium gasoline (unleaded 93) Regular gasoline (unleaded 87) Jet/Kerosene Gasoil (0.2% S) Fuel oil (1.0% S) Fuel oil (3.0% S) Rotterdam (Barges FoB): Naphtha Premium gasoline (unleaded 98) Jet/Kerosene Gasoil/Diesel (10 ppm) Fuel oil (1.0% S) Fuel oil (3.5% S) Mediterranean (Cargoes FOB): Naphtha Premium gasoline** Jet/Kerosene Gasoil/Diesel** Fuel oil (1.0% S) Fuel oil (3.5% S) Singapore (Cargoes FOB): Naphtha Premium gasoline (unleaded 95) Regular gasoline (unleaded 92) Jet/Kerosene Gasoil/Diesel (50 ppm) Fuel oil (180 cst 2.0% S) (380 cst 3.5% S) Fuel oil
Year-to-date 2015 2014
* Barges. ** Cost, insurance and freight (CIF). Sources: Platts and Argus Media.
Table 6.2: Refinery operations in selected OECD countries Refinery throughput, mb/d
US France Germany Italy UK Euro-16 Japan
Jul 15 16.83 1.10 1.84 1.37 1.14 10.48 3.10
Aug 15 16.71 1.05 1.86 1.35 1.15 10.41 3.50
Sep 15 16.20 3.24
Change Sep/Aug -0.52 -0.25
Refinery utilization, % Jul 15 94.18 72.59 81.74 66.76 86.62 89.54 78.59
Aug 15 93.55 69.48 82.77 65.74 87.53 88.90 88.57
Change Sep 15 Sep/Aug 90.66 -2.89 82.16 -6.41
Sources: OPEC statistics, Argus, Euroilstock inventory report, IEA, EIA/DoE, METI and PAJ.
OPEC Monthly Oil Market Report – October 2015
71
Tanker Market
Tanker Market In general, improved sentiment was seen in September in the tanker market, more obviously for larger vessels. Tanker freight rates registered an increase of 27% and 5%, for VLCC and Suezmax classes, respectively, while Aframax closed the month with freight rates down from the previous month by 4%. The VLCC market – which experienced the highest gains of all reported classes in the dirty tanker segment in September – was volatile, as its activity levels fluctuated, thus leading to higher rates, mainly in the Middle East and West Africa. VLCC freight rates in September also benefitted from occasional tight tonnage supply and delays in Asian ports. Suezmax classes experienced lower gains as demand remained limited in light of sufficient tanker availability. Aframax freight rates dropped on average; this was driven by low tonnage demand in the Mediterranean. Clean spot freight rates were mostly weak in September, declining on the back of limited requirements and low market activity in both the East and West of Suez, despite exceptions in the West which somewhat offset losses on other routes.
Spot fixtures Chartering activity declined during September in all regions; total spot fixtures dropped by 4.9% m-o-m, while estimated OPEC spot fixtures fell by 9.7%, compared with the previous month, to average 11.03 mb/d. Losses in fixtures were seen in all reported regions, as those from the Middle East-to-West and outside the Middle East declined by 12.3% and 6.4%, respectively, while on the Middle East-to-East route they dropped by 10.5% from the previous month, to average 5.14 mb/d. Table 7.1: Tanker chartering, sailings and arrivals, mb/d Jul 15
Aug 15
Sep 15
Change Sep 15/Aug 15
Spot Chartering All areas OPEC Middle East/East Middle East/West Outside Middle East
16.71 11.93 5.49 2.92 3.52
16.67 12.20 5.74 2.77 3.69
15.86 11.03 5.14 2.43 3.45
-0.81 -1.18 -0.60 -0.34 -0.24
Sailings OPEC Middle East
23.90 17.49
24.12 17.50
23.64 17.04
-0.48 -0.46
Arrivals North America Europe Far East West Asia
10.11 12.30 8.22 4.84
9.95 12.40 8.66 4.65
9.95 12.32 8.36 4.85
-0.01 -0.08 -0.30 0.19
Sources: Oil Movements and Lloyd's Marine Intelligence Unit.
Sailings and arrivals OPEC sailings dropped by 0.48 mb/d in September from the previous month to stand at 23.64 mb/d. Likewise sailings from the Middle East dropped by 0.46 mb/d. In addition, arrivals showed a drop in September at all ports, with the exception of West Asian ports, which showed higher arrivals from a month before by 0.19 mb/d. Arrivals
72
OPEC Monthly Oil Market Report – October 2015
Tanker Market from North America, Europe and the Far East registered declines of 0.01 mb/d, 0.08 mb/d and 0.30 mb/d, respectively.
Spot freight rates VLCC At the beginning of the month, the VLCC market was seen as very volatile, following a drop in freight rates encountered the previous month. The market witnessed an upward correction in rates as those for Middle East loadings increased, as a result of higher activity in the region and in part because of storage requirements. Rates in the Middle East and West Africa continued their gradual increase, supported by a tighter tonnage list for second- and third-decade loadings. In addition, discharge delays in some Asian ports reduced the amount of available tonnage due to uncertain schedules. Steady fixture levels supported VLCC freight rates in September, which showed an increase of 40% for tankers operating on the Middle East-to-East route to stand at WS54 points. Middle East-to-West spot freight rates encountered lower gains, up by 24%, from the previous month, to average WS32 points. VLCC freight rates in West Africa edged up as well; they were influenced by freight rate movements in the Middle East. The end of the month witnessed steady tonnage demand for tankers trading on the West Africa-toEast route, with tankers operating at WS55 points in September, higher by 18% from the previous month, and 23% higher than the same month a year earlier. Graph 7.1: Monthly averages of crude oil spot freight rates Worldscale 180
Worldscale 180
Mediterranean/Northwest Europe (Aframax) Middle East/Far East (VLCC)
Sep 15
Aug 15
Jul 15
20
Jun 15
40
20
May 15
60
40
Apr 15
60
Mar 15
80
Feb 15
100
80
Jan 15
120
100
Dec 14
120
Nov 14
140
Oct 14
160
140
Sep 14
160
West Africa/USGC (Suezmax)
Suezmax Despite Suezmax demand being described as scarce at the beginning of September and the tonnage list being well-populated at that point, Suezmax activity increased ahead of the second half of the month, mainly in West Africa, and for the remaining third decade of September loadings. However, the effect was limited, as vessel supply remained largely sufficient for eastern destinations, despite tonnage requirements for fuel oil loadings and simultaneous firming of the VLCC market. On average, Suezmax spot freight rates on the West Africa-to-East route closed the month at the same level seen the previous month to stand at WS66 points. Freight rates registered for tankers operating on the West Africa-to-US Gulf route showed an increase of 10% from the month before to stand at WS55 points. Gains on the route came mainly on the back of several replacements undertaken with tight dates.
OPEC Monthly Oil Market Report – October 2015
73
Tanker Market Table 7.2: Spot tanker crude freight rates, Worldscale
Crude Middle East/East Middle East/West West Africa/East West Africa/US Gulf Coast Northwest Europe/US Gulf Coast Indonesia/East Caribbean/US East Coast Mediterranean/Mediterranean Mediterranean/Northwest Europe
Size 1,000 DWT
Jul 15
Aug 15
230-280 270-285 260 130-135 130-135 80-85 80-85 80-85 80-85
73 41 70 79 63 129 121 95 90
39 26 47 66 50 97 90 94 89
Change Sep 15 Sep 15/Aug 15 54 32 55 66 55 97 109 74 69
16 6 9 0 5 0 20 -21 -21
Sources: Galb raith’s tanker market report and Platts.
Aframax Aframax freight rates took a different direction on various reported routes in September. In general, Aframax freight rates dropped by 6% from the previous month, missing the enhanced price tendency of the bigger vessels. The North Sea and Baltic markets often remained flat, as even an occasional increase in activity was not enough to push rates up significantly, with vessel availability remaining in surplus. Scheduled maintenance in Primorsk added to the loss of cargoes there. Aframax market movements in the Mediterranean were slow in September and enquiries scarce; even during busier days of the month, freight rates stayed below levels seen a month earlier. Aframax freight rates on the Indonesia-to-East route showed no change from the previous month, averaging WS97 points, while spot freight rates for the Mediterraneanto-Mediterranean and Mediterranean-to-Northwest Europe routes dropped by 2% and 23%, respectively. On the other hand, Caribbean-to-US East Coast (USEC) spot freight rates showed the only gains seen in the market among all routes, standing at WS109 points, up by 22% compared with a month earlier and a 31% enhancement over the previous year. The route proved to be one of the busiest this month in combination with occasionally limited vessel offerings, which enabled ship owners to push for higher fixture rates.
Clean spot freight rates Clean tanker market sentiment saw mixed movement in September. On average, spot freight rates for vessels trading on East-of-Suez routes dropped by 20% from the previous month, while showing a slight gain of 2% in the West of Suez. September was a slow month for clean tankers of different sizes. The clean tanker market reported low activity in September, particularly in the East, where spot freight rates on the Middle East-to-East and Singapore-to-East routes dropped by 29% and 13% to stand at WS107 points and WS146 points, respectively, as a result of thin trade. West-of-Suez freight rates for medium-range (MR) vessels improved towards the month’s end as the market was revived by an influx of inquiries and thinner availability. This led to spot freight rate increases for vessels operating on the Mediterranean-to-Mediterranean and Mediterranean-to-Northwest Europe routes in September by 10% and 9% from the previous month, to average WS137 and WS147 points, respectively.
74
OPEC Monthly Oil Market Report – October 2015
Tanker Market Graph 7.2: Monthly average of clean spot freight rates Worldscale
Middle East/Far East
Northwest Europe/USEC
Sep 15
Aug 15
Jul 15
Jun 15
50
May 15
50
Apr 15
100
Mar 15
100
Feb 15
150
Jan 15
150
Dec 14
200
Nov 14
200
Oct 14
Worldscale 250
Sep 14
250
Mediterranean/Mediterranean
Table 7.3: Spot tanker product freight rates, Worldscale
Products Middle East/East Singapore/East Northwest Europe/US East Coast Mediterranean/Mediterranean Mediterranean/Northwest Europe
Size 1,000 DWT
Jul 15
Aug 15
30-35 30-35 33-37 30-35 30-35
165 149 177 203 213
150 167 129 124 134
Change Sep 15 Sep 15/Aug 15 107 146 110 137 147
-43 -21 -19 13 13
Sources: Galb raith’s tanker market report and Platts.
OPEC Monthly Oil Market Report – October 2015
75
Oil Trade
Oil Trade In September, preliminary data shows that US crude oil imports dropped to average 7.3 mb/d, down by 335 tb/d from last month and by 164 tb/d or 2% from last year. US product monthly imports declined in September from the month before by 380 tb/d to average 1.9 mb/d, while on an annual comparison, they went up by 215 tb/d or 13%. Japan’s crude oil imports increased in August by 60 tb/d or 2% to average 3.5 mb/d, the highest level seen in several months. Japan’s product imports dropped in August by a slight 13 tb/d to average 588 tb/d, reflecting a loss of 2% m-o-m while being stable from a year before. China’s crude imports dropped in August to the lowest level in three months, declining by 972 tb/d or 13% to average 6.3 mb/d. China’s product imports went down by 120 tb/d from a month ago, however they were still higher than last year’s level by 280 tb/d, averaging 1.2 mb/d in August. India’s crude imports in August dropped by 118 tb/d or 3% from the previous month to average 4 mb/d, yet on an annual basis, they registered a gain of 294 tb/d or 8%. Product imports in August rose by 73 tb/d from the previous month to average 703 tb/d.
US In September, preliminary data shows that US crude oil imports dropped to average 7.3 mb/d, down by 335 tb/d from last month and by 164 tb/d or 2% from last year. On a y-t-d basis, US crude imports in September were 59 tb/d lower. Graph 8.1: US imports of crude and petroleum products mb/d 2.5
mb/d 8.0 7.5 7.0 6.5 6.0 5.5 5.0 4.5
2.0 1.5 1.0 0.5
Others* Jet fuel/kerosene
Propane/propylene Fuel oil
Sep 15
Aug 15
Jul 15
Jun 15
May 15
Apr 15
Mar 15
Feb 15
Jan 15
Dec 14
Nov 14
Oct 14
Sep 14
0.0
Gasoline Crude (RHS)
*Others: Contains natural gas liquids, liquefied refinery gases (LRG's), other liquids and all finished petroleum products except gasoline, jet fuel/kerosene, fuel oil and propane/propylene.
US monthly product imports declined in September from the month before by 380 tb/d to average 1.9 mb/d, while on an annual comparison, they went up by 215 tb/d or 13%. Similarly, on a y-t-d comparison, product imports rose by 13%. In June, US product exports stayed flat at last month’s level of 3.8 mb/d, while on an annual comparison, they were higher than a year before by 192 tb/d or 5%. As a result, US total net imports dropped by around 680 tb/d to average 4.9 mb/d, and down by 283 tb/d or 5% form the level a year earlier. In July, the top two suppliers to the US maintained the same order as seen last month. Canada remained the premier crude supplier to the US, accounting for 41% of total US crude imports with a similar level of exports to the US as seen last month.
76
OPEC Monthly Oil Market Report – October 2015
Oil Trade Saudi Arabia, which remained the second largest supplier to the US in May, also had higher exports to the US by 96 tb/d. Venezuela came in as the third top supplier, accounting for 11% of total US crude imports as it increased its exports to the US by 78 tb/d or 11% from the previous month. Crude imports from OPEC Member Countries rose in July from the previous month, increasing by 44 tb/d or 2% and accounting for 37% of total US crude imports. US product imports from OPEC Member Countries were lower by 17 tb/d or 9% from the previous month and 59 tb/d or 25% from last year. As for the product supplier share, Canada and Russia maintained their positions as first and second suppliers to the US, accounting for 23% and 18%, respectively. Both Canada and Russia had lower product exports to the US in September by 107 tb/d and 83 tb/d, respectively. The UK came in as the third supplier to the US with exports increasing by 25 tb/d over a month earlier. Graph 8.2: US exports of crude and petroleum products tb/d 5,000
tb/d 600
4,000
500 400
3,000
300 2,000
200
1,000
100
Others* Jet fuel/kerosene
Propane/propylene Fuel oil
Sep 15
Aug 15
Jul 15
Jun 15
May 15
Apr 15
Mar 15
Feb 15
Jan 15
Dec 14
Nov 14
Oct 14
0
Sep 14
0
Gasoline Crude (RHS)
*Others: Contains natural gas liquids, liquefied refinery gases (LRG's), other liquids and all finished petroleum products except gasoline, jet fuel/kerosene, fuel oil and propane/propylene.
In July 2015, US crude imports from North America averaged 3 mb/d, making North America the top region for US crude imports, followed by Latin America, which stood at 2.4 mb/d in July and the Middle East, which came in as the third region with an average of 1.5 mb/d. Imports from Africa increased from last month to stand at 351 tb/d, while imports from Asia and FSU both had marginal increases from last month. Looking at crude imports by PADDs, in PADD-1, the highest crude imports to the East Coast were sourced from North America and Africa, which stood at 203 tb/d and 210 tb/d, respectively. Crude imports from Latin America to PADD-1 increased by 15% to average 178 tb/d, while imports to PADD-2 continued to be largely covered from North America, which stood at 1.9 mb/d, down by 26 tb/d from the previous month. PADD-2 imported only 58 tb/d from the Middle East in July. PADD-3 sourced their imports from Latin America, followed by the Middle East, however, exports from the Middle East were lower by 155 tb/d from the previous month to average 858 tb/d. PADD-4, as seen before, covered its total crude requirement from North America, averaging 279 tb/d in July, which was stable from the level seen last month. The West Coast’s largest imports originated from the Middle East, which exported 450 tb/d to PADD-5 in July, followed by Latin America, which exported 381 tb/d. Both regions showed lower exports to PADD-5 from the previous month by 4% and 6%, respectively.
OPEC Monthly Oil Market Report – October 2015
77
Oil Trade Table 8.1: US crude and product net imports, tb/d Jul 15 6,805 -2,261 4,544
Crude oil Total products Total crude and products
Aug 15 7,140 -1,509 5,631
Sep 15 6,840 -1,889 4,951
Change Sep 15/Aug 15 -300 -381 -681
Japan Japan’s crude oil imports increased in August to reach the highest level seen in several months, rising by 60 tb/d or 2% to average 3.5 mb/d. On a y-o-y comparison, crude imports rose from last year by 143 tb/d or 4%. Looking at the crude suppliers’ share, as seen in the previous month, Saudi Arabia, UAE and Qatar were the top suppliers to Japan in August. Saudi Arabia came in again as the first crude supplier to Japan, holding a share of 34% of total crude exports, up by 72 tb/d from a month before. UAE came in as the second largest supplier with a share of 25% of total crude exports. Qatar held the third position in August with a share of 10%. Volumes imported from UAE were lower than last month by 190 tb/d, while Qatar increased its exports to Japan by 122 tb/d from last month. Graph 8.3: Japan’s imports of crude and petroleum products tb/d
mb/d
1,200
5
1,000
4
800
3
600 2
400
Others*
LPG
Naphtha
Fuel oil
Aug 15
Jul 15
Jun 15
May 15
Apr 15
Mar 15
Feb 15
Jan 15
Dec 14
Nov 14
0
Oct 14
0
Sep 14
1
Aug 14
200
Crude oil
*Others: Contains gasoline, jet fuel, kerosene, gasoil, asphalt and paraffin wax.
On the other hand, product imports dropped in August by a slight 13 tb/d to average 588 tb/d, reflecting a loss of 2% m-o-m while remaining stable from a year before. In August, Japan’s domestic oil product sales rose by 3.1% from a year earlier. Japan’s product exports in August saw an increase of 129 tb/d to average 644 tb/d, the highest since May 2013. On a y-o-y comparison, the figure shows higher gains of 174 tb/d or 37%. Accordingly, Japan’s net imports dropped in August by 83 tb/d to average 3.4 mb/d, reflecting a monthly drop of 1% and an annual loss of 1%.
78
OPEC Monthly Oil Market Report – October 2015
Oil Trade Graph 8.4: Japan’s exports of petroleum products tb/d 700
tb/d
600
600
500
500
400
400
300
300
200
200
100
100
700
Fuel oil
Gasoil
Jet fuel
Aug 15
Jul 15
Jun 15
May 15
Apr 15
Mar 15
Feb 15
Jan 15
Dec 14
Nov 14
Oct 14
Sep 14
0
Aug 14
0
Others*
*Others: Contains LPG, gasoline, naphtha, kerosene, lubricating oil, asphalt and paraffin wax.
Table 8.2: Japan’s crude and product net imports, tb/d
Crude oil Total products Total crude and products
Jun 15 2,936 41 2,977
Jul 15 3,434 86 3,521
Aug 15 3,494 -56 3,438
Change Aug 15/Jul 15 60 -142 -83
China China’s crude imports dropped in August to the lowest level in three months, down by 972 tb/d, or 13%, to average 6.3 mb/d. On an annual comparison, they were higher than last year by 331 tb/d, or 6%. On a y-t-d basis, the figures reflect an increase of 610 tb/d or 10%. Crude imports from Venezuela, Oman, Brazil and Russia declined in August from the previous month by 251 tb/d, 203 tb/d, 202 tb/d and 161 tb/d, respectively. The drop in imports is likely due to Chinese refiners’ plans to process less crude in 4Q15 than in 3Q, in line with scheduled maintenance in Asia. As for the crude oil suppliers’ share, Saudi Arabia, Angola and Iraq were the top suppliers to China in August, accounting for 15%, 13% and 13%, respectively. Crude imports from Saudi Arabia were lower than last month’s level by 68 tb/d or 15%, while imports from Angola were lower by 73 tb/d and imports from Iraq were up by 172 tb/d.
OPEC Monthly Oil Market Report – October 2015
79
Oil Trade Graph 8.5: China’s imports of crude and petroleum products tb/d
tb/d
1,600
8,000
1,400
7,000
1,200
6,000
1,000
5,000
800
4,000
600
3,000
400
2,000
200
1,000
Others Diesel
LPG Fuel oil
Naphtha Asphalt
Aug 15
Jul 15
Jun 15
May 15
Apr 15
Mar 15
Feb 15
Jan 15
Dec 14
Nov 14
Oct 14
Sep 14
0
Aug 14
0
Gasoline Crude (RHS)
Jet fuel
China’s product imports decreased by 120 tb/d from the previous month, however they were still higher than last year’s level by 280 tb/d, averaging 1.2 mb/d in August. Graph 8.6: China’s exports of crude and petroleum products tb/d
tb/d
1,000
180 160 140 120 100 80 60 40 20 0 -20
800 600 400 200
Others Diesel
LPG Fuel oil
Naphtha Asphalt
Gasoline Crude (RHS)
Aug 15
Jul 15
Jun 15
May 15
Apr 15
Mar 15
Feb 15
Jan 15
Dec 14
Nov 14
Oct 14
Sep 14
Aug 14
0
Jet fuel
In August, China exported 51 tb/d of crude oil, which was 27 tb/d less than the previous month. On the other hand, China’s product exports increased by 45 tb/d in August over the previous month to average 836 tb/d, while y-o-y, there was an increase of 61 tb/d or 8%. As a result, China’s net oil imports decreased by 1.1 mb/d from the previous month to average 6.5 mb/d, and by 524 tb/d from a year ago. Table 8.3: China’s crude and product net imports, tb/d
Crude oil Total products Total crude and products
80
Jun 15 7,185 356 7,541
Jul 15 7,173 483 7,655
Aug 15 6,228 317 6,545
Change Aug 15/Jul 15 -945 -166 -1110
OPEC Monthly Oil Market Report – October 2015
Oil Trade
India In August, India’s crude imports dropped by 118 tb/d or 3% from the previous month to average 4 mb/d, yet on an annual basis, there was a gain of 294 tb/d or 8%. Graph 8.7: India’s imports of crude and petroleum products tb/d
tb/d
800 700 600 500 400 300 200 100 0
5,000 4,000 3,000 2,000 1,000
Aug 15
Jul 15
Jun 15
May 15
Apr 15
Mar 15
Feb 15
Jan 15
Dec 14
Nov 14
Oct 14
Sep 14
Aug 14
0
Others
LPG
Naphtha
Gasoline
Kerosene
Gasoil
Fuel oil
Crude (RHS)
Product imports in August rose by 73 tb/d from the previous month to average 703 tb/d, while y-o-y, they increased by 210 tb/d. Monthly product imports were higher mainly in LPG, while imports of petrol and naphtha were lower than in the previous month. India’s product exports were higher in August by 165 tb/d or 13% to average 1.5 mb/d. On a y-o-y basis, they were higher than last year by 183 tb/d or 14%. India’s monthly product exports were higher in all product categories, except naphtha, which dropped by 7 tb/d from the previous month. Graph 8.8: India’s exports of petroleum products tb/d
tb/d
2,000
2,000
1,500
1,500
1,000
1,000
500
500
Fuel oil
Gasoil
Jet fuel
Gasoline
Naphtha
Aug 15
Jul 15
Jun 15
May 15
Apr 15
Mar 15
Feb 15
Jan 15
Dec 14
Nov 14
Oct 14
Sep 14
0
Aug 14
0
Others
Consequentially, India’s net imports dropped by 209 tb/d to average 3.3 mb/d, but still reflecting an increase of 13% m-o-m and 14% y-o-y.
OPEC Monthly Oil Market Report – October 2015
81
Oil Trade Table 8.4: India’s crude and product net imports, tb/d
Crude oil Total products Total crude and products
Jun 15 3,879 -487 3,392
Jul 15 4,187 -684 3,503
Aug 15 4,070 -776 3,294
Change Aug 15/Jul 15 -117 -92 -209
Note: India data tab le does not include information for crude import and product export b y Reliance Industries.
FSU In August, total crude oil exports from the Former Soviet Union (FSU) dropped by 310 tb/d or 5% to average 5.9 mb/d. Crude exports through Russian pipelines declined as well, dropping by 39 tb/d or 1% to average 3.8 mb/d. Total shipments from the Black Sea dropped by 19 tb/d or 3% to average 586 tb/d. This drop came as shipments from Novorossiysk decreased by 19 tb/d from a month before. While total Baltic Sea exports increased by 48 tb/d in August as shipments from both the Primorsk port terminal and the Ust Luga port terminal increased by 24 tb/d each. The Druzhba pipeline’s total shipment went up by a slight 5 tb/d to average 1.04 m/d, while the Kozmino shipments declined by 73 tb/d or 12% to average 552 tb/d. Exports through the Lukoil system increased from the previous month both in the Barents Sea, where the Varandey offshore platform went up by 17 tb/d and the Baltic Sea, where the Kalinigrad port terminal rose by 3 tb/d. On other routes, Russia’s Far East total exports were down by 10 tb/d or 3% from the previous month as volumes from the Aniva Bay port terminal dropped by 9 tb/d from July to average 295 tb/d. Central Asia’s total exports stood at 196 tb/d, the same level of the previous month. Baltic Sea total exports went down by 113 tb/d, mainly as exports through Novorossiysk (CPC) dropped by 120 tb/d while being counterbalanced by slight gains from both the Batumi port terminal and the Supsa port terminal. In the Mediterranean Sea, BTC supplies showed a drop of 167 tb/d or 23% from the previous month to average 552 tb/d. On the product exports side, FSU total product exports dropped by 313 tb/d or 10% from the previous month to average 2.9 mb/d. This drop came as the result of a decline seen in all product exports, with no exceptions. In August, FSU product exports showed a drop of 483 tb/d from a year earlier.
82
OPEC Monthly Oil Market Report – October 2015
Oil Trade Table 8.5: Recent FSU exports of crude and petroleum products by source, tb/d Transneft system Europe
Asia
2013
1Q 15
2Q 15
Jul 15
Aug 15
739 739 535 204
702 702 505 198
561 561 421 139
605 605 439 166
586 586 459 127
Baltic Sea total Primorsk port terminal - total of which: Russian oil Others Ust-Luga port terminal - total of which: Russian oil Others
1,546 1,083 1,007 76 463 342 121
1,444 879 879 0 564 356 208
1,427 917 724 193 510 367 143
1,240 772 772 0 468 304 164
1,288 797 797 0 492 351 141
Druzhba pipeline total of which: Russian oil Others
1,032 1,000 32
1,071 1,039 32
1,078 1,045 32
1,039 1,008 31
1,044 1,013 31
Pacific ocean total Kozmino port terminal - total
434 434
605 605
637 637
625 625
552 552
China (via ESPO Pipeline) total China Amur
321 321
309 309
315 315
345 345
345 345
4,071
4,131
4,018
3,854
3,815
2013
1Q 15
2Q 15
Jul 15
Aug 15
111 111
134 134
138 138
118 118
135 135
19 19
18 18
14 14
12 12
15 15
2013
1Q 15
2Q 15
Jul 15
Aug 15
Russian Far East total Aniva bay port terminal De Kastri port terminal
259 114 145
309 109 200
324 111 213
305 119 186
295 109 186
Central Asia total Kenkiyak-Alashankou
239 239
252 252
232 232
196 196
196 196
Baltic sea total Novorossiysk port terminal (CPC) Supsa port terminal Batumi port terminal Kulevi port terminal
853 704 76 53 20
1,118 986 91 41 0
993 903 69 20 0
992 904 81 7 0
879 784 84 11 0
Mediterranean sea total BTC
641 641
638 638
606 606
718 718
552 552
2013 198 9 189
1Q 15 18 8 9
2Q 15 16 7 8
Jul 15 14 9 4
Aug 15 12 7 5
6,392
6,618
6,342
6,209
5,899
2013 122 390 11 857 1,415 263
1Q 15 162 567 28 1,229 1,507 231
2Q 15 200 476 37 1,061 1,475 250
Jul 15 165 441 47 947 1,290 328
Aug 15 101 416 28 880 1,268 212
3,058
3,724
3,499
3,218
2,905
9,450
10,342
9,841
9,427
8,804
Black Sea total Novorossiysk port terminal - total of which: Russian oil Others
Total Russian crude exports Lukoil system Europe and North America Europe
Barents Sea Total Varandey offshore platform Baltic Sea Total Kalinigrad port terminal
Other routes Asia
Europe
Russian rail Russian rail of which: Russian oil Others Total FSU crude exports Products Gasoline Naphtha Jet Gasoil Fuel oil VGO Total FSU product exports Total FSU oil exports Sources: Argus Nefte Transport and Argus Glob al Markets.
OPEC Monthly Oil Market Report – October 2015
83
Stock Movements
Stock Movements OECD commercial oil stocks rose by 9.3 mb in August to stand at 2,933 mb, around 194 mb higher than both the same time one year ago and the latest fiveyear average. Crude oil and products indicated a surplus of around 167 mb and 27 mb above the seasonal norm, respectively. In terms of days of forward cover, OECD commercial stocks stood at 63.3 days, 4.5 days higher than the latest fiveyear average. Preliminary data for September shows that total commercial oil stocks in the US rose by 12.4 mb to stand at 1,301 mb. At this level, they were 157.3 mb or 13.8% above the same period a year ago and 177.1 mb or 15.8% higher than the latest five-year average. Within the components, crude and product stocks went up by 2.5 mb and 9.9 mb, respectively. The latest information for China showed a drop in total commercial oil inventories of 13.5 mb in August. At 407.4 mb, Chinese oil inventories were around 3.8 mb above the previous year at the same time. Within the components, crude commercial oil fell slightly by 0.3 mb, while products fell much more, by 13.2 mb.
OECD The latest information for August shows that total OECD commercial oil stocks rose for the sixth consecutive month by 9.3 mb, to stand at 2,933 mb. With this build, stocks were around 194 mb higher than both the same time one year ago and the latest fiveyear average. Within the components, crude fell by 2.3 mb, while products rose by 11.6 mb. Higher refinery throughputs across most OECD countries have led to a crude stock draw, while at the same time resulting in gains in product stocks. OECD commercial crude stocks fell to end August at 1,472 mb, standing 148.3 mb above the same time one year earlier and 166.9 mb higher than the latest five-year average. OECD Europe saw a drop, while OECD Asia Pacific experienced a build. OECD Americas remained almost unchanged. Graph 9.1: OECD’s commercial oil stocks mb
mb
2,950
2,950
2,900
2,900
2,850
2,850
2,800
2,800
2,750
2,750
2,700
2,700 Max/Min 2010-2014
2,650 2,600
2,650 2,600
2,550
2,550
2,500 Jan
Feb
Mar 2014
84
Apr
May
Jun 2015
Jul
Aug
Sep
Oct
Nov
2,500 Dec
Average 2010-2014
OPEC Monthly Oil Market Report – October 2015
Stock Movements By contrast, OECD product inventories rose in August by 11.6 mb following a build of 26.7 mb in July. At 1,461 mb, product inventories stood 45.6 mb higher than a year ago at the same time, and were 26.9 mb above the seasonal norm. In terms of days of forward cover, OECD commercial stocks rose slightly by 0.1 days in August from the previous month to stand at 63.3 days, or 3.9 days above the same month in the previous year and 4.5 days higher than the latest five-year average. Within the regions, OECD Americas’ days of forward cover were 6.0 days higher than the historical average to stand at 63.1 days in August. OECD Asia Pacific stood 4.1 days above the seasonal average to finish the month at 55.9 days. At the same time, OECD Europe indicated a surplus of 4.1 days above the seasonal norm, averaging 67.8 days in August. Commercial stocks in OECD Americas rose by 9.3 mb in August, ending the month at 1,558 mb. At this level, they represented a surplus of 174.8 mb above the seasonal norm and around 151.6 mb above the same time a year ago. Within components, crude stocks remained unchanged by 14.3 mb, while product inventories rose by 8.9 mb. At the end of August, crude commercial oil stocks in OECD Americas stood at 794 mb, which was 124.6 mb above the latest five-year average and 106.0 mb higher than the same time a year ago. Increased crude runs in the US didn’t limit a further build in crude inventories, as crude imports and domestic production were still higher. Product stocks in OECD Americas rose by 8.9 mb, ending August at 762 mb. At this level, they indicated a surplus of 45.6 mb above the same time one year ago, and were 50.2 mb higher than the seasonal norm. The build in product stocks came mainly from higher refinery output, despite an improvement in US demand. OECD Europe’s commercial stocks declined slightly by 0.7 mb in August to stand at 936 mb. At this level, they were 33.8 mb higher than the same time a year ago and in line with the latest five-year average. Crude stocks rose by 1.8 mb, while products declined by 2.5 mb. OECD Europe’s commercial crude stocks rose in August to stand at 413 mb, which was 29.7 mb above the same period a year earlier and 18.7 mb higher than the latest five-year average. Lower crude runs combined with an increase in supply were the main reason behind the build in inventories. OECD Europe’s commercial product stocks fell by 2.5 mb in August, ending the month at 523 mb, 4.1 mb higher than a year ago at the same time, but 18.9 mb below the seasonal norm. This drop was driven by higher refinery output as well as an increase in regional demand. OECD Asia Pacific commercial oil stocks rose by 1.1 mb in August ending the month at 440 mb, which was 8.5 mb higher than a year ago and 19.2 mb above the five-year average. Within the components, crude fell by 4.1 mb, while products saw a build of 5.2 mb. Crude inventories ended the month of August at 264 mb. They stood 12.6 mb higher than a year ago and 23.6 mb above the seasonal norm. OECD Asia Pacific’s total product inventories ended August at 176 mb, indicating a deficit of 4.1 mb with one year ago, and standing 4.4 mb lower than the seasonal norm.
OPEC Monthly Oil Market Report – October 2015
85
Stock Movements Table 9.1: OECD’s commercial stocks, mb
Crude oil Products Total
Jun 15 1,483 1,422 2,905
Jul 15 1,474 1,449 2,923
Aug 15 1,472 1,461 2,933
Change Aug 15/Jul 15 -2.3 11.6 9.3
Aug 14 1,324 1,415 2,739
63.0
63.2
63.3
0.1
59.4
Days of forward cover
EU plus Norway Preliminary data for August shows that total European stocks fell slightly by 0.7 mb to stand at 1,107.7 mb. At this level, they were 27.7 mb or 2.6% above the same time a year ago and 19.2 mb or 1.8% higher than the latest five-year average. Crude stocks rose by 1.8 mb, while product inventories fell by 2.5 mb from the previous month. European crude inventories rose in August to stand at 493.9 mb, which was 24.2 mb or 5.1% above the same period a year ago and 27.7 mb or 5.9% higher than the seasonal norm. The increase was driven by a fall in crude runs in August to around 10.4 mb/d, down by 70,000 b/d, from the previous month. European throughput is expected to soften seasonally in the next two months, leading to a greater build in crude oil inventories. Graph 9.2: EU-15 plus Norway’s total oil stocks mb
mb
1,180
1,180
1,160
1,160
1,140
1,140
Max/Min 2010-2014
1,120
1,120
1,100
1,100
1,080
1,080
1,060
1,060
1,040 Jan
Feb
Mar 2014
Apr
May
Jun 2015
Jul
Aug
Sep
Oct
Nov
1,040 Dec
Average 2010-2014
In contrast, European product stocks fell by 2.5 mb in August to stand at 613.8 mb, which was 3.6 mb or 0.6% above a year ago at the same time, though still remaining 8.4 mb or 1.4% below the seasonal norm. Within products, the picture was mixed, with naphtha and residual fuel oil stocks going down, while middle distillates and gasoline witnessed stock builds. Gasoline stocks fell by 0.6 mb in August to stand at 108.0 mb, which was 0.9 mb or 0.8% below a year earlier and 0.4 mb or 0.3% higher than the seasonal norm. The decline in gasoline stocks was driven mainly by higher demand in the region, combined with lower gasoline output. Distillate stocks also fell by 4.4 mb, ending August at 404.0 mb and reversing the previous month’s build of 11.1 mb. At this level, distillate stocks were 2.4 mb or 0.6% higher than the previous year at the same time and 6.6 mb, or 1.7%, above the latest five-year average. This drop was driven mainly by
86
OPEC Monthly Oil Market Report – October 2015
Stock Movements strong diesel demand in the region, especially in Germany and the UK. Higher distillate exports from the region also contributed to this drop. In contrast, residual fuel oil stocks rose by 1.6 mb/d in August to stand at 77.2 mb, which was 2.8 mb, or 3.8%, above the same month a year ago, but still 13.6 mb or 15.0% lower than the latest five-year average. Naphtha stocks rose slightly by 0.9 mb in August to stand at 24.6 mb. At this level, they were 0.7 mb or 2.8% less than the same time a year ago and 1.8 mb or 6.7% lower than the seasonal average. Table 9.2: EU-15 plus Norway’s total oil stocks, mb Jun 15 497.0 115.2 25.5 397.3 75.3 613.3 1,110.2
Crude oil Gasoline Naphtha Middle distillates Fuel oils Total products Total
Jul 15 492.1 108.6 23.8 408.4 75.5 616.3 1,108.4
Change Aug 15/Jul 15 1.8 -0.6 0.9 -4.4 1.6 -2.5 -0.7
Aug 15 493.9 108.0 24.6 404.0 77.2 613.8 1,107.7
Aug 14 469.8 108.9 25.4 401.6 74.3 610.2 1,080.0
Sources: Argus and Euroilstock.
US Preliminary data for September shows that total commercial oil stocks in the US rose by 12.4 mb, following a build of 15.4 mb in August, to stand at 1,301 mb. At this level, they were 157.3 mb or 13.8% above the same period a year ago and 177.1 mb or 15.8% higher than the latest five-year average. Within the components, crude and product stocks went up by 2.5 mb and 9.9 mb, respectively. Graph 9.3: US weekly commercial crude oil stocks mb
mb
500 480 460 440 420 400 380 360 340 320 300
500 480 460 440 420 400 380 360 340 320 300
Max/Min 2010-2014
1
4
7
10 2014
13
16
19
22
25 2015
OPEC Monthly Oil Market Report – October 2015
28
31
34
37
40
43
46
49
52
Average 2010-2014
87
Stock Movements US commercial crude stocks rose in September to stand at 457.9 mb, finishing the month at 97 mb or 27% above the same time one year earlier and 98.8 mb or 27.5% above the latest five-year average. Lower crude oil refinery input contributed to the stock build. Indeed, refinery runs fell by around 500,000 b/d to average 16.2 mb/d. Refineries were running at around 90.7% of operable capacity in September, 2.9 pp lower than the previous month, but 1.3% higher than the same time one year ago. A drop in crude oil imports limited a further build in crude oil inventories. In contrast, crude at Cushing, Oklahoma, saw a stock draw of 4.7 mb in September versus the previous month, to end the month at 53.0 mb. Total product stocks rose by 9.9 mb in September for the seventh consecutive month. At 843.4 mb, US product stocks were at around 60.3 mb or 7.7% above the level seen at the same time a year ago, showing a surplus of 78.3 mb or 10.2% above the seasonal norm. Within products, the picture was mixed. Gasoline and distillates saw a build, while jet fuel and residual fuel oil experienced drops. Gasoline stocks rose by 7.8 mb in September, reversing the drop of the previous six consecutive months, to stand at 222.0 mb. At this level, gasoline stocks were 9.5 mb or 4.5% higher than the same period a year ago and 8.3 mb or 3.9% above the latest fiveyear average. The build came mainly from lower demand reflecting the end of summer. Lower gasoline production limited a further build in gasoline inventories. Graph 9.4: US weekly gasoline stocks mb 245
mb 245
240
240
235
235
230
230
225
225
220
220
215
215 210
210 Max/Min 2010-2014
205 200
205 200
195
195 1
4
7
10 2014
13
16
19
22
25 2015
28
31
34
37
40
43
46
49
52
Average 2010-2014
Distillate stocks rose by 1.7 mb in September, ending the month at 151.6 mb. At this level, they indicated a surplus of 20.3 mb or 15.5% from the same period a year ago, and stood 9.9 mb or 7.0% above the latest five-year average. The build in middle distillate stocks was driven mainly by steady output, averaging nearly 5.0 mb/d. In contrast, residual fuel oil inventories fell by 0.4 mb to 39.8 mb, which was 3.2 mb or 8.8% higher than one year ago in the same period, and 3.4 mb or 9.3% above the seasonal norm. Jet fuel stocks also fell by 2.5 mb, ending September at 40.1 mb. At this level, jet fuel stocks stood at 0.5 mb, or 1.2%, higher than the same month a year ago, but were 3.4 mb or 7.8% below the latest five-year average.
88
OPEC Monthly Oil Market Report – October 2015
Stock Movements Table 9.3: US onland commercial petroleum stocks, mb
Crude oil Gasoline Distillate fuel Residual fuel oil Jet fuel Total SPR
Jul 15 455.5 218.1 142.1 40.0 43.7 1,273.5 695.1
Aug 15 455.4 214.2 150.0 40.2 42.5 1,288.9 695.1
Sep 15 457.9 222.0 151.6 39.8 40.1 1,301.3 695.1
Change Sep 15/Aug 15 2.5 7.8 1.7 -0.4 -2.5 12.4 0.0
Sep 14 363.3 212.5 131.4 36.6 39.8 1,148.8 691.0
Source: US Energy Information Administration.
Japan In Japan, total commercial oil stocks rose by 1.1 mb in August, following a build of 8.9 mb in July to stand at 168.5 mb. At this level, Japanese commercial oil inventories stood 0.2 mb or 0.1% above a year ago, but remained 2.1 mb or 1.2% below the fiveyear average. Within the components, product inventories rose by 5.2 mb, while crude fell by 4.1 mb. Japanese commercial crude oil stocks fell in August, reversing the build of the previous three months to stand at 99.2 mb. Despite this drop, they were 1.1 mb or 1.2% above a year ago at the same time and 3.4 mb or 3.6% mb above the seasonal norm. This stock draw was driven by higher crude throughputs, which increased by about 400,000 b/d, or 10.1%, averaging 3.5 mb/d. However, higher crude oil imports limited a further drop in crude oil stocks. Indeed, crude oil imports rose by around 60,000 b/d or 1.8% in August to stand at 3.5 mb/d, which was 4.3% above a year ago at the same time. In contrast, Japan’s total product inventories rose by 5.2 mb in August for the second consecutive month to stand at 69.3 mb. At this level, product stocks stood 1.0 mb or 1.4% below the same time a year ago, showing a deficit of 5.5 mb or 7.4% with the five-year average. The build was driven mainly by higher refinery output, which rose by around 285,000 b/d, or 9.7%, to stand at 3.2 mb/d; this was 5.9% higher than a year ago at the same time. Increases in oil product sales limited a further build in inventories. They rose by around 120,000 b/d, averaging 3.0 mb/d, 3.1% higher than a year ago at the same time. Within products, the picture was mixed; distillates and residual fuel oil stocks rose, while naphtha experienced stock draws. Gasoline stocks remained almost unchanged.
OPEC Monthly Oil Market Report – October 2015
89
Stock Movements Graph 9.5: Japan’s commercial oil stocks mb
mb
190
190
180
180
170
170
Max/Min 2010-2014
160
160
150
150
140 Jan
Feb
Mar
Apr
2014
May
Jun
Jul
Aug
2015
Sep
Oct
Nov
140 Dec
Average 2010-2014
Distillate stocks rose by 4.5 mb in August to stand at 33.5 mb. At this level, distillate stocks were 0.6 mb or 2.0% above the same period a year ago, but 1.3 mb or 3.7% below the seasonal average. All distillate components rose, with the bulk coming from kerosene, indicating a build of 29.4%.Gasoil and jet fuel stocks rose by 2.2% and 2.4%, respectively. The build in distillate components was driven by higher output combined with higher oil imports, while domestic sales limited a further build in distillate stocks. Total residual fuel oil stocks rose by 0.8 mb in August to stand at 14.4 mb, which was 2.6 mb or 15.0% below a year ago and 2.0 mb or 12.2% lower than the latest five-year average. Within the fuel oil components, fuel oil A and fuel oil B.C stocks rose by 2.4% and 8.3%, respectively. This build came mainly from higher fuel oil output. Gasoline stocks remained unchanged in August, ending the month at 9.7 mb. At this level, they indicated a deficit of 0.9 mb or 8.2% with the same time a year ago, and 3.0 mb or 23.9% below the latest five-year average. Higher gasoline output was offset by an increase in domestic sales. Table 9.4: Japan’s commercial oil stocks*, mb
Crude oil Gasoline Naphtha Middle distillates Residual fuel oil Total products Total**
Jun 15 97.8 11.0 12.0 25.4 12.4 60.8 158.5
Jul 15 103.3 9.7 11.9 28.9 13.6 64.1 167.4
Aug 15 99.2 9.7 11.7 33.5 14.4 69.3 168.5
Change Aug 15/Jul 15 -4.1 0.0 -0.2 4.5 0.8 5.2 1.1
Aug 14 98.1 10.6 9.9 32.8 17.0 70.3 168.4
* At end of month. ** Includes crude oil and main products only. Source: Ministry of Economy, Trade and Industry, Japan.
90
OPEC Monthly Oil Market Report – October 2015
Stock Movements
China The latest information for China showed a drop in total commercial oil inventories of 13.5 mb in August, reversing a build of 8.9 mb in July. At 407.4 mb, Chinese oil inventories were around 3.8 mb above the previous year at the same time. Within the components, crude commercial oil fell slightly by 0.3 mb, while products fell much more, by 13.2 mb. At 252.4 mb, commercial crude stocks represented a deficit of around 13.4 mb over the same period one year earlier. The slight drop in crude oil commercial stocks could be attributed to higher crude runs, which increased by 7.1% to average 10.5 mb/d. The decline in crude oil imports by 13.4% to 6.3 mb/d limited a further build in Chinese crude oil commercial inventories. Total product stocks in China fell substantially by 13.2 mb, ending August at 155.0 mb. Despite this drop, product stocks were 17.2 mb higher than a year ago at the same time. Within products, gasoline and diesel fell by 5.5 mb and 7.3 mb, respectively. Diesel stocks fell by 7.3 mb to end August at 88.5 mb, but represented a surplus of 26.1 mb above a year ago at the same time. The fall in diesel inventories is mainly attributed to higher demand as an improving housing market boosted diesel consumption. Gasoline stocks also fell by 5.5 mb, ending August at 51.1 mb. This stock draw was driven by higher apparent gasoline demand, which was nearly 20% above the level experienced the previous year at the same time. Table 9.5: China’s commercial oil stocks, mb
Crude oil Gasoline Diesel Jet kerosene Total products Total
Jun 15 248.9 56.4 90.6 16.1 163.0
Jul 15 252.7 56.5 95.9 15.8 168.2
Aug 15 252.4 51.1 88.5 15.4 155.0
Change Aug 15/Jul 15 -0.3 -5.5 -7.3 -0.4 -13.2
Aug 14 265.8 60.3 62.5 15.0 137.8
412.0
420.9
407.4
-13.5
403.6
Source: OPEC Secretariat analysis.
OPEC Monthly Oil Market Report – October 2015
91
Stock Movements
Singapore and Amsterdam-Rotterdam-Antwerp (ARA) At the end of August, product stocks in Singapore declined by 0.4 mb, reversing a build of 4.3 mb in July. At 51.3 mb, product stocks in Singapore were 10.9 mb or 27% above the same period a year ago. Within products, the picture was mixed; light and middle distillates saw a build, while fuel oil stocks experienced a drop. Light distillate stocks went up slightly by 0.1 mb in August, ending August at 12.0 mb, which was 0.9 mb or 8.5% above the previous year at the same time. Middle distillate stocks rose also by 0.8 mb in August, finishing the month at 13.5 mb, which was 2.7 mb or 24.9% above the same time a year ago. The build was mainly driven by higher refinery throughput in the region. In contrast, residual fuel oil stocks fell by 1.3 mb in August, ending the month at 25.8 mb, which was 7.2 mb or 39% higher than at the same time a year ago. The fall was driven mainly by improved demand for bunker fuels. Product stocks in Amsterdam-Rotterdam-Antwerp (ARA) rose by 4.3 mb in August, up for the fourth consecutive month, to stand at 46.7 mb. At this level, stocks are 14.6 mb or 40.2% higher than at the same time a year ago. Within products, the picture was mixed. Naphtha, gasoil and fuel oil experienced builds, while gasoline and jet oil witnessed draws. Gasoil rose by 2.5 mb in August, ending the month at 26.1 mb, which was 5.5 mb or 26.8% higher than the same month the previous year. Fuel oil stocks also rose by 1.9 mb, ending August at 7.8 mb, which was 2.5 mb or 48% above a year ago in the same period. Both products rose on the back of higher throughput in the region. In contrast, gasoline stocks fell by 0.9 mb in August, ending the month at 8.6 mb, which is 2.5 mb or 41.4% higher than the same period a year ago. The build was mainly driven by improvements in gasoline demand for the European region.
92
OPEC Monthly Oil Market Report – October 2015
Balance of Supply and Demand
Balance of Supply and Demand Demand for OPEC crude in 2015 was revised up by 0.3 mb/d from the previous report to stand at 29.6 mb/d, which is 0.6 mb/d higher than a year earlier. In 2016, the demand for OPEC crude is projected at 30.8 mb/d, which is 0.5 mb/d above last report and around 1.2 mb/d higher than this year.
Forecast for 2015 Demand for OPEC crude for 2015 was revised up by 0.3 mb/d to 29.6 mb/d from the previous month, representing an increase of 0.6 mb/d from the year-ago level. This upward revision reflects the upward revision in demand combined with the downward adjustment in non-OPEC supply. Within the quarters, 1Q15 and 2Q15 were revised up by 0.1 mb/d and 0.2 mb/d, respectively, and 3Q15 and 4Q15 were revised up 0.3 mb/d and 0.5 mb/d, respectively. 1Q15 fell by 0.6 mb/d, while 2Q15 grew by 0.3 mb/d. 3Q15 and 4Q15 are expected to see growth of 0.8 mb/ and 1.9 mb/d, respectively, versus the same quarter last year. Table 10.1: Summarized supply/demand balance for 2015, mb/d (a) World oil demand Non-OPEC supply OPEC NGLs and non-conventionals (b) Total supply excluding OPEC crude
2014 91.35 56.52 5.83 62.35
1Q15 91.97 57.91 5.86 63.77
2Q15 92.04 57.47 5.94 63.41
3Q15 93.44 56.82 6.13 62.95
4Q15 93.96 56.77 6.13 62.90
2015 92.86 57.24 6.01 63.25
Difference (a-b)
29.00
28.20
28.63
30.49
31.06
29.60
OPEC crude oil production Balance
30.07 1.07
30.33 2.13
31.19 2.56
31.52 1.04
Totals may not add up due to independent rounding.
Forecast for 2016 Demand for OPEC crude for 2016 saw an upward revision of 0.5 mb/d from the previous month. The upward revision is mainly due to the downward revision in nonOPEC supply, as world oil demand saw a slight upward adjustment. Within the quarters, 1Q16 and 2Q16 were revised up by 0.5 mb/d and 0.4 mb/d, respectively. Both 3Q16 and 4Q16 were revised up by 0.6 mb/d each.The demand for OPEC crude for next year is projected to increase by 1.2 mb/d, to average 30.8 mb/d. 1Q16 and 2Q16 are expected to increase by 2.0 mb/d and 1.6 mb/d, respectively, while 3Q16 and 4Q16 are projected to increase by 1.0 mb/d and 0.3 mb/d, respectively. Table 10.2: Summarized supply/demand balance for 2016, mb/d (a) World oil demand Non-OPEC supply OPEC NGLs and non-conventionals (b) Total supply excluding OPEC crude
2015 92.86 57.24 6.01 63.25
1Q16 93.28 56.99 6.14 63.12
2Q16 93.32 56.87 6.18 63.05
3Q16 94.65 56.94 6.21 63.15
4Q16 95.17 57.64 6.22 63.86
2016 94.11 57.11 6.18 63.29
Difference (a-b)
29.60
30.16
30.27
31.50
31.31
30.82
Totals may not add up due to independent rounding.
OPEC Monthly Oil Market Report – October 2015
93
Balance of Supply and Demand Graph 10.1: Balance of supply and demand mb/d
mb/d
32
32
31
31
30
30
29
29
28
28
27
27
26
26 1Q15
2Q15
3Q15
4Q15
OPEC crude production
94
1Q16
2Q16
3Q16
4Q16
Required OPEC crude
OPEC Monthly Oil Market Report – October 2015
Table 10.3: World oil demand and supply balance, mb/d 2012
2013
2014
1Q15
2Q15
3Q15
4Q15
2015
1Q16
2Q16
OECD
45.9
46.0
45.7
46.5
45.4
46.2
46.6
46.2
46.7
45.6
Americas
23.6
24.1
24.2
24.2
24.1
24.8
25.0
24.5
24.5
24.4
Europe
13.8
13.6
13.4
13.5
13.6
13.8
13.4
13.6
13.5
13.6
8.5
8.4
8.2
8.8
7.7
7.6
8.2
8.1
8.6
7.6
DCs
28.3
29.2
29.9
30.0
30.7
31.3
30.5
30.6
30.7
FSU
4.4
4.5
4.5
4.4
4.2
4.6
4.9
4.5
4.4
Other Europe
0.6
0.6
0.7
0.7
0.6
0.7
0.7
0.7
0.7
0.6
0.7
0.8
0.7
China
9.7
10.1
10.5
10.4
11.1
10.7
11.2
10.8
10.8
11.4
11.0
11.5
11.1
89.0
90.4
91.4
92.0
92.0
93.4
94.0
92.9
93.3
93.3
94.6
95.2
94.1
OECD
21.1
22.2
24.2
25.0
24.8
24.5
24.4
24.7
24.6
24.5
24.5
24.9
24.6
Americas
16.7
18.2
20.1
20.9
20.6
20.4
20.4
20.6
20.4
20.5
20.5
20.8
20.5
Europe
3.8
3.6
3.6
3.7
3.8
3.6
3.6
3.7
3.7
3.6
3.5
3.7
3.6
Asia Pacific
0.6
0.5
0.5
0.4
0.4
0.5
0.5
0.5
0.5
0.5
0.5
0.5
0.5
DCs
12.0
12.0
12.2
12.5
12.4
12.2
12.1
12.3
12.2
12.3
12.4
12.5
12.3
FSU
3Q16
4Q16
2016
46.3
46.7
46.3
25.1
25.3
24.8
13.8
13.4
13.6
7.5
8.0
7.9
31.4
32.0
31.3
31.4
4.3
4.7
5.0
4.6
World demand
Asia Pacific
(a) Total world demand Non-OPEC supply
13.4
13.6
13.5
13.7
13.6
13.5
13.6
13.6
13.5
13.4
13.3
13.5
13.4
Other Europe
0.1
0.1
0.1
0.1
0.1
0.1
0.1
0.1
0.1
0.1
0.1
0.1
0.1
China
4.2
4.2
4.3
4.3
4.4
4.3
4.3
4.3
4.3
4.3
4.4
4.4
4.4
Processing gains
2.1
2.1
2.2
2.2
2.2
2.2
2.2
2.2
2.2
2.2
2.2
2.2
2.2
52.9
54.3
56.5
57.9
57.5
56.8
56.8
57.2
57.0
56.9
56.9
57.6
57.1
5.6
5.6
5.8
5.9
5.9
6.1
6.1
6.0
6.1
6.2
6.2
6.2
6.2
(b) Total non-OPEC supply and OPEC NGLs
58.4
59.9
62.3
63.8
63.4
62.9
62.9
63.3
63.1
63.1
63.1
63.9
63.3
OPEC crude oil production (secondary sources)
31.2
30.2
30.1
30.3
31.2
31.5
Total supply
89.6
90.2
92.4
94.1
94.6
94.5
0.6
-0.2
1.1
2.1
2.6
1.0
Commercial
2,683
2,589
2,738
2,815
2,905
SPR
1,547
1,584
1,579
1,582
1,584
Total
4,230
4,174
4,317
4,397
4,489
879
909
924
864
916
63
Total non-OPEC supply OPEC NGLs + non-conventional oils
Balance (stock change and miscellaneous) OECD closing stock levels (mb)
Oil-on-water
Days of forward consumption in OECD Commercial onland stocks
58
57
59
62
SPR
34
35
34
35
34
Total
92
91
93
97
97
Memo items FSU net exports (a) - (b)
9.0
9.1
9.0
9.3
9.4
8.9
8.6
9.0
9.1
9.1
8.7
8.5
8.8
30.6
30.4
29.0
28.2
28.6
30.5
31.1
29.6
30.2
30.3
31.5
31.3
30.8
Note: Totals may not add up due to independent rounding.
OPEC Monthly Oil Market Report – October 2015
95
Table 10.4: World oil demand/supply balance: changes from last month's table* , mb/d 2012
2013
2014
OECD
-
-0.1
Americas
-
-
Europe
-
-0.1
Asia Pacific
-
-
DCs
-
FSU
-
Other Europe
3Q15
3Q16
4Q16
2016
-0.2
-
-0.1
-0.1
-
0.1
-
-
-
-0.2
-0.1
-
-0.1
-
-
-
-
-
0.2
-
0.1
0.1
-
-
-
-
-
-
-
-
-
-
-
-
-
-
-
0.1
-
-
0.1
-
-
-
-
-
-0.1
-0.1
-
-0.5
-0.2
-0.5
-0.5
-0.5
-0.6
-0.5
1Q15
2Q15
4Q15
-0.1
-
-0.2
0.1
-
-
-
-
0.2
-
-0.1
-
-0.2
-0.1
-
-
-
-
-
-
0.1
0.1
0.1
0.2
-
-
-
-
-
-
-
-
-
-
-
-
China
-
-
-
-
-
-
(a) Total world demand
-
-
-
-
-
0.2
World demand growth
-
-
-
-
-
0.2
-
-
-
-
-0.1
2015
1Q16
2Q16
-
-
-
-
-0.1 -
0.1
0.1
0.1
-
-
-
-
-
0.1 -
-0.2
World demand
Non-OPEC supply OECD Americas
-
-
-
-
-0.1
-0.2
-0.4
-0.2
-0.5
-0.5
-0.5
-0.6
-0.5
Europe
-
-
-
-
-
0.1
-
-
-
-
-
-
-
Asia Pacific
-
-
-
-
-
-
-
-
-
-
-
-
-
DCs
-
-
-
-
-
-
-
-
-
-
-
-
-
FSU
-
-
-
-
-
-
0.1
-
0.1
0.1
0.1
0.1
0.1
Other Europe
-
-
-
-
-
-
-
-
-
-
-
-
-
China
-
-
-
-
-
-
-
-
-
-
-
-
-
Processing gains
-
-
-
-
-
-
-
-
-
-
-
-
-
Total non-OPEC supply
-
-
-
-
-0.2
-0.1
-0.4
-0.2
-0.5
-0.4
-0.5
-0.6
-0.5
Total non-OPEC supply growth
-
-
-
-
-0.1
-0.1
-0.4
-0.2
-0.4
-0.2
-0.4
-0.1
-0.3
OPEC NGLs + non-conventionals
-
-
-
-
-
-
-
-
-
-
-
-
-
(b) Total non-OPEC supply and OPEC NGLs
-
-
-
-
-0.2
-0.1
-0.4
-0.2
-0.5
-0.4
-0.5
-0.6
-0.5
OPEC crude oil production (secondary sources)
-
-
-
-
-
-
Total supply
-
-
-
-
-0.2
-
Balance (stock change and miscellaneous)
-
-
-
-0.1
-0.2
-
Commercial
-
-
3
-2
-11
SPR
-
-
-
-
-
Total
-
-
3
-2
-11
-
-
-
-
-
-
-
-
-
OECD closing stock levels (mb)
Oil-on-water
Days of forward consumption in OECD Commercial onland stocks
-
SPR
-
-
-
-
-
Total
-
-
-
-
-
Memo items FSU net exports
-
-
-
-
-
-
0.1
-
0.1
0.1
0.1
0.1
0.1
(a) - (b)
-
-
-
0.1
0.2
0.3
0.5
0.3
0.5
0.4
0.6
0.6
0.5
* This compares Table 10.3 in this issue of the MOMR with Table 10.3 in the September 2015 issue. This table shows only where changes have occurred.
96
OPEC Monthly Oil Market Report – October 2015
Table 10.5: OECD oil stocks and oil on water at the end of period 2011
2012
2013
2014
3Q13
4Q13
1Q14
2Q14
3Q14
4Q14
1Q15
2Q15
2,617
2,683
2,589
2,738
2,715
2,589
2,611
2,681
2,749
2,738
2,815
2,905
1,308
1,365
1,316
1,446
1,404
1,316
1,317
1,387
1,416
1,446
1,483
1,538
Europe
914
912
881
886
890
881
885
889
897
886
939
938
Asia Pacific
395
405
392
405
421
392
409
405
436
405
392
429
1,536
1,547
1,584
1,579
1,582
1,584
1,585
1,580
1,577
1,579
1,582
1,584
Americas
697
696
697
692
697
697
697
692
692
692
692
695
Europe
426
436
470
470
471
470
470
469
469
470
470
471
Closing stock levels, mb OECD onland commercial Americas
OECD SPR
Asia Pacific
414
415
417
417
413
417
418
419
417
417
420
418
4,154
4,230
4,174
4,317
4,296
4,174
4,196
4,260
4,326
4,317
4,397
4,489
825
879
909
924
932
909
954
914
952
924
864
916
57
58
57
58
58
57
58
58
59
59
62
64
Americas
53
55
55
57
58
55
55
57
57
59
63
65
Europe
68
68
66
67
66
68
65
64
67
66
68
68
Asia Pacific
47
48
46
49
49
44
53
52
52
46
51
57
33
34
33
34
34
35
35
34
34
34
35
35
Americas
30
30
29
29
29
29
29
28
28
28
29
29
Europe
29
30
31
32
35
36
35
34
35
35
34
34
OECD total Oil-on-water
Days of forward consumption in OECD OECD onland commercial
OECD SPR
Asia Pacific OECD total
50
50
48
50
48
47
54
54
50
48
54
55
90
92
90
92
92
91
93
93
93
93
98
99
OPEC Monthly Oil Market Report – October 2015
97
Table 10.6: Non-OPEC supply and OPEC natural gas liquids, mb/d
US Canada Mexico OECD Americas* Norway UK Denmark Other OECD Europe OECD Europe Australia Other Asia Pacific OECD Asia Pacific Total OECD Brunei India Indonesia Malaysia Thailand Vietnam Asia others Other Asia Argentina Brazil Colombia Trinidad & Tobago L. America others Latin America Bahrain Oman Syria Yemen Middle East Chad Congo Egypt Equatorial Guinea Gabon South Africa Sudans Africa other Africa Total DCs FSU Russia Kazakhstan Azerbaijan FSU others Other Europe China
2012 2013 2014 10.0 11.2 13.0 3.8 4.0 4.3 2.9 2.9 2.8 16.7 18.2 20.1 1.9 1.8 1.9 1.0 0.9 0.9 0.2 0.2 0.2 0.7 0.7 0.7 3.8 3.6 3.6 0.5 0.4 0.4 0.1 0.1 0.1 0.6 0.5 0.5 21.1 22.2 24.2 0.2 0.1 0.1 0.9 0.9 0.9 0.9 0.9 0.9 0.7 0.7 0.7 0.4 0.4 0.4 0.3 0.3 0.3 0.2 0.2 0.2 3.6 3.5 3.5 0.7 0.7 0.7 2.6 2.6 2.9 1.0 1.0 1.0 0.1 0.1 0.1 0.3 0.3 0.3 4.7 4.8 5.0 0.2 0.2 0.2 0.9 0.9 0.9 0.2 0.1 0.0 0.2 0.1 0.1 1.5 1.4 1.3 0.1 0.1 0.1 0.3 0.3 0.3 0.7 0.7 0.7 0.3 0.3 0.3 0.2 0.2 0.2 0.2 0.2 0.1 0.1 0.2 0.3 0.3 0.3 0.3 2.3 2.3 2.4 12.0 12.0 12.2 13.4 13.6 13.5 10.5 10.6 10.7 1.6 1.6 1.6 0.9 0.9 0.9 0.4 0.4 0.4 0.1 0.1 0.1 4.2 4.2 4.3
3Q15 4Q15 2015 13.5 13.4 13.6 4.3 4.4 4.4 2.6 2.6 2.6 20.4 20.4 20.6 1.9 1.9 1.9 0.9 0.9 0.9 0.2 0.2 0.2 0.7 0.6 0.7 3.6 3.6 3.7 0.4 0.4 0.4 0.1 0.1 0.1 0.5 0.5 0.5 24.5 24.4 24.7 0.1 0.1 0.1 0.9 0.8 0.9 0.9 0.9 0.9 0.7 0.7 0.8 0.4 0.4 0.4 0.3 0.3 0.3 0.2 0.2 0.2 3.5 3.5 3.6 0.7 0.7 0.7 3.0 3.0 3.0 1.0 1.0 1.0 0.1 0.1 0.1 0.3 0.3 0.3 5.1 5.1 5.2 0.2 0.2 0.2 1.0 1.0 1.0 0.0 0.0 0.0 0.0 0.0 0.0 1.2 1.2 1.3 0.1 0.1 0.1 0.2 0.3 0.3 0.7 0.7 0.7 0.3 0.3 0.3 0.2 0.2 0.2 0.1 0.1 0.1 0.3 0.3 0.3 0.3 0.3 0.3 2.3 2.3 2.3 12.2 12.1 12.3 13.5 13.6 13.6 10.8 10.7 10.8 1.6 1.6 1.6 0.8 0.8 0.9 0.4 0.4 0.4 0.1 0.1 0.1 4.3 4.3 4.3
Change Change 15/14 1Q16 2Q16 3Q16 4Q16 2016 16/15 0.6 13.4 13.5 13.5 13.7 13.5 -0.1 0.0 4.5 4.4 4.5 4.6 4.5 0.1 -0.2 2.6 2.5 2.5 2.5 2.5 -0.1 0.5 20.4 20.5 20.5 20.8 20.5 0.0 0.0 2.0 1.9 1.9 2.0 1.9 0.0 0.1 0.9 0.9 0.9 1.0 0.9 0.0 0.0 0.2 0.2 0.2 0.2 0.2 0.0 0.0 0.6 0.6 0.6 0.6 0.6 0.0 0.1 3.7 3.6 3.5 3.7 3.6 0.0 -0.1 0.4 0.4 0.4 0.4 0.4 0.0 0.0 0.1 0.1 0.1 0.0 0.1 0.0 -0.1 0.5 0.5 0.5 0.5 0.5 0.0 0.5 24.6 24.5 24.5 24.9 24.6 0.0 0.0 0.1 0.1 0.1 0.1 0.1 0.0 0.0 0.8 0.9 0.9 0.9 0.9 0.0 0.0 0.9 0.9 0.9 0.9 0.9 0.0 0.1 0.8 0.8 0.8 0.8 0.8 0.0 0.0 0.4 0.4 0.4 0.4 0.4 0.0 0.0 0.3 0.3 0.3 0.3 0.3 0.0 0.0 0.3 0.3 0.3 0.3 0.3 0.0 0.1 3.6 3.6 3.7 3.7 3.6 0.1 0.0 0.7 0.7 0.7 0.7 0.7 0.0 0.2 3.1 3.1 3.2 3.3 3.2 0.1 0.0 1.0 1.0 1.0 1.0 1.0 0.0 0.0 0.1 0.1 0.1 0.1 0.1 0.0 0.0 0.3 0.3 0.3 0.3 0.3 0.0 0.1 5.1 5.1 5.2 5.3 5.2 0.0 0.0 0.2 0.2 0.2 0.2 0.2 0.0 0.0 1.0 1.0 1.0 1.0 1.0 0.0 0.0 0.0 0.0 0.0 0.0 0.0 0.0 -0.1 0.0 0.0 0.0 0.0 0.0 0.0 -0.1 1.2 1.2 1.2 1.2 1.2 0.0 0.0 0.1 0.1 0.1 0.1 0.1 0.0 0.0 0.3 0.3 0.3 0.3 0.3 0.0 0.0 0.7 0.7 0.7 0.7 0.7 0.0 0.0 0.3 0.3 0.3 0.3 0.3 0.0 0.0 0.2 0.2 0.2 0.2 0.2 0.0 0.0 0.1 0.1 0.1 0.1 0.1 0.0 0.0 0.3 0.3 0.3 0.3 0.3 0.0 0.0 0.3 0.3 0.3 0.3 0.3 0.0 0.0 2.3 2.3 2.3 2.3 2.3 0.0 0.1 12.2 12.3 12.4 12.5 12.3 0.0 0.0 13.5 13.4 13.3 13.5 13.4 -0.2 0.1 10.7 10.6 10.6 10.7 10.7 -0.1 0.0 1.6 1.6 1.6 1.6 1.6 0.0 0.0 0.8 0.8 0.8 0.8 0.8 0.0 0.0 0.4 0.4 0.4 0.3 0.4 0.0 0.0 0.1 0.1 0.1 0.1 0.1 0.0 0.1 4.3 4.3 4.4 4.4 4.4 0.0
Non-OPEC production
50.7
52.2
54.4
54.6
54.6
55.1
0.7
54.8
54.7
54.7
55.4
54.9
-0.1
Processing gains Non-OPEC supply OPEC NGL OPEC non-conventional OPEC (NGL+NCF) Non-OPEC & OPEC (NGL+NCF)
2.1 52.9 5.4 0.2 5.6
2.1 54.3 5.4 0.2 5.6
2.2 56.5 5.6 0.3 5.8
2.2 56.8 5.9 0.3 6.1
2.2 56.8 5.9 0.3 6.1
2.2 57.2 5.8 0.3 6.0
0.0 0.7 0.2 0.0 0.2
2.2 57.0 5.9 0.3 6.1
2.2 56.9 5.9 0.3 6.2
2.2 56.9 5.9 0.3 6.2
2.2 57.6 5.9 0.3 6.2
2.2 57.1 5.9 0.3 6.2
0.0 -0.1 0.2 0.0 0.2
58.4
59.9
62.3
62.9
62.9
63.3
0.9
63.1
63.1
63.1
63.9
63.3
0.0
* Chile has been included in OECD Americas. Note: Totals may not add up due to independent rounding.
98
OPEC Monthly Oil Market Report – October 2015
Table 10.7: World Rig Count
US Canada Mexico
2011 2012 2013 2014 1,880 1,919 1,761 1,862 423 364 354 380 94
106
106
Change 14/13 4Q14 1Q15 101 1,912 1,380 26 406 309
2Q15 909 99
67
59
86
3Q15 Aug 15 Sep 15 866 883 848 191 206 183
Change Sep/Aug -35 -23
42
41
39
-2
106 2,396 1,755 1,067 1,098
-20
78
1,130
1,070
-60
Norway
17
17
20
17
-3
16
17
18
18
16
17
1
UK
16
18
17
16
-1
17
18
14
13
12
14
2
118
119
135
145
10
148
132
116
109
109
109
0
17
24
27
26
-1
25
21
17
16
15
16
1
116 2,569 1,908 1,200 1,222
1,254
1,195
-59
Americas
Europe Asia Pacific Total OECD
2,398 2,390 2,221 2,327
2,532 2,533 2,383 2,499
Other Asia
239
217
219
228
9
229
214
203
201
205
202
-3
Latin America
195
180
166
172
6
174
161
143
149
150
154
4
Middle East
129
136
102
108
6
105
103
98
100
99
100
1
2
7
16
28
12
29
22
12
8
7
8
1
565
539
503
536
33
537
499
456
458
461
464
3
149 3,106 2,408 1,656 1,681
1,715
1,659
-56
51
52
51
-1
Africa Total DCs Non-OPEC rig count Algeria
3,097 3,071 2,886 3,034 31
36
47
48
1
48
52
52
7
9
11
15
4
14
15
12
8
8
7
-1
Ecuador
13
20
26
24
-2
21
17
15
12
14
11
-3
Iran**
54
54
54
54
0
54
54
54
54
54
54
0
Iraq**
36
58
83
79
-4
59
57
53
47
48
49
1
Kuwait**
32
31
32
38
6
43
51
49
44
46
43
-3
Libya**
3
9
15
10
-4
8
6
3
1
1
1
0
Nigeria
36
36
37
34
-3
36
35
29
28
28
29
1
8
8
9
10
2
10
9
8
7
9
6
-3
100
112
114
134
20
143
154
155
154
151
156
5
21
24
28
34
6
38
38
39
41
40
42
2
Venezuela
122
117
121
116
-5
106
108
105
114
114
117
3
OPEC rig count
461
513
576
596
20
579
595
575
561
565
566
1
3,559 3,584 3,462 3,631
169 3,685 3,002 2,231 2,242
2,280
2,225
-55
2,195 2,594 2,611 2,795
184 2,820 2,214 1,616 1,606
Angola
Qatar Saudi Arabia UAE
Worldwide rig count* of which: Oil Gas Others
1,635
1,592
-43
1,257
886
746
743
-3
776
690
516
536
542
535
-7
103
106
109
95
-14
91
100
98
99
103
98
-5
Note: Totals may not add up due to independent rounding. na: Not available. Sources: Baker Hughes Incorporated & Secretariat's estimates.
OPEC Monthly Oil Market Report – October 2015
* Excludes China and FSU. ** Estimated figure when Baker Hughes Incorporated did not reported the data.
99
Contributors to the OPEC Monthly Oil Market Report Editor-in-Chief Omar S. Abdul-Hamid, Director, Research Division email:
[email protected]
Editor Hojatollah Ghanimi Fard, Head, Petroleum Studies Department email:
[email protected]
Analysts Crude Oil Price Movements
Eissa Alzerma email:
[email protected]
Commodity Markets
Hector Hurtado email:
[email protected]
World Economy
Afshin Javan email:
[email protected] Imad Al-Khayyat email:
[email protected] Joerg Spitzy email:
[email protected]
World Oil Demand
Hassan Balfakeih email:
[email protected]
World Oil Supply
Mohammad Ali Danesh email:
[email protected]
Product Markets and Refinery Operations
Elio Rodriguez email:
[email protected]
Tanker Market and Oil Trade
Anisah Almadhayyan email:
[email protected]
Stock Movements
Aziz Yahyai email:
[email protected]
Technical and editorial team
Aziz Yahyai email:
[email protected] Douglas Linton email:
[email protected]
Data services Adedapo Odulaja, Head, Data Services Department (
[email protected]), Hossein Hassani, Statistical Systems Coordinator (
[email protected]), Pantelis Christodoulides (World Oil Demand and Stock Movements), Klaus Stoeger (World Oil Supply), Harvir Kalirai (World Economy), Mouhamad Moudassir (Product Markets and Refinery Operations), Mohammad Sattar (Crude Oil Price Movements), Anna Gredinger (Tanker Market and Oil Trade)
Editing, production, design and circulation Alvino-Mario Fantini, Maureen MacNeill, Scott Laury, Jerry Haylins, Viveca Hameder, Hataichanok Leimlehner, Andrea Birnbach
100
OPEC Monthly Oil Market Report – October 2015
Disclaimer
The data, analysis and any other information contained in the Monthly Oil Market Report (the “MOMR”) is for informational purposes only and is not intended as a substitute for advice from your business, finance, investment consultant or other professional. The views expressed in the MOMR are those of the OPEC Secretariat and do not necessarily reflect the views of its Governing Bodies and/or individual OPEC Member Countries. Whilst reasonable efforts have been made to ensure the accuracy of the MOMR’s content, the OPEC Secretariat makes no warranties or representations as to its accuracy, currency reference or comprehensiveness, and assumes no liability or responsibility for any inaccuracy, error or omission, or for any loss or damage arising in connection with or attributable to any action or decision taken as a result of using or relying on the information in the MOMR. The MOMR may contain references to material(s) from third parties whose copyright must be acknowledged by obtaining necessary authorization from the copyright owner(s). The OPEC Secretariat shall not be liable or responsible for any unauthorized use of third party material(s). All rights of the Publication shall be reserved to the OPEC Secretariat, including every exclusive economic right, in full or per excerpts, with special reference but without limitation, to the right to publish it by press and/or by any communications medium whatsoever, including Internet; translate, include in a data base, make changes, transform and process for any kind of use, including radio, television or cinema adaptations, as well as sound-video recording, audio-visual screenplays and electronic processing of any kind and nature whatsoever. Full reproduction, copying or transmission of the MOMR is not permitted in any form or by any means by third parties without the OPEC Secretariat’s written permission, however the information contained therein may be used and/or reproduced for educational and other noncommercial purposes without the OPEC Secretariat’s prior written permission, provided that OPEC is fully acknowledged as the copyright holder.
OPEC Monthly Oil Market Report – October 2015
101
OPEC Basket average price
US$/b
down 0.63 in September
September 2015
44.83
August 2015
45.46
Year-to-date
52.79
September OPEC crude production up 0.11 in September
mb/d, according to secondary sources
September 2015
31.57
August 2015
31.46
Economic growth rate
per cent
World
OECD
US
Japan
Euro-zone
China
India
2015
3.1
2.0
2.5
0.8
1.5
6.8
7.4
2016
3.4
2.1
2.6
1.2
1.5
6.4
7.6
Supply and demand 2015
mb/d
15/14
2016
16/15
World demand
92.9
1.5
World demand
94.1
1.3
Non-OPEC supply
57.2
0.7
Non-OPEC supply
57.1
–0.1
6.0
0.2
OPEC NGLs
6.2
0.2
29.6
0.6
Difference
30.8
1.2
OPEC NGLs Difference
OECD commercial stocks
mb
Jun 15
Jul 15
Aug 15
Aug 15/Jul 15
Aug 14
Crude oil
1,483
1,474
1,472
–2.3
1,324
Products
1,422
1,449
1,461
11.6
1,415
Total
2,905
2,923
2,933
9.3
2,739
63.0
63.2
63.3
0.1
59.4
Days of forward cover
Next report to be issued on 12 November 2015.