E
MONTHLY COFFEE MARKET REPORT
August 2013
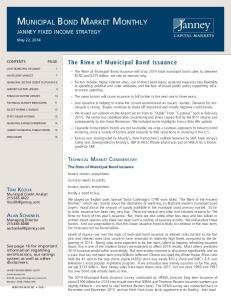
Coffee prices continued to slide in August, despite a brief bounce at the beginning of the month. The monthly average of the ICO composite indicator price dropped to its lowest level in nearly four years, as did the monthly averages of the three Arabica group indicators. Total exports in July 2013 reached 9.1 million bags, 6.6% less than July 2012, but total exports for the first ten months of the coffee year are still up 3.6% at 94.5 million bags. In terms of coffee consumption, an increase of 2.1% is estimated in calendar year 2012 to around 142 million bags, compared to 139.1 million bags in 2011. Most of this increase can be attributed to strong growth in exporting countries and emerging markets, which grew by 2.5% and 4.7%, respectively. Consumption in traditional coffee‐consuming countries grew by a more modest 1% compared to 2011. Graph 1: ICO composite indicator daily prices (1 August 2012 to 4 September 2013)
170 160
US cents/lb
150 140 130 120 110 100
2
Monthly Coffee Market Report – August 2013
Price movements
Market fundamentals
The monthly average of the ICO composite indicator price fell by 2.1% in August to a level of 116.45 US cents/lb (Graph 1). This is its lowest level since September 2009. All four group indicators dropped compared to July, with significant decreases recorded in the three Arabica groups. Colombian Milds, Other Milds and Brazilian Naturals fell by 2.9%, 2.3% and 2.2%, respectively. A decrease of 1.3% was recorded in Robustas (Graph 2). The arbitrage between Arabicas and Robustas also narrowed in August (Graph 3), with the price differentials between the three Arabica groups and Robustas all decreasing.
These price movements have been exacerbated in recent weeks by depreciations in the exchange rates of several exporting countries against the US dollar, most notably the Brazilian real and Indian rupee (Graph 4). A weaker currency can encourage greater selling by exporting countries, thus increasing availability in the market and putting further downward pressure on prices. Although changes in the exchange rate could potentially increase the price paid to growers in domestic currency, it will also increase the cost of inputs which are imported in US dollars. As a result, particularly given the significant decreases in coffee prices over the last two years, current market levels are still believed to be below the cost of production.
Graph 2: ICO group indicator daily prices (1 August 2012 to 4 September 2013) 220
Graph 4: Index of daily exchange rates of selected exporting countries against the US dollar (1 March 2013 to 3 September 2013)
200
US cents/lb
180 160 140
130
120 120
100 80
110
Colombian Milds
Other Milds
Brazilian Naturals
Graph 3: Arbitrage between New York and London futures markets (1 August 2012 to 4 September 2013)
Robustas
90
Brazil
100 90
US cents/lb
80 70 60 50 40 30
100
Colombia
India
Indonesia
Mexico
Total production by all exporting countries in crop year 2012/13 has been revised downwards slightly to an estimated 144.4 million bags, up 7.6% on 2011/12. In terms of exports, total shipments in July 2013 reached 9.1 million bags, down 6.6% on the same month last year. However, total exports for the first ten months of coffee year 2012/13 increased by 3.6% to 94.5 million bags, compared to 91.2 million in the same period in 2011/12.
Monthly Coffee Market Report – August 2013
3
World consumption in calendar year 2012 is estimated at around 142 million bags, a 2.1% increase on 2011. Consumption in traditional coffee‐consuming countries reached 71.4 million bags, a modest 1% increase on the previous year. The USA is the largest single consuming country, recording 22.2 million bags in 2012 compared to 22 million in 2011. In the EU, total consumption increased slightly by 0.6% to 41 million bags, with a notable increase of 9.1% recorded in Spain, but there were decreases of 6.7% and 2.9% in Germany and France, respectively. Consumption in Italy and the United Kingdom was relatively unchanged on 2011. The most dynamic growth in consumption in recent years has been in exporting countries and emerging markets. As can be seen in Graph 5, total coffee consumption in non‐traditional markets has grown
by nearly 50% since 2003. Brazil is easily the largest consumer of the exporting countries, increasing by 3.1% in 2012 to 20.2 million bags. Strong consumption growth was also recorded in Indonesia, increasing by 7.5% to 3.6 million bags, and India, by 4.8% to 1.9 million bags. In emerging markets, total consumption in 2012 is estimated at 27.2 million bags, a 4.7% increase on the previous year. The largest consumer in this category is Russia, which recorded 3.8 million bags in 2012, up 2% on 2011. Significant increases were also registered in Algeria and Australia, of 9% and 15.9%, respectively. Emerging markets in total added an estimated 1.2 million bags to consumption in 2012, compared to 1.1 million for exporting countries and 672,000 for traditional markets. Full data on coffee consumption in selected countries can be found in Table 6.
Graph 5: Index of consumption in traditional markets, exporting countries and emerging markets (Calendar years 2003 to 2012)
150
140
130
120
110
100 2003
2004
2005
2006
Traditional markets
2007
2008
Exporting countries
2009
2010
2011
2012
Emerging markets
4
Monthly Coffee Market Report – August 2013
Table 1: ICO indicator prices and futures prices (US cents/lb)
ICO Colombian Composite Milds Other Milds Monthly averages Aug‐12 148.50 187.14 174.82 Sep‐12 151.28 190.10 178.98 Oct‐12 147.12 181.39 173.32 Nov‐12 136.35 170.08 159.91 Dec‐12 131.31 164.40 152.74 Ja n‐13 135.38 169.19 157.29 Feb‐13 131.51 161.70 149.46 Ma r‐13 131.38 161.53 149.78 Apr‐13 129.55 161.76 149.81 Ma y‐13 126.96 158.35 147.19 Jun‐13 117.58 147.55 138.26 Jul ‐13 118.93 147.46 138.39 Aug‐13 116.45 143.26 135.15 % change between Aug‐13 and Jul‐13 ‐2.1 ‐2.9 ‐2.3 Annual averages 2008 124.25 144.32 139.78 2009 115.67 177.43 143.84 2010 147.24 225.46 195.96 2011 210.39 283.84 271.07 2012 156.34 202.08 186.47 % change between Aug‐13 and 2012 average ‐25.5 ‐29.1 ‐27.5 Volatility (%) Jul‐13 7.1 7.8 8.4 Aug‐13 6.0 6.3 6.0 Variation between Aug‐13 and Jul‐13 ‐1.1 ‐1.5 ‐2.4 * Average price for 2nd and 3rd positions
Robustas
New York*
London*
160.05 166.53 161.20 148.25 140.69 145.17 136.63 133.61 132.62 130.29 120.01 119.47 116.81
106.52 104.95 104.47 97.67 96.59 99.69 104.03 106.26 101.68 99.18 90.79 95.21 94.01
169.77 175.36 170.43 155.72 149.58 154.28 144.89 141.43 139.91 138.64 126.37 125.27 122.31
96.12 94.65 94.66 87.32 85.94 88.85 94.41 97.22 93.15 91.07 81.82 85.34 84.10
‐2.2
‐1.3
‐2.4
‐1.4
126.59 115.33 153.68 247.61 174.97
105.28 74.58 78.74 109.21 102.82
136.46 128.40 165.20 256.36 179.22
97.17 67.69 71.98 101.23 91.87
‐33.2
‐8.6
‐31.8
‐8.5
9.2 7.6
5.1 5.1
10.7 6.9
5.3 5.3
‐1.6
0.1
‐3.8
0.0
Table 2: Price differentials (US cents/lb)
Colombian Milds Other Milds
Colombian Milds Brazilian Naturals
Aug‐12
12.32
27.09
80.62
14.77
68.30
53.53
73.65
Sep‐12
11.12
23.57
85.15
12.45
74.03
61.58
80.71
Oct‐12
8.07
20.19
76.92
12.12
68.85
56.73
75.77
Nov‐12
10.17
21.83
72.41
11.66
62.24
50.58
68.40
Dec‐12
11.66
23.71
67.81
12.05
56.15
44.10
63.64
Ja n‐13
11.90
24.02
69.50
12.12
57.60
45.48
65.43
Feb‐13
12.24
25.07
57.67
12.83
45.43
32.60
50.48
Ma r‐13
11.75
27.92
55.27
16.17
43.52
27.35
44.21
Apr‐13
11.95
29.14
60.08
17.19
48.13
30.94
46.76
Ma y‐13
11.16
28.06
59.17
16.90
48.01
31.11
47.57
Jun‐13
9.29
27.54
56.76
18.25
47.47
29.22
44.55
Jul ‐13 Aug‐13
9.07 8.11
27.99 26.45
52.25 49.25
18.92 18.34
43.18 41.14
24.26 22.80
39.93 38.21
% change between Aug‐13 and Jul‐13 ‐10.6 ‐5.5 * Average price for 2nd and 3rd positions
‐5.7
‐3.1
‐4.7
‐6.0
Brazilian Naturals
Colombian Other Milds Other Milds Milds Robustas Robustas Brazilian Naturals
Brazilian New York* Naturals Robustas London*
‐4.3
Monthly Coffee Market Report – August 2013 Table 3: Total production in exporting countries Crop year 2009 2010 2011 commencing TOTAL
5
2012*
% change 2011‐12
122 917
133 355
134 166
144 399
7.6
Colombian Milds Other Milds Brazilian Naturals Robustas
9 160 26 526 37 177 50 055
9 722 28 873 45 627 49 132
8 706 32 078 41 192 52 190
10 928 28 030 49 038 56 403
25.5 ‐12.6 19.0 8.1
Arabicas Robustas
72 862 50 055
84 222 49 132
81 975 52 190
87 996 56 403
7.3 8.1
In thousand bags * Estimated
Table 4: Total exports of all forms of coffee by exporting countries October ‐ July July 2012 July 2013 % change 2011/12 2012/13 TOTAL
% change
9 692
9 053
‐6.6
91 203
94 484
3.6
664
893
34.6
7 112
8 435
18.6
Other Milds
2 622
2 206
‐15.9
22 892
21 284
‐7.0
Brazilian Naturals
2 378
2 349
‐1.2
25 331
27 850
9.9
Robustas
4 028
3 606
‐10.5
35 868
36 915
2.9
Arabicas Robustas
5 664 4 028
5 448 3 606
‐3.8 ‐10.5
55 335 35 868
57 569 36 915
4.0 2.9
Colombian Milds
In thousand bags Full trade statistics for all exporting countries are available on the ICO website at www.ico.org/trade_statistics.asp
Table 5: Certified stocks on the New York and London futures markets Aug‐12 Sep‐12 Oct‐12 Nov‐12 Dec‐12 Jan‐13 Feb‐13 Mar‐13 Apr‐13 May‐13 Jun‐13 Jul‐13 Aug‐13 London
2.39
2.17
1.94
1.82
1.78
1.77
1.89
2.05
2.11
2.08
2.00
1.64
1.32
New York
2.22
2.43
2.72
2.82
2.90
2.96
3.03
3.09
3.10
3.11
3.09
3.11
3.15
In million bags
6
Monthly Coffee Market Report – August 2013
Table 6: Total coffee consumption in selected countries
Calendar years
% change 2011 ‐ 2012
2009
2010
2011
2012*
132 270
137 025
139 050
142 002
2.1
39 616
40 910
42 397
43 455
2.5
18 583
19 070
19 573
20 178
3.1
Ethiopia
3 089
3 253
3 383
3 387
0.1
Indonesia
3 333
3 333
3 333
3 584
7.5
World total Exporting countries Brazil
Mexico
2 200
2 239
2 354
2 354
0.0
Philippines
1 770
1 973
2 150
2 175
1.2
India
1 605
1 725
1 829
1 917
4.8
Venezuela
1 649
1 650
1 650
1 650
0.0
Vietnam
1 068
1 302
1 583
1 583
0.0
Others
6 320
6 366
6 542
6 628
1.3
Importing countries
92 653
96 115
96 653
98 547
2.0
Traditional markets
69 204
71 004
70 717
71 389
1.0
21 436
21 783
22 044
22 238
0.9
USA Germany
8 897
9 292
9 460
8 830
‐6.7
Japan
7 130
7 192
7 015
7 131
1.7
France
5 677
5 713
5 962
5 789
‐2.9
Italy
5 806
5 781
5 689
5 731
0.7
3 273
3 586
3 574
3 498
‐2.1
Spain
Canada
3 352
3 232
3 149
3 435
9.1
United Kingdom
3 220
3 134
2 925
2 926
0.0
10 413
11 290
10 898
11 810
8.4
23 449
25 111
25 936
27 157
4.7
Russia
3 131
3 661
3 695
3 767
2.0
Algeria
2 066
2 021
1 942
2 117
9.0
Poland
2 001
2 156
2 034
1 950
‐4.1
1 551
1 666
1 801
1 714
‐4.8
Others Emerging markets
Korea, Rep. of Australia Others In thousand bags * Estimated
1 223
1 370
1 407
1 631
15.9
13 478
14 236
15 057
15 979
6.1