OPEC Monthly Oil Market Report
9 February 2015
Feature article:
Oil demand outlook for 2015
Oil market highlights
1
Feature article
3
Crude oil price movements
5
Commodity markets
11
World economy
16
World oil demand
34
World oil supply
42
Product markets and refinery operations
61
Tanker market
67
Oil trade
71
Stock movements
79
Balance of supply and demand
87
Oil market highlights Crude Oil Price Movements The OPEC Reference Basket ended January down $15.08 or 25% to average $44.38/b, reaching its lowest value in six years as excess supply and weak demand continued to weigh on the crude oil market. ICE Brent ended January at $49.76/b, down $13.51 from the previous month. Nymex WTI lost $11.96 to stand at $47.33/b. The Brent-WTI spread narrowed to $2.43/b.
World Economy World economic growth for 2014 remains unchanged, while the decelerating trend in emerging and developing countries has led to a revision in the 2015 forecast to 3.4% from 3.6%. OECD growth is unchanged at 1.8% for 2014 and 2.2% in 2015. China’s 2015 growth forecast has been revised to 7.0% from 7.2%, while India’s positive trend has lifted the 2015 growth forecast from 5.8% to 6.0%. Russia’s 2015 growth forecast has been revised from 0% to show a contraction of 2.4%, while Brazil is now expected to grow by 0.7% in 2015, compared to 1.0% previously.
World Oil Demand Global oil demand growth in 2014 is expected to be around 0.96 mb/d, broadly unchanged from last month’s report. In 2015, world oil demand is projected to rise by 1.17 mb/d slightly higher than in the previous report, mainly to reflect expectations of an uptick in oil requirements in OECD Americas.
World Oil Supply Non-OPEC oil supply growth in 2014 has been revised up slightly to 1.99 mb/d. This revision was mostly driven by higher output in OECD, Brazil, Kazakhstan and China in 4Q14, partially offset by downward revisions from Azerbaijan, Other Asia Pacific, Australia and Mexico. In 2015, non-OPEC oil supply is projected to grow by 0.85 mb/d, down 0.42 mb/d from the previous assessment. OPEC NGLs are forecast to grow by 0.20 mb/d to 6.03 mb/d in 2015. In January, OPEC crude production decreased by 53 tb/d to average 30.15 mb/d, according to secondary sources.
Product Markets and Refining Operations Product markets strengthened in the Atlantic Basin in January. Lower refinery runs supported light and middle distillate crack spreads in the US, while export opportunities lent additional support to the European market. In Asia, product markets strengthened slightly in January, as limited supplies of naphtha and fuel oil allowed margins to rise, despite the pressure of increasing gasoline and middle distillate supplies.
Tanker Market A general improvement in sentiment was seen in the dirty tanker market on the back of weather conditions, port delays and tight tonnage availability. Clean tanker freight rates improved East of Suez, but encountered a decline in the west, partially due to the weak medium-range tanker market. OPEC and Middle East sailings were higher than a month ago with arrivals in North America and West Asia increasing while arrivals in Europe and the Far East fell from the previous month.
Stock Movements OECD commercial oil stocks declined by 18.5 mb in December to stand at 2,678 mb. At this level, inventories were 43 mb higher than the five-year average. Crude showed a surplus of 78 mb, while product stocks remained 35 mb below the five-year average. In terms of days of forward cover, OECD commercial stocks stood at 58.6 days, 1.7 day higher than the five-year average.
Balance of Supply and Demand Demand for OPEC crude is estimated at 29.1 mb/d in 2014, unchanged from the last report. In 2015, required OPEC crude is projected at 29.2 mb/d, following an upward adjustment of 0.4 mb/d.
OPEC Monthly Oil Market Report – February 2015
1
2
OPEC Monthly Oil Market Report – February 2015
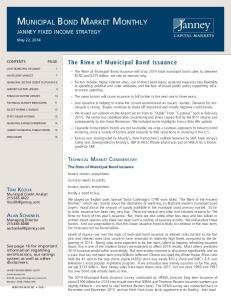
Oil demand outlook for 2015 Global oil demand in 2015 is currently anticipated to rise by 1.17 mb/d; however, developments need to be monitored closely, particularly following the sharp drop in crude oil prices seen in recent months. As prices drop, oil requirements are likely to respond positively, although this can be impacted by other factors. For example, in 2008, prices fell sharply starting in the summer with the onset of the financial crisis and the global economic recession, which also led to a deterioration in demand. This time the sharp fall in prices has been mainly driven by excess supply. As a result, lower prices are likely to help to accelerate the pace of oil demand growth this time. Other factors can also impact the degree to which any acceleration in demand takes place. In addition to economic growth, the adoption of energy policies and regulations can also influence oil requirements greatly (Graph 1). These factors tend to vary considerably from one economy to another and, as a result, their impact will also differ. A review of oil demand patterns going into 2015 bears this out. Preliminary data for US oil demand shows a continuation of the positive momentum started in 4Q14. Gasoline, in particular, remains a key driver behind the growth in US oil demand, largely a result of lower oil prices. Gasoline pump prices in the US currently average $2.07/gal, down $1.22/gal from a year earlier (Graph 2). Preliminary data for January shows another significant rise in gasoline demand of 0.70 mb/d, continuing the general positive trend seen in the previous three months. Over this period, middle distillates have largely experienced the opposite trend, with preliminary data showing y-o-y growth falling for two-consecutive months. Overall, US oil consumption has seen a noticeable rise and is expected to stay firm in the near term amid lower oil prices and as economic activities improve. US oil demand growth is forecast to be around 0.18 mb/d and could see further upward revisions as the situation continues to improve. Graph 2: US gasoline demand & retail prices, 3-month moving average % change y-o-y 60%
4%
20%
2%
0%
0%
GDP
Retail price (LHS)
Sep 14
Mar 14
Mar 13
Mar 12
Sep 12
Mar 11
Sep 11
-6%
Mar 10
-4%
-60%
Sep 10
-40%
Mar 09
-2%
Sep 09
-20%
Mar 08 Demand
% change y-o-y 6%
40%
Sep 08
% change y-o-y 8.0 6.0 4.0 2.0 0.0 -2.0
Sep 13
Graph 1: Oil demand & GDP growth in 2015
Gasoline demand (RHS)
In OECD Europe, the factors contributing to better oil demand in 2015 include the extremely low base line relative to past years, along with the slight improvement in the overall economy. Meanwhile, OECD Asia Pacific is also expected to see a contraction in 2015. A higher degree of fuel substitution in Japan, resulting from the expected re-start of some nuclear power plants, along with slower economic growth in that country, does not imply an optimistic outlook for oil demand in the region. Compared with in the OECD Americas, the positive impact of lower oil prices is expected to be minimal in the OECD Europe and Asia Pacific. As a result, total OECD is anticipated to see only a slight contraction in its oil demand growth, following a 0.28 mb/d decline last year. Among the regions, only OECD Americas is expected to see positive growth figures. In the non-OECD countries, any potential for higher oil demand growth due to lower prices is expected to come from China, India and some countries in Other Asia. Recent data from these countries suggests remarkable oil demand figures compared to a year earlier. Looking ahead, in China and India, transportation fuels are the main contributors to forecast oil demand growth. However, some downside risks exist due to rising taxes in China, as well as subsidy cuts in India and in some non-OECD Asian countries. Additionally, African oil demand is seen having some upside potential, while the outlook for FSU oil demand growth is skewed to the downside. With growth of 1.18 mb/d, non-OECD is expected to continue to contribute the highest share of oil demand growth in 2015. In light of the improvement in economic growth as well as crude oil market developments, the forecast for global oil demand growth may be subject to further upward revisions as the year progresses. OPEC Monthly Oil Market Report – February 2015
3
4
OPEC Monthly Oil Market Report – February 2015
Crude Oil Price Movements
Crude Oil Price Movements The OPEC Reference Basket (ORB) ended January down over 25% m-o-m to its lowest value in six years as global markets continued to be oversupplied and demand had yet to pick up. The ORB dropped $15.08 to $44.38/b, down $60.33 or 57.6% from a year ago. Crude oil futures continued their downward curve over the month, with both Nymex WTI and ICE Brent ending below $50/b for the first time in over five-and-a-half years. In addition to a supply glut, a record crude inventory build in the US, a strong US dollar, slowing Chinese oil demand growth and downwardly revised global economic growth have all pressured oil futures. The ICE Brent contract declined $13.51 m-o-m to $49.76/b, compared with the $107.11/b it registered in January 2014. The Nymex WTI contract lost $11.96 to reach $47.33/b, while its year-to-date value dropped by $47.43 from $94.86/b. Meanwhile, speculative bets on a rebound in oil prices increased net lengths further over the month. The Brent-WTI spread narrowed, as excess storage capacity in the US supported Nymex WTI figures. The Brent-WTI spread dropped to average $2.43/b for January.
OPEC Reference Basket Crude oil global markets tumbled again in January, for the seventh consecutive month, as a glut in oil – coupled with weak demand depressing oil prices – sent the ORB to its lowest value in six years. Crude oil prices started 2015 at a near six-year low, amid plentiful global oil supplies that have pushed oil prices down by almost 60% since June 2014, with oil demand growth yet to show signs of accelerating. The market continued to come under pressure, with crude storage at a record high in the US and production reaching a new record. Crude supplies – both sweet and sour – were plentiful in all regions in January, particularly in Europe, amid rising Iraqi and Russian exports. Over the month, several other bearish market factors helped push prices down further, including a record inventory build in the US, a strong US dollar, and slowing Chinese oil demand growth, as well as a downward revision for global economic growth. Graph 1.1: Crude oil price movement, 2014-2015 US$/b
US$/b
OPEC Basket
OPEC Monthly Oil Market Report – February 2015
WTI
02 Feb
26 Jan
19 Jan
12 Jan
05 Jan
29 Dec
22 Dec
15 Dec
40
08 Dec
40
01 Dec
50
24 Nov
50
17 Nov
60
10 Nov
60
03 Nov
70
27 Oct
70
20 Oct
80
13 Oct
80
06 Oct
90
29 Sep
90
22 Sep
100
15 Sep
100
08 Sep
110
01 Sep
110
Brent Dated
5
Crude Oil Price Movements On a monthly basis, the OPEC Reference Basket fell to an average of $44.38/b in January, down $15.08/b, or 25.4%, to its lowest value since February 2009. Compared with a year ago, the ORB value is almost 60% lower than it was in January 2014 when it reached nearly $105/b. Table 1.1: OPEC Reference Basket and selected crudes, US$/b Dec 14 59.46 60.13 57.94 63.81 61.53 61.83 58.99 58.25 59.48 51.17 62.27 53.86 62.93
Jan 15 44.38 44.47 42.58 48.51 46.76 47.98 42.84 42.31 45.51 37.96 48.41 42.26 47.91
Change Jan/Dec -15.08 -15.66 -15.36 -15.30 -14.77 -13.85 -16.15 -15.94 -13.97 -13.21 -13.86 -11.60 -15.02
Other Crudes Brent Dubai Isthmus LLS Mars Minas Urals WTI
62.53 60.25 59.74 61.90 58.15 59.95 61.53 59.50
47.86 45.57 45.52 48.81 44.76 46.37 47.03 47.29
-14.67 -14.68 -14.22 -13.09 -13.39 -13.58 -14.50 -12.21
108.26 104.01 96.35 102.79 99.58 110.60 106.40 94.90
47.86 45.57 45.52 48.81 44.76 46.37 47.03 47.29
Differentials Brent/WTI Brent/LLS Brent/Dubai
3.03 0.63 2.28
0.57 -0.95 2.29
-2.46 -1.58 0.01
13.36 5.47 4.25
0.57 -0.95 2.29
OPEC Reference Basket Arab Light Basrah Light Bonny Light Es Sider Girassol Iran Heavy Kuwait Export Marine Merey Murban Oriente Saharan Blend
Year-to-date 2015 2014 104.71 44.38 105.74 44.47 102.70 42.58 110.26 48.51 107.86 46.76 107.96 47.98 104.89 42.84 103.79 42.31 103.95 45.51 93.72 37.96 107.66 48.41 93.44 42.26 109.96 47.91
Note: Arab Light and other Saudi Arab ian crudes as well as Basrah Light preliminarily b ased on American Crude Market (ACM) and sub ject to revision. Sources: Platt's, Direct Communication and Secretariat's assessments.
Similar to the previous month, all ORB component values slipped significantly in January, following global oil benchmarks. North Sea Dated Brent and Dubai/Oman lost around $14.50/b, while US light sweet marker WTI dropped by around $12.50/b. There was no shortage of light sweet crude in Europe because of abundant Nigerian supplies, even though Libyan production declined. Slow Asia-Pacific demand due to high freight costs and low alternative crude prices capped sales of Nigerian crude to Asia. Nigeria’s crude benchmark, Qua Iboe, fell to its lowest point against Dated Brent since April 2009. An overhang of Asia-Pacific Malaysian light sweet crude and Australian condensate also slowed the eastward movement of West African supplies. Sour crudes were abundant as well in the Atlantic Basin, pressuring Mediterranean sour crude differentials amid increasing exports from Russia and Iraq, particularly earlier in the month. On the US Gulf Coast (USGC), crude differentials have fallen as the start of refinery maintenance increased inventories. US crude stocks rose as USGC refineries began to go off line for maintenance, while unplanned work at other USGC refineries further cut crude requirements. Middle East crude came under pressure, with Asia-Pacific refiners heading towards maintenance programmes. Cargoes on the spot market traded at
6
OPEC Monthly Oil Market Report – February 2015
Crude Oil Price Movements lower differentials to the Dubai marker, the deepest in five years for some, despite lower official selling prices (OSPs). Brent-related Basket components Saharan Blend, Es Sider, Girassol and Bonny Light dropped $14.74 or 23.6% in January to $47.79/b, down about $61.22 compared with a year ago. Middle Eastern spot components and multi-destination grades fell by $14.82 and $15.78, down $59.86 and $61.23 from January 2014, respectively. Latin American ORB component values dropped the least over the month; Oriente slipped $11.60 or 21.5%, while Merey dropped by $13.21 or 25.8% in January. On 6 February, the OPEC Reference Basket stood at $53.36/b.
The oil futures market Crude oil futures prices continued their downward trajectory over the month amid overflowing oil supplies and sluggish demand, with both Nymex WTI and ICE Brent ending below $50/b for the first time in over five-and-a-half years. Record-high US crude inventories also deepened worries over the global supply glut, boosted largely by robust US shale oil production. The overall level of stockpiles was at its highest since the US government began keeping weekly records in 1982, around 17% above the five-year average. In Europe, crude futures also traded lower in January as an election win for Greece's anti-austerity party heightened uncertainty in the Eurozone. The euro dropped to a near 11-year low against the US dollar, hitting dollar-denominated grades. The common currency also came under pressure after the European Central Bank said it would flood markets with over a trillion euros to prevent the Eurozone from sliding into deflation. An IMF cut in the global growth forecast for this year and weaker Chinese economic data also sent oil markets tumbling. The International Monetary Fund (IMF) cut its global growth forecast by 0.3 percentage points (pp) for both years to 3.5% for 2015 and 3.7% for 2016, as positive effects from lower oil prices are being counter-balanced by weak investment, with medium-term growth expectations facing headwinds. Growth expectations for emerging markets have been cut by 0.6 pp; Russia’s economy is expected to shrink by 3.5% this year, while China’s growth is expected to fall below 7%, the weakest growth figure in more than two decades. ICE Brent settled down $13.51 at $49.76/b for the month, while Nymex WTI lost $11.96/b to finish the month at an average of $47.33/b. Over the month, the benchmarks declined by a massive 21% and 20%, respectively. ICE Brent and Nymex WTI lost nearly 60% of their values since their peak in June 2014. Moreover, compared with 2014, Nymex WTI and Brent kicked off the year down $47.53 and $57.35 from $94.86/b and $107.11/b in January 2014, respectively. On 6 February, ICE Brent stood at $57.80/b and Nymex WTI at $51.69/b. Money managers continued to bet on a rebound in oil prices. ICE Brent net length positions increased 27,468 to 143,039 contracts during the final week in January, according to figures from the ICE Futures Europe exchange. Speculators were also bullish on the rising US crude oil market, increasing net length positions by 16,937 contracts over the month. Net long US crude futures and options positions during the month increased to 216,325 lots, US Commodity Futures Trading Commission (CFTC) data showed. Moreover, total futures and options open interest volume in the two markets increased in January by 543,889 contracts to 5.14 million lots.
OPEC Monthly Oil Market Report – February 2015
7
Crude Oil Price Movements Graph 1.2: Nymex WTI price vs. speculative activity, 2014-2015
Graph 1.3: ICE Brent price vs. speculative activity, 2014-2015
'000 Contracts
US$/b 110
400
100
350
90
300
80
250
70
200
60
150
40
100
'000 Contracts 300
120 110 100 90 80 70 60 50 40
250 200 150 100 50 0
Jan 14 Feb 14 Mar 14 Apr 14 May 14 Jun 14 Jul 14 Aug 14 Sep 14 Oct 14 Nov 14 Dec 14 Jan 15
Jan 14 Feb 14 Mar 14 Apr 14 May 14 Jun 14 Jul 14 Aug 14 Sep 14 Oct 14 Nov 14 Dec 14 Jan 15
50
US$/b
Managed money net long positions (RHS) WTI (LHS) Source: CFTC.
Managed money net long positions (RHS) ICE Brent (LHS) Source: IntercontinentalExchange, Inc.
The daily average traded volume during January for Nymex WTI contracts increased sharply by 183,929 lots to average 825,682 contracts. ICE Brent daily traded volume also rose by 237,827 contracts to 834,344 lots. The daily aggregate traded volume in both crude oil futures markets increased by 421,757 contracts, up 34%, to around 1.66 million futures contracts, equivalent to around 1.7 billion barrels of oil per day. The total traded volume in Nymex WTI and ICE Brent was up sharply at 16.51 million lots and 17.52 million contracts, respectively, over the month.
The futures market structure The contango in all markets widened further in January as ample supply surpassed demand, continuing to push the prompt month lower relative to forward months. In Europe, the Brent first-month discount to the second month increased by 57¢ to $1.10/b amid oversupply and lacklustre refinery demand, despite improved margins and lower Libyan exports. Supplies in the Atlantic Basin were high due to the greater availability of BTC blend, with February loadings at a multi-year high of 820,000 b/d. Graph 1.4: Nymex WTI and ICE Brent forward curves, 2014-2015 US$/b 70
US$/b 70
65
65
60
60
55
55
50
50
45
45
40 1FM
2FM
3FM
4FM
5FM
ICE Brent: 26 Dec 14 Nymex WTI: 26 Dec 14
6FM
7FM
8FM
9FM
10FM
11FM
40 12FM
ICE Brent: 26 Jan 15 Nymex WTI: 26 Jan 15
FM = future month.
8
OPEC Monthly Oil Market Report – February 2015
Crude Oil Price Movements Similarly in the US, the WTI contango widened by 30¢ as refineries prepared for seasonal maintenance, and some unplanned outages curbed prompt crude requirements. Meanwhile, the US shale oil supply remained robust. Ample supply continued to weigh on the Middle East crude market, widening Dubai's prompt intermonth spread into a deeper contango. Prompt Dubai has been increasingly weighed down by the wider oversupply of crude and the approaching of the spring refinery season in Asia-Pacific. The value of Dubai 1st FM was more than $3/b lower than the 3rd forward month. The steep contango in all markets has encouraged some oil market participants to store low-priced crude inland or in floating storage for later sale at higher prices, with the 12th-forward-month price more than $10 above the front month. The ICE Brent-Nymex WTI spread narrowed in January as the drop in Brent accelerated. Excess storage capacity at Cushing, Oklahoma and at the Gulf Coast for WTI – as opposed to a lack of onshore storage capacity for Brent –supported Nymex WTI crude. Capacity at Cushing and the US Gulf Coast was estimated to be at about 70 mb and 280 mb, respectively, compared with the US Department of Energy’s most recent crude inventory estimate of around 41 mb and 206 mb, respectively. Meanwhile, the narrowing spread initiated a comeback for imported light sweet crude from the Atlantic Basin. The prompt ICE Brent/Nymex WTI spread narrowed to $2.43/b on average in January from $3.98/b in December. Table 1.2: Nymex WTI and ICE Brent forward curves, US$/b Nymex WTI 26 Dec 14 26 Jan 15
1st FM 54.73 45.15
2nd FM 55.13 45.88
3rd FM 55.59 46.93
6th FM 57.14 50.14
12th FM 60.47 54.46
26 Dec 14 26 Jan 15
1st FM 59.45 48.16
2nd FM 60.22 49.38
3rd FM 61.07 50.63
6th FM 63.52 53.99
12th FM 67.16 58.38
ICE Brent
FM = future month.
The light sweet/medium sour crude spread Sweet/sour differentials widened in Asia and on the USGC, while in Europe the spread narrowed. In Asia, the sweet/sour spread, represented by the Tapis/Dubai spread, widened further over the month, supported by a relatively firm light sweet crude market as arbitrage volumes from West Africa were limited amid a continuing narrower Brent/Dubai spread and high freight costs. Meanwhile, prompt Dubai has been increasingly weighed down by oversupply, which caused the Dubai contango to drop to its deepest level in more than six years. The Tapis premium over Dubai increased 46¢ to $6.69/b in January. In Europe, the Urals medium sour crude discount against light sweet Dated Brent narrowed by about 20¢ to 80¢/b in the Mediterranean amid a lower Urals export programme after deliveries were hit by bad weather. Strong margins and demand from outside the region also were also supportive of Urals. The average Mediterranean refiner made around $6/b processing Urals. Iraq's southern oil exports have slipped in January from a record high as shipping delays put the brakes on supply expansion. Meanwhile, North Sea Dated Brent was under pressure as refinery buyers stayed away and VLCC fixtures to take oil out of the region were limited. Demand from European refiners was weak, despite strong refining margins. North Sea supply was also ample.
OPEC Monthly Oil Market Report – February 2015
9
Crude Oil Price Movements In the USGC, the Light Louisiana Sweet (LLS) premium over medium sour Mars widened by about 30¢ to around $4.05/b. Meanwhile, US Gulf crudes came under pressure as inventories increased and more competition arose from imports, while refinery runs were down due to maintenance season. Earlier in the month, LLS traded at near 2008 lows on the USGC as some refiners tried to take advantage of competitive prices. The move came after oil firms lined up ships to take at least 10 mb of West African crude to North America. Graph 1.5: Brent Dated vs. Sour grades (Urals and Dubai) spread, 2014-2015 US$/b
US$/b
Dubai
10
02 Feb
26 Jan
19 Jan
12 Jan
05 Jan
29 Dec
22 Dec
15 Dec
08 Dec
01 Dec
24 Nov
17 Nov
-4
10 Nov
-4
03 Nov
-2
27 Oct
-2
20 Oct
0
13 Oct
0
06 Oct
2
29 Sep
2
22 Sep
4
15 Sep
4
08 Sep
6
01 Sep
6
Urals
OPEC Monthly Oil Market Report – February 2015
Commodity Markets
Commodity Markets In January, energy commodities continued their declining trend, driven mainly by the steep fall in crude oil prices. Non-energy commodities were also down, with broad-based declines in both base metals and agricultural commodities. However, precious metals showed their best performance in the last twelve months on declining interest rates across major economies.
Trends in selected commodity markets Dollar-denominated commodities were further under pressure after the European Central Bank (ECB) decision to start an asset purchase programme which translated into a sharp appreciation of the US dollar. It rose by 3.1% based on the Geneva I + US dollar basket 1. Meanwhile, precious metals reacted positively to both the low interest rate environment and the currency market volatility resulting from the Swiss National Bank’s decision to end its currency peg to the euro. Base metal prices, on the other hand, have been under pressure by continuing softness in manufacturing prospects and low energy prices. The purchasing managers’ index (PMI) for manufacturing showed slight m-o-m recoveries in January in the Euro-zone (51.0 vs. 50.6), Japan (52.2 vs. 52.0) and China (49.8 vs. 49.5). The US reading showed positive, but slowing prospects, with the manufacturing PMI at 53.7 vs. 55.5. Copper prices experienced their largest monthly decline since 2011, as a large increase in inventories on the London Metal Exchange (LME) and the continuing decline of new home prices in China, as reported by the country’s National Bureau of Statistics (NBS), suggest excess supply. Agricultural prices declined on improving weather in South America, as well as receding concerns over supply disruptions and an estimation from the US Department of Agriculture (USDA) of large ending stocks for several crops. Wheat declined sharply, reversing previous monthly gains, with current global supplies considered adequate, in spite of potential export restrictions from major exporter Russia. Corn prices declined as well, as lower ethanol prices translated into declining margins for ethanol producers. Soybeans declined again in January due to improving weather conditions for Brazilian crops and the USDA’s forecast of record global production. Energy prices were down for the month of January, primarily due to the sharp decline in crude oil resulting from continuing oversupply and a strengthening of the US dollar. Natural gas prices in Europe declined on the lagging effect of lower crude prices over term contracts, as well as mild weather condition and inventories at the end of January, which were 14% larger than a year ago in absolute terms, according to data from Gas Infrastructure Europe. In the US, gas prices declined due to smaller withdrawals from inventories on stable dry gas production and warmer-than-normal temperatures. In the short-term, the monetary stimulus measures adopted by the ECB and the Bank of Japan, and the potential start of monetary policy normalization by the US Federal Reserve around mid-year, could provide support for current levels of the US dollar, thereby maintaining a source of weakness in commodity prices. Milder-than-expected weather conditions in the US and Europe could further weaken natural gas prices, while wetter weather in South America could translate into a larger-than-expected crop production, further dampening agricultural prices. 1
The ‘modified Geneva I+US$ basket’ includes the euro, the Japanese yen, the US dollar, the pound sterling and the Swiss franc, weighted according to the merchandise imports of OPEC Member Countries from the countries in the basket.
OPEC Monthly Oil Market Report – February 2015
11
Commodity Markets Table 2.1: Commodity price data, 2014-2015 Monthly averages Commodity
% Change
Unit Nov 14
Dec 14
Jan 15
Nov/Oct
Dec/Nov
Jan/Dec
96.4 62.6 77.0 4.1 93.5 98.3 103.0 486.0 830.0 449.0 98.0 178.7 258.7 0.4 90.4 2,055.6 6,712.9 74.0 2,030.2 15,807.1 20,033.5 2,253.2
78.5 62.4 60.7 3.4 91.3 96.8 101.5 468.0 820.0 446.0 99.6 178.7 269.6 0.3 86.3 1,909.5 6,446.5 68.0 1,938.1 15,962.1 19,829.7 2,175.8
63.0 62.1 47.1 3.0 88.4 94.7 98.9 452.0 802.0 424.0 96.8 174.7 248.5 0.3 80.1 1,814.7 5,830.5 68.0 1,843.1 14,849.2 19,454.1 2,113.1
-9.2 -1.8 -10.6 8.7 0.3 0.3 2.3 5.9 -0.6 5.9 5.5 9.6 5.4 -3.3 1.6 5.6 -0.4 -8.6 -0.2 0.0 1.0 -1.0
-18.5 -0.2 -21.2 -16.3 -2.4 -1.5 -1.5 -3.7 -1.2 -0.7 1.7 0.0 4.2 -5.3 -4.6 -7.1 -4.0 -8.1 -4.5 1.0 -1.0 -3.4
-19.8 -0.5 -22.4 -13.4 -3.2 -2.2 -2.5 -3.4 -2.2 -4.9 -2.9 -2.3 -7.9 0.1 -7.1 -5.0 -9.6 0.0 -4.9 -7.0 -1.9 -2.9
1,175.3 16.0
1,200.6 16.3
1,250.8 17.2
-3.9 -7.0
2.2 2.1
4.2 5.8
World Bank commodity price indices (2010 = 100)
Energy Coal, Australia Crude oil, average Natural gas, US Non Energy Agriculture Food Soybean meal Soybean oil Soybeans Grains Maize Wheat, US, HRW Sugar, world Base Metal Aluminum Copper Iron ore, cfr spot Lead Nickel Tin Zinc Precious Metals Gold Silver
$/mt $/bbl $/mmbtu
$/mt $/mt $/mt $/mt $/mt $/kg $/mt $/mt $/dmtu $/mt $/mt $/mt $/mt $/toz $/toz
Source: World Bank, Commodity price data.
Average energy prices in January decreased by 19.8% m-o-m, due to a 22.4% m-o-m decrease in crude oil after larger inventory build-ups in the US and a further appreciation of the US dollar. Natural gas prices also declined during the month in the US by 13.4% m-o-m, while average import prices decreased in Europe by 5.9%. Agricultural prices decreased by 2.2% due to a 2.5% decrease in food, a 2.3% decrease in beverages and a 1.2% drop in raw materials. Due to improving prospects for the Brazilian crop, soy complex prices dropped with soybeans, soybean oil and soymeal, declining by 4.9%, 2.2% and 3.4%, respectively. Grains reversed the gains achieved the previous month with wheat declining by 7.9%, as previous concerns about Russian export curbs were downplayed by market participants in view of strong production elsewhere. Maize dropped by 2.3% due to declining margins for ethanol producers. Base metals decreased by 7.1% m-o-m with declines among all group components. Copper experienced a large decline of 9.6% on a steep increase in inventories. Aluminium decreased by 5% m-o-m while nickel declined by 7% in broad selling on weak manufacturing and a soft property market in China, and due to the effect of lower energy prices. Precious metals increased by 4.4% in January. Average gold prices increased by 4.2% m-o-m, in response both to declining interest rates across major economies, as central banks respond to low inflation, and the Swiss National Bank’s decision to unpeg the Swiss franc from the euro, which created significant volatility in the currency markets. Silver prices increased by 5.8% m-o-m.
12
OPEC Monthly Oil Market Report – February 2015
Commodity Markets Graph 2.1: Inventories at the LME '000 Tonnes
'000 Tonnes
6,000
5,500
5,500
5,000
5,000
Jan 15
Oct 14
Jul 14
Jun 14
Apr 14
Jan 14
Dec 14
6,000
Nov 14
6,500
Sep 14
6,500
Aug 14
7,000
May 14
7,000
Mar 14
7,500
Feb 14
7,500
Sources: London Metal Exchange and Haver Analytics.
In January, the Henry Hub natural gas price decreased after smaller-than-average withdrawals from inventories. The average price decreased by 46¢, or 13.4%, to $2.97 per million British thermal units (mmbtu) after trading at an average of $3.43/mmbtu the previous month. The US Energy Information Administration (EIA) said utilities withdrew 115 billion cubic feet (Bcf) of gas from storage during the week ending 30 January. This was below market expectations of a 122 Bcf decrease. Total gas in storage stood at 2,428 Bcf, which is 23.9% higher than the previous year, but 1.2% below the latest five-year average. Last month it was 2.4% below that average. The EIA noted that temperatures were warmer-than-normal during the week, which softened demand. Graph 2.2: Major commodity price indices, 2013-2015 Index 150
Index 150 125
125
100
100
75
75 Base year 2010 = 100
Energy
Non-energy
Agriculture
Base metals
HH natural gas
Gold
Jan 15
Dec 14
Oct 14
Nov 14
Sep 14
Aug 14
Jul 14
Jun 14
May 14
Apr 14
Mar 14
Feb 14
Jan 14
Dec 13
Nov 13
Oct 13
Sep 13
Aug 13
Jul 13
Jun 13
May 13
Apr 13
Mar 13
Feb 13
50
Jan 13
50
Food
Source: World Bank, Commodity price data.
OPEC Monthly Oil Market Report – February 2015
13
Commodity Markets
Investment flows into commodities The total open interest volume (OIV) in major US commodity markets increased to 8.4 million contracts in January, with the OIV increasing by 10.2% for crude oil, 2.1% for agriculture, 13.1% for copper, 10.0% for precious metals and 5.4% for natural gas. Meanwhile, OIV declined by 6.7% for livestock. Graph 2.3: Total open interest volume '000 contracts
'000 contracts
Jan 15
Dec 14
Jan 14
Nov 14
7,000
Oct 14
7,000
Sep 14
7,500
Aug 14
7,500
Jul 14
8,000
Jun 14
8,000
May 14
8,500
Apr 14
8,500
Mar 14
9,000
Feb 14
9,000
Source: US Commodity Futures Trading Commission.
Total speculative net length positions in select commodities decreased by 5.7% m-o-m to 771,710 contracts in January due to decreases in net length for crude oil, agriculture and livestock, and increases in net shorts for natural gas and copper. Net length also increased for precious metals. Agricultural OIV was up 2.1% m-o-m to 4,546,080 contracts in January. Meanwhile, the net length positions of money managers in agriculture decreased by 10.5% to 360,947 lots, reversing the upward momentum registered in the last quarter of 2014. Henry Hub natural gas OIV increased by 5.4% m-o-m to 990,330 contracts in January. Money managers increased their net short positions by 52.3% to reach 43,809 lots on smaller-than-average withdrawals from storage. Graph 2.4: Speculative activity in key commodities, net length '000 contracts
'000 contracts
Agriculture
Gold
WTI
Natural gas
Livestocks
Jan 15
Dec 14
-100
Nov 14
-100
Oct 14
100
Sep 14
100
Aug 14
300
Jul 14
300
Jun 14
500
May 14
500
Apr 14
700
Mar 14
700
Feb 14
900
Jan 14
900
Copper
Source: US Commodity Futures Trading Commission.
14
OPEC Monthly Oil Market Report – February 2015
Commodity Markets Copper OIV increased by 13.1% m-o-m to 175,374 contracts in January. Money managers doubled their net short positions to 10,490 contracts from 5,022 lots the previous month. Graph 2.5: Speculative activity in key commodities, as% of open interest %
%
40
40
30
30
20
20
10
10
0
0
Agriculture
WTI
Gold
Livestocks
Jan 15
Dec 14
Nov 14
Oct 14
Sep 14
Aug 14
Jul 14
Jun 14
Apr 14
Feb 14
Jan 14
May 14
-10
Mar 14
-10
Copper
Natural gas
Source: US Commodity Futures Trading Commission.
Gold OIV increased by 11.6% m-o-m to 416.134 contracts in January. Money managers increased their net long positions by 42.3% to 119,678 lots due to declining interest rates among major economies. Table 2.2: CFTC data on non-commercial positions, ‘000 contracts Open interest
Crude oil Natural gas Agriculture Precious metals Copper Livestock Total
Net length
Dec 14
Jan 15
Dec 14
% OIV
Jan 15
% OIV
1,449 939 4,454 522 155 553 8,073
1,598 990 4,546 574 175 516 8,400
202 -29 403 102 -5 145 819
14 -3 9 20 -3 26 10
201 -44 361 152 -10 113 772
13 -4 8 26 -6 22 9
Source: US Commodity Futures Trading Commission.
Graph 2.6: Inflow of investment into commodities, 2012-2014 US$ bn 140 120 100 80 60 40 20 0 1Q
2Q
3Q
4Q
1Q
2Q
2012 Agriculture
3Q
4Q
1Q
2013 Copper
Gold
2Q
3Q
4Q
2014 Natural gas
WTI crude oil
Source: US Commodity Futures Trading Commission.
OPEC Monthly Oil Market Report – February 2015
15
World Economy
World Economy While the global economic recovery continues, many uncertainties prevail. The growing importance of monetary policies, continuing high debt levels in some key economies, and various structural deficiencies, mainly in emerging and developing economies, have all contributed to a rising complexity in the global economy. Recent volatility across various asset classes including commodities has highlighted this situation. Taking into account these issues, as well as the ongoing challenges in emerging and developing economies, the 2015 GDP growth forecast has been revised down to 3.4% from 3.6%, with the OECD growth forecast for both 2014 and 2015 unchanged at 1.8% and 2.2%, respectively. However, recent indicators in the US were weaker than expected and will need to be monitored carefully in the coming months. The situation in Japan also remains challenging. The Euro-zone economies, although improving, continue to deal with a variety of issues. Although lower oil prices could theoretically turn out to be an additional source of support for global economic growth, their negative effects in oil producing countries seem to be offsetting their positive effects in consumer countries in the current year. Moreover, China’s latest lead indicators point at possible lower growth in 2015, which has led to a 0.2 percentage point (pp) revision to GDP growth putting it at 7%. India, on the other hand, is forecast to provide some room to the upside and has thus been revised up to 6.0% from 5.8% for 2015. Meanwhile, growth in Brazil and Russia is currently seen as lagging behind the global momentum. Russia’s 2015 GDP growth forecast has been revised down to -2.4% from 0% and Brazil’s 2015 growth forecast now stands at 0.7% compared to 1% in the previous month. Table 3.1: Economic growth rate and revision, 2014-2015, % World
OECD
US
Japan Euro-zone
China
India
Brazil
Russia
2014E*
3.2
1.8
2.4
0.2
0.9
7.4
5.5
0.2
0.3
Change from previous month
0.0
0.0
0.0
0.0
0.0
0.0
0.0
0.0
0.0
2015F*
3.4
2.2
2.9
1.2
1.2
7.0
6.0
0.7
-2.4
Change from previous month
-0.2
0.0
0.0
0.0
0.0
-0.2
0.2
-0.3
-2.4
* E = estimate and F = forecast.
OECD OECD Americas US The positive growth trend in the US continues, but most recent indicators suggest that the strong growth seen in the 2Q and the 3Q of 2014 is unlikely to be maintained. After a seasonally adjusted annualized rate (SAAR) of 4.6% q-o-q in the 2Q and a SAAR of 5% q-o-q in the 3Q of last year, the first estimated GDP growth rate for the last quarter in 2014, as provided by the Bureau of Economic Analysis, stood at a SAAR of 2.6% q-o-q. While this is still a solid number, it ties into many of the slightly weakening indicators of recent months. Industrial production, manufacturing orders and retail sales were all declining in December, which came as a surprise to many observers. This will need close monitoring in the coming months to see if these declines were merely
16
OPEC Monthly Oil Market Report – February 2015
World Economy temporary dips or if there are some more serious underlying challenges. One issue that emerged in the past several months was the low earnings growth within the labour market, with average monthly earnings in December declining by 0.2% m-o-m, the first decline since March 2014. However, the considerable rebound of 0.3% m-o-m in January, may suggest that this was a temporary dip. In general, the US economy is improving, supported by the ongoing positive trends in job creation, rising house and equity prices, and other income-related factors that in the past year have led to rising consumption. This remains the most important driver of US economic growth. Depending on further developments in the earnings situation, rising private household consumption is forecast to lead to rising GDP growth in the current year. Personal consumption has stood at a SAAR of 3.2% q-o-q in the 3Q and 4.3% in the 4Q of last year. This could be taken as a positive sign of growth in 2015. In its most recent Federal Open Market Committee (FOMC) statement, in which it sets out its decision on future monetary policy, the US Federal Reserve (Fed) has become more upbeat. The statement notes that the US economy is expanding at a solid pace and that labour market improvements are strong. It also notes that relatively lower energy prices are acting as a supportive factor for consumer spending. While these observations might lead to an interest rate increase at about mid-year, the current disinflationary trend and recently declining earnings growth – as well as falling lead indicators and output numbers – are all aspects that will be taken into consideration before any decision is made. In addition, as in the past, after this latest meeting the Fed has noted that it will also continue to observe international economic developments and consider the possible impact of an interest rate increase on the global economy before taking a final decision. Among these international developments is the swift rise of the US dollar against other major currencies, which would negatively impact US exports. The labour market has significantly improved over the past months and the latest batch of data confirms this trend. While the unemployment rate increased slightly to 5.7% in January, non-farm payrolls grew by a stronger-than-expected 257,000 in January, after upwardly revised 329,000 non-farm jobs from December. The share of long-term unemployed declined to 31.5% in January and also the participation rate improved, rising to 62.9%. Moreover, seasonally adjusted hourly earnings recovered somewhat in January, growing by 2.0% y-o-y, comparing to 1.9% in December. On a monthly base earnings improved by 0.3% m-o-m, compared to the December decline of 0.2% m-o-m. The housing market continues to recover and while the pace of the recovery was slowing in the past months, the rise in prices in November – the latest available data point – has been even higher at 5.3% y-o-y compared to October, when the rise in prices stood at 4.4% y-o-y, as reported by the Federal Housing Finance Agency. Existing home sales have also continued improving in December, growing by 3.5% y-o-y after a November level of 1.9% y-o-y. Consumer confidence rose to a new record high of 102.9 in January, compared to 93.1 in December, based on the index provided by the Conference Board. A sign of deceleration, however, was apparent in the purchasing manager’s index (PMI) for the manufacturing sector, as provided by the Institute of Supply Management (ISM), which fell to 53.5 in January from 55.1 in December. The PMI for the services sector, which contributes more than 70% to the economy, edged up slightly to 56.7 in January from 56.5 in December.
OPEC Monthly Oil Market Report – February 2015
17
World Economy Graph 3.1: Manufacturing and non-manufacturing ISM indices Index 60 56.7 55 53.5 50
ISM manufacturing index
Jan 15
Dec 14
Nov 14
Oct 14
Sep 14
Aug 14
Jul 14
Jun 14
May 14
Apr 14
Mar 14
Feb 14
45
ISM non-manufacturing index
Sources: Institute for Supply Management and Thomson Reuters.
Given the latest signals from output and lead indicators that the depth of the recovery in the current year remains, to some extent, uncertain, the GDP growth forecast for 2015 remains unchanged at 2.9%. However, this year‟s growth forecast is already at a much higher level than the final growth estimate of 2.4% in 2014, as provided by the Bureau of Economic Analysis.
Canada In Canada, improvements continue along with the US, its most important trading partner. However, there may be some negative impact from the energy industry, given the recent decline in energy prices. Industrial production growth in November – the latest available data point – has decelerated to 2.3% y-o-y from 3.1% y-o-y in October. Meanwhile, mining, oil and gas extraction have also receded to 4.2% in November from 5% in October. A similar slowing trend was visible in all other major sectors as well. The PMI for manufacturing in January also indicated a slow-down, falling from 53.9 in December to 51 in January. While this year‟s expansion continues at a slower pace, the 2015 GDP growth forecast has been revised to 2.3% from 2.4% in the previous month, now standing at a slightly lower level than the 2014 growth estimate of 2.4%.
OECD Asia-Pacific Japan While the government, together with the Bank of Japan (BoJ), continues with its stimulus programme after December‟s snap elections, the latest output data has not been entirely supportive of this policy. Exports, which constitute an important economic driver for the economy, have continued to grow at higher rates, but domestic demand has decelerated and industrial production has expanded at a very low pace. More importantly, manufacturing orders have remained negative for three consecutive months in November. All this points at a still challenging situation, after GDP in the 3Q and the 2Q of last year had already declined significantly. Growth in the 2Q14 was down by a SAAR of 6.7% q-o-q and in the 3Q fell by 1.9% q-o-q. Inflation remains at a low level and even though the sales tax increase of last April artificially pushed total inflation up above 2%, it now stands at 2.4% y-o-y. However, if the effect of the sales tax increase is excluded, then it is only around 0.5% y-o-y. Since this effect will no longer be considered in the yearly comparison starting in April, low inflation will again become an important issue. The government has been very clear
18
OPEC Monthly Oil Market Report – February 2015
World Economy about its aim of achieving, together with the policy of the BoJ, inflation of around 2%, this now seems extremely challenging, especially when considering the much lower energy prices this year. Given this latest development, the government‟s structural reforms – the „third arrow‟ of its ongoing policy measures, in addition to fiscal and monetary stimulus – will be even more important. In particular, structural reform of the relatively inflexible labour market could be a supportive factor that could make positive developments more sustainable. In addition, improvements in the budget deficit are expected this year given last year‟s sales tax increase. Declining energy prices, while negatively impacting inflation, are also a positive factor contributing to the economy‟s lower import bills. A very important aspect related to total inflation is earnings growth, which is still clearly below November‟s CPI increase of 2.4%. The spending ability of private household has continuously declined over the past months. While this situation is forecast to improve this year, it will continue to need close monitoring. Beside the domestic issues, external trade has improved. But as the performance of Japan‟s most important Asian trading partner – China – continues decelerating, the overall situation remains somewhat uncertain. The domestic demand situation has improved over the last several months. It is expected to continue to do so, despite some ongoing fragility. Retail trade increased by only 0.2% y-o-y in December, lower than November‟s increase of 0.4% y-o-y and October‟s rise of 1.4%. Exports improved in December, rising by 12.8% y-o-y. This was significantly higher than in November, when an increase of 4.9% y-o-y was recorded. Moreover, industrial production remained sluggish on a yearly comparison, rising by only 0.3% y-o-y. This was, however, a significant improvement from the 3.7% y-o-y decline in November. Graph 3.2: Japanese retail trade
Graph 3.3: Japanese PMI indices Index
% change y-o-y
58
56
Manufacturing PMI
54
0.2%
52.2
52
51.3
50 48
Sources: Ministry of Economy, Trade and Industry and Haver Analytics.
Services PMI
46
Jan 14 Feb 14 Mar 14 Apr 14 May 14 Jun 14 Jul 14 Aug 14 Sep 14 Oct 14 Nov 14 Dec 14 Jan 15
Dec 13 Jan 14 Feb 14 Mar 14 Apr 14 May 14 Jun 14 Jul 14 Aug 14 Sep 14 Oct 14 Nov 14 Dec 14
12% 10% 8% 6% 4% 2% 0% -2% -4% -6%
Sources: Markit, Japan Materials Management Association and Haver Analytics.
The PMI numbers, as provided by Markit, show that manufacturing in January improved slightly to 52.2 from 52 in December. Also, the important services sector remained at a solid level of 51.3, although this is lower than the 51.7 level reached in December. While Japan continues its recovery, the near-term effects of its monetary stimulus programme will need close monitoring. Due to the considerable decline in the 2Q and the 3Q of 2014, in combination with the most recent weaknesses, growth expectations
OPEC Monthly Oil Market Report – February 2015
19
World Economy for 2014 remain at 0.2%. Given the stimulus measures in place, expectations of a recovery remain unchanged for 2015 and the growth forecast remains at 1.2%.
South Korea The South Korean economy continues to grow at a solid pace, while slightly decelerating, as it is also impacted by conditions in its most important trading partners in the Asia region. GDP in the 4Q14 stood at 2.8% y-o-y, marking the fifth consecutive quarterly slow-down in GDP growth. In the 3Q, growth was 3.3% y-o-y. Export growth also slowed in January to only 1.5% y-o-y, after a surge in December of 8.2% y-o-y. Economic developments in the last quarter of 2014 confirmed the 2014 growth estimate of 3.4%. The growth forecast of 2015 also remains unchanged at 3.4%.
OECD Europe Euro-zone While the Euro-zone‟s economic situation has continued improving in the past months, new and ongoing challenges have again come to the surface. After the latest general elections, Greece is currently at the forefront of economic discussions in the Euro-zone. The deflationary trend has also become more pronounced and banking sector related issues remain. Hence, there is still some uncertainty that the recently announced bold measures of the European Central Bank (ECB) to increase monetary supply and support real economic growth will be successful. In addition to these concerns, growth in Italy – the Euro-zone‟s third largest economy – remains weak, while France has provided only anaemic growth in the 3Q14 and industrial output numbers remain negative. Germany‟s growth dynamic has also slowed down recently. Positively, the fiscal and monetary stimulus programmes in the Euro-zone should support growth this year and it is expected that they will have a positive impact. The magnitude of this, however, remains to be seen. The European Commission has announced an infrastructure spending plan in the size of €315 billion over three years from 2015 to 2017. As most of the funding should be provided by private investors, the progress will need to be carefully monitored. The monetary stimulus measures that have recently been announced by the ECB are even larger. The aim of the ECB is to increase its balance sheet up to around €3 trillion from the current level of around €2 trillion. This plan foresees buying €60 billion of bonds per month up to September 2016, starting in March this year. These purchases will be carried out in any case until the ECB‟s Governing Council sees a sustained adjustment in the path of inflation that is consistent with its aim of achieving inflation rates below, but close to, 2% over the medium-term. European banks have already highlighted the fact that due to the tight capital rules now being applied for new business in the sector, the quantitative easing programme might not be as effective as originally envisaged. The most recently published inflation number of minus 0.6% y-o-y in January – again lower than the already negative December level of minus 0.2% y-o-y – highlights the fact that the ECB needs to lift inflation to more reasonable levels. While this low inflation is mainly influenced by the peripheral economies, larger economies and those economies that have in the past few months shown a higher level of inflation are all now facing a significant disinflationary trend. Germany‟s inflation turned negative to -0.3% y-o-y in January. While the situation for the banking sector in the Euro-zone remains challenging, some positive trends have become visible over the last several months. Credit supply from financial intermediaries has shown a positive trend since the end of 2013 and while
20
OPEC Monthly Oil Market Report – February 2015
World Economy transmission channels still seem to be somewhat impaired, the decline in loan growth was limited to only -0.4% in December. So while some modest improvements have become apparent, the legacies of the 2007/2008 global crises are still obvious in the Euro-zone. The unemployment rate remains at a high level of 11.4%, although this is the best level in more than two years. Youth unemployment still stands at 23%, with the highest level in Spain at 51.4%. In general, while the situation remains fragile, the recent PMI numbers point at a continuation of modest growth levels. The latest PMI for manufacturing, as provided by Markit, has improved slightly. It increased to 51 in January from 50.6 in December. The PMI for the important services sector increased as well to 52.7 in January from 51.6 in December. Graph 3.5: Euro-zone consumer price index and lending activity % change y-o-y
50
Jan 14 Feb 14 Mar 14 Apr 14 May 14 Jun 14 Jul 14 Aug 14 Sep 14 Oct 14 Nov 14 Dec 14 Jan 15
49
Sources: Markit and Haver Analytics.
0%
-2%
-1%
-4%
CPI (LHS)
Jan 15
51.0
0%
Jul 14
Manufacturing PMI
1%
Jan 13
51
2%
Jul 12
52
2%
Jan 12
52.7
4%
Jul 11
53
3%
Jul 10
Services PMI
6%
Jan 11
54
% change y-o-y
4%
Jan 10
55
Jan 14
Index
Jul 13
Graph 3.4: Euro-zone PMI indices
MFI lending (RHS)
Sources: Statistical Office of the European Communities, European Central Bank and Haver Analytics.
While the recovery in the Euro-zone has improved compared to last year, the recovery obviously remains fragile. Therefore, the GDP growth estimate for 2014 remains unchanged at 0.9%, while the 2015 forecast has also been kept at the previous month‟s level of 1.2%.
UK The United Kingdom’s economy continues recovering. Lead indicators point at an ongoing solid momentum, while the 4Q14 GDP number has underscored a slight softening of the strong growth momentum that became apparent in the 1H14. GDP growth in the 4Q14 stood at a SAAR of 2% q-o-q, the lowest level in 2014. Therefore, yearly 2014 growth stood at 2.6%, slightly lower than the expected 2.9% GDP growth rate. The PMI for manufacturing showed a slight uptick in January, moving to 53.0 from 52.7 in December. Even the services sector PMI moved to 57.3 from 55.9 in December. Given the slowdown at the end of last year, the forecast still remains unchanged at 2.5%.
OPEC Monthly Oil Market Report – February 2015
21
World Economy
Emerging and Developing Economies In Brazil, the consumer confidence index fell to 93.1 in January, its lowest ever level. Inflationary pressures and an increase in interest rates are badly hurting consumer sentiment. Meanwhile, the manufacturing sector indicated that output and new orders in January rose simultaneously for the first time in ten months. Inflation is expected to rise particularly on higher fuel taxes. The GDP growth forecast now stands at 0.2% and 0.7% in 2014 and 2015, respectively. In Russia, the greatest decline in the value of exports in five years has resulted in the trade surplus narrowing 21.4% y-o-y to $13.4 billion in November 2014. Signs of a contraction in Russia‟s manufacturing sector have become more visible with the manufacturing PMI slumping to a 67-month low in January. The currency depreciated more than 50% in the past three months and nearly 68% since July 2014. Sanctions and a decline in export revenues are both anticipated to hit GDP badly in 2015. Yet significantly lower imports, together with efforts to substitute the imports that are expected in 2015 are likely to offset part of the impact. The GDP is forecast to contract 2.4% in 2015, although Russia‟s economy ministry recently forecast an economic contraction of 3% this year. The way foreign reserves will be utilized in the coming months could also affect the country‟s economic performance in either direction. India’s economic growth picked up in 2014, accelerating to 5% on an expenditure basis from 4.7% in 2013. Encouragingly, in the first three quarters of 2014, y-o-y growth averaged 5.2%. But it seems there was greater improvement in India‟s GDP growth rate in the 4Q14 and expectations for 2014 have remained unchanged at 5.5%. For 2015, expectations for GDP growth have been revised up to 6.0% from 5.8%. This has been driven by strong fundamentals, notably high savings and investment rates. The Reserve Bank of India (RBI) cut the repo rate by 25 basis points (bp) to 7.75% and room may still open up for another 25 bp cut later in the year. China’s GDP growth of 7.4% in 2014 was the slowest for the past quarter century, but the slowdown still has some way to go. China‟s official 4Q14 GDP figures show that on a y-o-y basis, growth was 7.3%, the same as in the previous quarter. As a result, fullyear 2014 growth was 7.4% y-o-y, compared to 7.7% in 2013. Notably, the country is delaying meaningful implementation of some major budget items. Growth expectations for 2015 have been revised down to 7% from 7.2%. Many observers are already talking of annual 7% growth in China as the „new normal‟. But growth is unlikely to maintain even this pace for long. In the „flash‟ reading for January, China‟s Manufacturing PMI rose to 49.8 from 49.6 in December. Table 3.2: Summary of macroeconomics performance of BRIC countries GDP growth rate 2014E* 2015F* Brazil Russia India China
0.2 0.3 5.5 7.4
0.7 -2.4 6.0 7.0
Consumer price index, % change y-o-y
Current account balance, US$ bn
Government fiscal balance, % of GDP
Net public debt, % of GDP
2014
2015
2014
2015
2014
2015
2014
2015
6.3 7.7 7.2 2.1
6.7 11.8 6.2 1.8
-88.5 49.5 -42.0 247.0
-80.0 85.3 -42.8 254.7
-5.5 0.4 -4.3 -3.0
-4.8 -0.9 -4.1 -3.2
63.3 7.2 51.2 16.8
64.9 7.5 49.6 18.8
Sources: OPEC Secretariat, Consensus Economics, Economic Intelligence Unit, Financial Times and Oxford. * E = estimate and F = forecast.
22
OPEC Monthly Oil Market Report – February 2015
World Economy
Brazil The Ministry of Finance announced plans to raise taxes on fuel, imports, credit and cosmetics in 2015, aiming to narrow the budget deficit and restore confidence among investors. The short-term effect of this policy is expected to dampen consumption and lower growth. The inflation rate declined to 6.4% in December 2014 from 6.6% in the previous month, returning to the central bank‟s target range for the first time in five months. Inflation is expected to rise particularly on higher fuel taxes. In December, the trade surplus narrowed 89% y-o-y to $293 million, and in January, the central bank increased its key interest rate by 50 bp to 12.25%. This represents the third consecutive hike, aiming to curb stubbornly high inflation, and brings the rate to its highest level since mid-2011. Exports shrank 19.9% to $17.49 billion while imports fell 9.8% to $17.2 billion, the lowest level since February of 2013. Exports declined more than imports in 2014 resulting in the biggest annual trade deficit since 1998. In 2014, exports contracted by 7% y-o-y to $225.1 billion, as the prices of most commodities decreased. Sales to China contracted 11.8% and those to Argentina shrank 27.2%. In contrast, shipments to the United States rose 9%. Imports decreased by 4.4% in 2014 to $229.03 billion.
Sources: Banco Central do Brasil, Instituto Brasileiro de Geografia e Estatística and Haver Analytics.
Jan 15
Aug 14
Oct 13
Mar 14
National consumer price index (LHS) Selic rate (RHS)
93.1
May 13
10
Jan 14 Feb 14 Mar 14 Apr 14 May 14 Jun 14 Jul 14 Aug 14 Sep 14 Oct 14 Nov 14 Dec 14 Jan 15
5.0
Jul 12
11
5.5
115 110 105 100 95 90 85 Dec 12
6.0
Feb 12
12
125 120
Sep 11
6.5
13 12.3 6.2
Apr 11
7.0
Index 130
Jun 10
% per annum
Nov 10
% change y-o-y
Graph 3.7: Brazilian consumer confidence index
Jan 10
Graph 3.6: Brazilian inflation vs. interest rate
Sources: Fundação Getúlio Vargas and Haver Analytics.
The manufacturing sector indicated that output and new orders in January rose simultaneously for the first time in ten months, leading to a quicker improvement in operating conditions. The HSBC manufacturing PMI improved modestly to 50.7 in January, up from 50.2 in December. The survey showed an increase in production for the first time in five months, as well as a rise in new orders and stagnant employment in the sector. The unemployment rate decreased to 4.3% in December 2014 from 4.8% in the previous month, below market expectations. Considering all of 2014, the unemployment rate was recorded at 4.8%, the lowest level on record (it was 5.4% in 2013). In January, consumers were less optimistic about the current economic situation and their prospects for the future, which they saw as worse when compared to the previous month. The consumer confidence index fell to 93.1 in January, its lowest ever level. Inflationary pressures and an increase in interest rates are badly hurting consumer sentiment. The GDP growth forecast now stands at 0.2% and 0.7% in 2014 and 2015, respectively.
OPEC Monthly Oil Market Report – February 2015
23
World Economy
Russia The government announced a plan to spend about one trillion rubles to recapitalize banks through the issue of government bonds. The plan also includes supporting the state development bank and extending guarantees to finance investment projects and to support regional governments. The government also proposed 10% in public spending cuts in 2015 and 5% over the next two years. The ruble/dollar exchange rate depreciated 17.1% in January from the previous month. In the past three months, the currency depreciated more than 50% and since July 2014, nearly 68%. The inflation rate, on the other hand, increased to 15.0% in January 2015 from 11.4% in December 2014, mainly driven by higher food costs. This is the highest rate since August 2009. The central bank cut its benchmark interest rate to 15% in February from 17% in January, on expectations that inflation will fall in mid-2015. The unemployment rate increased for the fourth consecutive month to 5.3% in December 2014 from 5.2% in the previous month, reaching its highest level since April 2014. The number of unemployed people increased to 3.974 million from 3.930 million in November. A year earlier, the figure was 4.19 million. Graph 3.8: Russian ruble inflation vs. interest rate
Graph 3.9: Russian unemployment rate
% 18
% change y-o-y 6.5 15.0
16 14
15.0
6.0
12 5.5
5.3%
Interest rate
8
5.0
Sources: Federal State Statistics Service, Central Bank of Russia and Haver Analytics.
Sep 14
Jul 14
Mar 14
May 14
Jan 14
Nov 13
Sep 13
Jul 13
May 13
4.5
Mar 13
Jan 15
Feb 15
Dec 14
Nov 14
Sep 14 Oct 14
Jul 14 Aug 14
Jun 14
May 14
Apr 14
Mar 14
Feb 14
4
Jan 13
Inflation rate
6
Nov 14
10
Sources: Central Bank od the Russian Federation and Haver Analytics.
The value of exports declined in November 2014 by the greatest amount in five years. Exports shrank 21.7% to $36.65 billion, the lowest value in nine months. November‟s decline is the biggest since September 2009 when sales contracted an annual 33.4%. Imports declined 21.8% to $23.3 billion, the lowest since January 2014. Signs of a contraction in Russia‟s manufacturing sector became more visible with the manufacturing PMI slumping to a 67-month low in January. The number of new businesses continued its decline while production fell for the first time in eight months. The survey also showed a sharp acceleration in output price inflation to the highest level in over a decade. The index posted 47.6 in January from 48.9 in December. Sanctions and a decline in export revenues are anticipated to hit GDP badly in 2015. Yet significantly lower imports together with efforts to substitute the imports that are expected in 2015 are likely to offset part of the impact. The GDP is forecast to contract 2.4% in 2015, although Russia‟s economy ministry recently forecast an economic contraction of 3% this year. The way foreign reserves will be utilized in the coming months could also affect the country‟s economic performance in either direction.
24
OPEC Monthly Oil Market Report – February 2015
World Economy
India The change in economic growth in 2014 picked up, accelerating to 5% on an expenditure basis from 4.7% in 2013. In the first three quarters of 2014, y-o-y growth averaged an encouraging 5.2%. However, there seem to be further improvements in the country‟s GDP growth rate in the 4Q14. Thus, expectations for 2014 have remained unchanged at 5.5%. In addition, higher household spending, on the back of moderating inflation and a gradual loosening of monetary policy, are also expected to boost mid-term growth. The revival of pending infrastructure projects may also help growth to accelerate in 2015. Looking further ahead, it is expected that GDP growth will rise to an average of 6.0% in 2015 from 5.8%, driven by strong fundamentals, notably high savings and investment rates, rapid growth in the workforce, an expanding middle class and a further shift away from low-productivity agriculture. Lower commodity prices will aid the government in its bid to curtail its fiscal deficit. The ruling Indian People‟s Party (BJP) has retained the low 4.1% deficit target for 2014 set by the United Progressive Alliance (UPA) administration in February of last year as part of the pre-election interim budget. Although the RBI cut the repo rate in January 2015 by 25 bp to 7.75% from 8%, the move was not a complete surprise. A first rate cut had originally been forecast to take place after the release of the new budget in February 2015 given the RBI‟s guidance that fiscal consolidation was a pre-condition to any easing. Graph 3.10: Indian GDP growth % change y-o-y 12 10
7.8% 8
6
4.7%
4.6%
3.8%
5.7% 5.3%
4 2 0 1Q 11
2Q 11
3Q 11
4Q 11
1Q 12
2Q 12
3Q 12
4Q 12
1Q 13
2Q 13
3Q 13
4Q 13
1Q 14
2Q 14
3Q 14
Sources: National Informatics Centre (NIC) and Haver Analytics.
India’s trade deficit narrowed dramatically in December, after widening sharply over the last two months, to $9.4 billion from $16.9 billion in November. Gold imports plunged to $1.3 billion in December from $5.6 billion in November. Oil is India‟s single largest import and net oil imports have averaged about 5.5% of GDP over the last three years. Based on J.P. Morgan‟s forecast of a $50/b fall in average oil prices between 2014 and 2015, this could constitute a very large positive terms of trade shock for India. The first indication of how significant the oil price impact can be on India‟s external balances is that the current account in the 1Q15 is expected to show its first surplus in eight years.
OPEC Monthly Oil Market Report – February 2015
25
World Economy Graph 3.12: Indian gold imports US$ bn 8
Exports
Imports
300%
2
150%
0
0% -150%
Oct 14
-2
Jun 14
-34.8 -43.0 -39.3 -42.8 Aug 14 Sep 14 Oct 14 Nov 14 Dec 14 -37.5
4
Aug 14
-16.9
450%
Apr 14
-9.4
6
Feb 14
25.4
Dec 13
-14.0
26.0
Oct 13
-14.6
25.3
Aug 13
-10.9
28.4
Percentage 600%
Jun 13
26.6
Apr 13
US$ bn 40 26.8 30 20 10 0 -10 -20 -13.3 -30 -40 -50 -40.1 Jul 14
Dec 14
Graph 3.11: Indian trade balance
Gold imports (LHS) % change y-o-y (RHS)
Trade balance
Sources: Ministry of Commerce and Industry and Haver Analytics.
Sources: Ministry of Commerce and Industry and Haver Analytics.
Industrial production has made an impressive recovery in November to 3.25% y-o-y from -3.54% in October. Automobile production in November bounced back sharply, growing at a seasonally adjusted rate of 10.3% m-o-m, to offset some of October‟s weakness. It is likely to lift consumer durables production. Other high frequency data, including the manufacturing PMI and railways traffic growth, are consistent with a modest recovery in activity. Graph 3.13: Indian PMIs
Graph 3.14: Indian industrial production breakdown
Index 60
4% 0%
Sources: HSBC, Markit and Haver Analytics.
Manufacturing IP
Nov 14
-8%
Aug 14
44
May 14
-6%
Feb 14
-4%
46
Nov 12
-2%
48
Jan 13 Mar 13 May 13 Jul 13 Sep 13 Nov 13 Jan 14 Mar 14 May 14 Jul 14 Sep 14 Nov 14 Jan 15
50
Nov 13
52
3.2% 2.0%
2%
Aug 13
53.3 52.9 52.4
54
Total industrial production
6%
May 13
56
8%
Composite PMI Manufacturing PMI Services and activity PMI
Feb 13
58
% change y-o-y
Sources: Central Statistical Organisation of India and Haver Analytics.
Inflation based on India‟s consumer price index (CPI) is expected to remain below 6% in the first half of 2015, in response to recent commodities and oil price moves. However, any future easing is likely to be contingent on the budget and future policy actions. The RBI governor‟s policy statement included the statement that: “Key to further easing is data that confirm continuing disinflationary pressures.” But also critical would be a sustained high quality fiscal consolidation, as well as steps to overcome existing supply constraints, and assure the availability of key inputs such as power, land, minerals and infrastructure. The latter, in particular, would be needed to ensure that potential output rises above the projected pick-up in growth in the coming quarters (4Q14, 1Q15 and 2Q15) so as to contain inflation.
26
OPEC Monthly Oil Market Report – February 2015
World Economy Separately, if food price disinflation continues, or growth disappoints, or the oil price continues to tumble, room may open up for another 25 bp cut later in the year. December‟s CPI inflation decreased to 5% from 4.4% in November, driven entirely by food prices, with vegetable prices continuing to fall and declining much more than the high frequency food price data had suggested. Oil may also have had an indirect impact by reducing transportation costs for food after the 15% drop in diesel prices over the last three months. Core inflation, which includes gasoline and diesel prices, declined further to 5.4% y-o-y from 5.7% in November. The wholesale price index (WPI) fell sequentially for the fourth consecutive month in December, pushing down the y-o-y inflation rate to 0.1%. In contrast to the CPI, which has a large non-tradable component, the WPI basket is closely linked to global commodities. Graph 3.15: Indian inflation vs. repo rate
Repo rate CPI higher target bond Wholesale price index (WPI)
Jan 15
Dec 14
Nov 14
Oct 14
Sep 14
Aug 14
Jul 14
Jun 14
May 14
Apr 14
Mar 14
Feb 14
Jan 14
Dec 13
Nov 13
Oct 13
Sep 13
Aug 13
Jul 13
Jun 13
May 13
Apr 13
Mar 13
Feb 13
% 12 10 8 6 4 2 0 -2
Consumer price index (CPI) CPI lower target bond WPI confort zone
Sources: Ministry of Commerce and Industry, Reserve Bank of India and Haver Analytics.
China China’s GDP growth in 2014 was 7.4%, the slowest rate in the past quarter century. Nevertheless, the growth slowdown may still have some way to go. The official GDP figures for the 4Q14 show that on a y-o-y basis growth was 7.3%, the same as in the previous quarter. As a result, full-year growth for 2014 was 7.4% y-o-y, compared to 7.7% in 2013. That slowing growth occurred even though there had been a rapid drop in oil prices throughout the second half of 2014, and despite growing efforts to ease both monetary and fiscal policy in recent months. GDP growth in 2014 was kept unchanged at 7.4%. For 2015, growth expectations have been revised down to 7% from 7.2%. Many China observers are already talking of annual 7% growth there as the „new normal‟, though expectations are that growth is unlikely to maintain this pace for long. It seems the pace of economic growth will slow steadily in the next few years, perhaps even below the 7% seen in recent years. This represents a structural rather than a cyclical shift. It is also partly related to demography as China's working-age population continues to shrink. However, a more important factor is the need to re-balance investments, after several years during which economic expansion has been overly dependent on rapid credit growth, channelled largely into investments. Financial deleveraging is still some way off, but even reining in credit growth will slow the pace of investment. Much of the slowdown in investment growth will be concentrated in real estate development. Household consumption should hold up better amid financial
OPEC Monthly Oil Market Report – February 2015
27
World Economy tightening, additionally supported by rising incomes. Meanwhile, an expansion in imports will outpace export growth as local demand rises rapidly. Growth in the export of goods and services will, nevertheless, remain firm, despite the negative impact of rising input costs in China on overseas sales. China's Ministry of Industry and Information Technology cut its industrial output growth target to 8% for 2015. Despite some "downward pressure" on growth, industrial performance under the „new normal‟ will remain within a reasonable range, with support extended to small enterprises. China's actual industrial output growth in 2014 was 8.3%, well below the 9.5% target publicly announced early in 2014. Indeed, every macroeconomic indicator in 2014 came in well below its expected target levels, with the exception of net new job creation. This reflects the fact that despite lower oil prices, the challenges facing China's economy will continue to exert considerable downward pressure on growth. Graph 3.16: Chinese GDP growth rate
Graph 3.17: Contribution to Chinese GDP growth % change y-o-y 10 8
3.6
6
7.7% 7.4%
5.7
2
7
0
Source: China's National Bureau of Statistics and Haver Analytics.
4Q 13
3Q 13
2Q 13
1Q 13
1Q 14 2Q 14 3Q 14 4Q 14
1Q 13 2Q 13 3Q 13 4Q 13
1Q 12 2Q 12 3Q 12 4Q 12
5
3.6
4.0
3.6
3.8
-1.4 -0.2
-2
6
3.0
4
4Q 14
7.8%
1Q 14
8
0.8 0.0
3.1
3Q 14
9
2Q 14
% change y-o-y
Net exports of goods and services Gross capital formation Final consumption expenditure Sources: China National Bureau of Statistics and Haver Analytics.
Chinese profits contracted 8% in December 2014, led by weakening growth at stateowned enterprises (SOEs) and within the refining sector. In December alone, accumulated profit growth within the refining sector decelerated 45 percentage points to grow -79.2%, while in the mining sector profits also contracted at even faster doubledigit rates. SOEs saw the largest deceleration in profits, contracting 5.7% in 2014. Overall, industrial profit growth during 2014 in China was 3.3%, compared with 12.2% in 2013. In terms of shadow banking, the China Banking Regulatory Commission (CBRC) will restructure for the first time since opening in 2003. A plan finalized on 20 January by the CBRC includes the closing of training and information centres, and the opening of two new offices under existing departments. The first of these new offices will focus on investment trusts, while the second will monitor city commercial banks, urban credit unions and privately owned banks. Additionally, a new lower-level bureau will coordinate the regulation of loan guarantee companies, small loan enterprises, rural financial institutions and online lenders. According to comments from a CBRC official, the restructuring will conclude by March 2015. The impact of falling global commodity and oil prices on inflation in China means that the People‟s Bank of China (PBC) will be able to keep 2015 interest rates lower than otherwise would have been the case.
28
OPEC Monthly Oil Market Report – February 2015
World Economy Exports to China from Japan, Korea and Taiwan appear to have contracted again at the end of the year. Graph 3.18: Chinese consumer price index (CPI) vs. producer price index (PPI)
% change y-o-y 40% 30% 20% 10% 0% -20%
Exports
Sources: China National Bureau of Statistics and Haver Analytics.
Oct 14
Dec 14
Jun 14
Aug 14
Apr 14
Feb 14
Oct 13
Dec 13
Jun 13
Aug 13
CPI CPI lower target bond PPI Interest rate
Apr 13
-30%
Feb 13
Jan 15
Nov 14
Sep 14
Jul 14
May 14
Mar 14
Jan 14
-10%
Nov 13
Sep 13
Jul 13
May 13
Mar 13
% change y-o-y 8 6 4 2 0 -2 -4
Graph 3.19: Chinese exports-imports
Imports
Sources: China Customs and Haver Analytics.
China’s official manufacturing PMI rose to 49.8 in January, up from 49.7 in December. However, it remains below 50. Domestic demand improved marginally while external demand remained solid. The labour market weakened and prices fell further. Today's data suggest that the manufacturing slowdown is still ongoing amid weak domestic demand. More monetary and fiscal easing measures will be needed to support growth in the coming months. Graph 3.20: Chinese PMIs
Graph 3.21: Chinese industrial production
Index 53
% change y-o-y
Composite PMI
10%
52 9%
51
51.0
50 49
49.8 Manufacturing PMI
7.9%
8% 7%
48
Dec 14
Oct 14
Nov 14
Sep 14
Aug 14
Jul 14
Jun 14
Apr 14
May 14
Mar 14
Feb 14
Jan 14
Jan 14 Feb 14 Mar 14 Apr 14 May 14 Jun 14 Jul 14 Aug 14 Sep 14 Oct 14 Nov 14 Dec 14 Jan 15 Sources: HSBC, Markit and Haver Analytics.
Dec 13
6%
47
Sources: China National Bureau of Statistics and Haver Analytics.
OPEC Member Countries In Saudi Arabia, new orders in the non-oil producing private sector rose at a markedly accelerated pace in January. The SABB HSBC PMI was largely stable in January posting 57.8, compared to December‟s 57.9. The survey showed that companies added more jobs for the tenth consecutive month on the back of rising production requirements.
OPEC Monthly Oil Market Report – February 2015
29
World Economy In the United Arab Emirates, operating conditions in the non-oil producing private sector improved further in January with the PMI at 59.3, up from December‟s 58.4. The index was generally supported by increases in output and new orders. Job creation also saw robust growth, continuing the trend observed since the beginning of 2012. Higher production requirements and the launch of new products are reported to be leading last month‟s rise in employment. Graph 3.22: Saudi Arabia and UAE: manufacturing PMIs Index 65
60
59.3 57.8
55
Saudi Arabia
Jan 15
Dec 14
Nov 14
Oct 14
Sep 14
Aug 14
Jul 14
Jun 14
May 14
Apr 14
Mar 14
Feb 14
Jan 14
Dec 13
Nov 13
Oct 13
Sep 13
Aug 13
Jul 13
Jun 13
May 13
Apr 13
Mar 13
Jan 13
Feb 13
50
UAE
Sources: SAAB, HSBC, Markit and Haver Analytics.
Other Asia In Indonesia, the central bank left its benchmark interest rate on hold at 7.75% last month. The central bank expects inflation will remain under control between 3% and 5% in 2015. Business conditions in the country‟s manufacturing sector deteriorated for the fourth consecutive month in January. The manufacturing PMI picked up from a record low of 47.6 in December to 48.5 in January. The survey highlighted the fastest contraction in new export orders in the survey‟s history. Production and new business continued to fall, but at slower rates. Graph 3.23: Indonesian interest rate vs. inflation
Graph 3.24: Malaysian interest rate vs. inflation
%
% change y-o-y
%
% change y-o-y
7.8
9%
3.3
4% 3% 3% 3% 3% 3% 2% 2% 2%
Jan 15
Nov 14
Sep 14
Jul 14
May 14
Mar 14
3%
Jan 14
7.4
2.9
Official interest rate (LHS)
Official interest rate (LHS)
Consumer price index (RHS)
Consumer price index (RHS)
Sources: Badan Pusat Statistik and Haver Analytics.
30
3.0
Jan 15
4%
Nov 14
7.5
3.1
Sep 14
5%
Jul 14
6%
May 14
7.6
3.2
Mar 14
7%
Jan 14
8%
7.7
Sources: Dapartment of Statistics of Malaysia and Haver Analytics.
OPEC Monthly Oil Market Report – February 2015
World Economy In Malaysia, the central bank left the benchmark overnight rate unchanged at 3.25% in January. Consumer prices declined to 2.7% y-o-y in December from 3.0% in the previous month as increases in the cost of food, housing and transport slowed. Inflation for 2015 is now expected to be lower than anticipated earlier due to lower energy and commodity prices. In Vietnam, manufacturing production continued to rise in January, supported by further growth in new orders. As a result, employment increased at a solid pace, the sharpest since December 2013. The manufacturing PMI registered 51.5 in January after reaching 52.7 in December.
Africa In South Africa, the central bank left its key repo rate on hold at 5.75% in January as inflationary pressures eased. The bank said that the bar for rate cuts remained high, and would require a sustained decline in both the inflation rate and inflation expectations. It lowered the growth forecast for 2015 from 2.5% to 2.2%. Following five months of continued improvement, the manufacturing sector showed a broad-based weakening in January. The manufacturing PMI fell to 49.8 last month from 50.2 in December. Output, new orders and inventories experienced marginal contractions in January. In Egypt, the Central Bank cut its benchmark overnight deposit rate last month by 50 bp to 8.75% amid inflationary and growth risks. The key interest rate was last changed in July 2014 when the central bank raised it by 100 bp to curb inflationary pressures resulting from a cut in fuel and electricity subsidies. The bank expects investments in domestic mega-projects – such as the Suez Canal – are expected to contribute to economic growth. Last month, the non-oil producing private sector experienced its first contraction since July 2014. HSBC Egypt PMI dropped to 49.3 in January from 51.4 in December on declines in production and new business. Graph 3.25: Manufacturing PMI in South Africa and Egypt Index 54 52
50
49.8 49.3
48 46
South Africa
Jan 15
Dec 14
Nov 14
Oct 14
Sep 14
Aug 14
Jul 14
Jun 14
May 14
Apr 14
Mar 14
Feb 14
Jan 14
44
Egypt
Sources: HSBC, Reuters Telerate and Haver Analytics.
OPEC Monthly Oil Market Report – February 2015
31
World Economy
Latin America In the 3Q14, Argentina‟s GDP, hurt by a fall in exports, investments and private consumption, shrank 0.8% y-o-y. Exports fell by 8.4% y-o-y and imports dropped by 15.2% y-o-y. Gross fixed capital formation decreased by 4.7% and private consumption shrank by 1.4%. Meanwhile, government expenditure rose 1%. In Chile, the central bank left its monetary policy interest rate unchanged last month at 3%. The decision was influenced by low growth and above-target inflation. The country‟s GDP advanced 0.8% y-o-y in the 3Q14, the weakest pace since the 2009 recession. This was the fourth straight quarter of deceleration in growth due to the contraction in mining investment.
Transition region In the Czech Republic, the average growth over the first three quarters of 2014 was 2.5% y-o-y, signalling a recovery from the contraction of 0.7% in 2013. The manufacturing sector was supported last month by stronger demand and falling input prices. The manufacturing PMI improved to 56.1 in January, up from December‟s 17-month low of 53.3. The survey highlighted acceleration in production, new orders, exports and job creation in the sector, while input and output prices declined. In Poland, the manufacturing sector was boosted in January by strong rates of growth in production and new orders. The index posted 55.2 last month, up from 52.8 in December. Domestic demand is considered to be the main driver behind this growth. Meanwhile, input and output prices both fell. GDP expanded at a seasonally adjusted rate of 0.9% q-o-q in the 3Q14, better than the 0.7% q-o-q growth reported in the 2Q14. Growth was supported by a rise in investment and consumption. Graph 3.26: Manufacturing PMIs in transition region Index 58 56.1 55.2
56 54
52 50 48 46
Czech Republic
Jan 15
Dec 14
Nov 14
Oct 14
Sep 14
Aug 14
Jul 14
Jun 14
May 14
Apr 14
Mar 14
Feb 14
Jan 14
Dec 13
Nov 13
Oct 13
Sep 13
Aug 13
Jul 13
Jun 13
May 13
Apr 13
Mar 13
Feb 13
44
Poland
Sources: HSBC, Markit and Haver Analytics.
32
OPEC Monthly Oil Market Report – February 2015
World Economy
Oil prices, US dollar and inflation Currency markets have experienced volatile moves over the past months, influenced by the monetary decisions of various central banks, as well as economic and political developments. The sharp rise of the Swiss franc after Switzerland announced that it would cancel its peg to the euro and the considerable drop of the euro to the US dollar over the past weeks have highlighted the impact of unconventional monetary policies. With the announced quantitative easing in the Euro-zone, a continued expansionary policy in Japan, the possibility of monetary tightening in the US and monetary decisions targeting growth in the major emerging economies, volatility in the currency markets should be expected to continue. In terms of numbers, the US dollar continued appreciating in January against both the euro and the pound sterling on average. It gained 6% compared to the euro and 3.4% versus the pound sterling, while declining 0.8% versus the yen and 3.5% against the Swiss franc. On a monthly average, the US dollar stood at $1.1595/€ in January. While the quantitative easing programme in the Euro-zone and possible monetary tightening by the Fed around mid-year should be expected to be already priced in to current valuations, some further strengthening of the US dollar against the euro seems possible. At the very least, it is seen keeping its current strength. The most unexpected and volatile move in January was the rise of the Swiss franc against the euro, after the Swiss National Bank abandoned its peg of CHF1.20 to the euro. After this announcement, the Swiss franc rose more than 20%, while on a monthly average the increase stood at 9%. Moreover, and of similar great importance, the Russian ruble continued declining considerably against the US dollar in January by 17.1% m-o-m, after already dropping sharply by 21% m-o-m in December. In nominal terms, the price of the OPEC Reference Basket (ORB) declined by a monthly average of $15.08/b, or 25.4%, from $59.46/b in December to $44.38/b in January. In real terms, after accounting for inflation and currency fluctuations, the ORB fell by 22.8%, or $8.74/b, to $29.61/b from $38.35/b (base June 2001=100). Over the same period, the US dollar gained 3.1% against the import-weighted modified Geneva I + US dollar basket* while inflation fell by 0.3%.
*
The ‘modified Geneva I+US$ basket’ includes the euro, the Japanese yen, the US dollar, the pound sterling and the Swiss franc, weighted according to the merchandise imports of OPEC Member Countries from the countries in the basket.
OPEC Monthly Oil Market Report – February 2015
33
World Oil Demand
World Oil Demand World oil demand growth for 2014 was kept broadly unchanged from last month’s MOMR at a level of 0.96 mb/d, with total oil demand anticipated to reach 91.15 mb/d. In 2015, world oil demand is projected to grow at a marginally higher 20 tb/d over last month’s report, supported by an upward revision of 15 tb/d recorded in OECD Americas. As a result, 2015 total oil demand growth currently stands at 1.17 mb/d with total oil consumption projected to reach 92.32 mb/d.
World oil demand in 2014 and 2015 Table 4.1: World oil demand in 2014, mb/d Change 2014/13 Growth % 0.10 0.41 0.13 0.70 -0.20 -1.50 -0.18 -2.12 -0.28 -0.61
Americas of which US Europe Asia Pacific Total OECD
2013 24.08 19.27 13.61 8.32 46.01
1Q14 23.87 19.16 13.01 8.85 45.73
2Q14 23.76 19.02 13.46 7.65 44.86
3Q14 24.37 19.52 13.75 7.69 45.81
4Q14 24.73 19.90 13.39 8.38 46.50
2014 24.18 19.40 13.40 8.14 45.73
Other Asia of which India Latin America Middle East Africa Total DCs
11.06 3.70 6.50 7.81 3.63 29.00
11.08 3.85 6.42 8.07 3.75 29.31
11.37 3.80 6.69 7.93 3.75 29.74
11.34 3.63 6.98 8.39 3.65 30.36
11.33 3.87 6.70 7.85 3.80 29.68
11.28 3.79 6.70 8.06 3.74 29.78
0.22 0.09 0.20 0.25 0.11 0.78
1.99 2.38 3.14 3.18 3.02 2.70
FSU Other Europe China Total "Other regions"
4.49 0.64 10.07 15.20
4.39 0.64 10.08 15.11
4.24 0.60 10.56 15.39
4.63 0.64 10.31 15.58
4.91 0.72 10.88 16.50
4.54 0.65 10.46 15.65
0.05 0.01 0.39 0.46
1.14 2.05 3.89 3.00
Total world Previous estimate Revision
90.20 90.20 0.00
90.15 90.15 0.00
90.00 90.00 0.00
91.75 91.73 0.02
92.68 92.69 -0.01
91.15 91.15 0.00
0.96 0.95 0.00
1.06 1.06 0.00
Totals may not add up due to independent rounding.
OECD Americas The most recent monthly US oil demand data covers November 2014 and implies y-o-y losses in oil requirements of around 1% after an increase in October 2014 and an overall flat 3Q14 in terms of growth. Preliminary weekly data for November led to optimistic expectations, which had to be revised downwards substantially once monthly data became available. Growth in November gasoline demand was slow, despite relatively low fuel prices, while distillate fuel demand fell slightly. Moreover, residual fuel oil and propane/propylene requirements remained on a downward trend for another month in 2014. Nevertheless, monthly data available for 11 months and preliminary weekly figures for December seem to show growing 2014 US oil requirements by 1%, y-o-y. Distillate fuel oil usage in the transportation and industrial sectors as well as gasoline demand accounted for the bulk of the increases, while residual fuel oil and propane/propylene demand were on the bearish side. Preliminary weekly data implies a strong January 2015 with higher growth in gasoline, distillate and jet/fuel oil demand. The picture of US oil demand is generally in line with the economic improvements seen in the country, especially when considering the increase in oil requirements for the industrial and transportation sectors, as a result of lower fuel prices. While the development of 2015 US oil demand remains strongly
34
OPEC Monthly Oil Market Report – February 2015
World Oil Demand dependent on the development of the US economy, it is skewed more to the upside as compared to last month, also as a result of more optimistic expectations in the road transportation sector. Graph 4.1: US oil consumption, y-o-y changes
All other
Distllates
Gasoline
Jan 15
Dec 14
Nov 14
Oct 14
Sep 14
Aug 14
Jul 14
Jun 14
May 14
Apr 14
Mar 14
Feb 14
Jan 14
Dec 13
Oct 13
Nov 13
Sep 13
Aug 13
Jul 13
Jun 13
May 13
Apr 13
Mar 13
Feb 13
Jan 13
tb/d 1,400 1,200 1,000 800 600 400 200 0 -200 -400 -600
Total oil
In Mexico, oil demand increased in December 2014, particularly for gasoline, gas/diesel oil and jet fuel. However, for the whole of 2014, oil demand in Mexico declined, with all main product categories being in the minus, the largest drop seen in residual fuel oil, mainly as a result of substitution. The 2015 risks for Mexican oil demand are balanced compared with the previous month. The latest November 2014 Canadian data showed falling oil demand, notably in gasoline and gas/diesel oil requirements, yet partly offset by strong residual fuel oil requirements. 2015 projections for Canadian oil demand remain unchanged from those in the previous month. In 2014, OECD Americas’ oil demand grew by 0.10 mb/d compared with a year earlier. 2015 OECD Americas’ oil demand is projected to increase by 0.20 mb/d over 2014. Graph 4.2: Quarterly world oil demand growth tb/d 2,000 1,500 1,000 500 0 -500 -1,000 1Q
2Q
3Q
4Q
1Q
2Q
2013 OECD
3Q
2014 estimate Non-OECD
OPEC Monthly Oil Market Report – February 2015
4Q
1Q
2Q
3Q
4Q
2015 forecast Total world
35
World Oil Demand
OECD Europe The decline in European oil demand seems to be endless, with September being the only month on the positive during 2014. November 2014 data implied oil demand in the region to be shrinking, notably in the European Big 4 consumers and in line with declining industrial production figures, compared with the same month a year earlier. Moreover, early indications for December 2014 show the European Big 4 oil demand to be only slightly declining y-o-y. With data available for eleven months of the year and preliminary figures for December, 2014 oil demand in the Big 4 shows losses of approximately 0.21 mb/d. The largest declines have been observed in gas/diesel oil, LPG, gasoline and fuel oil. There was positive news for European auto sales, which continued their positive momentum in December 2014 with an overall 4.7% y-o-y increase for the sixteenth consecutive month and with positive momentum in almost all major markets, notably in Spain, the UK, Germany and Italy. It remains to be seen whether these positive indicators would be translated to higher oil demand in the future. Finally, some conservative expectations for an improvement in the 2015 European oil demand originate in the anticipated improvements in the overall economy along with the low oil demand baseline in the region. On the other side, heavy taxation on oil usage and pending economic challenges in several countries of the region pose some significant downside risks for future oil demand. The risk for the region’s oil demand during 2015 has remained balanced since last month’s projections. In 2014, European oil demand shrank by 0.20 mb/d, while oil demand in 2015 is projected to decrease again, but to a lesser extent, by 0.10 mb/d. Table 4.2: Europe Big 4* oil demand, tb/d LPG Gasoline Jet/Kerosene Gas/Diesel oil Fuel oil Other products Total
Dec 14 447 1,052 713 3,036 289 827 6,364
Dec 13 436 1,077 698 3,042 277 853 6,384
Change from Dec 13 10 -25 15 -6 12 -26 -19
Change from Dec 13, % 2.4 -2.3 2.1 -0.2 4.3 -3.1 -0.3
* Germany, France, Italy and the UK.
OECD Asia-Pacific Japanese oil demand decreased in December 2014 by 0.1 mb/d y-o-y, with increases in most product categories. Oil requirements in crude and fuel oil for direct burning and electricity generation fell as a result of increasing substitution with other commodities, while during the same month, demand for all other products rose, particularly jet fuel, LPG and naphtha. For the whole of 2014, Japanese oil demand fell by 5% y-o-y with jet fuel being the only product in the plus. The outlook risks for 2015 Japanese oil demand remain unchanged from last month’s forecasts and will depend on the development of the country’s economy as well as the startup of operations of some of the country’s nuclear plants during 2015.
36
OPEC Monthly Oil Market Report – February 2015
World Oil Demand Table 4.3: Japanese domestic sales, tb/d LPG Gasoline Naphtha Jet fuel Kerosene Gasoil Fuel oil Other products Direct crude burning
Dec 14 553 1,011 856 84 626 626 618 60 179
Change from Dec 13 16 10 -24 7 46 18 -96 -11 -64
Change from Dec 13, % 3.0 1.0 -2.7 9.4 7.9 3.0 -13.5 -14.9 -26.2
4,613
-97
-2.1
Total
In South Korea, November 2014 demand came up declining, y-o-y. Growing demand for jet fuel and gas/diesel oil was outpaced by declining requirements for all other products. The outlook for South Korean oil consumption during 2015 remained unchanged as compared to last month’s projections. 2014 OECD Asia-Pacific oil consumption shrank by 0.18 mb/d. The downward trend will continue also in 2015 but to a smaller degree, dropping by 0.12 mb/d.
Other Asia In India, demand for oil rose again in December to record the strongest month of y-o-y growth in 2014. Oil demand increased by 0.24 mb/d, well above 6% y-o-y, as compared to the same period a year earlier. Similar to last month, these developments were fueled by efforts to improve the country’s macroeconomic indicators and by lower oil prices despite increases in consumption taxes, which moderated the rise. Improved weather conditions also contributed to the strong increase. This growth was led by solid consumption for LPG, driving total demand growth data higher for yet another month. Consumption of LPG grew by almost 0.1 mb/d or just below 18% y-o-y due to an increase in LPG subsidies. Graph 4.3: Changes in Indian oil demand, y-o-y tb/d 500 400 300 200 100 0 -100 -200
LPG
Gasoline
Kerosene
Diesel oil
Fuel oil
Dec 14
Nov 14
Oct 14
Sep 14
Aug 14
Jul 14
Jun 14
May 14
Apr 14
Mar 14
Feb 14
Jan 14
Dec 13
Nov 13
Oct 13
Sep 13
Aug 13
Jul 13
Jun 13
May 13
Apr 13
Mar 13
Feb 13
Jan 13
Dec 12
-300
Other products
Similar to last month, gasoline also contributed to growth with a solid increase of more than 12% y-o-y, resulting in yearly growth of 36 tb/d compared with yearly growth of 32 tb/d in 2013. Car sales in December were also on the rise, increasing by more than 15% y-o-y, a continuation of the solid performance seen over the year. Diesel demand
OPEC Monthly Oil Market Report – February 2015
37
World Oil Demand was also higher in December by 42 tb/d or just below the 3% compared with the same month the previous year, primarily supported by improved weather conditions and the macroeconomic status of the country. For 2014, total oil demand in India has grown by around 90 tb/d or more than 2%, with LPG contributing most to this growth with 12%, followed by gasoline with 9% growth for 2014 compared with a year earlier. The solid performance was exhibited in 4Q, mainly as economic conditions of the country improved. This positive momentum is expected to continue into 2015. According to data up to November 2014, oil consumption also grew in Indonesia Thailand, Singapore and the Philippines, while it declined sharply in Taiwan. Table 4.4: Indian oil demand by main products, tb/d LPG Motor gasoline Jet Kero Gas diesel oil Residual fuel oil Other products Total oil demand
Dec 14 658 517 273 1,566 230 956
Dec 13 662 402 316 1,648 246 638
Jan-Dec 14 574 443 286 1,471 247 767
Jan-Dec 13 61 36 1 8 -21 2
% 12.0 9.0 0.5 0.6 -7.9 0.3
4,200
3,911
3,787
88
2.4
Looking forward, the risks for 2015 in Other Asian oil demand growth are expected to be balanced with a slight positive effect from India as a result of the overall improvement in economic activities along with lower oil prices. Transportation fuels are expected to be the main contributors to growth. In other parts of the region, subsidies on transportation fuels and the degree of their reduction may influence oil demand growth, however the lower international prices at this stage should moderate the impact. Other Asia’s oil demand is anticipated to grow by 0.22 mb/d in 2014. As for 2015, oil demand is forecast to be 0.25 mb/d higher than 2014.
Latin America In Argentina, November 2014 was another month of positive oil demand growth with all products showing increases with the exception of fuel oil. Total product demand grew by around 10 tb/d, which amounted to more than 1% y-o-y. LPG and jet/kerosene were the largest contributors to oil demand growth, with LPG rising by almost 11% and jet/kerosene increasing by around 6%. With data up to November 2014, y-t-d data show a similar pattern of consumption in the country; while total consumption growth in the country was almost flat, LPG consumption grew the most, rising by more than 21% as compared to the same period in 2013. Jet/kerosene also rose by more than 6% y-o-y. Other products − gasoline, diesel oil, fuel oil and “other products” − were flat to declining. Looking forward, the risks for 2015 are currently pointing more towards likely downward revisions as economic activity in Brazil is predicted to only slightly improve. On the other hand, the presence of lower oil prices in addition to any sudden changes in weather conditions should limit the impact.
38
OPEC Monthly Oil Market Report – February 2015
World Oil Demand Latin American oil demand is anticipated to grow by 0.20 mb/d in 2014. During 2015, oil demand growth is forecast to increase by 0.20 mb/d, similar to the levels seen in 2014.
Middle East In Saudi Arabia, December 2014 oil demand was robust once more in line with the healthy oil demand performance achieved in 2014. Product demand grew by more than 0.23 mb/d or 10% y-o-y led by the uptick in fuel oil demand as production from the new refineries has become available for domestic consumption. Additionally, colder-thananticipated weather conditions in the central and northern parts of the country prompted additional usage for power generation. Fuel oil and direct crude burning consumption have increased by 0.19 mb/d and 43 tb/d, respectively, as compared to December 2013, an increase of around 43% and 13% y-o-y. Information for 2014 showed a similar pattern of oil demand consumption data, both in terms of the overall scale of the growth and the products leading those increases. Oil demand increased by around 0.21 mb/d, which equated to more than 9% y-o-y, led by fuel oil and direct crude for burning. Other countries in the region showed mixed performances. While oil demand in Iraq continued to decline for the seventh consecutive month − lower y-o-y by 0.12 mb/d − consumption from UAE, Kuwait and Qatar was on the rise. Going forward, Middle East oil demand is subject to the performance of the various economies in the region with the impact of lower oil prices on their spending plans. For 2014, Middle East oil demand growth is anticipated to hover around 0.25 mb/d, while oil demand in 2015 is projected to grow by 0.29 mb/d. Graph 4.4: Oil demand growth in the Middle East, y-o-y tb/d
tb/d
400
400
300
300
200
200
100
100
0
0
-100
-100 1Q12
2Q12
Saudi Arabia
3Q12
4Q12
1Q13
Iran, I.R.
2Q13
3Q13
Kuwait
4Q13
1Q14 UAE
2Q14
3Q14
Others
China In December 2014, Chinese oil demand continued its high pace of growth, increasing by 0.66 mb/d or more than 5% y-o-y. 2014 average growth for China stands at around 0.39 mb/d or nearly 4%. In December, oil demand growth was determined by rising gasoline, LPG and diesel requirements while fuel oil consumption decreased. Gasoline demand moved in line with rising car sales in December. According to statistics and analysis from the China Association of Automobile Manufacturers (CAAM), Chinese automobile sales were 16% higher y-o-y. 2014 also highlighted significant increases in
OPEC Monthly Oil Market Report – February 2015
39
World Oil Demand car sales with total units sold reaching 23 million units, up by 7% y-o-y compared with the 14% growth rate of 2013. In December, gasoline consumption grew by more than 0.30 mb/d or 13% compared with the same month a year earlier, yet this growth was capped by an increase in consumption taxes as Chinese authorities continued to raise tax levels as a means of limiting air pollution. Graph 4.5: Chinese gasoil and gasoline demand growth, y-o-y % 20 15 10 5 0 -5 -10
Dec 14
Nov 14
Oct 14
Sep 14
Aug 14
Jul 14
Jun 14
May 14
Apr 14
Mar 14
Feb 14
Jan 14
Dec 13
Nov 13
Oct 13
Sep 13
Aug 13
Jul 13
Jun 13
May 13
Apr 13
Mar 13
Feb 13
Jan 13
Dec 12
-15
Gasoil
Gasoline
Additionally, the increase in LPG requirements can be attributed to the country’s expanding petrochemical industry as LPG grew by more than 0.27 mb/d or 27% y-o-y. Diesel oil also increased by around 0.25 mb/d or more than 7% y-o-y, continuing its good performance in 4Q14. The pickup in diesel requirements was mainly due to improvements in weather conditions as well as the implementation of new very sizeable construction projects focused on the transportation sector. Fuel oil increased in December by more than 26% y-o-y, a result of the higher utilization rate by teapot refineries, which are major consumers of fuel oil in China. Fuel oil demand growth was lower in 2014 by more than 12% y-o-y, the first decline after three years of growth. Graph 4.6: Changes in Chinese apparent oil demand, y-o-y changes tb/d
tb/d
1,000
1,000
800
800
600
600
400
400
200
200
0
0
-200
-200
-400
-400
-600 Jan
Feb
Mar
Apr
Historical range
40
May
Jun
Jul
Aug 2013
Sep
Oct
Nov
-600 Dec
2014
OPEC Monthly Oil Market Report – February 2015
World Oil Demand The 2015 outlook is relatively in line with last month’s MOMR with equal upward potential/downward risks; the downside risks are focused on the likelihood of slower economic activities as well as the implementation of transportation fuel consumption measures geared towards curbing demand. The solid petrochemical sector and expansions in refining capacity, on the other hand, could be considered as elements supporting upward potential to 2015 oil demand estimates. For 2014, Chinese oil demand is anticipated to grow by 0.39 mb/d, while oil demand in 2015 is projected to increase by 0.31 mb/d. Table 4.5: World oil demand in 2015, mb/d Change 2015/14 % Growth 0.85 0.20 0.91 0.18 -0.71 -0.10 -0.12 -1.51 -0.03 -0.01
Americas of which US Europe Asia Pacific Total OECD
2014 24.18 19.40 13.40 8.14 45.73
1Q15 24.09 19.35 12.92 8.76 45.77
2Q15 23.94 19.16 13.38 7.57 44.88
3Q15 24.58 19.70 13.64 7.56 45.78
4Q15 24.93 20.08 13.28 8.20 46.41
2015 24.39 19.58 13.31 8.02 45.71
Other Asia of which India Latin America Middle East Africa Total DCs
11.28 3.79 6.70 8.06 3.74 29.78
11.32 3.95 6.61 8.35 3.84 30.13
11.63 3.91 6.89 8.19 3.84 30.55
11.62 3.76 7.18 8.69 3.75 31.23
11.57 3.99 6.91 8.13 3.89 30.50
11.53 3.90 6.90 8.34 3.83 30.60
0.25 0.12 0.20 0.29 0.09 0.83
2.24 3.04 2.95 3.54 2.47 2.78
FSU Other Europe China Total "Other regions"
4.54 0.65 10.46 15.65
4.43 0.65 10.39 15.46
4.27 0.60 10.87 15.75
4.67 0.65 10.63 15.95
4.95 0.73 11.17 16.85
4.58 0.66 10.77 16.01
0.04 0.01 0.31 0.35
0.88 1.08 2.94 2.26
Total world Previous estimate Revision
91.15 91.15 0.00
91.36 91.33 0.03
91.18 91.17 0.01
92.96 92.92 0.04
93.76 93.76 0.00
92.32 92.30 0.02
1.17 1.15 0.02
1.28 1.26 0.02
Totals may not add up due to independent rounding.
OPEC Monthly Oil Market Report – February 2015
41
World Oil Supply
World Oil Supply Non-OPEC oil supply for 2014 was revised up by 20 tb/d to 56.23 mb/d. The estimated growth was also revised up by 10 tb/d to 1.99 mb/d over the previous Monthly Oil Market Report (MOMR). This revision – mostly driven by upward 4Q14 revisions in the OECD, Brazil, Kazakhstan and China – was partially offset by downward revisions for Azerbaijan, Other Asia Pacific, Australia and Mexico. Non-OPEC oil supply in 2015 is projected to grow by 0.85 mb/d, mostly in the 1H15, down by 0.42 mb/d from the previous assessment, to average 57.09 mb/d, mainly due to announced capital expenditures (capex) cuts for 2015 on the part of international oil companies, as well as a decline in the number of active drilling rigs in the US and Canada, geopolitics and a heavy annual decline in Russian brownfields. OPEC NGL production is forecast to grow by 0.18 mb/d to average 5.83 mb/d in 2014, followed by growth of 0.2 mb/d to 6.03 mb/d in 2015. In January, OPEC production decreased by 53 tb/d to average 30.15 mb/d, according to secondary sources. As a result, preliminary data indicates that the global oil supply decreased by 0.29 mb/d in January to average 93.15 mb/d.
Estimate for 2014 Non-OPEC supply Preliminary data for December 2014 indicates that non-OPEC supply was upwardly revised by 70 tb/d to average 57.13 mb/d in the 4Q14. This revision was mostly driven by upward changes in the 4Q for OECD countries such as the US, Canada and Norway, as well as Brazil, Kazakhstan and China, which were partially offset by downward revisions for Azerbaijan, Other Asia Pacific, Australia and Mexico. Graph 5.1: Regional non-OPEC supply growth, y-o-y mb/d
mb/d
1.8
1.8 13/12
1.5
14/13
15/14
1.5
1.2
1.2
0.9
0.9
0.6
0.6
0.3
0.3
0.0
0.0
-0.3
-0.3 OECD America
OECD Europe
OECD Asia Pacific
Other Asia
Latin Middle East America
Africa
FSU
Non-OPEC oil supply is estimated to have averaged 56.23 mb/d in 2014, an increase of 1.99 mb/d over 2013. This shows an upward revision by 20 tb/d in total non-OPEC supply and 10 tb/d of growth over the previous MOMR. Within last year’s quarters, Canada and Australia oil supply encountered upward revisions in all quarters, while the US saw downward revisions. Moreover, there have been several upward revisions in 4Q for the UK, Brazil, Kazakhstan, and China, while downward revisions in Russia, New Zealand and Azerbaijan were seen in the same quarter. Updated production data for the 4Q14 primarily led to this adjustment, as well as revisions in the previous three
42
OPEC Monthly Oil Market Report – February 2015
World Oil Supply quarters for the US and Canada, where output was revised up in the first to third quarters, and downward revisions were accounted for in the 4Q for Australia. Oil production in Other Asia, the Middle East, Africa and Other Europe did not change over the month, with output more or less steady from the previous month’s assessment. On a regional basis, OECD Americas’ oil supply saw the highest increase among all non-OPEC regions in 2014 at 1.71 mb/d. On a country-by-country basis, the US, Brazil, Canada, Russia, the Sudans, Norway and Australia experienced the largest growth, while Mexico, Indonesia, the UK, Syria, and Azerbaijan witnessed the biggest declines. According to preliminary and estimated data for 2014, total non-OPEC supply in the 4Q increased by 1.84 mb/d over the same period one year earlier. During the 2H14, nonOPEC supply increased by 1.93 mb/d compared with the same period a year earlier. Non-OPEC supply in 2014 is estimated to have averaged 55.62 mb/d, 55.93 mb/d, 56.24 mb/d and 57.13 mb/d on a quarterly basis. Table 5.1: Non-OPEC oil supply in 2014, mb/d
Americas of which US Europe Asia Pacific Total OECD
2013 18.14 11.23 3.58 0.49 22.20
1Q14 19.12 11.95 3.75 0.51 23.39
2Q14 19.77 12.79 3.51 0.52 23.80
3Q14 20.08 13.12 3.40 0.54 24.01
4Q14 20.39 13.40 3.67 0.51 24.56
2014 19.84 12.82 3.58 0.52 23.94
Change 14/13 1.71 1.59 0.00 0.03 1.75
Other Asia Latin America Middle East Africa Total DCs
3.59 4.78 1.36 2.40 12.13
3.55 4.87 1.34 2.44 12.21
3.52 4.93 1.34 2.41 12.20
3.47 5.11 1.36 2.40 12.34
3.54 5.22 1.33 2.39 12.48
3.52 5.03 1.34 2.41 12.31
-0.07 0.25 -0.02 0.01 0.17
FSU of which Russia Other Europe China Total "Other regions" Total Non-OPEC production Processing gains
13.41 10.51 0.14 4.24 17.78 52.11 2.13
13.48 10.59 0.14 4.24 17.86 53.46 2.16
13.36 10.55 0.14 4.27 17.76 53.76 2.16
13.39 10.52 0.14 4.20 17.73 54.08 2.16
13.49 10.65 0.14 4.30 17.92 54.97 2.16
13.43 10.58 0.14 4.25 17.82 54.07 2.16
0.02 0.07 0.00 0.01 0.04 1.96 0.03
Total non-OPEC supply Previous estimate Revision
54.24 54.24 0.00
55.62 55.64 -0.02
55.93 55.93 0.00
56.24 56.23 0.01
57.13 57.06 0.07
56.23 56.22 0.02
1.99 1.98 0.01
OECD Total OECD oil supply is projected to increase by 1.75 mb/d in 2014 over the previous year to average 23.94 mb/d, indicating an upward revision of 10 tb/d compared with the previous MOMR. The upward revision was driven by adjustments carried over from historical data, as well as some changes to supply elements that affected production estimations from the US, Canada, the UK and Australia. The OECD supply profile remained relatively unchanged, with strong growth expected from OECD Americas and OECD Asia Pacific, while a steady state is seen to continue in OECD Europe for 2014. OECD oil supply in 2014 is expected to stand at 23.39 mb/d, 23.80 mb/d, 24.01 mb/d and 24.56 mb/d on a quarterly basis.
OPEC Monthly Oil Market Report – February 2015
43
World Oil Supply
OECD Americas Oil production in OECD Americas is projected to increase by 1.71 mb/d over 2013 to average 19.84 mb/d in 2014, indicating a small downward revision of less than 10 tb/d compared with the previous month. The oil production situation in 2014 remains relatively unchanged from the previous month, with the US and Canada expected to add volumes, while Mexico was seen to suffer a decline in 2014. OECD Americas’ oil supply in 2014 is expected to stand at 19.12 mb/d, 19.77 mb/d, 20.08 mb/d and 20.39 mb/d on a quarterly basis. In terms of the quarterly growth in 2014, OECD Americas grew by 1.46 mb/d, 2.09 mb/d, 1.70 mb/d and 1.58 mb/d, respectively. Production in 2014 during the 1H and the 2H increased by 1.78 mb/d and 1.64 mb/d, respectively, over the same period a year earlier.
US Actual US oil supply was pegged at 13.36 mb/d in November, down m-o-m by 40 tb/d, with crude output lower by 31 tb/d at 9.02 mb/d; it dropped in most states, with the exception of Texas and North Dakota, although a bigger drop of 62 tb/d occurred due to unexpected production disruption in the Gulf of Mexico. Nevertheless, oil production in Alaska increased by 17 tb/d in November. NGL production dropped by 53 tb/d m-o-m to a four-month low of 3.07 mb/d, in line with the view that NGL production would be the first to be impacted by a fall in rigs, with some rigs even moving back to dry gas plays. Total US liquids supply includes 5.1 mb/d of conventional crude oil, of which 3.9 mb/d is tight crude. In the following chart the breakdown of all liquid components produced in November is shown. Graph 5.4: US liquids supply, January 2009 to date Total US liquids supply (excluding processing gains) in November 2014 13.36 mb/d
1.3 mb/d 2.0 mb/d 1.1 mb/d 3.9 mb/d
Crude oil
Tight crude
NGLs
Unconventional NGLs
Oct 14
Jul 14
Apr 14
Jan 14
Oct 13
Jul 13
Apr 13
Jan 13
Oct 12
Jul 12
Apr 12
Jan 12
Oct 11
Jul 11
Apr 11
Jan 11
Oct 10
Jul 10
Apr 10
Jan 10
Oct 09
Jul 09
5.1 mb/d
Apr 09
Jan 09
mb/d 16 14 12 10 8 6 4 2 0
Biofuel + Other non-conventional oil
Sources: EIA and Rystad Energy.
On a quarterly basis , 4Q14 was revised down by 10 tb/d to 13.40 mb/d. Figures for the first three quarters were also revised down, despite a small upward revision to 2013 supply estimates, in addition to other factors in 2014. Finally, total US oil supply is estimated to increase by 1.59 mb/d to average 12.82 mb/d in 2014, representing a downward revision of 40 tb/d from the previous monthly report. Despite an annual increase in US liquids production, mainly from unconventional sources, namely tight crude and unconventional NGLs, year-on-year production growth declined over the period.
44
OPEC Monthly Oil Market Report – February 2015
World Oil Supply Graph 5.5: US liquids vs. non-OPEC supply, q-o-q growth mb/d 1.0 0.8 0.6 0.4 0.2 0.0 -0.2 -0.4 -0.6 -0.8
0.89 0.84 0.29 0.33
0.41
0.31
0.31
0.19
0.33
0.14
-0.02
0.20 0.61
0.18 0.15
0.10
-0.24 -0.29
0.22
-0.03
-0.47 -0.05 -0.53 1Q14
-0.57
2Q14
3Q14
4Q14
Non-OPEC supply excl. US
1Q15
2Q15
US liquids growth
4Q15
3Q15
Non-OPEC supply growth
Source: OPEC Secretariat.
US oil production in 2014 is seen to stand at 11.95 mb/d, 12.79 mb/d, 13.12 mb/d and 13.40 mb/d on a quarterly basis. Graph 5.6: US quarterly production, annual comparison mb/d 14 13 12 11 10 9 1Q
2Q 2012
3Q 2013
4Q
2014
2015
Graph 5.7: US annual liquids production and annual growth mb/d 12.82
16
Percentage 13.64 16%
14
14%
12
12%
10
10%
8
8%
6
6%
4
1.59
2
4% 0.82
0
2% 0%
2008
2009
2010
US annual production
2011
2012
Y-o-y growth
2013
2014 2015 (estimate) (forecast)
% change y-o-y growth (RHS)
Source: OPEC Secretariat.
OPEC Monthly Oil Market Report – February 2015
45
World Oil Supply
Oil production from main US shale plays Oil production from main shale plays has decreased in most of the US lower 48 states in November 2014, with the exception of Texas and North Dakota, where the main growth in tight crude is coming from Eagle Ford, Permian Delaware, Permian Midland and Bakken shale. Based on the US Energy Information Administration (EIA) monthly report and actual US crude oil production figures for November, total tight crude supply clearly increased from August to November, as seen in Table 5.2. This trend is expected to continue over the next months. Table 5.2: Comparison of US crude oil production and growth, m-o-m
Crude oil production Gulf of Mexico Alaska Crude excl. Gulf of Mexico and Alaska
Aug 14
Sep 14
Oct 14
Nov 14
8,743 1,436 398 6,909
8,902 1,415 477 7,010
9,051 1,445 500 7,106
9,020 1,383 517 7,120
-
101
96
14
M-o-m crude growth mostly coming from tight crude Sources: EIA and OPEC.
US onshore drilling activity in parts of both emerging and mature oil production regions declined by 288 rigs from a peak of 1,551 in early October to 1,263 rigs in January, because of unattractive economic returns. Although the heavy decline in total onshore rig counts could impact production, two main factors prevent a tight crude output drop. The first is an increase in the share of horizontal well drilling compared with vertical and directional well drilling employed in most plays’ sweet spots in the current circumstances, while the second is the time lag between drilling and well completion, which is at least a three-month period.
Production (LHS)
Rig count (RHS)
Sources: Baker Hughes, EIA and OPEC.
46
Rig
% 76%
1,600
74%
1,500
72% 70%
1,400
68%
1,300
66%
Jan 15
Nov 14
Sep 14
Jul 14
1,200
May 14
64%
Mar 14
Jan 15
Nov 14
Sep 14
Jul 14
May 14
Mar 14
tb/d 1,600 1,550 1,500 1,450 1,400 1,350 1,300 1,250 1,200
Jan 14
tb/d 8,800 8,600 8,400 8,200 8,000 7,800 7,600 7,400
Graph 5.9: US weekly onshore oil rig count vs. percentage change in horizontal drilling
Jan 14
Graph 5.8: US weekly onshore oil rig count vs. crude oil output (lower 48 states)
Horizontal drilling change (LHS) Rig count (RHS) Source: Baker Hughes and OPEC.
OPEC Monthly Oil Market Report – February 2015
World Oil Supply Canada and Mexico Canada’s oil supply is estimated to increase by 0.21 mb/d over the previous year to average 4.21 mb/d in 2014, indicating an upward revision of 30 tb/d compared with the previous MOMR. The upward revision came on the back of updated production data in all quarters. The expected growth is supported by oil sands developments. Projects such as Sunrise phase 1, Foster Creek phase 1F and Cold Lake phases 14–16, are anticipated to support growth, in addition to shale oil developments in Cardium, Bakken and Duvernay, as well as gas and NGL production from Montney and Horn River shale in 2014. Preliminary estimates indicate that total liquid output from Canadian unconventional sources in 2014 is at 0.35 mb/d. Oil prices will play an important role in the development of Canada’s oil supply in the next years. Any remaining risks are associated with forecasts on logistics, and technical and environmental factors, among others. Canada’s oil supply in 2014 is expected to average 4.29 mb/d, 4.13 mb/d, 4.18 mb/d and 4.25 mb/d on a quarterly basis. Graph 5.10: Canada’s annual liquids production and annual growth mb/d
Percentage
5
4.35
4.21
4
8% 6%
3
4%
2 2%
1
0.21
0.14
0 -1
0% -2%
2008
2009
2010
Canada annual production
2011
2012
Y-o-y growth
2013
2014 2015 (estimate) (forecast)
% change y-o-y growth (RHS)
Source: OPEC Secretariat.
Mexico’s oil supply is anticipated to decline by 90 tb/d from the previous year to average 2.80 mb/d in 2014, unchanged from the previous month. In 2013, Mexican crude oil production encountered a minor decline of 30 tb/d, which was much lower than that of 2014, as operators managed to stabilize oil output. Mexican liquids production was revised down by 10 tb/d to average 2.72 mb/d in 4Q14, with y-o-y declines of 180 tb/d, and crude output falling by 0.16 mb/d. This occurred when the Tsimin and Xux fields came online in November; together, they were producing 0.1 mb/d throughout 2014. Production declines were led by heavy crude output, which represented 70% of Pemex’s production. Heavy crude output fell by 100 tb/d across the year. Output at the Cantarell field dropped by 58 tb/d over the previous year. Despite strong output from the country’s largest producing field Ku-Maloob-Zaap in recent years, it experienced a decline in 2014 for the first time by 7 tb/d, y-o-y. Mexican oil production in December 2014 consisted of 1.2 mb/d of heavy oil, 0.9 mb/d of light crude, 0.3 mb/d of super light and 0.35 mb/d of NGLs. Mexico’s oil supply in 2014 is seen standing at 2.87 mb/d, 2.85 mb/d, 2.77 mb/d and 2.72 mb/d on a quarterly basis.
OPEC Monthly Oil Market Report – February 2015
47
World Oil Supply Graph 5.11: Mexico’s annual liquids production and annual growth mb/d
Percentage
3.5
0% 2.80
3.0
2.73
-1%
2.5
-2%
2.0
-3%
1.5
-4%
1.0
-5%
0.5
-6%
0.0 -0.5 2008
2009
2010
Mexico annual production
2011
2012
Y-o-y growth
2013
-0.07 -0.09 2014 2015 (estimate) (forecast)
-7%
% change y-o-y growth (RHS)
Source: OPEC Secretariat.
OECD Europe OECD Europe’s oil production is anticipated to decline by 0.16 mb/d, the largest decline among all non-OPEC regions, to average 3.58 mb/d in 2013, indicating a minor downward revision of 5 tb/d compared with the previous MOMR. The expected decline is less than the drop experienced in 2012, as supply difficulties encountered at that time are seen to have lessened in 2013 and support output. A downward revision was introduced to adjust for historical revisions, mainly for the UK. OECD Western Europe in 2014 is seen to have a supply of 3.75 mb/d, 3.51 mb/d, 3.40 mb/d and 3.67 mb/d on a quarterly basis. Graph 5.12: Norway’s annual liquids production and annual growth mb/d
Percentage 4%
3.0 2.5
2% 1.89
2.0
1.91
0%
1.5
-2%
1.0
-4%
0.5
0.05
0.02
0.0
-6% -8%
-0.5
-10% 2008
2009
2010
Norway annual production
2011
2012
Y-o-y growth
2013
2014 2015 (estimate) (forecast)
% change y-o-y growth (RHS)
Source: OPEC Secretariat.
Preliminary oil output figures in Norway in December 2014 indicated a drop by 40 tb/d m-o-m, to average 1.92 mb/d. Nevertheless, 4Q14 was revised up by 9 tb/d to average 1.95 mb/d, higher by 90 tb/d over the 3Q, and 70 tb/d higher than the same quarter a year earlier. Average daily liquid production in December registered at 1.44 mb/d of oil, 0.35 mb/d of NGLs and 0.12 mb/d of condensate, according to data from the Norwegian Petroleum Directorate (NPD). The Balder, Draugen, Ekofisk, Fram, Fram H-Nord, Gullfaks Sør, Oseberg Sør, Skuld, Ula and Visund fields saw reduced production in December due to technical problems. Production from the Brynhild
48
OPEC Monthly Oil Market Report – February 2015
World Oil Supply (Nemo) field in the Norwegian sector of the North Sea started in December. The start of production at the Eldfisk II project in Norwegian Sea waters was also recently announced. Eldfisk is one of the oldest fields on the Norwegian continental shelf and has been in production since 1979. The Eldfisk II project was initiated in early 2011 to increase overall production from the field. The wells are projected to add 70 tboe/d to the Eldfisk production stream. The NPD also believes that total output in December has been 6% below expectations. Norwegian liquid output for 2015 is expected to grow by only 20 tb/d, a drop by 30 tb/d over 2014 growth. Norwegian oil production in 2014 is anticipated to average 1.96 mb/d, 1.79 mb/d, 1.86 mb/d and 1.95 mb/d on a quarterly basis. The UK’s oil supply is estimated to decline by 20 tb/d to average 0.86 mb/d in 2014, indicating a minor upward revision of 10 tb/d compared with the previous month. This revision was carried over from adjustments to 4Q14, although UK liquids production increased by 80 tb/d to average 0.91 mb/d in December, thus 4Q14 was revised up by 30 tb/d to 0.87 mb/d, following the normal seasonal pattern, but remained lower by 20 tb/d over the same period one year earlier. Nevertheless, throughout 2014 UK liquid production surprised to the upside with a 3% y-o-y decline compared with a five-year average drop of 10%, mainly due to stable output from the Buzzard field. Graph 5.13: UK annual liquids production and annual growth Percentage
mb/d 2.0 1.5 0.86
1.0
0.83
0.5 0.0 -0.02
-0.03
-0.5 2008
2009
2010
UK annual production
2011
2012
Y-o-y growth
2013
0% -2% -4% -6% -8% -10% -12% -14% -16% -18% -20%
2014 2015 (estimate) (forecast)
% change y-o-y growth (RHS)
Source: OPEC Secretariat.
As per historical data, the UK’s oil supply dropped 0.17 mb/d or 14% in 2012. Such a decline is higher than the natural decline at mature producing areas and has arisen partially from various shutdowns on technical grounds. Yet 2014 is foreseen to experience a recovery from such low levels or at least a slowdown from the decline in 2013, which registered a decline of 80 tb/d. Recent stabilization of the Buzzard field was a positive factor supporting UK output in both 2013 and 2014. The UK’s oil supply in 2014 is seen averaging 0.97 mb/d, 0.90 mb/d, 0.71 mb/d and 0.87 mb/d on a quarterly basis.
OECD Asia Pacific Oil production in OECD Asia Pacific is seen increasing by 30 tb/d in 2014 to average 0.52 mb/d, indicating an upward revision of 20 tb/d, compared with the previous
OPEC Monthly Oil Market Report – February 2015
49
World Oil Supply MOMR. This upward revision is due to upward revisions for Australia in all quarters of 2014, while a downward revision was made in the 4Q14 for New Zealand. OECD Asia Pacific’s total oil supply in 2014 is estimated to average 0.51 mb/d, 0.52 mb/d, 0.54 mb/d and 0.51 mb/d, on a quarterly basis. Australia’s oil supply is expected to increase by 30 tb/d in 2014 to average 0.44 mb/d, revised up by 20 tb/d from the previous month’s estimation. Australian oil production in 2014 is seen to stand at 0.43 mb/d, 0.44 mb/d, 0.45 mb/d and 0.43 mb/d on a quarterly basis.
Developing countries Total oil production in developing countries (DCs) was seen growing by 0.17 mb/d to average 12.31 mb/d in 2014, indicating a steady state with a negligible upward revision of 10 tb/d from the previous MOMR. In fact, there were no changes in the 2014 oil supply compared with the previous month’s assessment for DCs – i.e., Other Asia, Latin America, the Middle East and Africa – to report this month. Graph 5.14: Developing Countries’ quarterly production
Graph 5.15: Developing Countries’ quarterly production, annual comparison
mb/d
mb/d
12.7
12.7
12.6
12.6 12.5
12.5
12.4
12.4
12.3
12.3
12.2
12.2
12.1
12.1
12.0
12.0
11.9 11.8
11.9
1Q
1Q12 2Q12 3Q12 4Q12 1Q13 2Q13 3Q13 4Q13 1Q14 2Q14 3Q14 4Q14 1Q15 2Q15 3Q15 4Q15
11.8
2Q 2012 2014
3Q
4Q 2013 2015
Other Asia Other Asia’s oil supply declined by 70 tb/d, y-o-y to average 3.52 mb/d in 2014. Total oil supply in Other Asia in 2014 is expected to average 3.55 mb/d, 3.52 mb/d, 3.47 mb/d and 3.54 mb/d on a quarterly basis.
Latin America Latin America’s oil supply grew by 0.25 mb/d, y-o-y to average 5.03 mb/d in 2014. On a quarterly basis, total oil supply in Latin America is expected to average 4.87 mb/d, 4.93 mb/d, 5.11 mb/d and 5.22 mb/d, respectively. Brazil’s supply is estimated to average 2.91 mb/d in 2014, indicating an increase of 0.27 mb/d over the previous year, with an upward revision of 10 tb/d from the previous MOMR, mainly due to an upward adjustment for production data from 4Q14.
50
OPEC Monthly Oil Market Report – February 2015
World Oil Supply Brazil’s oil supply in 2014 is expected to stand at 2.62 mb/d, 2.64 mb/d, 2.73 mb/d and 2.78 mb/d on a quarterly basis. Graph 5.16: Brazil’s annual liquids production and annual growth mb/d
Percentage
3.5
3.06
2.91
12%
3.0
10%
2.5
8%
2.0
6%
1.5
4%
1.0 0.27
0.5
0.15
2% 0%
0.0
-2%
-0.5 2008
2009
2010
Brasil annual production
2011
2012
Y-o-y growth
2013
2014 2015 (estimate) (forecast)
% change y-o-y growth (RHS)
Source: OPEC Secretariat.
According to Petrobras, production systems that came into operation in 2014 and contributed to the record were: P-58, in Parque das Baleias and P-62, in the Roncador field, both in the Campos Basin, and Floating production, storage and offloading units (FPSOs) Cidade de Mangaratiba, in the Iracema South area, as well as Cidade de Ilhabela, in the Sapinhoá North area, both in the Santos Basin’s pre-salt region. Oil production in fields operated by Petrobras in both the Santos and Campos basin’s pre-salt layers, which are located in deep and ultra-deep waters, reached the historical 0.7 mb/d mark on 16 December. Output of 0.7 mb/d was reached a mere eight years after the first oil discovery at the pre-salt layer in 2006, and only six months after it reached the 0.5 mb/d mark in June. Only 34 production wells contributed to attainment of the 0.7 mb/d mark, proof of the high productivity of the fields. Sixteen of these wells are located in the Santos Basin, which accounts for 61% of the volume produced in the pre-salt area – approximately 0.43 mb/d. The remaining 18 wells are located in the Campos Basin and account for the remaining 39% of production or 0.27 mb/d. Pre-salt oil is currently produced by 12 different platforms, eight of which are producing exclusively from that geological layer. Total oil supply in December 2014 came to a record 3.13 mb/d, causing an upward revision to 4Q14 figures by 40 tb/d, to reach 3.08 mb/d, the highest quarterly level and higher than 3Q14 by 100 tb/d. Total liquids supply in Brazil, as an emerging non-OPEC oil producer, already passed the 3 mb/d level at the end of 2014. Colombia’s oil output was estimated to grow by 10 tb/d to average 1.03 mb/d in December. Despite this increase, there was no revision to 4Q14 figures, they remain unchanged at 1.02 mb/d. The 2014 output is estimated to have averaged 1.01 mb/d, a 20 tb/d dip compared with a year earlier. Although Colombia has the potential to increase its output, the country’s oil production was in danger during 2014, mainly due to the recurrence of political unrest and pipeline attacks. Moreover, this situation could be worsening due to hopeless exploration results and operational problems at mature fields, as well as the most important factor, declining oil prices. It is quite evident that the upstream oil industry in Colombia – where Ecopetrol, its largest producer, has cut its 2015 budget – has no room for oil production growth in the current year.
OPEC Monthly Oil Market Report – February 2015
51
World Oil Supply
Middle East The Middle East’s oil supply declined by 20 tb/d y-o-y to average 1.34 mb/d in 2014. On a quarterly basis, total oil supply from the Middle East is expected to average 1.34 mb/d, 1.34 mb/d, 1.36 mb/d and 1.33 mb/d, respectively.
Africa Africa’s oil supply grew by 10 tb/d, y-o-y to average 2.41 mb/d in 2014. On a quarterly basis, total oil supply from Africa is expected to average 2.44 mb/d, 2.41 mb/d, 2.40 mb/d and 2.39 mb/d, respectively.
FSU, other regions Total former Soviet Union (FSU) oil production is expected to average 13.43 mb/d in 2014, an increase of 0.02 mb/d over a year earlier, indicating a minor downward revision of 10 tb/d compared with the previous MOMR. This downward revision came on the back of a downward revision of 58 tb/d in Azerbaijan in 4Q14, although an upward revision was seen for oil output in Kazakhstan. Growth is only expected from Russia; nonetheless limited new developments coupled with declines in mature areas, as well as fiscal issues, have reduced anticipated growth in the FSU for 2014. However, the FSU remains the leading region next to OECD America in terms of production among non-OPEC regions. FSU production is expected to maintain a roughly 25% share of non-OPEC output for the year. On a quarterly basis, total oil supply from the FSU is seen to average 13.48 mb/d, 13.36 mb/d, 13.39 mb/d and 13.49 mb/d, respectively. Other Europe’s supply is expected to remain steady and average 0.14 mb/d in 2014. China’s oil supply is seen to grow by 10 tb/d to average 4.25 mb/d in 2014.
Russia Russian oil production is estimated to grow by 70 tb/d to average 10.58 mb/d in 2014, unchanged from the previous MOMR. The country’s oil supply growth in 2014 was lower by 60 tb/d over a year earlier. Part of this reduction was due to the low output of mature fields as well as sanctions by Western countries on Russian oil industries. Moreover, capex across Russian companies, excluding Rosneft, are set to fall by 13.2%, which could reduce total Russian output in 2015. Graph 5.17: Russia’s annual liquids production and annual growth mb/d
Percentage
12
10.58
10.50
3.0% 2.5%
10
2.0%
8
1.5%
6
1.0%
4
0.5%
2 0.07
0
0.0% -0.5%
-2 2008
2009
2010
Russia annual production
2011
2012
Y-o-y growth
2013
-0.07 2014 2015 (estimate) (forecast)
-1.0%
% change y-o-y growth (RHS)
Source: OPEC Secretariat.
52
OPEC Monthly Oil Market Report – February 2015
World Oil Supply Russia’s oil supply in 2014 is expected to average 10.59 mb/d, 10.55 mb/d, 10.52 mb/d, and 10.65 mb/d, on a quarterly basis. Graph 5.18: Russia’s quarterly production
Graph 5.19: Russia’s quarterly production, annual comparison
mb/d
mb/d
10.7
10.7 10.6
10.6
10.5 10.5 10.4 10.4 10.3 10.3
10.2 1Q
1Q12 2Q12 3Q12 4Q12 1Q13 2Q13 3Q13 4Q13 1Q14 2Q14 3Q14 4Q14 1Q15 2Q15 3Q15 4Q15
10.2
2Q 2012 2014
3Q
4Q 2013 2015
Caspian Kazakhstan’s oil production is seen to remain unchanged at 1.62 mb/d in spite of an upward revision by 21 tb/d in 4Q14 on the back of strong output in November and December of 1.72 mb/d and 1.70 mb/d, respectively. The future of Kazakh oil output relies on sustained investment in Tengiz (the largest-producing field, where output declined in 2014) and the Karachaganak field. On a quarterly basis, Kazakh oil supply is seen to average 1.65 mb/d, 1.57 mb/d, 1.61 mb/d and 1.66 mb/d, respectively. Oil supply in Azerbaijan is estimated to decrease by 30 tb/d in 2014 to average 0.84 mb/d, representing a downward revision of 10 tb/d from the previous MOMR. This revision has come on the back of lower production in November, making 4Q14 the weakest quarter in 2014, although output in December increased by 0.13 mb/d as maintenance ended at the central Azeri platform. Azeri output is expected to decline on the back of limited new developments, as well as drop in mature producing areas. On a quarterly basis, Azerbaijan’s oil supply is seen to stand at 0.85 mb/d, 0.87 mb/d, 0.86 mb/d and 0.78 mb/d, respectively.
China China’s oil supply in 2014 has been steadily showing minor growth of 10 tb/d to average 4.25 mb/d, unchanged from the previous month’s estimate. This, despite higher output from the offshore Wenchang 13-6 field ramping up and another offshore project – Enping 24-2 FPSO – which started up at the end of October. Thus, Chinese oil production reached its highest record for 2014 in November at 4.37 mb/d. CNOOC’s successful exploration and production programme in the South China Sea indicates a bright outlook for production growth for the upcoming year. CNOOC recently announced another South China Sea deepwater discovery with the successful completion of the Lingshui 25-1-1 exploration well, which was drilled to a depth of 13,123 feet and encountered 240 feet of net pay.
OPEC Monthly Oil Market Report – February 2015
53
World Oil Supply On a quarterly basis, China’s oil supply is seen to average 4.24 mb/d, 4.27 mb/d, 4.20 mb/d and 4.30 mb/d, respectively. Graph 5.20: China’s annual liquids production and annual growth mb/d
Percentage
5.0 4.5 4.0 3.5 3.0 2.5 2.0 1.5 1.0 0.5 0.0 -0.5
4.31
4.25
0.01 2008
2009
2010
China annual production
2011
2012
Y-o-y growth
2013
0.06
8% 7% 6% 5% 4% 3% 2% 1% 0% -1%
2014 2015 (estimate) (forecast)
% change y-o-y growth (RHS)
Source: OPEC Secretariat.
Forecast for 2015 Non-OPEC supply Non-OPEC’s oil supply is forecast to grow by 0.85 mb/d in 2015 to average 57.09 mb/d, indicating a downward revision of 0.42 mb/d from the previous MOMR. Various upward revisions were applied to oil supply estimations for non-OPEC producers to nearly all quarters of 2014, which were partially carried over to 2015. NonOPEC supply growth in 2015 is expected to experience increases in all quarters of 2015 on a y-o-y basis, but at a slower pace. The main factors for the lower growth prediction in 2015 are price expectations, a declining number of active rigs in North America, a decrease in drilling permits in the US and a reduction in the 2015 spending plans of international oil companies. Another indication of uncertainty in the production growth outlook for the coming months is the number of active rigs around the world, particularly in those regions in which the oil production breakeven point is much higher than the current oil prices. According to the latest report of Baker Hughes, US onshore drilling activity in some areas of both emerging and mature oil production regions declined by 288 rigs from a peak of 1,551 in early October to 1,263 rigs in January because of unattractive economic returns. On a regional basis, OECD Americas is expected to have the highest growth of 0.89 mb/d, followed by Latin America, China, Other Asia and OECD Asia Pacific, while FSU, the Middle East and OECD Europe are seen to decline. Growth is expected to come mainly from the US, Brazil, Canada and China, while supplies from Colombia, Mexico, Russia, Yemen, Azerbaijan, Indonesia, Egypt and the UK are seen to decline. The risk and uncertainties associated with the supply forecast due to recent decline in oil prices remain high on both sides, especially for the US, Canada, Russia, Colombia and the UK. Non-OPEC supply in 2015 is expected to average 57.55 mb/d, 57.08 mb/d, 56.79 mb/d and 56.94 mb/d, on a quarterly basis.
54
OPEC Monthly Oil Market Report – February 2015
World Oil Supply The 2015 forecast remains particularly sensitive to actual prices available at the wellhead and drilling economics that vary across regions and operators. This forecast with low growth projected for 2015, is subject to the continuation of current oil market circumstances for a period of at least six months to the end of June 2015. Table 5.3: Non-OPEC oil supply in 2015, mb/d
Americas of which US Europe Asia Pacific Total OECD
2014 19.84 12.82 3.58 0.52 23.94
1Q15 20.68 13.60 3.68 0.54 24.90
2Q15 20.69 13.70 3.53 0.55 24.77
3Q15 20.71 13.65 3.42 0.54 24.68
4Q15 20.84 13.62 3.64 0.51 24.99
2015 20.73 13.64 3.57 0.53 24.84
Change 15/14 0.89 0.82 -0.01 0.02 0.89
Other Asia Latin America Middle East Africa Total DCs
3.52 5.03 1.34 2.41 12.31
3.60 5.20 1.30 2.46 12.56
3.56 5.11 1.29 2.42 12.38
3.52 5.09 1.27 2.40 12.27
3.47 4.98 1.26 2.37 12.09
3.54 5.09 1.28 2.41 12.32
0.02 0.06 -0.06 0.00 0.02
FSU of which Russia Other Europe China Total "Other regions" Total Non-OPEC production Processing gains
13.43 10.58 0.14 4.25 17.82 54.07 2.16
13.46 10.60 0.14 4.30 17.91 55.37 2.17
13.33 10.54 0.14 4.28 17.76 54.90 2.17
13.22 10.47 0.14 4.30 17.66 54.62 2.17
13.18 10.42 0.14 4.36 17.68 54.77 2.17
13.30 10.50 0.14 4.31 17.75 54.91 2.17
-0.13 -0.07 0.00 0.06 -0.07 0.84 0.01
Total non-OPEC supply Previous estimate Revision
56.23 56.22 0.02
57.55 57.69 -0.14
57.08 57.37 -0.29
56.79 57.30 -0.51
56.94 57.61 -0.67
57.09 57.49 -0.41
0.85 1.28 -0.42
Revisions to the 2015 forecast In addition to historical revisions, there were a few offsetting adjustments to the 2015 non-OPEC supply forecast. In the new forecast, following the bottom-up approach, a number of factors at current conditions were assumed; announced reductions in IOCs’ capex, revisions to some countries’ annual decline rate (ADR), geopolitics and US rig counts. Hence, the US total oil supply forecast for 2015 has been revised down by 130 tb/d, Canada by 20 tb/d, the UK by 20 tb/d, Colombia by 80 tb/d, Yemen by 60 tb/d, Russia by 60 tb/d and Azerbaijan by 40 tb/d, compared with the last MOMR. US liquid production is anticipated to average 13.64 mb/d in 2015, indicating growth of 0.82 mb/d y-o-y, which is 130 tb/d less than the previous MOMR figure. Total tight crude output from US shale plays is expected to grow by 0.59 mb/d to average 4.46 mb/d in 2015. Unconventional NGLs will only increase by 50 tb/d, while most producers will favour moving their drilling rigs to dry gas production areas. Oil production from the Gulf of Mexico is expected to grow by 0.18 mb/d.
OPEC Monthly Oil Market Report – February 2015
55
World Oil Supply Table 5.4: US production in 2014 and 2015 2014 Estimated mb/d
2015 Forecast mb/d
Growth y-o-y tb/d
Eagle Ford shale Bakken shale Permian Midland Permian Delaware Niobrara Others Oil from unconventional gas
1.3 1.2 0.4 0.3 0.2 0.4 0.1
1.5 1.3 0.5 0.4 0.3 0.4 0.1
150 140 110 100 50 30 10
Total US tight oil
3.9
4.5
590
Unconventional NGLs
2.0
2.1
50
US Gulf of Mexico
1.4
1.6
180
Total US output
7.3
8.1
820
US growth by source
Tight crude producers are aware that typical oil wells in shale plays decline 60% annually, and this loss can be recouped only by drilling new wells. As drilling subsides due to high costs and low oil prices, production can be expected to follow, possibly late in 2015. On a quarterly basis, the US liquids supply in 2015 is expected to average 13.60 mb/d, 13.70 mb/d, 13.65 mb/d and 13.62 mb/d, respectively. Canada’s oil output is forecast to average 4.35 mb/d in 2015, an increase of 0.14 mb/d over the previous year, but a downward revision of 20 tb/d compared with the previous MOMR. This revision comes on expected weak production figures, which may come about due to operator companies’ budget reductions, although the construction of some projects such as Surmont 2 is still on track. Preliminary figures indicate November Canadian oil production was higher m-o-m by 40 tb/d at 4.25 mb/d, including 30 tb/d from the Surmont project. The Surmont 2 in-situ project, which is jointly operated with Total E&P Canada, is designed to produce up to 136 tb/d. Canada’s oil production outlook for 2015 remains steady on expected conventional oil, but output from unconventional sources will gradually be affected by sustained low oil prices. On a quarterly basis, Canada’s oil supply in 2015 is expected to average 4.34 mb/d, 4.26 mb/d, 4.30 mb/d and 4.47 mb/d, respectively. In 2015, Mexico’s oil output is expected to ease somewhat given the startup of more shallow fields developed by Pemex. The decline rate is expected to reach at least 70 tb/d compared with the 2014 annual supply. North Sea output is also expected to decline, although Norway’s new project startups will bring new volumes on stream this year. However, according to company budgets, total investment has dropped by 13.7% y-o-y. This will probably lead to the stopping or delay of some projects, including Statfjord and Snorre. Moreover, at today’s prices, over 15% of the UK’s North Sea output is uneconomical. It is also expected that some projects such as Valhall, Ula and Draugen face a spending risk this year. It is also anticipated that small E&P companies will reduce investment by $6.9 billion (14.2%).
56
OPEC Monthly Oil Market Report – February 2015
World Oil Supply OECD Europe’s 2015 supply will decline by 10 tb/d to 3.57 mb/d compared with 2014, when expected growth coming from new projects in Norway will be offset by heavy declines in the UK. On a quarterly basis, output would be at 3.68 mb/d, 3.53 mb/d, 3.42 mb/d and 3.64 mb/d, respectively. In Brazil, despite the fall in oil prices, growth of 0.15 mb/d is expected in 2015, largely based on only one field scheduled to come online: Iracema Norte. Petrobras reported a record output of 2.47 mb/d in December, with pre-salt output reaching another record high of 0.7 mb/d. However, future projects will be at risk, given Petrobras’ precarious finances. The company is expected to cut capex this year, which could temper growth from 2H15. Colombia’s two largest oil companies – state-controlled Ecopetrol and Pacific Rubiales, which combined produce about 85% of the country’s crude and natural gas – announced last month that they were cutting overall capex investment this year by 25% and 40%, respectively. According to the Colombian Oil Producer's Association (ACP), the active companies in the oil sector expect to cut investments over the next two years after a sharp drop in crude prices. Based on the ACP, The cuts will primarily occur in 37 companies at 47% of exploration spending. When it comes to production, only 26% of the companies said they were planning to reduce spending. Nevertheless, it is clear that 2015 could be a challenging year for Colombia. Total output in 2014 y-o-y dropped by 20tb/d to average 1.01 mb/d. It turns out that 2013 was the end of an eight-year period of improvement, with oil output reaching 1.03 mb/d. For 2015, due to recent oil prices and the above-mentioned cuts in capex investment, oil production is expected to decline by at least 60 tb/d, depending on developments in the short-term. In Yemen, according to industry sources, the LNG export shut-in from the Balhaf LNG plant was due to undergo maintenance in February. But this was brought forward in light of the deteriorating security situation with the collapse of the government. Oil production has also been impacted during Yemen's recent crisis. Of the total 140 tb/d of crude output in Yemen, about 60 tb/d had already been shut-in before the beginning of the last week of January. Other operators, mainly in the eastern part (Masila Basin) of the country, have been pumping crude oil at the level of 80 tb/d so far. The total output of 87 tb/d produced in June 2014 from the oilfields located in the Marib-Shabwa Basin have been reduced to only 3 tb/d in late January. In contrast, oil production in the Masila Basin only declined by less than 10 tb/d during that same period. Oil production in the FSU in 2015 will drop by 0.13 mb/d, particularly in Russia, where it will decline by 70 tb/d, given the impact of sanctions, low prices and the absence of any large projects expected to come online. This makes declines from western Siberia’s mature fields more apparent. Rosneft's production decreased 1.8% y-o-y to 3.8 mb/d in December, mainly due to lower output at its biggest production subsidiary, Yuganskneftegas, which operates brownfields in western Siberia. At the same time, some companies like Bashneft have continued to see steady growth in their output, with production increasing by 15.1% on the year to 382 tb/d in January. This has been due mainly to the doubling of production at the Trebs and Titov oilfields, along with a 5% increase in production from traditional fields in the Republic of Bashkortostan. According to the energy ministry’s programme, Russia plans to maintain production above 10 mb/d this year, although it may fall in coming years if oil prices remain around $50/b for an extended period of time. As a result, the production outlook for the coming months is murky and suggests a possible decline of at least 70 tb/d to 10.50 mb/d in 2015. Some operators have stated that new technologies will be utilized to stop natural
OPEC Monthly Oil Market Report – February 2015
57
World Oil Supply decline. However, the supply forecast remains associated with a high level of risk due to technical, political, geological and price factors. Russian crude exports increased sharply in December to 4.4 mb/d due to the export duty being reduced to 42% in 2015 from 59%. Total output for 2015 is expected to be at 10.60 mb/d, 10.54 mb/d, 10.47 mb/d and 10.42 mb/d on a quarterly basis. Oil production in Kazakhstan relies on sustained investment in Tengiz, the largest producing field where output declined in 2014, and the Karachaganak field. Moreover, the giant Kashagan oilfield is not likely to restart until the end of 2016. Total output in 2015 in the FSU is forecast to be at 13.46 mb/d, 13.33 mb/d, 13.22 mb/d and 13.18 mb/d on a quarterly basis. In 2015, output in China is expected to rise by 60 tb/d, as new projects from 2014 continue to ramp up, particularly those projects in offshore regions.
OPEC NGLs and non-conventional oils OPEC natural gas liquids (NGLs) and non-conventional oils were estimated to average 5.83 mb/d in 2014, representing growth of 0.18 mb/d over the previous year. In 2015, OPEC NGLs and non-conventional oil are projected to average 6.03 mb/d, an increase of 0.20 mb/d over the previous year. Compared with the last MOMR, there are no changes in the 2014 estimation or in the 2015 forecast for OPEC NGLs and nonconventional production. Table 5.5: OPEC NGLs + non-conventional oils, 2012-2015
Total OPEC
58
2012 2013 5.57 5.65
Change 13/12 0.08
1Q14 5.73
2Q14 5.79
3Q14 5.86
4Q14 2014 5.93 5.83
Change Change 15/14 14/13 2015 0.18 6.03 0.20
OPEC Monthly Oil Market Report – February 2015
World Oil Supply
OPEC crude oil production According to secondary sources, total OPEC crude oil production in January averaged 30.15 mb/d, a decrease of 53 tb/d over the previous month. Crude oil output decreased mostly from Iraq and Libya, while production showed an increase in Angola, Saudi Arabia, Kuwait and the UAE. According to secondary sources, OPEC crude oil production, not including Iraq, stood at 26.80 mb/d in January, up by 226 tb/d over the previous month. Table 5.6: OPEC crude oil production based on secondary sources, tb/d Algeria Angola Ecuador Iran, I.R. Iraq Kuwait Libya Nigeria Qatar Saudi Arabia UAE Venezuela Total OPEC OPEC excl. Iraq
2013 1,159 1,738 516 2,673 3,037 2,822 928 1,912 732 9,586 2,741 2,356
2014 1,151 1,654 542 2,766 3,264 2,774 473 1,910 724 9,683 2,760 2,333
2Q14 1,158 1,646 541 2,768 3,266 2,786 222 1,895 729 9,675 2,749 2,337
3Q14 1,167 1,690 543 2,759 3,150 2,794 614 1,949 733 9,747 2,791 2,329
4Q14 Nov 14 Dec 14 Jan 15 1,152 1,158 1,143 1,130 1,678 1,656 1,655 1,777 545 543 554 553 2,765 2,765 2,779 2,754 3,422 3,337 3,632 3,353 2,719 2,699 2,699 2,777 678 673 475 343 1,898 1,919 1,896 1,940 700 698 687 680 9,608 9,584 9,590 9,683 2,753 2,741 2,777 2,841 2,324 2,323 2,320 2,321
Jan/Dec -12.6 122.1 -0.5 -25.1 -279.1 77.6 -131.7 44.4 -6.5 93.2 63.9 1.0
30,198 30,032 29,772 30,266 30,243 30,097 30,206 30,153 27,161 26,768 26,506 27,116 26,821 26,760 26,574 26,800
-53.2 225.9
Totals may not add up due to independent rounding.
Table 5.7: OPEC crude oil production based on direct communication, tb/d Algeria Angola Ecuador Iran, I.R. Iraq Kuwait Libya Nigeria Qatar Saudi Arabia UAE Venezuela Total OPEC OPEC excl. Iraq
2013 1,203 1,701 526 3,576 2,980 2,922 993 1,754 724 9,637 2,797 2,786
2014 1,192 1,652 557 3,121 3,110 2,867 480 1,807 709 9,713 2,794 2,683
2Q14 1,190 1,616 557 3,194 3,118 2,885 228 1,821 710 9,715 2,770 2,686
3Q14 1,196 1,709 557 3,003 3,076 2,876 571 1,724 720 9,769 2,881 2,668
4Q14 Nov 14 Dec 14 Jan 15 1,179 1,190 1,173 1,165 1,726 1,691 1,735 .. 560 563 561 561 3,020 3,000 3,050 3,020 3,141 3,009 3,356 3,046 2,807 2,790 2,800 2,850 735 761 525 360 1,816 1,733 1,890 1,899 682 681 684 674 9,644 9,610 9,630 9,680 2,790 2,763 2,917 2,960 2,701 2,694 2,733 ..
31,599 30,683 30,490 30,750 30,801 30,485 31,054 28,619 27,573 27,372 27,673 27,660 27,476 27,698
.. ..
Jan/Dec -8.0 .. 0.0 -30.0 -310.0 50.0 -165.0 8.8 -10.0 50.2 43.3 .. .. ..
Totals may not add up due to independent rounding. .. Not availab le.
OPEC Monthly Oil Market Report – February 2015
59
World Oil Supply
World oil supply Preliminary data indicates that global oil supply decreased by 0.29 mb/d to average 93.15 mb/d in January 2015 compared with the previous month. The decline of OPEC production as well as non-OPEC supply in January decreased global oil output. The share of OPEC crude oil in total global production increased slightly to 32.4% in January compared with the previous month. Estimates are based on preliminary data for non-OPEC supply as well as OPEC NGLs and non-conventional from direct communications, while estimates for OPEC crude production are based on secondary sources. Graph 5.21: OPEC and world oil supply mb/d 31
mb/d 94
OPEC crude production (LHS)
60
Jan 15
Dec 14
Nov 14
Oct 14
Sep 14
Aug 14
Jul 14
Jun 14
May 14
Apr 14
Mar 14
Feb 14
Jan 14
Dec 13
Nov 13
89
Oct 13
26
Sep 13
90
Aug 13
27
Jul 13
91
Jun 13
28
May 13
92
Apr 13
29
Mar 13
93
Feb 13
30
World supply (RHS)
OPEC Monthly Oil Market Report – February 2015
Product Markets and Refinery Operations
Product Markets and Refinery Operations Product markets strengthened in the Atlantic Basin during January on the back of tight sentiment supporting light and middle distillate crack spreads in the US, as lower refinery runs caused product inventories to stop rising and supported margins. Product markets in Europe saw a recovery despite weak domestic demand, on the back of export opportunities and a balanced market allowing light and middle distillate crack spreads to strengthen. Meanwhile, the Asian market recovered during January on the back of support from tight sentiment fuelled by limited supply of naphtha and fuel oil which allowed margins to rise, despite increasing supplies of gasoline and middle distillates. Graph 6.1: Refinery margins, 2014-2015 US$/b
US$/b
WTI (US Gulf) Dubai (Singapore)
Arab Heavy (US Gulf) LLS (US Gulf)
Jan 15
Dec 14
-5
Nov 14
-5
Oct 14
0
Sep 14
0
Aug 14
5
Jul 14
5
Jun 14
10
May 14
10
Apr 14
15
Mar 14
15
Feb 14
20
Jan 14
20
Brent (Rotterdam)
US product markets saw a sharp recovery during January on the back of stronger domestic demand amid higher export opportunities to Latin America and tight sentiment fuelled by lower refinery runs with the start of the maintenance season in the region. The refinery margin for WTI crude in the USGC showed a sharp recovery of more than $3 to average around $4/b in January. Meanwhile, the margin for Light Louisiana Sweet (LLS) crude in the USGC averaged $8/b during January, a sharp gain of almost $4. European refining margins recovered the ground lost last month as product markets were supported by the tight environment amid strong export opportunities, mainly to Latin America, the Middle East and Asia. The refinery margin for Brent crude in Northwest Europe gained $2 to average $5/b in January. Asian refining margins showed a slight recovery in January on the back of positive developments seen in fuel oil and naphtha markets as limited supplies allowed the crack spreads to recover. Meanwhile, gasoline and middle distillate cracks continued pressured by increasing supplies in the region. Refinery margins in Singapore showed a gain of more than $1 from the previous month to average around $5.7/b in January.
OPEC Monthly Oil Market Report – February 2015
61
Product Markets and Refinery Operations
Refinery operations Refinery utilization rates in the US reversed their upward trend due to the start of the refinery maintenance season. Some outages also caused refinery runs to drop during January and contributed to tightening the market and supported margins in the region. Refinery utilization averaged 87.4% during January; about 5 percentage points (pp) lower than a month earlier. Graph 6.2: Refinery utilisation rates, 2014-2015
50
US
EU-16
Japan
Jan 15
50
Dec 14
60
Nov 14
60
Oct 14
70
Sep 14
70
Aug 14
80
Jul 14
80
Jun 14
90
May 14
90
Apr 14
100
Mar 14
100
Feb 14
%
Jan 14
%
Singapore
European refinery runs averaged almost 80% of refining capacity in December, corresponding to a throughput of 10.2 mb/d, a similar level to the previous month. Runs continued at a relatively high level, taking advantage of the lower crude prices seen in the last months and the recovery in margins. However, the refinery sector in Europe will be under pressure due to weaker domestic demand, along with increased competition, mainly from the starting of new refineries in the Middle East. Asian refinery levels have been on the rise with Chinese refineries averaging around 10.5 mb/d in December , around 250 tb/d higher than the previous month, to meet increasing seasonal demand in the region. Refinery runs in Singapore for December averaged around 93%, increasing 5 pp over the previous month, while Japanese throughputs averaged above 90% of capacity in January. The increase in Asian refinery utilization has led to higher distillate supplies in the last months and some pressure from the supply side on gasoline and gasoil crack spreads. .
US market US gasoline demand stood at around 8.8 mb/d in January, about 350 tb/d lower than the previous month and 600 tb/d higher than the same month a year earlier. The gasoline crack recovered during January on the back of tight sentiment fuelled by the supply side, as maintenance at several USGC refineries and FCCs on the West Coast, along with some outages, caused inventories to stop rising since mid-January after a massive stock build of around 20 mb seen during December. Another supporting factor was higher requirements from South America amid expectations of increasing domestic demand in the coming weeks. The gasoline crack spread saw a sharp recovery of $5 to average $16/b in January.
62
OPEC Monthly Oil Market Report – February 2015
Product Markets and Refinery Operations Graph 6.3: US Gulf crack spread vs. WTI, 2014-2015 US$/b
US$/b
40
40
30
30
20
20
10
10
0
0 -10
Prem.Gasoline Unl.93
Jet/Kero
Gasoil/Diesel (0.05%S)
Jan 15
Dec 14
Nov 14
Oct 14
Sep 14
Aug 14
Jul 14
Jun 14
May 14
Apr 14
Mar 14
Feb 14
Jan 14
-10
Fuel oil (180c)
Middle distillate demand stood at around 4.2 mb/d in January, around 400 tb/d higher than the previous month and 60 tb/d lower than the same month a year earlier. The middle distillate market recovered during January on the back of stronger domestic demand amid tight sentiment in the market, with inventories falling since the second week of January amid lower refinery runs and higher exports to Latin America, mainly to Peru. This compensated for the fewer arbitrage opportunities seen to Europe during January. The USGC gasoil crack gained $4 versus the previous month to average around $17/b in January. At the bottom of the barrel, the fuel oil crack continued to gain some ground on the back of a tight environment, as US stocks continued below their typical average amid some increasing supply requirements by utilities during the colder periods of the last weeks. Another positive factor has been the expectation of higher arbitrage to Asia, although this has been affected by the temporary lack of VLCC availability. The fuel oil crack in the USGC gained more than $1 during January.
European market Product markets in Europe saw some recovery despite weak domestic demand on the back of export opportunities and a balanced market, allowing light and middle distillate crack spreads to recover. The gasoline market recovered in Europe on the back of healthy export opportunities to West Africa and higher exports to Central and South America, which have become more workable for European producers in the last weeks, due to the decline in US gasoline output. In addition, there have been export opportunities to send steady volumes to the Middle East, where demand has been on the rise. The gasoline crack spread against Brent gained $3 to average $14/b in January.
OPEC Monthly Oil Market Report – February 2015
63
Product Markets and Refinery Operations The light distillate naphtha crack exhibited a sharp recovery of more than $4, supported by strong domestic petrochemical demand with naphtha enjoying an economic advantage as feedstock, as LPG prices have been on the rise. Graph 6.4: Rotterdam crack spreads vs. Brent, 2014-2015 US$/b
US$/b
30
30
20
20
10
10
0
0
Prem.Gasoline Unl.98 ppm
Jet/Kero
Gasoil 10 ppm
Jan 15
Dec 14
Nov 14
Oct 14
Sep 14
Aug 14
Jul 14
Jun 14
May 14
Apr 14
-20
Mar 14
-20
Feb 14
-10
Jan 14
-10
Fuel oil (1.0%S)
Middle distillate cracks recovered slightly, gaining some ground in a relatively balanced market. Despite a winter season that has so far not lent enough support to heating oil demand, lower prices have encouraged some demand for stocking in Europe, which has contributed to supporting crack spreads. However, the potential uptick has been limited due to pressure coming from the supply side with increasing Russian ULSD exports to Europe seen after the planned reduction in the export duty. This, however, has been partially offset by the reduction of inflows coming from the US during the last weeks due to expected rising seasonal demand and increased maintenance activity in that region, thereby helping to balance the market. The gasoil crack spread against Brent crude at Rotterdam gained 50¢ versus the previous month to average around $15.4/b in January. At the bottom of the barrel, fuel oil cracks strengthened during last month on the back of stronger demand amid higher export opportunities to Asia, which have continued to tighten the bunker market in the region. The Northwest European fuel oil crack gained more than $2 versus the previous month’s level to average around minus $11/b in January.
Asian market The Asian market strengthened slightly during January on the back of support coming from tight sentiment fuelled by limited supply of naphtha and fuel oil, which allowed margins to rise, despite pressure exerted by increasing supplies, on gasoline and middle distillate crack spreads. The Singapore gasoline crack continued to weaken during January as the supply side continued to pressure the market with higher export levels from Northeast Asia.
64
OPEC Monthly Oil Market Report – February 2015
Product Markets and Refinery Operations The demand side offset the supply pressure with increasing import requirements from Pakistan and Indonesia due to some limitations in refinery capacity. Another supporting factor was the shutdown of the Taiwan refinery conversion units. The gasoline crack spread against Dubai crude in Singapore remained at around an average of $9/b in January, a similar level to the previous month. The Singapore naphtha crack showed a sharp recovery of more than $4/b on the back of stronger buying interest from the petrochemical sector amid a tightening market due to some weather-related delays in volumes coming from the west. Graph 6.5: Singapore crack spread vs. Dubai, 2014-2015 US$/b
US$/b 30
30
20
20
10
10
0
0
Prem.Gasoline Unl.92
Jet/Kero
Gasoil 50 ppm
Jan 15
Dec 14
Nov 14
Oct 14
Sep 14
Aug 14
Jul 14
Jun 14
May 14
Apr 14
-20
Mar 14
-20
Feb 14
-10
Jan 14
-10
Fuel oil 180 CST
At the middle of the barrel, cracks remained relatively stable in a balanced market with support coming from strong seasonal demand within the region. The middle distillate market continued supported by higher seasonal demand from several countries in the region amid export opportunities to Europe, which offset increasing supplies from some countries in the region, mainly Malaysia and India. The gasoil crack spread in Singapore against Dubai remained around the previous month’s level to average around $18/b in January. Looking forward, it is expected that the gasoil market in Asia will come under pressure in the next few months with increasing supplies coming from new capacity in the Middle East. The fuel oil market saw a sharp recovery in Singapore on the back of tightening supplies from the west, stemming from lower arbitrage volumes of heavy fuel oil due to lower refinery runs in the US and limited VLCC availability. The fuel oil crack spread in Singapore against Dubai gained more than $3 to average minus $3/b in January. The Asian market is expected to be under pressure in the coming months with increasing inflows to the region from the west, as a consequence of ECA regulations.
OPEC Monthly Oil Market Report – February 2015
65
Product Markets and Refinery Operations Table 6.1: Refinery operations in selected OECD countries Refinery throughput, mb/d
US France Germany Italy UK Euro-16 Japan
Nov 14 15.99 1.11 1.87 1.28 1.08 10.23 3.28
Dec 14 16.41 1.13 1.84 1.26 1.12 10.16 3.55
Jan 15 15.62 3.58
Refinery utilization, %
Change Jan/Dec -0.79 0.03
Nov 14 90.19 73.39 83.39 60.40 71.04 79.87 83.18
Dec 14 92.54 74.91 81.74 59.55 73.41 79.33 89.94
Jan 15 87.43
Change Jan/Dec -5.11
-
-
90.65
0.71
Sources: OPEC statistics, Argus, Euroilstock inventory report, IEA, EIA/DoE, METI and PAJ.
Table 6.2: Refined product prices, US$/b
US Gulf (Cargoes FOB): Naphtha Premium gasoline (unleaded 93) Regular gasoline (unleaded 87) Jet/Kerosene Gasoil (0.2% S) Fuel oil (1.0% S) Fuel oil (3.0% S) Rotterdam (Barges FoB): Naphtha Premium gasoline (unleaded 98) Jet/Kerosene Gasoil/Diesel (10 ppm) Fuel oil (1.0% S) Fuel oil (3.5% S) Mediterranean (Cargoes FOB): Naphtha Premium gasoline* Jet/Kerosene Gasoil/Diesel* Fuel oil (1.0% S) Fuel oil (3.5% S) Singapore (Cargoes FOB): Naphtha Premium gasoline (unleaded 95) Regular gasoline (unleaded 92) Jet/Kerosene Gasoil/Diesel (50 ppm) Fuel oil (180 cst 2.0% S) Fuel oil (380 cst 3.5% S)
Nov 14
Dec 14
Jan 15
Change Jan/Dec
76.80 93.98 84.40 97.79 93.48 69.39 63.74
55.61 70.76 61.52 76.12 72.66 53.27 48.88
55.45 63.76 54.72 63.86 64.76 42.49 38.47
-0.16 -7.00 -6.80 -12.26 -7.90 -10.78 -10.41
69.44 95.79 98.35 96.25 65.55 65.66
54.22 73.31 81.09 77.45 49.59 49.44
46.66 61.80 66.67 63.24 37.20 37.79
-7.56 -11.51 -14.42 -14.21 -12.39 -11.65
66.15 91.37 95.54 95.41 66.33 65.65
50.28 68.70 77.58 77.48 50.62 48.88
39.92 56.54 63.25 64.39 39.43 38.01
-10.36 -12.16 -14.33 -13.10 -11.19 -10.87
71.86 90.44 87.94 96.41 95.46 71.68 70.38
56.33 71.91 69.58 78.36 78.45 55.52 54.60
45.23 57.42 54.66 63.66 63.65 43.99 42.59
-11.10 -14.49 -14.92 -14.70 -14.80 -11.53 -12.01
* Cost, insurance and freight (CIF). Sources: Platts and Argus Media.
66
OPEC Monthly Oil Market Report – February 2015
Tanker Market
Tanker Market As seen in the previous months, January saw further freight rate increases for ship owners, particularly for the dirty tanker sector. The year 2014 ended on a positive note for tanker owners as freight rates for different classes stood at acceptable levels, mainly when taking into consideration the reduction in operational costs, which resulted from falling bunker prices. Spot freight rates for the dirty tanker sector generally increased in January across a number of reported routes, with minor exceptions. Average spot freight rates for VLCCs continued the gains seen since the beginning of the fourth quarter in the previous year. Suezmax freight rates also increased from last month by 5% on average, while Aframax experienced the strongest gain, increasing by 10% from a month earlier, to average WS116 points. This increase came as a result of severe weather conditions, several port delays and tightening tonnage supply.
Spot fixtures According to preliminary data, OPEC spot fixtures increased by 0.8 mb/d in January over the previous month to average 12.41 mb/d. This increase was driven mainly by eastbound fixtures, supported by high requirements from the east, however, compared with the same month last year, OPEC fixtures dropped by 5% in January. Table 7.1: Tanker chartering, sailings and arrivals, mb/d Nov 14
Dec 14
Jan 15
Change Jan 15/Dec 14
Spot Chartering All areas OPEC Middle East/East Middle East/West Outside Middle East
18.09 12.81 6.18 2.42 4.21
16.71 11.62 5.34 2.11 4.17
17.25 12.41 6.26 2.03 4.12
0.54 0.80 0.92 -0.08 -0.05
Sailings OPEC Middle East
23.71 17.36
23.36 17.02
24.06 17.71
0.70 0.69
Arrivals North America Europe Far East West Asia
9.69 12.66 8.88 4.35
9.59 12.50 8.89 4.28
10.49 12.07 8.30 4.75
0.89 -0.43 -0.58 0.48
Sources: Oil Movements and Lloyd's Marine Intelligence Unit.
Sailings and arrivals OPEC sailings, as per preliminary data, remained above the level seen last month, increasing by 0.7 mb/d to average 24.06 mb/d. Compared with the same month a year ago, they were up by 1.1%. Arrivals in Europe and the Far East dropped by 0.43 mb/d and 0.58 mb/d, respectively, in January from the previous month to average 12.07 mb/d and 8.30 mb/d, respectively, while arrivals in the US and West Asia went up by 0.89 mb/d and 0.48 mb/d during the same period to average 10.49 mb/d and 4.75 mb/d, respectively. Arrivals in all reported regions were higher in January than during the same month a year earlier, with the exception of arrivals in North American ports, which were down by 2.3%.
OPEC Monthly Oil Market Report – February 2015
67
Tanker Market
Spot freight rates VLCC The VLCC sector had a strong start in January as the beginning of the month showed an active market, mainly in the Middle East region. Activities in the market increased as January’s flow of tonnage requirements continued. This increase, which was registered on all reported routes, was caused mainly by an enhanced supply-demand balance, as the tonnage list thinned amid higher tonnage demand and an influx of activity. The VLCC market in West Africa followed a similar pattern to the Middle East market. Rates for tankers operating on the Middle East-to-East route saw the lowest increase among all other reported routes, rising by a slight WS1 point or 0.4% in January from the previous month to stand at WS69 points, while rates for tankers trading on the Middle East-to-West routes saw a higher increase of WS3 points or 9% from a month earlier to average WS39 points. The West Africa-to-East route also closed the month higher, rising by 4% to average WS67 points. In an annual comparison, all freight rates on reported routes from the Middle East to the East, the Middle East to the West and West Africa to the East showed gains at the levels seen last year by 21%, 8% and 17%, respectively. VLCC was the only class in the dirty tanker sector that showed an increase in freight rates compared with the same month a year before. VLCC activity slowed down after January requirements were completed, however VLCC demand for time charters continued to support freight rates and maintained shipowners’ gains. Graph 7.1: Monthly averages of crude oil spot freight rates Worldscale 180
Worldscale 180
Mediterranean/Northwest Europe (Aframax) Middle East/Far East (VLCC)
Jan 15
Dec 14
Nov 14
20
Oct 14
40
20
Sep 14
40
Aug 14
60
Jul 14
80
60
Jun 14
100
80
May 14
100
Apr 14
120
Mar 14
140
120
Feb 14
160
140
Jan 14
160
West Africa/USGC (Suezmax)
Suezmax Similar to what was seen in the VLCC market, activity in the Suezmax market picked up in January following the slower pace seen at the end of the previous month due to the holiday season. The increase in activity at the beginning of the month was not enough to support freight rates due to ample tanker availability at that point, which led to lower freight rates seen in the first week of the month. Freight rates stabilized afterwards, as activity increased mainly for West Africa loadings, benefiting mostly from both lower VLCC availability and the firming market.
68
OPEC Monthly Oil Market Report – February 2015
Tanker Market Suezmax spot freight rates increased in January by 7% from the previous month to stand at WS83 points. Rates for tankers operating on the West Africa-to-US route increased by 6% in January to stand at WS90 points, and rates on the Northwest Europe-to-US route gained 8% to stand at WS76 points. The increased freight rates came partially on the back of higher freight rates for VLCC as some owners were considering splitting their cargoes, and partially as increased demand has been seen for Suezmax in different regions. Severe weather conditions supported freight rates in many regions due to delays in the Turkish Straits and port closures in the Mediterranean Sea and Black Sea. On the other hand, Suezmax gains would have been higher if they were not offset by ballasting from the east, leading to a more populated tonnage list. Table 7.2: Spot tanker crude freight rates, Worldscale
Crude Middle East/East Middle East/West West Africa/East West Africa/US Gulf Coast Northwest Europe/US Gulf Coast Indonesia/East Caribbean/US East Coast Mediterranean/Mediterranean Mediterranean/Northwest Europe
Size 1,000 DWT
Nov 14
Dec 14
230-280 270-285 260 130-135 130-135 80-85 80-85 80-85 80-85
56 33 57 98 73 110 153 168 160
69 36 64 85 70 113 109 103 96
Change Jan 15 Jan 15/Dec 14 69 39 67 88 75 111 136 113 106
0 3 2 3 5 -3 28 10 10
Sources: Galb raith’s tanker market report and Platts.
Aframax Aframax registered the highest freight rate gains in January amid other dirty tanker vessels. Aframax average freight rates went up by 10% despite the mixed performance seen in its reported routes. Within the Aframax sector, spot freight rates were mixed, increasing on most routes while dropping on the Indonesia-to-East route which stood at WS111 points, down by 2% from the month before. Aframax freight rates in the Mediterranean and Black Sea increased due to bad weather conditions, a steady flow of cargoes in both regions and delays at the port of Trieste. As a result, freight rates for tankers operating on the Mediterranean-to-Mediterranean and Mediterranean-to-Northwest Europe routes increased in January by 10% each, to average WS113 points and WS106 points, respectively. Aframax freight rates increased in the Baltics on the back of higher exports, and thus tonnage demand. However, maintenance at Primorsk did offset freight rate increases afterwards. In the Caribbean, the Aframax market benefited from several factors, including weather delays, increasing cargo flows and tight tonnage supply in the US Gulf Coast (USGC), resulting in a freight rate increase of 25% to average WS136 points. Freight rate premiums for Aframax tankers equipped with ice breaking facilities increased dramatically in January as the ice season arrives.
OPEC Monthly Oil Market Report – February 2015
69
Tanker Market
Clean spot freight rates In the clean tanker market, spot freight rates took opposite patterns on both sides of Suez. Freight rates weakened on all reported routes in the west while moderately increasing in the east. Average rates decreased by 7%, as West of Suez rose by 3%, while East of Suez dropped by 11%. The biggest decline was registered for the Northwest Europe-to-US route, which dropped by 27% to average WS141 points. The rates for tankers trading on the Singapore-to-East route and Middle East-to-East route showed the only positive performances in January, increasing by 1% and 5%, respectively, from the previous month. While in the west, rates for the Mediterraneanto-Mediterranean and the Mediterranean-to-Northwest Europe routes each dropped by WS1 point. Freight rates in the West have been affected by the populated tonnage list and the weak market for medium-range tankers in the USGC. Graph 7.2: Monthly average of clean spot freight rates Worldscale
Middle East/Far East
Northwest Europe/USEC
Jan 15
Dec 14
Nov 14
Oct 14
50
Sep 14
50
Aug 14
100
Jul 14
100
Jun 14
150
May 14
150
Apr 14
200
Mar 14
200
Feb 14
Worldscale 250
Jan 14
250
Mediterranean/Mediterranean
Table 7.3: Spot tanker product freight rates, Worldscale
Products Middle East/East Singapore/East Northwest Europe/US East Coast Mediterranean/Mediterranean Mediterranean/Northwest Europe
Size 1,000 DWT
Nov 14
Dec 14
30-35 30-35 33-37 30-35 30-35
126 119 161 188 198
115 120 193 223 233
Change Jan 15 Jan 15/Dec 14 120 120 141 214 225
5 1 -52 -9 -8
Sources: Galb raith’s tanker market report and Platts.
70
OPEC Monthly Oil Market Report – February 2015
Oil Trade
Oil Trade January preliminary data showed US crude oil imports dropped to average 7.3 mb/d, down by 176 tb/d m-o-m and 239 tb/d or 3% y-o-y. US monthly product imports declined slightly from the previous month by 30 tb/d, though rising on an annual basis by 491 tb/d or 29%. Japan’s crude oil imports increased in December following a drop the previous month, rising by 475 tb/d or 15% to average 3.6 mb/d. The country’s product imports fell in December by 15 tb/d to average 685 tb/d, down by 2% m-o-m, though up by 7% y-o-y. China’s crude imports rose in December to a new peak, increasing by 972 tb/d or 16% to average 7.2 mb/d. In an annual comparison, China’s crude imports were up over the previous year by 849 tb/d or 13%. In December, India’s crude imports increased by 237 tb/d or 6% from the previous month to average 3.9 mb/d, reflecting an annual gain of 227 tb/d or 6%. The country’s product imports increased in December on both a monthly and annual basis by 44 tb/d and 97 tb/d, respectively, to average 509 tb/d.
US In January, preliminary data shows that US crude oil imports declined to average 7.3 mb/d, down by 176 tb/d from the previous month and 239 tb/d or 3% below one year earlier. Graph 8.1: US imports of crude and petroleum products mb/d 2.5
mb/d 8.0 7.5 7.0 6.5 6.0 5.5 5.0 4.5
2.0 1.5 1.0 0.5
Others* Jet fuel/kerosene
Propane/propylene Fuel oil
Jan 15
Dec 14
Nov 14
Oct 14
Sep 14
Aug 14
Jul 14
Jun 14
May 14
Apr 14
Mar 14
Feb 14
Jan 14
0.0
Gasoline Crude (RHS)
*Others: Contains natural gas liquids, liquefied refinery gases (LRG's), other liquids and all finished petroleum products except gasoline, jet fuel/kerosene, fuel oil and propane/propylene.
US monthly product imports slightly declined from the previous month by 30 tb/d, while on an annual comparison they rose by 491 tb/d or 29%. In January, US product exports were 87 tb/d higher than one month ago, averaging 3.5 mb/d. In an annual comparison, product exports were lower than one year earlier by 303 tb/d or 8%. As a result, US total net imports dropped in January by 293 tb/d or 5% to average 5.6 mb/d, though remaining above the previous year’s level by 358 tb/d or 7%.
OPEC Monthly Oil Market Report – February 2015
71
Oil Trade Graph 8.2: US exports of crude and petroleum products tb/d 5,000
tb/d 550 500 450 400 350 300 250 200 150 100 50 0
4,000 3,000 2,000 1,000
Others* Jet fuel/kerosene
Propane/propylene Fuel oil
Jan 15
Dec 14
Nov 14
Oct 14
Sep 14
Aug 14
Jul 14
Jun 14
May 14
Apr 14
Mar 14
Feb 14
Jan 14
0
Gasoline Crude (RHS)
*Others: Contains natural gas liquids, liquefied refinery gases (LRG's), other liquids and all finished petroleum products except gasoline, jet fuel/kerosene, fuel oil and propane/propylene.
In November, the first and second suppliers to the US held their positions from the previous month, with Canada remaining the premier crude supplier to the US, accounting for 40% of total US crude imports, though the figure was down from a month earlier by 134 tb/d or 4%. Saudi Arabia – which maintained its position as second-largest supplier to the US in November – increased its crude exports to the country from the previous month by 188 tb/d. Mexico came in as third-top supplier, accounting for 12% of total US crude imports, up by 150 tb/d or 20% from the previous month. Total crude imports from OPEC Member Countries were higher in November over the previous month, up by 264 tb/d or 11%, and accounted for 37% of total US crude imports. US product imports from OPEC Member Countries were higher by 19 tb/d or 9% from the previous month and 33 tb/d or 16% from the previous year. Canada and Russia maintained their positions as first and second products suppliers to the US, accounting for 31% and 10%, respectively. Unlike the picture in crude imports, US product imports from Canada were higher in November from the previous month by 127 tb/d. Imports from Russia were down by 123 tb/d from one month earlier. The United Kingdom came in as third-largest supplier to the US, with a stable share and volume compared with the previous month. The United Kingdom’s product exports to the US in November amounted to 92 tb/d. The greatest amount of US crude imported in November – averaging 2.9 mb/d – was sourced from North America, followed by Latin America, which averaged 2.4 mb/d. The Middle East came in as the third-top supplying region, with an average of 1.5 mb/d. Imports from Africa, Asia and the former Soviet Union (FSU) were all down from the previous month, averaging 305 tb/d, 22 tb/d and 35 tb/d, respectively, in November. Table 8.1: US crude and product net imports, tb/d
Crude oil Total products Total crude and products
72
Nov 14 6,772 -2,175 4,597
Dec 14 7,139 -1,244 5,895
Jan 15 6,904 -1,301 5,603
Change Jan 15/Dec 14 -236 -57 -293
OPEC Monthly Oil Market Report – February 2015
Oil Trade Regarding crude imports by PADD, the highest amount of crude imports to the US East Coast (USEC) in PADD-1 came from North America, followed by Africa, averaging 313 tb/d and 121 tb/d, respectively. North American imports were higher in November than one month earlier by 8%, while imports from Africa declined by 26%. Crude imports from Latin America and the Middle East also dropped from the previous month to average 83 tb/d and 89 tb/d, respectively. As seen previously, imports from PADD-2 were mostly sourced from North America, which provided 1.8 mb/d, down by 201 tb/d from the high level reached the previous month. PADD-2 also imported small volumes from the Middle East, averaging 32 tb/d, up by a slight 2 tb/d from one month earlier. PADD-3 increased it imports from Latin America in November by 283 tb/d to average 2 mb/d. Imports from the Middle East were also higher in November, rising by 99 tb/d from the previous month to average 914 tb/d. PADD-4 only imported from North America, averaging 317 tb/d in November, up by 72 tb/d from the previous month. The greatest amount of oil imported to the USWC came from the Middle East, which exported 537 tb/d to PADD-5 in November, followed by Latin America and North America, which exported 235 tb/d and 217 tb/d, respectively, the same month.
Japan Japan’s crude oil imports increased in December following a drop from the previous month, up by 475 tb/d or 15% to average 3.6 mb/d. In a y-o-y comparison, crude imports showed lesser volumes than over the previous year by 319 tb/d or 8%. At the same time, Japan’s refinery runs increased by nearly 210 tb/d in December from one month earlier. Saudi Arabia – as in the previous month – came in as first crude supplier to Japan, with a share of 31% of total crude exports to the country, up by 156 tb/d from one month before. The United Arab Emirates came in as second-largest supplier to Japan, with a share of 23% of total crude exports, despite a slight decline in volumes compared with the previous month. Russia was third-largest supplier with a share of 11%. Volumes imported from Russia were higher than in the previous month by 56 tb/d. Graph 8.3: Japan’s imports of crude and petroleum products tb/d
mb/d
1,200
5
1,000
4
800
3
600 2
400
Others*
LPG
Naphtha
Fuel oil
Dec 14
Nov 14
Oct 14
Sep 14
Aug 14
Jul 14
Jun 14
May 14
Apr 14
Mar 14
0
Feb 14
0
Jan 14
1
Dec 13
200
Crude oil
*Others: Contains gasoline, jet fuel, kerosene, gasoil, asphalt and paraffin wax.
OPEC Monthly Oil Market Report – February 2015
73
Oil Trade Japan’s product imports dropped in December by 15 tb/d to average 685 tb/d, down by 2% m-o-m, but up by 7% from the previous year. The country's oil product sales fell 4% in January from one year earlier, while its product exports dropped in December by 30 tb/d to average 515 tb/d. However, on an annual basis a gain of 61 tb/d or 13% was seen. Accordingly, Japan’s net imports increased in December by 490 tb/d to average 3.7 mb/d, the greatest amount since March 2014, reflecting a monthly gain of 15% and an annual drop of 8%. Graph 8.4: Japan’s exports of petroleum products tb/d 600
tb/d
500
500
400
400
300
300
200
200
100
100
600
Fuel oil
Gasoil
Jet fuel
Dec 14
Nov 14
Oct 14
Sep 14
Aug 14
Jul 14
Jun 14
May 14
Apr 14
Mar 14
Feb 14
Jan 14
0
Dec 13
0
Others*
*Others: Contains LPG, gasoline, naphtha, kerosene, lubricating oil, asphalt and paraffin wax.
Table 8.2: Japan’s crude and product net imports, tb/d
Crude oil Total products Total crude and products
Oct 14 3,310 -9 3,301
Nov 14 3,077 156 3,233
Dec 14 3,553 170 3,723
Change Dec 14/Nov 14 475 14 490
China China’s crude imports increased in December to reach a new peak, rising by 972 tb/d or 16% in December to average 7.2 mb/d, substantially increasing on the back of strategic stock building. At the same time, China’s refinery throughput increased in December by 260 tb/d. In an annual comparison the country’s crude imports were higher than the previous year by 849 tb/d or 13%. For the year of 2014, the figures reflect an increase of 520 tb/d or 9%. Saudi Arabia, Angola and Russia were the top suppliers to China in December, accounting for 15%,13% and 12%, respectively. Crude imports from all top suppliers were higher from the previous month; those from Saudi Arabia rose from one month earlier by 94 tb/d or 10%. Imports from Angola and Russia increased by 65 tb/d and 70 tb/d, respectively. Oman came in fourth, increasing its exports to China substantially in December by 254 tb/d or 50%.
74
OPEC Monthly Oil Market Report – February 2015
Oil Trade Graph 8.5: China’s imports of crude and petroleum products tb/d
tb/d
1,600
8,000
1,400
7,000
1,200
6,000
1,000
5,000
800
4,000
600
3,000
400
2,000
200
1,000
Others Diesel
LPG Fuel oil
Naphtha Asphalt
Gasoline Crude (RHS)
Dec 14
Nov 14
Oct 14
Sep 14
Aug 14
Jul 14
Jun 14
May 14
Apr 14
Mar 14
Feb 14
Jan 14
0
Dec 13
0
Jet fuel
In December, China exported 57 tb/d of crude oil following three months with no exports. In addition, Chinese product exports were up by 71 tb/d in December over the previous month, averaging 772 tb/d y-o-y, thus reflecting an increase of 47 tb/d or 6%. Graph 8.6: China’s exports of crude and petroleum products tb/d
tb/d
1,000
100 80
800
60
600
40 400
20
200
0
Others Diesel
LPG Fuel oil
Naphtha Asphalt
Gasoline Crude (RHS)
Dec 14
Nov 14
Oct 14
Sep 14
Aug 14
Jul 14
Jun 14
May 14
Apr 14
Mar 14
Feb 14
Jan 14
-20
Dec 13
0
Jet fuel
As a result, China’s net oil imports increased by 996 tb/d from the previous month and 756 tb/d from one year earlier. Table 8.3: China’s crude and product net imports, tb/d
Crude oil Total products Total crude and products
Oct 14 5,688 81 5,769
OPEC Monthly Oil Market Report – February 2015
Nov 14 6,200 262 6,462
Dec 14 7,115 343 7,458
Change Dec 14/Nov 14 915 81 996
75
Oil Trade
India In December, India’s crude imports increased by 237 tb/d or 6% from the previous month to average 3.9 mb/d, reflecting an annual gain of 227 tb/d or 6%. The country’s product imports increased on both a monthly and an annual basis by 44 tb/d and 97 tb/d, respectively, to average 509 tb/d in December. This increase came on the back of higher liquefied petroleum gas (LPG) imports in December as they rose by 55 tb/d from one month earlier, offset by lesser imports of gasoline. Graph 8.7: India’s imports of crude and petroleum products tb/d
tb/d
600
5,000
500
4,000
400
3,000
300 2,000
200
1,000
100
Dec 14
Nov 14
Oct 14
Sep 14
Aug 14
Jul 14
Jun 14
May 14
Apr 14
Mar 14
Feb 14
Jan 14
0
Dec 13
0
Others
LPG
Naphtha
Gasoline
Kerosene
Gasoil
Fuel oil
Crude (RHS)
For the same month, the country reported an increase in product domestic sales by 7% from one year earlier. India’s product exports were down in December by 88 tb/d or 6% to average 1.4 mb/d. In a y-o-y comparison, product exports were lower than the previous year by 111 tb/d or 7%; the country’s monthly product exports were down for diesel and naphtha. Graph 8.8: India’s exports of petroleum products tb/d
tb/d
2,000
2,000
1,500
1,500
1,000
1,000
500
500
Fuel oil
Gasoil
Jet fuel
Gasoline
Naphtha
Dec 14
Nov 14
Oct 14
Sep 14
Aug 14
Jul 14
Jun 14
May 14
Apr 14
Mar 14
Feb 14
Jan 14
0
Dec 13
0
Others
Meanwhile, the country’s net imports increased by 369 tb/d to average 3.0 mb/d, reflecting an increase of 14% m-o-m and 17% y-o-y.
76
OPEC Monthly Oil Market Report – February 2015
Oil Trade Table 8.4: India’s crude and product net imports, tb/d
Crude oil Total products Total crude and products
Oct 14 3,824 -1,058 2,765
Nov 14 3,713 -1,040 2,672
Dec 14 3,949 -908 3,041
Change Dec 14/Nov 14 237 132 369
Note: India data tab le does not include information for crude import and product export b y Reliance Industries.
FSU In December, total crude oil exports from the former Soviet Union dropped by 524 tb/d or 9% to average 5.3 mb/d. Crude exports through Russian pipelines declined as well, by 566 tb/d or16% to average 3 mb/d. Total shipments from the Black Sea dropped by 106 tb/d or 21% to average 409 tb/d, partly as a result of lower exports through the Novorossiysk port. Total Baltic Sea exports also dropped by 407 tb/d in December as shipments from Primorsk and Ust Luga port terminals dropped by 263 tb/d and 144 tb/d, respectively. Total shipments from the Druzhba pipeline declined by 35 tb/d to average 957 tb/d while Kozmino oil port shipments slightly dropped by 16 tb/d or 3% to average 480 tb/d. Exports through the Lukoil system experienced a minor drop from the Barents and Baltic Seas of 3 tb/d and 5 tb/d, respectively, from the previous month. Most other routes showed a drop in December from one month earlier. However, Russia’s Far East total exports were up by 18 tb/d or 6% from the previous month as volumes from both the Aniva Bay and de Kastri port terminals rose by 2 tb/d and 17 tb/d, respectively, from the previous month to average 323 tb/d. Central Asia’s total exports stood at 207 tb/d, with a drop of 7 tb/d from the KenkiyakAlashankou pipeline. Total Baltic Sea exports dropped by 93 tb/d, with all ports showing declines from the previous month, with the greatest fall seen at the Novorossiyk port terminal (CPC), where exports dropped by 89 tb/d to average 897 tb/d. In the Mediterranean Sea, BTC supplies showed an increase of 133 tb/d or 29% from the previous month to average 591 tb/d. Total product exports for the FSU dropped by 241 tb/d or 7% from the previous month to average 3.1 mb/d. This resulted from a decline seen in all product exports with no exception, particularly in fuel oil, VGO and naphtha.
OPEC Monthly Oil Market Report – February 2015
77
Oil Trade Table 8.5: Recent FSU exports of crude and petroleum products by source, tb/d 2013
3Q 14
4Q 14
Nov 14
Dec 14
739 739 535 204
570 570 409 162
503 503 358 145
516 516 372 144
409 409 264 145
Baltic Sea total Primorsk port terminal - total of which: Russian oil Others Ust-Luga port terminal - total of which: Russian oil Others
1,546 1,083 1,007 76 463 342 121
1,288 799 799 0 489 315 174
1,180 730 730 0 450 277 173
1,299 803 803 0 496 327 169
892 540 540 0 352 165 187
Druzhba pipeline total of which: Russian oil Others
1,032 1,000 32
1,025 993 32
988 956 32
993 961 32
957 925 32
Pacific ocean total Kozmino port terminal - total
434 434
552 552
517 517
496 496
480 480
China (via ESPO Pipeline) total China Amur
321 321
321 321
325 325
325 325
324 324
4,071
3,757
3,513
3,628
3,062
2013
3Q 14
4Q 14
Nov 14
Dec 14
111 111
125 125
125 125
121 121
118 118
19 19
16 16
13 13
16 16
11 11
Transneft system Europe
Asia
Black Sea total Novorossiysk port terminal - total of which: Russian oil Others
Total Russian crude exports Lukoil system Europe and North America Europe
Barents Sea Total Varandey offshore platform Baltic Sea Total Kalinigrad port terminal
Other routes Asia
Europe
2013
3Q 14
4Q 14
Nov 14
Dec 14
Russian Far East total Aniva bay port terminal De Kastri port terminal
259 114 145
235 103 133
294 107 186
305 114 191
323 116 207
Central Asia total Kenkiyak-Alashankou
239 239
230 230
209 209
214 214
207 207
Baltic sea total Novorossiysk port terminal (CPC) Supsa port terminal Batumi port terminal Kulevi port terminal
853 704 76 53 20
1,003 886 90 27 0
1,001 889 99 14 0
1,101 986 101 14 0
1,008 897 97 14 0
Mediterranean sea total BTC
641 641
683 683
549 549
458 458
591 591
2013 198 9 189
3Q 14 24 7 17
4Q 14 12 7 5
Nov 14 12 7 5
Dec 14 11 6 5
Russian rail Russian rail of which: Russian oil Others Total FSU crude exports Products Gasoline Naphtha Jet Gasoil Fuel oil VGO Total FSU product exports Total FSU oil exports
6,392
6,073
5,716
5,855
5,331
2013 122 390 11 857 1,415 263
3Q 14 80 481 7 897 1,598 250
4Q 14 103 477 1 884 1,452 265
Nov 14 126 506 2 943 1,509 309
Dec 14 96 452 1 911 1,427 261
3,058
3,312
3,181
3,395
3,148
9,450
9,385
8,897
9,250
8,479
Sources: Argus Nefte Transport and Argus Glob al Markets.
78
OPEC Monthly Oil Market Report – February 2015
Stock Movements
Stock Movements OECD commercial oil stocks fell by 18.5 mb in December to stand at 2,678 mb, nearly 112 mb higher than the same time a year ago and 43 mb above the latest five-year average. Crude indicated a surplus of around 78 mb, while product stocks remained 35 mb below the latest five-year average. In terms of days of forward cover, OECD commercial stocks stood at 58.6 days, 1.7 days higher than the latest five-year average. Preliminary data for January shows that total US commercial oil stocks rose by 26.8 mb to stand at 1,176 mb. With this build, they were nearly 102 mb above the latest five-year average. Within components, commercial crude saw a build of 30.7 mb, while product stocks abated this build, declining by 3.9 mb. The latest information for December showed that Chinese total oil commercial inventories fell by 5.1 mb to stand at 378.2 mb. Despite this stock draw, Chinese inventories remained 18.3 mb above the previous year at the same time.
OECD The latest information for December shows that total OECD commercial oil stocks fell by 18.5 mb for the third consecutive month. At 2,678 mb, inventories are nearly 112 mb higher than at the same time a year ago and around 43 mb above the latest five-year average. Within the components, commercial crude and product stocks were down by 7.6 mb and 10.9 mb, respectively. Graph 9.1: OECD commercial oil stocks mb
mb
2,850
2,850
2,800
2,800
2,750
2,750
2,700
2,700
2,650
2,650 Max/Min 2009-2013
2,600
2,600
2,550
2,550
2,500 Jan
Feb
Mar 2013
Apr
May
Jun 2014
Jul
Aug
Sep
Oct
Nov
2,500 Dec
Average 2009-2013
At 1,310 mb, OECD commercial crude stood at almost 78 mb above both the same time a year earlier and the latest five-year average. Despite the stock draw in December, commercial crude stocks in the OECD remained comfortable, driven by high non-OPEC supply. The contango in major benchmarks also encouraged refineries to build more crude inventories. OECD product inventories fell by nearly 11.0 mb to end December at 1,369 mb. At this level, they were 35 mb higher than a year ago at the same time, yet still 35 mb below the seasonal norm. The build in OECD product stocks in December reflected mainly higher refinery output in OECD countries.
OPEC Monthly Oil Market Report – February 2015
79
Stock Movements In terms of days of forward cover, OECD commercial stocks rose by 0.1 days in December from the previous month to stand at 58.6 days and were 1.7 days higher than the latest five-year average. Within the regions, OECD Americas’ days of forward cover were 2.5 days higher than the historical average, at 58.0 days in December, and OECD Asia-Pacific stood at 1.5 days above the seasonal average to finish the month at 45.6 days. At the same time, OECD Europe indicated a surplus of 1.0 day, averaging 68.4 days in December. Table 9.1: OECD commercial stocks, mb
Crude oil Products Total Days of forward cover
Oct 14 1,336 1,370 2,705
Nov 14 1,317 1,380 2,697
Dec 14 1,310 1,369 2,678
Change Dec 14/Nov 14 -7.6 -10.9 -18.5
Dec 13 1,232 1,335 2,567
58.8
58.5
58.6
0.1
56.1
In December, commercial stocks in OECD Americas fell by 6.9 mb to stand at 1,396 mb, a surplus of 80.0 mb above the seasonal norm and 75.4 mb above the same time a year ago. Within the components, crude and product inventories fell by 5.1 mb and 1.8 mb, respectively. At the end of December, commercial crude oil stocks in OECD Americas fell, ending the month at 712 mb, which is 67.0 mb above the latest five-year average and 82.3 mb higher than the same time a year ago. The decline was mainly driven by higher US crude oil refinery input, averaging nearly 16.4 mb/d. Refineries operated at around 92.5% of operable capacity in December. Product stocks in OECD Americas also fell in December to stand at 684 mb, a surplus of 13.1 mb above the same time one year ago, yet a deficit of 6.9 mb below the seasonal norm. The decline came mainly from improving demand in the US, combined with higher exports to Latin America. OECD Europe’s commercial stocks fell slightly by 0.5 mb in December to stand at 883 mb. This is 13.2 mb higher than the same time a year ago, yet 43.6 mb below the latest five-year average. Crude stocks went up by 1.0 mb, while product inventories saw a stock draw of 1.5 mb. OECD Europe’s commercial crude stocks rose in December following a drop of 5.1 mb in November. At 373 mb, crude inventories stood at 2.4 mb below the same period a year earlier and 6.7 mb less than the latest five-year average. This build was driven by lower European refinery runs. In contrast, OECD Europe’s commercial product stocks fell by 1.5 mb in December to stand at 510 mb. Despite this stock draw, European stocks were 15.5 mb above a year ago at the same time, but still 36.9 mb lower than the seasonal norm. OECD Asia-Pacific commercial oil stocks fell by 11.1 mb in December for the third consecutive month to stand at 400 mb, an increase of 18.5 mb over a year ago and 11.2 mb above the five-year average. Within components, crude and product stocks fell by 3.5 mb and 7.6 mb, respectively. Crude inventories ended the month of December at 225 mb, standing 13.0 mb above a year ago and 2.2 mb over the seasonal norm. Total product inventories ended December at 175 mb, indicating a surplus of 5.5 mb over a year ago and 9.0 mb higher than the seasonal norm.
80
OPEC Monthly Oil Market Report – February 2015
Stock Movements
EU plus Norway Preliminary data for December shows that total European stocks fell slightly by 0.4 mb, reversing the build of the previous month, to stand at 1,071.8 mb. This is 5.7 mb or 0.5% above the same time a year ago, but still 14.0 mb or 1.3% below the latest five-year average. Crude saw a build of 1.0 mb, while product stocks experienced a stock draw of 1.5 mb. Graph 9.2: EU-15 plus Norway’s total oil stocks mb
mb
1,180
1,180
1,160
1,160
1,140
1,140
Max/Min 2009-2013
1,120
1,120
1,100
1,100
1,080
1,080
1,060
1,060
1,040 Jan
Feb
Mar 2013
Apr
May
Jun 2014
Jul
Aug
Sep
Oct
Nov
1,040 Dec
Average 2009-2013
European crude inventories rose in December, reversing the fall of the previous month, to stand at 469.5 mb. Despite this build, crude inventories stood at 1.1 mb or 0.2% below the same period one year ago. However, they remained 13.4 mb or 2.9% above the latest five-year average. Lower European refinery runs, which fell by around 70,000 b/d from the previous month to stand at 10.2 mb/d, were behind the build in crude oil stocks. This corresponds to a refinery utilization rate of around 79.3%, about 0.5 pp lower than the previous month yet much higher than the rate of 75% recorded a year earlier. In contrast, OECD Europe’s product stocks fell by 1.5 mb in December, reversing the build of 9.2 mb in the previous month. At 602.4 mb, European stocks were 6.8 mb or 1.1% above a year earlier at the same time, though they remained 27.4 mb or 4.4% below the seasonal norm. All products experienced stock draws, with the exception of naphtha. Gasoline stocks fell slightly by 0.3 mb in December to end the month at 109.5 mb, a surplus of 0.5 mb or 0.6% above a year earlier, though still 3.1 mb or 2.7% below the seasonal norm. The build mainly reflected lower gasoline exports to Europe as higher gasoline output combined with lower demand to limit further stock draws. Distillate stocks also fell by 1.0 mb, ending December at 393.8 mb, a surplus of 6.7 mb or 1.7% compared with a year ago at the same time and 0.9 mb or 0.2% above the five-year average. This fall came mainly from lower demand for heating oil driven by mild weather. Lower gasoline exports from Russia also contributed to the stock draw in distillates. Residual fuel oil stocks also fell by 1.1 mb in December, reversing the build of the previous month. At 72.7 mb, residual fuel oil stocks were 3.0 mb or 3.9% below the same time a year ago and 21.0 mb or 22.4% less than the seasonal average. This stock draw was mainly driven by lower output. In contrast, naphtha stocks rose by
OPEC Monthly Oil Market Report – February 2015
81
Stock Movements 0.9 mb in December to stand at 26.4 mb, representing a surplus of 2.5 mb or 10.4% above a year ago at the same time yet 4.3 mb or 13.9% lower than the latest five-year average. Table 9.2: EU-15 plus Norway’s total oil stocks, mb Oct 14 474.9 107.0 26.4 390.9 70.3 594.7 1,069.5
Crude oil Gasoline Naphtha Middle distillates Fuel oils Total products Total
Nov 14 468.4 109.7 25.5 394.7 73.8 603.8 1,072.3
Change Dec 14/Nov 14 1.0 -0.3 0.9 -1.0 -1.1 -1.5 -0.4
Dec 14 469.5 109.5 26.4 393.8 72.7 602.4 1,071.8
Dec 13 470.6 108.9 23.9 387.0 75.7 595.6 1,066.2
Sources: Argus and Euroilstock.
US Preliminary data for January shows that total commercial oil stocks rose by 26.8 mb, reversing the fall of last month, to stand at 1,176 mb. With this build, they were nearly 102 mb or 9.5% above the latest five-year average and 129.0 mb or 12.3% higher than the same period a year ago. Within the components, commercial crude saw a build of 30.7 mb, while product stocks abated this build, declining by 3.9 mb. Graph 9.3: US weekly commercial crude oil stocks mb
mb
420
420
400
400
380
380
360
360
Max/Min 2010-2014
340
340
320
320
300
300 1
4
7
10 2014
13
16
19
22
25 2015
28
31
34
37
40
43
46
49
52
Average 2010-2014
US commercial crude stocks rose sharply in January to stand at 413.0 mb, finishing the month at 49.3 mb or 13.5% above the same time a year earlier and 59.9 mb or 16.9% above the latest five-year average. Strong US domestic production and economic incentive to store crude has pushed inventories to another all-time record high. Lower crude oil refinery input by nearly 800,000 b/d, averaging 15.6 mb/d, contributed further to the build. Refineries operated at around 87.4% of capacity in January, 5.1 pp lower than the previous month. Crude at Cushing, Oklahoma, rose for the last nine consecutive weeks on the back of a steep contango in the WTI forward curve combined with a rise in Canadian imports. At 41 mb, Cushing inventories have surpassed the level of the same time a year ago at 40.3 mb. In January, total product stocks fell by 3.9 mb to end the month at 762.7 mb. Despite this stock draw, US product stocks were around 80 mb or 11.7% above the levels seen
82
OPEC Monthly Oil Market Report – February 2015
Stock Movements at the same time a year ago and showed a surplus of 41.9 mb or 5.8% above the seasonal norm. As for products, gasoline and jet fuel oil rose, while distillates and residual fuel oil stocks fell. Gasoline stocks rose by 3.5 mb in January, ending the month at 240.7 mb, which was 5.0 mb or 2.1% higher than the same period a year ago and 6.5 mb or 2.8% above the latest five-year average. The build came mainly from lower gasoline demand, which dropped by around 400,000 b/d to average 8.8 mb/d. Lower gasoline output limited a further stock build. Jet fuel stocks also rose by 0.2 mb, ending January at 37.9 mb, which is 0.4 mb or 1.1% higher than the same month a year ago, yet 3.0 mb or 7.2% below the latest five-year average. Graph 9.4: US weekly distillate stocks mb
mb
180
180
170
170
160
160
Max/Min 2010-2014
150
150
140
140
130
130
120
120
110
110
100
100 1
4
7
10
13
16
19
22
2014
25
28
31
34
2015
37
40
43
46
49
52
Average 2010-2014
In contrast, distillate stocks fell by 2.5 mb in January, following builds in the last two months. At 134.5 mb, they were 19.9 mb or 17.4% less than the same period a year ago and still indicated a deficit of 9.2 mb or 6.4% below the five-year average. The drop in middle distillate stocks reflected lower output, which decreased by about 420,000 b/d to average 4.2 mb/d. Residual fuel oil stocks fell by 0.3 mb in January to end the month at 32.8 mb, which is 4.0 mb or 10.9% lower than last year at the same time and 4.3 mb or 11.7% below the seasonal norm. Table 9.3: US onland commercial petroleum stocks, mb
Crude oil Gasoline Distillate fuel Residual fuel oil Jet fuel Total SPR
Nov 14 387.5 219.1 126.1 36.3 35.8 1,150.9 691.0
Dec 14 382.4 237.2 136.9 33.1 37.8 1,149.0 691.0
Jan 15 413.1 240.7 134.5 32.8 37.9 1,175.8 691.0
Change Jan 15/Dec 14 30.7 3.5 -2.5 -0.3 0.2 26.8 0.0
Jan 14 363.8 235.7 114.5 36.8 37.5 1,046.7 696.0
Source: US Energy Information Administration.
OPEC Monthly Oil Market Report – February 2015
83
Stock Movements
Japan In Japan, total commercial oil stocks fell by 11.1 mb in December following a stock draw of 7.7 mb in November to stand at 160.8 mb. Despite this fall, Japanese commercial oil inventories are 7.2 mb or 4.7% higher than a year ago yet 3.8 mb or 2.3% below the five-year average. Within the components, crude and product stocks fell by 3.5 mb and 7.8 mb, respectively. Graph 9.5: Japan’s commercial oil stocks mb
mb
190
190
180
180 Max/Min 2009-2013
170
170
160
160
150
150
140 Jan
Feb
Mar 2013
Apr
May
Jun 2014
Jul
Aug
Sep
Oct
Nov
140 Dec
Average 2009-2013
Japanese commercial crude oil stocks fell in December for the second consecutive month to stand at 92.8 mb. Despite this drop, they were 4.8 mb or 5.5% above a year ago at the same time yet 2.5 mb or 2.6% below the seasonal norm. The stock draw was driven by higher refinery throughputs, which rose by more than 210,000 b/d to average 3.6 mb/d in December. Crude oil imports rose by nearly 500,000 b/d to average 3.6 mb/d, limiting further crude stock draws. Direct crude burning in power plants rose strongly by 83.1% in December compared with the previous month, averaging 177.8 tb/d but still showing a decline of 24% over the same period a year ago. Japan’s total product inventories also fell, dropping by 7.6 mb in December and reversing the build of the previous month to stand at 68.0 mb. At this level, product stocks were 2.4 mb or 3.6% above the same time a year ago but showed a deficit of 1.3 mb or 1.9% below the five-year average. The build was driven mainly by higher domestic sales, which increased by 560,000 b/d or 17% to average 3.8 mb/d, and by higher refinery output, which rose by 220,000 b/d or 7.4% to average around 3.2 mb/d in November. Lower product imports also contributed to the stock draw in product inventories. All products witnessed stock draws. Gasoline stocks fell by 1.1 mb in December to stand at 9.3 mb. At this level, they were 1.6 mb or 14.8% less than the same time the previous year and 2.5 mb or 21.2% below the five-year average. This stock draw was driven by higher gasoline sales, which increased by around 100,000 b/d to reach 1.0 mb/d, and by lower gasoline imports. Distillate stocks fell by 4.6 mb in December to stand at 32.0 mb, which was 0.2 mb or 0.5% below the same period a year ago, yet 0.3 mb or 1.1% higher than the seasonal average. Within distillate components, kerosene and jet fuel experienced drops, while gasoil saw a stock build. Kerosene inventories fell by nearly 15% on the back of higher domestic sales, which increased strongly by almost 80% from the previous month. Jet
84
OPEC Monthly Oil Market Report – February 2015
Stock Movements fuel stocks also fell by 4.7%, driven mainly by higher exports combined with healthy domestic consumption. Gasoil also rose, increasing by 8.3% on higher output. Total residual fuel oil stocks fell by 0.9 mb in December to stand at 15.2 mb, which was 0.7 mb or 4.9% above a year ago, yet 0.5 mb or 3.2% lower than the latest fiveyear average. Within fuel oil components, fuel oil A and fuel oil B.C fell by 11.3% and 2.9%, respectively. The build was mainly driven by higher domestic sales. Naphtha stocks fell by 1.0 mb to finish the month of December at 11.4 mb, indicating a surplus of 3.4 mb or 42.8% compared to a year ago at the same time and 1.4 mb or 13.4% higher than the seasonal norm. The stock draw came mainly from higher domestic sales combined with lower imports. Table 9.4: Japan’s commercial oil stocks*, mb
Crude oil Gasoline Naphtha Middle distillates Residual fuel oil Total products Total**
Oct 14 106.3 10.6 11.5 35.4 15.7 73.3 179.6
Nov 14 96.4 10.4 12.4 36.5 16.2 75.5 171.9
Dec 14 92.8 9.3 11.4 32.0 15.2 68.0 160.8
Change Dec 14/Nov 14 -3.5 -1.1 -1.0 -4.6 -0.9 -7.6 -11.1
Dec 13 88.0 10.9 8.0 32.1 14.5 65.6 153.6
* At end of month. ** Includes crude oil and main products only. Source: Ministry of Economy, Trade and Industry, Japan.
China The latest information for December showed that Chinese total oil commercial inventories fell for the fifth consecutive month by 5.1 mb to stand 378.2 mb. Despite this stock draw, Chinese inventories remained 18.3 mb above the previous year at the same time. Within components, product stocks fell by 10.1 mb, while crude stocks rose by 5.0 mb. At 250.1 mb, commercial crude stocks represented a surplus of around 20.8 mb compared with the same period one year earlier. The draw in commercial crude stocks came mainly from higher crude runs, which increased by 5.5% from November. Table 9.5: China’s commercial oil stocks, mb
Crude oil Gasoline Diesel Jet kerosene Total products Total
Oct 14 265.1 55.8 56.3 14.0 126.2
Nov 14 260.2 55.6 53.9 13.7 123.1
Dec 14 250.1 53.8 61.2 13.1 128.1
Change Dec 14/Nov 14 -10.1 -1.8 7.3 -0.6 5.0
Dec 13 229.3 56.7 60.2 13.7 130.7
391.3
383.4
378.2
-5.1
360.0
Source: OPEC Secretariat analysis.
In contrast, total product stocks in China rose by 5.0 mb to end December at 128.1 mb, which was 2.6 mb below a year ago at the same time. The build was attributed to higher refinery output. Within products, the picture was mixed, with diesel inventories surging higher by 7.3 mb to end December at 61.2 mb, while gasoline and kerosene stocks were lower by 1.8 mb and 0.6 mb to stand at 53.8 mb and 13.1 mb, respectively.
OPEC Monthly Oil Market Report – February 2015
85
Stock Movements
Singapore and Amsterdam-Rotterdam-Antwerp (ARA) At the end of December, product stocks in Singapore fell slightly by 0.1 mb following a drop of 2.5 mb last month to stand at 39.5 mb, which was a surplus of 1.5 mb or 3.9% over the same period the previous year. Within products, light and middle distillate stocks indicated a drop, while fuel oil inventories saw a build. Light and middle distillates fell by 0.4 mb and 1.2 mb, respectively in December. At 10.8 mb, light distillate stocks stood at 0.4 mb or 0.1% below the same time a year ago. Middle distillate stocks ended December at 9.1 mb, indicating a surplus of 1.1 mb or 14.4% above the previous year at the same time. In contrast, residual fuel oil stocks rose by 1.5 mb in December, reversing the drop of the last two months, to stand at 19.6 mb, which was 0.3 mb or 1.8% below the same period last year. The build was driven mainly by higher residual fuel oil imports to Singapore and lower bunker demand. Product stocks in Amsterdam-Rotterdam-Antwerp (ARA) rose by 5.0 mb in December to stand at 38.7 mb, the highest level in more than 3-1/2 years. This build was driven mainly by the contango structure of the forward market, which makes storage of fuel products profitable. Product stocks in ARA stood at 10.8 mb or 38.8% above a year ago at the same time. Within products, the picture was mixed with gasoline, gasoil and fuel oil stocks increasing, while jet fuel and naphtha witnessed declines. Gasoline stocks rose by 3.9 mb to stand at 7.6 mb, which is 0.8 mb or 11.4% higher than the same period last year. Gasoil also rose by 1.4 mb, ending December at 20.2 mb, which was 7.8 mb or 63% higher than the same period last year. The build in gasoil inventories could be attributed to lower demand in the region along with the price of gasoil in contango. Residual fuel oil stocks also rose by 0.4 mb, ending December at 4.8 mb, which was 0.4 mb or 8.1% higher than last year at the same time. In contrast, jet fuel oil and naphtha stocks fell by 0.5 mb and 0.2 mb, respectively. At 4.1 mb, jet fuel oil stocks were 0.7 mb or 20.4% above a year ago at the same time. Naphtha stocks stood at 2.1mb at the end of December, nearly three times the level experienced in December 2013.
86
OPEC Monthly Oil Market Report – February 2015
Balance of Supply and Demand
Balance of Supply and Demand Demand for OPEC crude in 2014 remained unchanged from the previous report to stand at 29.1 mb/d, which is 1.2 mb/d lower than the 2013 level. Demand for OPEC crude in 2015 was revised up by 0.4 mb/d to average 29.2 mb/d, 0.1 mb/d higher than a year earlier.
Estimate for 2014 Demand for OPEC crude for 2014 remained unchanged from the previous report to stand at 29.1 mb/d, which represents a decrease of around 1.2 mb/d compared to the previous year. The 1Q and the 2Q of 2014 are estimated to show a respective decline of 1 mb/d and 1.9 mb/d versus the same period a year earlier. The 3Q and 4Q are also estimated to show respective declines of 1.2 mb/d and 0.8 mb/d. Table 10.1: Summarized supply/demand balance for 2014, mb/d (a) World oil demand Non-OPEC supply OPEC NGLs and non-conventionals (b) Total supply excluding OPEC crude
2013 90.20
1Q14 90.15
2Q14 90.00
3Q14 91.75
4Q14 92.68
2014 91.15
54.24 5.65 59.89
55.62 5.73 61.35
55.93 5.79 61.72
56.24 5.86 62.10
57.13 5.93 63.07
56.23 5.83 62.06
Difference (a-b)
30.31
28.80
28.28
29.66
29.62
29.09
OPEC crude oil production Balance
30.20 -0.11
29.84 1.04
29.77 1.49
30.27 0.61
30.24 0.62
30.03 0.94
Totals may not add up due to independent rounding.
Forecast for 2015 Demand for OPEC crude in 2015 was revised up by 0.4 mb/d from the previous month’s assessment. This was driven mainly by a downward adjustment in non-OPEC supply. The 1Q and the 2Q of 2015 were revised up by 0.2 mb/d and 0.3 mb/d, respectively, from last month’s assessment. The 2H15 has much higher upward revisions with the 3Q and 4Q revised up by 0.6 mb/d and 0.7 mb/d, respectively. Demand for OPEC crude is projected at 29.2 mb/d for 2015, representing an increase of 0.1 mb/d over the previous year’s level. The 1Q and 2Q of 2015 are expected to decline by 0.9 mb/d and 0.2 mb/d, respectively, compared to the same period last year. In contrast, the 3Q and 4Q are projected to increase by 0.4 mb/d and 1.0 mb/d, respectively, over the same period a year earlier. Table 10.2: Summarized supply/demand balance for 2015, mb/d (a) World oil demand Non-OPEC supply OPEC NGLs and non-conventionals (b) Total supply excluding OPEC crude
2014 91.15 56.23 5.83 62.06
1Q15 91.36 57.55 5.89 63.44
2Q15 91.18 57.08 5.98 63.05
3Q15 92.96 56.79 6.08 62.87
4Q15 93.76 56.94 6.18 63.12
2015 92.32 57.09 6.03 63.12
Difference (a-b)
29.09
27.93
28.13
30.10
30.64
29.21
OPEC crude oil production Balance
30.03 0.94
Totals may not add up due to independent rounding.
OPEC Monthly Oil Market Report – February 2015
87
Balance of Supply and Demand Graph 10.1: Balance of supply and demand mb/d
mb/d
31
31
30
30
29
29
28
28
27
27
26
26 1Q14
2Q14
3Q14
4Q14
OPEC crude production
88
1Q15
2Q15
3Q15
4Q15
Required OPEC crude
OPEC Monthly Oil Market Report – February 2015
Table 10.3: World oil demand and supply balance, mb/d 2011
2012
2013
1Q14
2Q14
3Q14
4Q14
2014
1Q15
2Q15
44.9
45.8
46.5
45.7
45.8
44.9
23.8
24.4
24.7
24.2
24.1
23.9
13.5
13.7
13.4
13.4
12.9
13.4
7.7
7.7
8.4
8.1
8.8
7.6
29.3
29.7
30.4
29.7
29.8
30.1
4.4
4.2
4.6
4.9
4.5
4.4
3Q15
4Q15
2015
OECD
46.4
45.9
46.0
45.7
Americas
24.0
23.6
24.1
23.9
45.8
46.4
45.7
24.6
24.9
24.4
Europe
14.3
13.8
13.6
13.0
8.2
8.5
8.3
8.8
13.6
13.3
13.3
7.6
8.2
8.0
DCs
27.3
28.3
29.0
FSU
4.3
4.4
4.5
30.5
31.2
30.5
30.6
4.3
4.7
5.0
4.6
Other Europe
0.6
0.6
0.6
0.6
0.6
0.6
0.7
0.7
0.6
0.6
0.6
0.7
0.7
China
9.4
9.7
10.1
10.1
10.6
10.3
10.9
10.5
10.4
10.9
10.6
11.2
10.8
88.1
89.0
90.2
90.2
90.0
91.8
92.7
91.2
91.4
91.2
93.0
93.8
92.3
OECD
20.2
21.1
22.2
23.4
23.8
24.0
24.6
23.9
24.9
24.8
24.7
25.0
24.8
Americas
15.5
16.7
18.1
19.1
19.8
20.1
20.4
19.8
20.7
20.7
20.7
20.8
20.7
Europe
4.1
3.8
3.6
3.8
3.5
3.4
3.7
3.6
3.7
3.5
3.4
3.6
3.6
Asia Pacific
0.6
0.6
0.5
0.5
0.5
0.5
0.5
0.5
0.5
0.6
0.5
0.5
0.5
DCs
12.6
12.1
12.1
12.2
12.2
12.3
12.5
12.3
12.6
12.4
12.3
12.1
12.3
FSU
World demand
Asia Pacific
(a) Total world demand Non-OPEC supply
13.2
13.3
13.4
13.5
13.4
13.4
13.5
13.4
13.5
13.3
13.2
13.2
13.3
Other Europe
0.1
0.1
0.1
0.1
0.1
0.1
0.1
0.1
0.1
0.1
0.1
0.1
0.1
China
4.1
4.2
4.2
4.2
4.3
4.2
4.3
4.3
4.3
4.3
4.3
4.4
4.3
Processing gains
2.1
2.1
2.1
2.2
2.2
2.2
2.2
2.2
2.2
2.2
2.2
2.2
2.2
52.4
52.9
54.2
55.6
55.9
56.2
57.1
56.2
57.5
57.1
56.8
56.9
57.1
5.4
5.6
5.6
5.7
5.8
5.9
5.9
5.8
5.9
6.0
6.1
6.2
6.0
(b) Total non-OPEC supply and OPEC NGLs
57.8
58.4
59.9
61.4
61.7
62.1
63.1
62.1
63.4
63.1
62.9
63.1
63.1
OPEC crude oil production (secondary sources)
29.8
31.1
30.2
29.8
29.8
30.3
30.2
30.0
Total supply
87.6
89.6
90.1
91.2
91.5
92.4
93.3
92.1
Balance (stock change and miscellaneous)
-0.5
0.6
-0.1
1.0
1.5
0.6
0.6
0.9
Commercial
2,605
2,664
2,567
2,584
2,652
2,720
2,678
2,678
SPR
1,536
1,547
1,584
1,586
1,581
1,579
1,578
1,578
Total
4,142
4,211
4,151
4,170
4,233
4,299
4,257
4,257
825
879
909
954
914
952
917
917
Total non-OPEC supply OPEC NGLs + non-conventional oils
OECD closing stock levels (mb)
Oil-on-water
Days of forward consumption in OECD Commercial onland stocks
57
58
56
58
58
58
59
59
SPR
33
34
35
35
35
34
35
35
Total
90
92
91
93
92
92
93
93
Memo items FSU net exports (a) - (b)
8.9
8.8
8.9
9.1
9.1
8.8
8.6
8.9
9.0
9.1
8.6
8.2
8.7
30.3
30.5
30.3
28.8
28.3
29.7
29.6
29.1
27.9
28.1
30.1
30.6
29.2
Note: Totals may not add up due to independent rounding.
OPEC Monthly Oil Market Report – February 2015
89
Table 10.4: World oil demand/supply balance: changes from last month's table* , mb/d 2011
2012
2013
1Q14
2Q14
3Q14
4Q14
2014
1Q15
2Q15
3Q15
4Q15
2015
World demand OECD
-
-
-
-
-
-
-
-
-
-
-
-
-
Americas
-
-
-
-
-
-
-
-
-
-
-
-
-
Europe
-
-
-
-
-
-
-
-
-
-
-
-
-
Asia Pacific
-
-
-
-
-
-
-
-
-
-
-
-
-
DCs
-
-
-
-
-
-
-0.1
-
-
-
-
-0.1
-
FSU
-
-
-
-
-
-
-
-
-
-
-
-
-
Other Europe
-
-
-
-
-
-
-
-
-
-
-
-
-
China
-
-
-
-
-
-
-
-
-
-
-
-
-
(a) Total world demand
-
-
-
-
-
-
-
-
-
-
-
-
-
World demand growth
-
-
-
-
-
-
-
-
-
-
-
-
-
OECD
-
-
-
-
-
-
0.1
-
-
-0.1
-0.2
-0.3
-0.2
Americas
-
-
-
-
-
-
-
-
-
-0.1
-0.2
-0.3
-0.2
Europe
-
-
-
-
-
-
-
-
-
-
-
-
-
Non-OPEC supply
Asia Pacific
-
-
-
-
-
-
-
-
-
-
-
-
-
DCs
-
-
-
-
-
-
-
-
-0.1
-0.1
-0.2
-0.2
-0.1
FSU
-
-
-
-
-
-
-
-
-0.1
-0.1
-0.1
-0.2
-0.1
Other Europe
-
-
-
-
-
-
-
-
-
-
-
-
-
China
-
-
-
-
-
-
-
-
-
-
-
-
-
Processing gains
-
-
-
-
-
-
-
-
-
-
-
-
-
Total non-OPEC supply
-
-
-
-
-
-
0.1
-
-0.1
-0.3
-0.5
-0.7
-0.4
Total non-OPEC supply growth
-
-
-
-
-
-
0.1
-
-0.1
-0.3
-0.5
-0.7
-0.4
OPEC NGLs + non-conventionals
-
-
-
-
-
-
-
-
-
-
-
-
-
(b) Total non-OPEC supply and OPEC NGLs
-
-
-
-
-
-
0.1
-
-0.1
-0.3
-0.5
-0.7
-0.4
OPEC crude oil production (secondary sources)
-
-
-
-
-
-
-
-
Total supply
-
-
-
-
-
-
0.1
-
Balance (stock change and miscellaneous)
-
-
-
-
-
-
0.1
-
Commercial
-
1
-
-
-
1
-
-
SPR
-
-
-
-
-
-
-
-
Total
-
1
-
-
-
1
-
-
-
-
-
-
-
-
-
-
OECD closing stock levels (mb)
Oil-on-water
Days of forward consumption in OECD Commercial onland stocks
-
-
-
-
-
-
-
-
SPR
-
-
-
-
-
-
-
-
Total
-
-
-
-
-
-
-
-
FSU net exports
-
-
-
-
-
-
-
-
-0.1
-0.1
-0.1
-0.2
-0.1
(a) - (b)
-
-
-
-
-
-
-0.1
-
0.2
0.3
0.6
0.7
0.4
Memo items
* This compares Table 10.3 in this issue of the MOMR with Table 10.3 in the January 2015 issue. This table shows only where changes have occurred.
90
OPEC Monthly Oil Market Report – February 2015
Table 10.5: OECD oil stocks and oil on water at the end of period 2011
2012
2013
2014
1Q13
2Q13
3Q13
4Q13
1Q14
2Q14
3Q14
4Q14
2,605
2,664
2,567
2,689
2,665
2,660
2,696
2,567
2,584
2,652
2,720
2,689
1,308
1,365
1,316
1,396
1,349
1,378
1,404
1,316
1,311
1,382
1,411
1,396
Europe
905
902
869
883
904
873
879
869
875
878
888
883
Asia Pacific
392
396
381
411
412
409
413
381
399
392
421
411
1,536
1,547
1,584
1,578
1,581
1,577
1,582
1,584
1,586
1,581
1,579
1,578
Americas
697
696
697
692
697
697
697
697
697
692
692
692
Europe
426
436
470
471
472
471
472
470
470
471
471
471
Closing stock levels, mb OECD onland commercial Americas
OECD SPR
Asia Pacific
414
415
417
416
413
409
413
417
418
419
417
416
4,142
4,211
4,151
4,268
4,246
4,237
4,277
4,151
4,170
4,233
4,299
4,268
825
879
909
917
942
871
932
909
954
914
952
917
57
58
57
58
59
58
58
56
58
58
58
59
Americas
53
55
55
57
57
57
58
55
55
57
57
58
Europe
68
67
66
66
65
63
65
67
65
64
66
68
Asia Pacific
47
48
46
48
53
51
48
43
52
51
50
47
33
34
33
34
35
34
34
35
35
35
34
35
Americas
30
30
30
29
29
29
29
29
29
28
28
29
Europe
29
30
31
32
34
34
35
36
35
34
35
36
Asia Pacific
50
50
49
50
53
51
48
47
55
54
50
47
90
91
90
92
93
92
92
91
93
92
92
93
OECD total Oil-on-water
Days of forward consumption in OECD OECD onland commercial
OECD SPR
OECD total
OPEC Monthly Oil Market Report – February 2015
91
Table 10.6: Non-OPEC supply and OPEC natural gas liquids, mb/d
US Canada Mexico OECD Americas* Norway UK Denmark Other OECD Europe OECD Europe Australia Other Asia Pacific OECD Asia Pacific Total OECD Brunei India Indonesia Malaysia Thailand Vietnam Asia others Other Asia Argentina Brazil Colombia Trinidad & Tobago L. America others Latin America Bahrain Oman Syria Yemen Middle East Chad Congo Egypt Equatorial Guinea Gabon South Africa Sudans Africa other Africa Total DCs FSU Russia Kazakhstan Azerbaijan FSU others Other Europe China
2011 2012 2013 9.0 10.0 11.2 3.5 3.8 4.0 2.9 2.9 2.9 15.5 16.7 18.1 2.0 1.9 1.8 1.1 1.0 0.9 0.2 0.2 0.2 0.7 0.7 0.7 4.1 3.8 3.6 0.5 0.5 0.4 0.1 0.1 0.1 0.6 0.6 0.5 20.2 21.1 22.2 0.2 0.2 0.1 0.9 0.9 0.9 1.0 1.0 0.9 0.7 0.7 0.7 0.3 0.4 0.4 0.4 0.4 0.4 0.2 0.2 0.2 3.6 3.7 3.6 0.7 0.7 0.7 2.6 2.6 2.6 0.9 1.0 1.0 0.1 0.1 0.1 0.3 0.3 0.3 4.7 4.7 4.8 0.2 0.2 0.2 0.9 0.9 0.9 0.4 0.2 0.1 0.2 0.2 0.1 1.7 1.5 1.4 0.1 0.1 0.1 0.3 0.3 0.3 0.7 0.7 0.7 0.3 0.3 0.3 0.3 0.2 0.2 0.2 0.2 0.2 0.4 0.1 0.2 0.3 0.3 0.3 2.6 2.3 2.4 12.6 12.1 12.1 13.2 13.3 13.4 10.3 10.4 10.5 1.6 1.6 1.6 1.0 0.9 0.9 0.4 0.4 0.4 0.1 0.1 0.1 4.1 4.2 4.2
3Q14 4Q14 2014 13.1 13.4 12.8 4.2 4.3 4.2 2.8 2.7 2.8 20.1 20.4 19.8 1.9 1.9 1.9 0.7 0.9 0.9 0.2 0.2 0.2 0.7 0.7 0.7 3.4 3.7 3.6 0.4 0.4 0.4 0.1 0.1 0.1 0.5 0.5 0.5 24.0 24.6 23.9 0.1 0.1 0.1 0.9 0.9 0.9 0.9 0.9 0.9 0.7 0.7 0.7 0.4 0.4 0.4 0.4 0.4 0.4 0.2 0.2 0.2 3.5 3.5 3.5 0.7 0.7 0.7 3.0 3.1 2.9 1.0 1.0 1.0 0.1 0.1 0.1 0.3 0.3 0.3 5.1 5.2 5.0 0.2 0.2 0.2 1.0 0.9 0.9 0.0 0.0 0.0 0.1 0.1 0.1 1.4 1.3 1.3 0.1 0.1 0.1 0.3 0.3 0.3 0.7 0.7 0.7 0.3 0.3 0.3 0.2 0.2 0.2 0.1 0.1 0.1 0.3 0.3 0.3 0.3 0.3 0.3 2.4 2.4 2.4 12.3 12.5 12.3 13.4 13.5 13.4 10.5 10.6 10.6 1.6 1.7 1.6 0.9 0.8 0.8 0.4 0.4 0.4 0.1 0.1 0.1 4.2 4.3 4.3
Change Change 14/13 1Q15 2Q15 3Q15 4Q15 2015 15/14 1.6 13.6 13.7 13.7 13.6 13.6 0.8 0.2 4.4 4.3 4.3 4.5 4.4 0.1 -0.1 2.7 2.7 2.7 2.7 2.7 -0.1 1.7 20.7 20.7 20.7 20.8 20.7 0.9 0.0 2.0 1.9 1.8 2.0 1.9 0.0 0.0 0.9 0.8 0.8 0.9 0.8 0.0 0.0 0.2 0.2 0.2 0.2 0.2 0.0 0.0 0.7 0.7 0.7 0.7 0.7 0.0 0.0 3.7 3.5 3.4 3.6 3.6 0.0 0.0 0.4 0.5 0.4 0.4 0.4 0.0 0.0 0.1 0.1 0.1 0.1 0.1 0.0 0.0 0.5 0.6 0.5 0.5 0.5 0.0 1.7 24.9 24.8 24.7 25.0 24.8 0.9 0.0 0.1 0.1 0.1 0.1 0.1 0.0 0.0 0.9 0.9 0.9 0.9 0.9 0.0 0.0 0.9 0.9 0.9 0.9 0.9 0.0 0.0 0.7 0.7 0.7 0.7 0.7 0.0 0.0 0.4 0.4 0.4 0.4 0.4 0.0 0.0 0.4 0.4 0.4 0.3 0.4 0.0 0.0 0.2 0.3 0.3 0.3 0.3 0.0 -0.1 3.6 3.6 3.5 3.5 3.5 0.0 0.0 0.7 0.7 0.7 0.7 0.7 0.0 0.3 3.1 3.0 3.1 3.0 3.1 0.1 0.0 1.0 0.9 0.9 0.8 0.9 -0.1 0.0 0.1 0.1 0.1 0.1 0.1 0.0 0.0 0.4 0.3 0.3 0.3 0.3 0.0 0.3 5.2 5.1 5.1 5.0 5.1 0.1 0.0 0.2 0.2 0.2 0.2 0.2 0.0 0.0 0.9 0.9 0.9 0.9 0.9 0.0 0.0 0.0 0.0 0.0 0.0 0.0 0.0 0.0 0.1 0.1 0.1 0.1 0.1 -0.1 0.0 1.3 1.3 1.3 1.3 1.3 -0.1 0.0 0.1 0.1 0.1 0.1 0.1 0.0 0.0 0.3 0.3 0.3 0.3 0.3 0.0 0.0 0.7 0.7 0.7 0.7 0.7 0.0 0.0 0.3 0.3 0.3 0.3 0.3 0.0 0.0 0.2 0.2 0.2 0.2 0.2 0.0 0.0 0.2 0.1 0.1 0.1 0.1 0.0 0.1 0.3 0.3 0.3 0.3 0.3 0.0 0.0 0.3 0.3 0.3 0.3 0.3 0.0 0.0 2.5 2.4 2.4 2.4 2.4 0.0 0.2 12.6 12.4 12.3 12.1 12.3 0.0 0.0 13.5 13.3 13.2 13.2 13.3 -0.1 0.1 10.6 10.5 10.5 10.4 10.5 -0.1 0.0 1.6 1.6 1.6 1.6 1.6 0.0 0.0 0.8 0.8 0.8 0.8 0.8 0.0 0.0 0.4 0.4 0.4 0.4 0.4 0.0 0.0 0.1 0.1 0.1 0.1 0.1 0.0 0.0 4.3 4.3 4.3 4.4 4.3 0.1
Non-OPEC production
50.3
50.7
52.1
54.1
55.0
54.1
2.0
55.4
54.9
54.6
54.8
54.9
0.8
Processing gains Non-OPEC supply OPEC NGL OPEC non-conventional OPEC (NGL+NCF) Non-OPEC & OPEC (NGL+NCF)
2.1 52.4 5.2 0.1 5.4
2.1 52.9 5.4 0.2 5.6
2.1 54.2 5.4 0.2 5.6
2.2 56.2 5.6 0.3 5.9
2.2 57.1 5.7 0.3 5.9
2.2 56.2 5.6 0.3 5.8
0.0 2.0 0.2 0.0 0.2
2.2 57.5 5.6 0.3 5.9
2.2 57.1 5.7 0.3 6.0
2.2 56.8 5.8 0.3 6.1
2.2 56.9 5.9 0.3 6.2
2.2 57.1 5.8 0.3 6.0
0.0 0.9 0.2 0.0 0.2
57.8
58.4
59.9
62.1
63.1
62.1
2.2
63.4
63.1
62.9
63.1
63.1
1.1
* Chile has been included in OECD Americas. Note: Totals may not add up due to independent rounding.
92
OPEC Monthly Oil Market Report – February 2015
Table 10.7: World Rig Count
US Canada Mexico Americas
2010 2011 2012 2013 1,541 1,881 1,919 1,761 347 423 366 354 97
94
106
Change 13/12 1Q14 2Q14 3Q14 4Q14 Dec 14 Jan 15 -158 1,780 1,852 1,904 1,912 1,881 1,682 -12 526 202 385 406 374 368
106
93
87
85
78
72
69
-3
-170 2,400 2,140 2,374 2,396
2,327
2,119
-208
Norway
18
17
17
20
2
17
18
15
16
14
13
-1
UK
19
16
18
17
-1
15
17
15
17
20
15
-5
Europe
94
118
119
135
16
135
146
148
148
146
128
-18
Asia Pacific
21
17
24
27
3
28
27
25
25
24
20
-4
-151 2,563 2,314 2,547 2,569
2,497
2,267
-230
Total OECD
1,985 2,398 2,391 2,221
0
Change Jan/Dec -199 -6
2,100 2,532 2,534 2,383
Other Asia
248
239
217
219
2
230
221
231
229
231
212
-19
Latin America
205
195
180
166
-14
164
176
174
174
177
161
-16
Middle East
156
104
110
76
-33
84
85
82
79
77
83
6
19
2
7
16
9
27
30
24
29
31
27
-4
628
540
513
477
-36
504
512
511
511
516
483
-33
-187 3,067 2,826 3,058 3,080
3,013
2,750
-263 -2
Africa Total DCs Non-OPEC rig count Algeria Angola
2,727 3,072 3,047 2,860 25
31
36
47
11
49
46
48
48
49
47
9
10
9
11
2
16
16
14
14
14
14
0
Ecuador
11
12
20
26
6
25
25
26
21
18
15
-3
Iran**
52
54
54
54
0
54
54
54
54
54
54
0
Iraq**
36
36
58
83
25
89
93
75
59
61
60
-1
Kuwait**
20
57
57
58
1
60
60
68
69
71
74
3
Libya**
16
8
12
15
3
15
10
8
8
7
6
-1
Nigeria
15
36
36
37
1
35
31
32
36
37
38
1
9
8
8
9
1
11
11
11
10
9
9
0
Saudi Arabia
67
100
112
114
3
125
132
137
143
146
150
4
UAE
13
21
24
28
4
30
33
37
38
38
37
-1
Venezuela
70
122
117
121
3
121
114
122
106
102
106
4
342
494
542
602
60
629
624
631
605
606
610
4
-127 3,696 3,450 3,689 3,685
3,619
3,360
-259
-43 2,819 2,687 2,851 2,820
Qatar
OPEC rig count Worldwide rig count* of which: Oil Gas Others
3,069 3,566 3,589 3,462 1,701 2,257 2,654 2,611 1,325 1,262 43
49
2,748
2,522
-226
886
746
-140
780
671
744
776
782
754
-28
52
109
57
99
95
96
91
90
86
-4
Note: Totals may not add up due to independent rounding. na: Not available. Sources: Baker Hughes Incorporated & Secretariat's estimates.
OPEC Monthly Oil Market Report – February 2015
* Excludes China and FSU. ** Estimated figure when Baker Hughes Incorporated did not reported the data.
93
Contributors to the OPEC Monthly Oil Market Report Editor-in-Chief Omar S. Abdul-Hamid, Director, Research Division email:
[email protected]
Editor Hojatollah Ghanimi Fard, Head, Petroleum Studies Department email:
[email protected]
Analysts Crude Oil Price Movements
Eissa Alzerma email:
[email protected]
Commodity Markets
Hector Hurtado email:
[email protected]
World Economy
Afshin Javan email:
[email protected] Imad Alam Al-Deen email:
[email protected] Joerg Spitzy email:
[email protected]
World Oil Demand
Hassan Balfakeih email:
[email protected]
World Oil Supply
Mohammad Ali Danesh email:
[email protected]
Product Markets and Refinery Operations
Elio Rodriguez email:
[email protected]
Tanker Market and Oil Trade
Anisah Almadhayyan email:
[email protected]
Stock Movements
Aziz Yahyai email:
[email protected]
Technical and editorial team
Aziz Yahyai email:
[email protected] Douglas Linton email:
[email protected]
Data services Adedapo Odulaja, Head, Data Services Department (
[email protected]), Hossein Hassani, Statistical Systems Coordinator (
[email protected]), Pantelis Christodoulides (World Oil Demand and Stock Movements), Klaus Stoeger (World Oil Supply), Harvir Kalirai (World Economy), Mouhamad Moudassir (Product Markets and Refinery Operations), Mohammad Sattar (Crude Oil Price Movements), Anna Gredinger (Tanker Market and Oil Trade)
Editing, production, design and circulation Alvino-Mario Fantini, Maureen MacNeill, Scott Laury, Viveca Hameder, Hataichanok Leimlehner, Evelyn Oduro-Kwateng, Andrea Birnbach
94
OPEC Monthly Oil Market Report – February 2015
Disclaimer
The data, analysis and any other information contained in the Monthly Oil Market Report (the “MOMR”) is for informational purposes only and is not intended as a substitute for advice from your business, finance, investment consultant or other professional. The views expressed in the MOMR are those of the OPEC Secretariat and do not necessarily reflect the views of its Governing Bodies and/or individual OPEC Member Countries. Whilst reasonable efforts have been made to ensure the accuracy of the MOMR’s content, the OPEC Secretariat makes no warranties or representations as to its accuracy, currency reference or comprehensiveness, and assumes no liability or responsibility for any inaccuracy, error or omission, or for any loss or damage arising in connection with or attributable to any action or decision taken as a result of using or relying on the information in the MOMR. The MOMR may contain references to material(s) from third parties whose copyright must be acknowledged by obtaining necessary authorization from the copyright owner(s). The OPEC Secretariat shall not be liable or responsible for any unauthorized use of third party material(s). All rights of the Publication shall be reserved to the OPEC Secretariat, including every exclusive economic right, in full or per excerpts, with special reference but without limitation, to the right to publish it by press and/or by any communications medium whatsoever, including Internet; translate, include in a data base, make changes, transform and process for any kind of use, including radio, television or cinema adaptations, as well as sound-video recording, audio-visual screenplays and electronic processing of any kind and nature whatsoever. Full reproduction, copying or transmission of the MOMR is not permitted in any form or by any means by third parties without the OPEC Secretariat’s written permission, however the information contained therein may be used and/or reproduced for educational and other noncommercial purposes without the OPEC Secretariat’s prior written permission, provided that OPEC is fully acknowledged as the copyright holder.
OPEC Monthly Oil Market Report – February 2015
95
OPEC Basket average price
US$/b
down 15.08 in January
January 2015
44.38
December 2014
59.46
January OPEC crude production down 0.05 in January
mb/d, according to secondary sources
January 2015
30.15
December 2014
30.21
Economic growth rate
per cent
World
OECD
US
Japan
Euro-zone
China
India
2014
3.2
1.8
2.4
0.2
0.9
7.4
5.5
2015
3.4
2.2
2.9
1.2
1.2
7.0
6.0
Supply and demand 2014
mb/d
14/13
2015
15/14
World demand
91.2
1.0
World demand
92.3
1.2
Non-OPEC supply
56.2
2.0
Non-OPEC supply
57.1
0.9
5.8
0.2
OPEC NGLs
6.0
0.2
29.1
–1.2
29.2
0.1
OPEC NGLs Difference
Difference
OECD commercial stocks
mb
Oct 14
Nov 14 Dec 14
Dec 14/Nov 14
Dec 13
Crude oil
1,336
1,317
1,310
–7.6
1,232
Products
1,370
1,380
1,360
–10.9
1,335
Total
2,705
2,679
2,678
–18.5
2,567
58.8
58.5
58.6
0.1
56.1
Days of forward cover
Next report to be issued on 16 March 2015.