Emerging Market Monthly Roadmap FIM RESEARCH
06 April 2011
Turn off the ‘autopilot’ Summary The market shrugs off uncertainty even though risks are rising (inflation, oil prices and MENA political risks, and now the impact of Japan’s disaster). Although we remain bullish on EMs, we believe that it is time to turn off the autopilot: discriminate further among EMs and increasingly look at countries’ individual stories, beyond the EM common bullish story. Along these lines, we buy KRW and KZT vs USD, TRY vs EUR, and enter a 2/5Y TRY CCS flattener.
Key macro calls
Main strategic calls
EM growth outperformance still on track
Sell USD/CNY 6M NDF
Japan’s impact on Asia: Manageable
Sell EUR/TRY
CE4: Convergence trades back soon
Sell USD/KZT 12M NDF
Watch China’s nascent option market
EM rates to climb further
MENA: far from being fixed
Play 2/5Y TRY CCS flattener
Trade ideas page 13
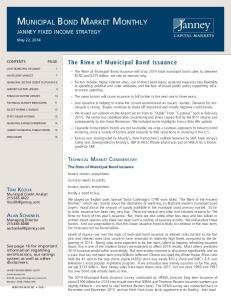
Policy rates: Still higher in emerging markets (Crédit Agricole CIB forecasts) 160
Expected change in spreads between EM policy rates and the average of ECB refi rate and US Fed fund rate (from now to end-2011 - Crédit Agricole CIB forecasts)
140 120 100 80
EM rates increasing more than DM rates
60 40 20 0 -20 -40
EM rates increasing less than DM rates
-60 TRY RUB B RL CZK P LN IDR KRWM YR P HP THB TWD SGD CNY INR ZA R HKD M XN HUF RON
Source: Bloomberg, Crédit Agricole CIB
Sébastien Barbé, Head of EM Research and Strategy Frances Cheung, Senior Strategist – Asia ex-Japan John Sfakianakis, Chief Economist Banque Saudi Fransi Dariusz Kowalczyk, Senior Economist/Strategist – Asia ex-Japan Guillaume Tresca, EM Strategist Maxim Oreshkin, Senior Strategist – Russia/CIS Vladimir Vale, Chief Strategist Credit Agricole Brasil SA DTVM
catalystresearch.ca-cib.com Crédit Agricole Corporate and Investment Bank is authorised by the Comité des Etablissements de Crédit et des Entreprises d’Investissement (CECEI) and supervised by the Commission Bancaire in France and subject to limited regulation by the Financial Services Authority. Details about the extent of our regulation by the Financial Services Authority are available from us on request.
Emerging Market Monthly Roadmap
Contents Emerging markets at a glance: Shrugging off uncertainty ..................................... 3
STRATEGY Interest rate outlook: Closing the gap and going higher ........................................ 5 Interest rates: What is priced in vs our forecasts................................................... 8 FX outlook: Bull run still has legs........................................................................... 9 FX: What’s priced in vs our forecasts .................................................................. 12 Trade ideas.......................................................................................................... 13
HOT TOPICS Hot topic 1: Japan and Asia – the linkages ......................................................... 15 Hot topic 2: CNY FX options start trading onshore.............................................. 17 Hot topic 3: Central Europe: a long way to Maastricht ........................................ 19 Hot topic 4: Safe play on KZT gradual appreciation ............................................ 21 Hot Topic 5: Where is MENA going? ................................................................... 23
FORECASTS Economic forecasts ............................................................................................. 25 Exchange rate forecasts ...................................................................................... 26 Policy rate forecasts ............................................................................................ 27 Interest rate forecasts .......................................................................................... 28 Commodities forecasts ........................................................................................ 30
06 April 2011
2
Emerging Market Monthly Roadmap
Emerging markets at a glance: Shrugging off uncertainty
[email protected] Uncertainty has not receded, far from it. But the market judges that the balance of risks remains supportive for the EM underlying story. It should remain so in the short term at least. At this stage the economic momentum, the inflation/rates story, as well as equity valuations, seem to be offsetting risks stemming from Japan, MENA and oil prices.
A more dangerous world… MENA uncertainty pushing up oil prices
Global risks have increased further since one month ago. First, violence in an oilproducing country (Libya) has escalated and this combined with recent events has kept oil prices at a two and a half year record high level. It is far from obvious whether the world economy could weather this for a long period of time with such high oil prices. Asian economies, in particular, that have high oil consumption-toGDP ratios, due to their focus on manufacturing industries, seem particularly vulnerable.
Japan still an open-ended story
Second, the disaster in Japan could potentially hit EMs through many channels. Besides the fact it is still an open-ended story, it will hit those countries which export to Japan, as well impacting those that have production chains integrated with Japan’s. Here again, Asia may feel the strongest impact.
…but who cares? Markets: well oriented
However, the markets seem to have shrugged off these rising headwinds. Equity flows are back for EMs. The MSCI EM has reached its highest level since Q208. Most EM currencies have appreciated versus the USD over the past month, led by the RON, HUF and TRY, partly thanks to the EUR’s upside. However, far from the EUR, most Asian currencies were also up versus USD. There are five main reasons why the market remains bullish, in our view.
EM momentum: strong
First, economic momentum remains strong. EM PMIs remain at fairly high levels on average (see chart). EM average PMI: record high level 60
55
50
45
40 PM I manuf. in 11 large EM s (including BRICs) 35 06
07
08
09
10
11
Source: Bloomberg, Crédit Agricole CIB
MENA and Japan’s impact: not too bad? Japan: not all bad?
Second, the market may be relying on the fact that the impact from Japan is negative in the short term, but could turn positive later on as reconstruction efforts support Japanese demand in H2 – benefiting commodity exporters in particular.
MENA: not so scary?
Third, the situation in the MENA region remains highly uncertain, but the markets may have been somewhat reassured by: (1) the huge financial package unveiled in Saudi Arabia; and (2) the involvement of the international community in the region.
06 April 2011
3
Emerging Market Monthly Roadmap
Inflation: not so strong? Inflation: ‘what doesn’t kill you, makes you stronger’
Fourth, the threat of inflation remains strong, but the impact is more ambiguous than it seems. It is a ‘what doesn’t kill you, makes you stronger’ story. As long as the global economy can withstand higher oil prices, their inflation impact potentially means higher rates and carry, which in turn supports flow to EMs. In addition, after having climbed for about three quarters, our sequential measure of EM inflation seems to have stabilised. Even if there remains some risk on the upside, we believe, at least, that such a stabilisation may provide the market with some comfort, suggesting that inflation is not out of control at this stage. EM sequential inflation: pausing… for breath? 14% Stabilising?
12% 10% 8% 6% 4% 2% 0% Sequential inflation (CPI QoQ SAAR) BRICs -4% EM 27 05 06 07 08 -2%
09
10
11
Source: Bloomberg, Crédit Agricole CIB
Equity flows: still supportive? Flows to EM: more to come
Finally, EM equity markets are not that expensive. Our in-house metrics indicate no obvious undervaluation or overvaluation for eleven EMs on average – see chart below (for the presentation of these metrics, see “Are EM equity markets overvalued?” in the February 2011 issue of the EM Monthly Roadmap). EM equity markets: far from being obviously overvalued 2.5
Overvaluation
60000
2.0 50000
1.5 1.0
40000
0.5 0.0
30000
-0.5 20000
-1.0 No obvious sign on under/overvaluation on average Our EM 11 equity under/overvaluation index MSCI EM index (RHS) 07 08 09 10 11
Undervaluation
-1.5 -2.0 -2.5 06
10000 0
Source: Bloomberg, Crédit Agricole CIB – The index includes Brazil, China, Hong Kong, India, Indonesia, Mexico, Poland, Russia, South Africa, Korea and Turkey.
Balance of risk: still supportive in the short term
06 April 2011
In a nutshell, risks have been rising, but the underlying story remains strong enough to push more capital flows to EMs, at least in the coming weeks. Later on, depending on the pace of tightening in Europe and the US, and on the future level of oil prices, the market may reconsider the balance of risks. Between now and then, EM asset prices and currencies may have gone up further.
4
Emerging Market Monthly Roadmap
Interest rate outlook: Closing the gap and going higher
[email protected] [email protected] After recent events, EM swap rates may move up again towards their February levels, and keep going higher on rising inflation and sustained economic growth momentum. Asian curves are likely to remain steep near-term, with flush liquidity suppressing front-end rates. In the EMEA space, flattening will likely resume soon after an expected pause. Given the inflation threat and the significant pitfalls ahead, a flattener may be the asymmetric trade for EMEA rates.
Asia: corrected and rebounds Pay positions suffered but bonds benefited
Asian rates were largely soft after the earthquake struck Japan, which hit sentiment and led to sell-offs in equities. Meanwhile, bonds rallied on safe-haven flows, resulting in heavy drops in bond yields. Bonds outperformed IRS in a number of markets including the KRW, THB, IDR and PHP rate markets. Our long 5Y KTB/pay IRS position benefited against this backdrop, reaching target on 25 March with a gain of 30bp. Unfortunately, at the same time, we have had to take a stop-loss from our pay 1Y CNY IRS position, at -20bp. Meanwhile, we decided to take profit from our receive 1Y2Y HKD/USD spread trade at a 22bp gain, as HKD/USD rate spreads appear to be range bound for the moment.
Asian rates again to head higher
Markets have since stabilised, as reflected by the rebounds in Asian equities and FX. Rates have largely been paid up from their mid-March lows and we expect the uptrend to continue, bringing rates back to their February levels at least. Admittedly, there are still uncertainties surrounding MENA geopolitics and the aftermath of the Japan earthquake. However, we would expect investors to shift focus back to fundamentals, especially the inflation story, after the previous bouts of market jitters.
Asian inflation remains in focus Korean March CPI accelerated further to a 29-month high of 4.7% YoY. Interestingly, food price inflation eased somewhat, with headline CPI driven by higher price increases in housing, energy/fuel and transport. This plainly shows that inflation is not a phenomenon confined to food. Thai March core CPI quickened to a 27-month high of 1.6% YoY, also suggesting inflation pressure has spread to general items. TWD: front-end bond/swap spreads to widen 0
6.0
bp
-10 -20
China: tight USD liquidity %
5.0
2Y TWD bond/sw ap 3M +/- 1sd
4.0
-30 -40
3.0
-50 -60
2.0
-70 -80
1.0
Implied onshore 1Y USD rate
-90 -100 1/1/2010 4/1/2010
7/1/2010 10/1/2010 1/1/2011 4/1/2011
Source: Bloomberg, Crédit Agricole CIB
0.0 Jul-09 Oct-09 Jan-10 Apr-10 Jul-10 Oct-10 Jan-11 Apr-11 Source: Bloomberg, Crédit Agricole CIB
The Taiwan central bank hiked its key policy rates on 31 March by 12.5bp as widely expected, citing imported inflation. However, the increases in NCD rates by 7-9bp were slightly more than the expected 6-7bp. This, at the margin, suggests the possibility of a pick-up in policy hike, though the MPC statement did not sound particularly hawkish. We do expect the central bank to go for a 25bp hike in Q2, as it is pretty much behind the curve compared with regional peers.
06 April 2011
5
Emerging Market Monthly Roadmap
This will push up front-end TWD IRS. Meanwhile, the correction in short-tenor TGBs, due to stricter restrictions on foreign investment in to the TGB market, appears to have come to an end. As such, we expect TWD bond/swap spreads to widen again at the front end.
2Y TWD bond/swap could widen
USD liquidity Onshore USD liquidity in China is getting tighter, with the onshore FX implied 1Y USD rate going beyond LIBOR plus 400bp. However, in a number of other Asian markets we do not observe obvious downward movement in basis swaps. KRW basis were actually paid up during the past month. We see the tightness in USD as a local phenomenon in China, where the demand for USD loans are elevated by anticipated CNY appreciation and supply is further tightened by the latest regulation on foreign loan quotas. USD issuances by Asia ex-Japan names remain active, which would likely provide a buffer to avoid extreme USD tightness. And, in Thailand in particular, we are expecting some USD to return in the months ahead from the liquidation of overseas investments (mostly Kimchi fund), to potentially pay up the THB basis. This could also have an impact on the KRW basis but, given the KRW basis has already gone up a lot, the situation should be manageable.
Basis swaps to remain stable, with USD issues providing liquidity
Basis swaps to remain stable
USD issues to provide liquidity 26
bp
USD bn
0
22 1Y KRW basis 1Y TWD basis 1Y HKD basis
-50
Asia ex-Japan USD bond issuances, public offer
18 14
-100
10
-150
6 -200
2 -250 Jan-10
Apr-10
Jul-10
Source: Bloomberg
Oct-10
Jan-11
Apr-11
-2 Mar-08
Sep-08 Mar-09
Sep-09
Mar-10
Sep-10
Mar-11
Source: Crédit Agricole CIB
EMEA: close the rate gap EMEA rates may keep rebounding, reaching their February levels…
…on a higher Eurozone rate and with growth recovery on track
The batch of unusual events in the past month has unexpectedly pushed rates lower across EMEA countries; Turkey being the exception. Nevertheless, the rate outlook remains broadly unchanged. Swap rates have only recouped a part of their drop and, providing no black swan materialises, rates have to close the gap and print higher levels. Indeed, the potential threats identified last month are still more than acute. Inflation is not showing signs of abating and the rise of EMEA rates is all the more expected since the European rates have reached pre-Japan crisis levels. EMEA spreads to the Eurozone rate are tightening. Even if the Japanese issue slightly affects global growth, the EMEA growth picture has hardly changed over the month or even accelerated. In other words, the month of March has to be forgotten and we are back to the situation as of the end of February when rates were on an upward trend. Admittedly, the position to take is a little bit less obvious than a month ago, with the risks emerging here and there. It is, therefore, necessary to turn off ‘autopilot’ but the direction remains the same.
06 April 2011
6
Emerging Market Monthly Roadmap
EMEA rates still too low 10
bp
0 -10 -20 -30 spread to 2011 high -40 -50 Hungary
South Africa
Czech Rep
Turkey
Poland
Eurozone
Source: Bloomberg, Crédit Agricole CIB
EMEA Flattening to resume Inflation may flatten the curve
The expected pause in the flattening came (as discussed in the March 2011 issue of the EM Monthly Roadmap) and it may now resume with the inflation threat being in the spotlight. Headline figures for EMEA indeed depicted a pause in February, but core figures are rising. In fact, the recent PMI figures confirm that inflationary pressures are gaining momentum. Output prices as well as input prices are reaching all-time high levels. In the meantime, CE4 central banks will likely react to the inflation acceleration within the Eurozone.
More rate hikes to be priced in
Rate hikes priced in by the markets have declined somewhat in the wake of recent events, which is quite dubious in our view. The backlash in terms of rate levels and hikes priced in could be quite significant. Inflation pressures rising (PMI output price component) 95 85 75 65 55 45 35 Jan-05
Czech
Jan-06
Poland
Jan-07
Turkey
Jan-08
Jan-09
Jan-10
Jan-11
Source: Bloomberg, Crédit Agricole CIB
EMEA flattener to benefit inflation and fears Flattener is the asymmetric trade, benefiting from further inflation or any tail risks
06 April 2011
Given the uncertain backdrop and the rising inflation threat, we would recommend flattener trades. Indeed flattener trades may benefit either from rising risk aversion, should any black swan appear, or from stronger growth recovery. They are asymmetric trades where carry is now less painful than previously. Therefore, we keep open our 2-5Y ZAR flattener and open a 2-5Y TRY CCS flattener, where inflation will come back most strongly in our view.
7
Emerging Market Monthly Roadmap
Interest rates: What is priced in vs our forecasts 3M view
1M view
Spot
Our forecasts
Korea (7D repo)
3.00%
0
China (1Y lending)
6.31%
Taiwan (rediscount)
6M view
Gap
Our forecasts
Market
Gap
Our forecasts
Market
Gap
12
-12
50
22
28
50
41
9
0
16
-16
25
26
-1
25
24
1
1.75%
nm
nm
nm
25
27
-2
25
25
0
Thailand (repo)
2.50%
0
25
-25
25
57
-32
25
74
-49
India (repo)
6.75%
nm
nm
nm
0
11
-11
25
-20
45
Brazil (selic)
11.75%
50
34
16
75
75
0
75
80
-5
Mexico (overnight)
4.50%
0
3
-3
0
3
-3
0
25
-25
Czech Rep. (14D repo)
0.75%
0
5
-5
25
21
4
50
53
-3
Hungary (2W repo)
6.00%
0
0
0
0
1
-1
0
1
-1
Poland (7D repo)
4.00%
25
28
-3
25
54
-29
25
88
-63
Russia (O/N deposit)
3.00%
75
22
53
75
121
-46
100
164
-64
Turkey (1W repo)
6.25%
0
37
-37
0
82
-82
125
161
-36
South Africa (repo)
5.50%
0
4
-4
0
9
-9
0
44
-44
Market
Asia
Latin America
EMEA
Legend: The main divergence between our view and the market that we want to highlight: Where we are more hawkish than the market Where we are more dovish than the market nm: No monetary policy meeting during that period
Source: Bloomberg, Reuters, Crédit Agricole CIB The above table illustrates how many basis points rate markets are pricing in over the next 1M, 3M and 6M (cumulative) for the movements of benchmark money market rates, while our calls are on policy rates. Interpretation of the above should take into account the possibly varying spreads between money market rates. In particular, INR and RUB rates reflect to a large part expectations regarding the liquidity situation. However, in the current form it gives a relevant proxy for the next rate move from the EM central banks.
06 April 2011
8
Emerging Market Monthly Roadmap
FX outlook: Bull run still has legs
[email protected] [email protected] Led by the EMEA region the vast majority of EM currencies appreciated in March, overcoming headwinds from tensions in MENA countries and the shock of the Japanese earthquake, tsunami and radiation. Our outlook remains constructive, given solid growth momentum in emerging economies and our expectation that policy rate differentials will largely widen. The TRY looks the most underpriced and we anticipate acceleration of CNY appreciation.
Ready to weather uncertainty Ready to live with uncertainty
We remain fairly constructive on the EM FX outlook for the coming weeks. Challenges have kept on accumulating since last month, but the market seems to be ready to live with increased uncertainty and is still ready to buy the strong underlying EM story.
EM growth momentum remains solid
Economic momentum remains strong according to data released last month. The decline in EM PMI has been limited in recent months and EM PMIs remain comfortably above the 50-threshold on average. Quite logically, inflation is also part of the picture and this fuels EM’s carry attractiveness. Interestingly, EM market rates are up on average compared with one month ago, despite the MENA and Japanese crises. This, in our view, illustrates that the underlying market mood remains fairly bullish and that the inflation story is still on.
Rates up despite emerging dangers: Asia… 3.0%
1.2%
March 10 (Earthquake/ tsunami in Japan)
2.9% 2.8%
… and EMEA/Latin America
1.1%
6.4%
9.6%
March 10 (Earthquake/ tsunami in Japan)
6.2%
1.0%
9.4% 9.2%
2.7%
0.9%
6.0%
2.6%
0.8%
5.8%
8.8%
2.5%
0.7%
2.4%
0.6%
5.6%
8.6%
2.3%
0.5%
2.2%
2Y swap rates
2.1% 2.0% 28/09
0.4%
Asia* (LHS) US (RHS) 28/10
28/11
0.3% 28/12
28/01
28/02
0.2% 28/03
9.0%
8.4%
5.4%
8.2%
2Y swap rates 5.2% 5.0% 28/09
EMEA* (LHS) Brazil and Mexico (average - RHS) 28/10
28/11
28/12
28/01
28/02
8.0% 7.8% 28/03
* Arithmetic average of Hong Kong, India, Korea, Singapore, Taiwan and Thailand
* Arithmetic average of Czech Republic, Poland, Hungary, Russia, South Africa and Turkey
Source: Bloomberg, Crédit Agricole CIB
Source: Bloomberg, Crédit Agricole CIB
Carry support to persist even after ECB hikes Policy rate differential between EM and G3 central bank to widen
06 April 2011
One could argue that more hawkishness in the Eurozone and the US may make the carry less attractive in many EMs. We acknowledge that higher policy rates, with Europe and Fed members speaking in favour of an early end to QE2, mark an alteration to the cheap money era. However, on the other hand, the ECB and Fed are unlikely to crunch their balance sheets quickly, given the challenges that remain strong in both economies. In addition, our US economists do not expect the Fed fund to increase in the coming months. On average, we expect the spread between EM average policy rates and the average of ECB and Fed policy rates to continue to widen in coming months as EM central banks continue to tighten gradually.
9
Emerging Market Monthly Roadmap
TRY: catching-up ahead TRY to appreciate…
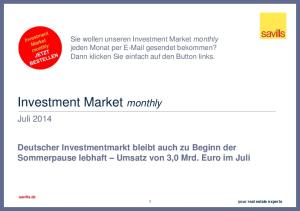
When looking at the gap between our forecasts and the FWD market, TRY stands out. We are more bullish than the market. In our view, lowering the rate was a risky bet and the bet will soon come to an end. The Q4 GDP growth surprised on the upside, reaching a China-like 9.2% YoY. Looking inside GDP growth, private domestic demand shined: private consumption increased strongly and investment surged. Increasingly, the strength of domestic demand challenges the inflation outlook, but it also looks like a factor of the widening of the trade and current account deficits. Policy rates: still higher in emerging markets 160 140 120
Expected change in spreads between EM policy rates and the average of ECB refi rate and US Fed fund rate (from now to end-2011 - Crédit Agricole CIB forecasts)
100 80
EM rates increasing more than DM rates
60 40 20 0 -20 -40
EM rates increasing less than DM rates
-60 TRY RUB B RL CZK P LN IDR KRWM YR P HP THB TWD SGD CNY INR ZA R HKD M XN HUF RON
Source: Bloomberg, Crédit Agricole CIB
… as the central bank is likely to hike rates aggressively later this year
As the expected ECB rate hike and the programmed end of QE2 will mark the beginning of the end of the cheap money era, we believe the central bank focus will move from capping capital inflows to limiting the current account deficit by capping domestic demand. Unconventional policy (hikes in the reserve requirement ratio) will likely not be enough: rate hikes are on the radar screen, we believe. This is all the more the case as policy rates currently stand 1,000bp below their pre-crisis level. We expect a total 175bp hike in the repo rate in H2. This, plus the prospect of the post-election rating upgrade, should contribute to push up TRY. We believe there is some upside for TRY versus EUR in particular.
MXN and ZAR: still some upside MXN to benefit from the rotation from BRL
We also remain bullish on the MXN. Even if Mexico’s story is not the most appealing in America, we expect the MXN to benefit from the US recovery, from a reasonably strong outlook, as well from a rotation from those currencies that have already performed strongly so far (including the BRL). We believe USD/MXN will finish the year at 11.50. There also remains some upside on ZAR in the short term, based on high metal prices (gold in particular), accelerating momentum that will trigger a firming up in rate expectations and a relatively narrow current account deficit.
CNY: gains to accelerate CNY appreciation likely to accelerate as trade balance will return to surplus…
06 April 2011
Another currency where we think the FWD market is underestimating potential appreciation, and where the argument for faster gains is particularly compelling, is the CNY. March was the best month for the Chinese unit so far this year, with a relatively small gain of 0.4%. Total Q1 appreciation of 0.9% was disappointingly slow and its weakest in three quarters. The lacklustre performance reflects dramatic narrowing of trade surplus, which plunged from CNY27bn in October to CNY6bn in January, and eventually swung into deficit in February (where it is likely to remain in March). Such a trend allowed China to counter foreign
10
Emerging Market Monthly Roadmap
arguments that its currency is undervalued. However, the deficit will not last for long and we anticipate a return to surpluses by May at the latest. …and as a rise in commodity prices will trigger the need for more policy tools to curb inflation
Another key reason why gains have been muted is that anti-inflation policy measures focused on hiking interest rates and the withdrawal of liquidity via raising the required reserve ratio. These steps succeeded in stabilising CPI inflation around 5% YoY, reducing the need to use the currency tool more fully. Now that domestic price pressures are being exacerbated by rising global commodity prices, more decisive CNY appreciation is likely to become an additional measure to curb inflation. NDF market underestimates CNY appreciation potential CNY appreciation implied in the NDF market 6.85
ccn+12m vs USD/CNY - RHS USD/CNY 12M NDF USD/CNY spo
6.75
4.50% 3.75%
6.65
3.00%
6.55
2.25%
6.45
1.50%
6.35
0.75%
6.25 Jun-10
0.00% Aug-10
Oct-10
Dec-10
Feb-11
Source: Bloomberg, Crédit Agricole CIB
NDF market should begin to imply faster CNY appreciation, helped by regulatory changes
We expect the CNY to appreciate by nearly 4.0% by year end, more than twice as much as the 1.5% implied in the NDF market. We believe that NDF prices are distorted by a number of arbitrage activities in Chinese markets. In particular, Mainland banks buy onshore USD/CNY forwards for domestic corporations. These clients take out USD loans to finance their CNY needs due to favourable market conditions. Namely, USD lending is subject to fewer central bank restrictions and rates are lower than in the case of CNY rates. Moreover, proceeds can be swapped into CNY and bought back in the forward market at a profit due to the prevalence of negative forward points. Such buying back activity tends to compress USD/CNY forward points, and arbitrage vis-à-vis the NDF market leads to upward pressure on USD/CNY NDF rates. Following a substantial reduction by the PBoC of the limit for forward positions of Mainland banks at the end of March, such activity will be curbed. This has already pushed forward points deeper into negative territory, reducing upward pressure on USD/CNY in the NDF market. Banks are also likely to curb arbitrage activity between the onshore forward market, where they sell USD/CNY, and the NDF market, where the buy it. As a result, NDFs should begin to imply faster appreciation. Combined with the likely acceleration of gains of the spot rate, this makes shorting USD/CNY in the NDF market a fairly safe bet.
KRW and SGD have further to go KRW and SGD to continue to shine
06 April 2011
The KRW has led gains in Asia in March, pushing our outstanding trade idea to go short USD/KRW (12M NDF) into a 2.7% profit. We remain bullish on the Korean unit as it remains undervalued vis-à-vis the region, being one of the few Asian currencies that have not fully recovered from the global crisis (it is trading 12% below pre-crisis levels). Moreover, the BoK is likely to continue tightening monetary policy, improving the KRW’s rate differentials. Another currency with more upside is the SGD, given the outlook for policy tightening by the MAS this month. We expect re-centring of the band, combined with either its narrowing or making the slope less steep. This could lead to a gain of about 2%, potentially catapulting the SGD to the position of regional leader.
11
Emerging Market Monthly Roadmap
FX: What’s priced in vs our forecasts 6M view
3M view
Spot
Our 3M forecasts* NDF/FWD
Gap
Our 6M forecasts* NDF/FWD
Gap
3M rates
Asia USD/CNY
6.54
6.43
6.50
1.0%
6.36
6.46
1.6%
3.8%
USD/HKD
7.77
7.77
7.77
0.0%
7.77
7.76
-0.1%
0.3%
USD/INR
44.2
45.1
44.9
-0.4%
45.3
45.6
0.6%
9.3%
USD/IDR
8653
9250
8701
-5.9%
9200
8788
-4.5%
7.1%
USD/MYR
3.02
3.11
3.03
-2.4%
3.10
3.05
-1.9%
3.1%
USD/PHP
43.2
42.7
43.1
1.1%
42.1
43.2
2.7%
2.0%
USD/SGD
1.26
1.24
1.26
1.6%
1.23
1.26
2.4%
0.2%
USD/KRW
1087
1095
1092
-0.3%
1075
1097
2.1%
3.4%
USD/TWD
29.0
29.8
28.7
-3.6%
29.6
28.4
-4.1%
0.5%
USD/THB
30.2
29.6
30.2
2.1%
29.4
30.3
3.1%
2.2%
USD/VND
20913
20900
21629
3.5%
21400
22229
3.9%
13.5%
USD/ARS
4.05
4.10
4.12
0.4%
4.15
4.22
1.7%
10.9%
USD/BRL
1.61
1.65
1.64
-0.7%
1.65
1.67
1.5%
12.0%
USD/MXN
11.81
11.80
11.91
0.9%
11.70
12.02
2.7%
4.4%
USD/RUB
28.2
29.5
28.4
-3.5%
31.7
28.7
-9.6%
3.9%
USD/TRY
1.52
1.50
1.55
3.2%
1.47
1.57
7.0%
7.9%
USD/ZAR
6.69
6.70
6.78
1.1%
6.70
6.87
2.6%
5.6%
EUR/CZK
24.4
24.1
24.4
1.0%
24.0
24.4
1.5%
0.8%
EUR/HUF
264
272
266
-2.1%
270
269
-0.5%
6.1%
EUR/PLN
4.00
3.90
4.02
3.1%
3.85
4.05
5.1%
4.1%
4.10 4.25 4.14 -2.6% EUR/RON * Obtained by extrapolation from our quarterly forecast grid (included at the end of this report)
4.25
4.18
-1.7%
5.4%
Latin America
EMEA
Legend The main divergence between our view and the market that we want to highlight: Where we are more bullish than the market Where we are more bearish than the market Source: Crédit Agricole CIB
06 April 2011
12
Emerging Market Monthly Roadmap
Trade ideas Rates: We took profit on our long 5Y KRW bond/swap spread and receive 1Y2Y HKD/USD IRS spread trades. We stopped losses from our 2Y/5Y CNY IRS steepener, pay 1Y CNY IRS and 5Y PLN IRS positions and open a 2/5Y TRY CCS flattener. FX: We remain long CNY, PHP and KRW versus USD in Asia, and initiate a long TRY position versus EUR, and a long KZT position versus USD.
Interest rate Recommendation 2Y/5Y ZAR IRS flattener
[email protected]
Sell Brazilian future DI/13-Jan contracts
[email protected] [email protected]
2Y/5Y TRY CCS flattener
[email protected]
Entry date
Entry level
Target
Stop loss
Now
Performance
15/12/10
133bp
95bp
152bp
122bp
11bp
Rationale: The curve has flattened since mid-March. The expected tightening, alongside inflation acceleration should continue to favour the 5Y vs 2Y part. Nevertheless, the curve slope is still hovering at a seven-year high and has further room to flatten. 26/01/11
12.77%
12.20%
13.05%
12.70%
7bp
Rationale: The front-end of rate curve remains volatile but rates have at last started to decrease somewhat. Uncertainties about the BCB credibility in fighting inflation are decreasing, while the announced spending cut should have the expected negative impact on inflation. The stance of fiscal policy has more and more impacts on the behaviour of future inflation, and on the yield curve. 06/04/11
51bp
0bp
77bp
51bp
-
Rationale: TRY curve has already flattened significantly but we are still far from pre-crisis levels, when inflation and rates were significantly higher. We still stick to the view that inflation can only come back sharply given the narrow output gap, higher commodity prices. Still, a slight inflexion in the recent CBT’s stance should suggest that they may radically change their position this summer with the first repo rate hike.
FX Recommendation Sell USD/CNY (6M NDF)
[email protected] [email protected]
Sell USD/PHP (6M NDF)
[email protected] [email protected]
Sell USD/KRW (12M NDF)
[email protected] [email protected] [email protected]
06 April 2011
Entry date
Entry level
Target
Stop loss
Now
Performance
30/11/10
6.6123
6.3610
6.7387
6.5194
1.5%
Rationale: CNY appreciation will be increasingly used as a tool to fight inflation, especially as the relentless rise in commodity prices is adding to domestic price pressures. The NDF market should begin to reflect such outlook to a larger degree as recent regulatory measures, curbing forward positions of Chinese banks, are indirectly limiting their purchases of USD/CNY in the NDF market. The new regulation should also limit their buying in the DF market, which would lower arbitragerelated upward pressure on NDF prices. 19/01/11
44.58
41.91
45.92
43.139
3.3%
Rationale: We see more upside due to the fact that the recent sharp acceleration of inflation has already led to the start of the tightening cycle, and is likely to bring about more hikes in Q2 and Q3. Moreover, the PHP remains relatively undervalued among emerging Asian currencies, not having fully recovered from the financial crisis. 16/2/11
1140.34
1070.00
1175.51
1104.20
3.3%
Rationale: This idea is performing quite strongly and is 2.7% in the money. We keep it open as KRW should strengthen further on the back of continued monetary tightening. Moreover, KRW still stands out among Asian currencies in that it is trading well below pre-crisis levels (about 12%) while most others are above it and there is no fundamental reason for such underperformance.
13
Emerging Market Monthly Roadmap
Recommendation Sell EUR/TRY
[email protected]
Sell USD/KZT 12M NDF
[email protected]
Entry date
Entry level
Target
Stop loss
Now
Performance
1/4/11
2.1876
2.0500
2.2564
2.1794
0.5%
Rationale: In our view, keeping rates much lower than before the crisis will become unsustainable as inflation re-accelerates in the coming months in Turkey. Rate hikes are also necessary to curb the current account deficit. A strong growth story and the prospects for rating upgrades should also support the TRY. By contrast, EUR may be penalised by the remaining sovereign uncertainty, once the market sells the fact after having bought the rumour of ECB hiking. 1/6/11
144.9
140.0
147.3
144.7
-
Rationale: KZT depreciated strongly versus RUB in real terms. Balance of payment to benefit from high oil, metal and wheat prices. NBK to use appreciation as an inflation-fighting tool.
* For NDFs: target, stop-loss and current level (now) calculated on the basis of the remaining maturity.
06 April 2011
14
Emerging Market Monthly Roadmap
Hot topic 1: Japan and Asia – the linkages
[email protected] Asia is likely to be hardly affected by portfolio liquidation, if at all, by Japanese investors, as Japan has not been investing heavily in Asia. Japan is more interested in direct investment in Asia, but these are longer term commitments which are unlikely to be reversed to meet short term needs. Asian exports could even potentially benefit from energy and reconstruction-related demand from Japan, but Asia’s own production process could be partly impeded by potentially less supply of inputs from Japan.
Demand from Japan Asia’s dependence on Japanese demand has been declining
We do not attempt to give a number for the potential economic losses or gains felt by Asia following the Japanese earthquake as things are still evolving with uncertainties remaining and, at best, it would be a guesstimate. But we think it would be useful to discuss the various channels through which Japan has an impact on Asia and highlight some topics for discussion. The first thing that comes to mind, in terms of the links between Japan and Asia, is merchandise trade. Over the years Japan’s share in demand for Asian products has been declining, from 11% in 2003 to 7% in 2010. However, the analysis is not straight forward, when, for example, a lower dependence can mean either better insulation from weaker Japanese demand or less benefit from potential demand for reconstruction-related products.
Still, Indonesia and Malaysia could potentially benefit through exports
Indonesia is the country most exposed to Japanese demand, shipping 16% of its goods there, while Malaysia sent 10% of its exports to Japan. Indonesia and Malaysia are key providers of energy and fuels which could be of potential benefit to them given Japan’s needs following the reduction of its energy producing capacity. In this regard, we estimate that about one-tenth of Japan’s power supply will be disrupted for the next six to nine months. That said it all depends on how quickly energy generating capacity in Japan resumes and if there can be extra supply from existing spare capacity or reduced household use in support of industrial use, among other factors. The Philippines also depends somewhat on Japanese demand, with 15% of its exports heading to Japan, with a mixture of food, oil, semi-con products which appear to be facing an overall negative impact should Japanese demand for consumer products weaken. For other parts of Asia, less than 10% of their goods are shipped to Japan, we believe they are able to sail through any headwinds by leveraging on other major markets.
Dependence on Japanese demand varies 18% 16%
exports to Japan, share to total, 2010
14%
Japan’s outward portfolio investment, 2005-2010 Central and South America 17%
ROW 4%
Asia 3%
12% US 37%
10% Oceania, 7%
8% 6% 4% 2% 0% IDR PHP VND THB MYR CNY TWD KRW SGD HKD INR Source: CEIC, Crédit Agricole CIB
06 April 2011
Europe, 32% Source: Japan MoF, Crédit Agricole CIB
15
Emerging Market Monthly Roadmap
The production chain There are talks about who is likely to benefit from an export competitor perspective, with Korea and Taiwan the likely candidates. Examining the export product mix of these places, we note that while all three export lots of machinery and electrical/electronic products, the items differ. Almost half of Taiwan’s exports are machinery and electrical equipment, of which electronic products (and in turn PCs) are the major items. The distribution of Japan’s exports is more balanced, with production of what are considered as ‘inputs’ for other manufacturers, such as electrical machinery and power generating machines being important. Moreover, transport equipment is not a major category for Taiwanese exports while it constitutes about one-fourth of Japan’s exports. While Korea also produces different items under the machinery and electronic products umbrella than Japan, their similar reliance on transport equipment renders the competition between Korea and Japan as more intense than between Taiwan and Japan. Asian production relies to various extents on Japanese input
Leaving the analysis of exporter competition aside, we would like to highlight how much Asia’s own production process depends on input from Japan, which could be a more pressing issue. In 2010, Korea sourced about 20% of its imported machinery and 13% of its imported chemicals from Japan, while the corresponding figures for Taiwan’s sourcing from Japan were 26% and 29%, respectively. We visited some major electronic manufacturers in Taipei recently and got a similar sense of dependence on Japan as a supplier. However, manufacturers do not appear too worried at the moment, as they see any disruption in the supply chain as a universal phenomenon for the industry. That said, it does affect total output from a macro point of view and we tend to be cautious towards the development on this front.
Japanese outward investment Japanese portfolio investors are not too keen on Asia
In the past six years, only about 2.8% of Japan’s outward portfolio investment flowed to Asia. The Japanese invested much more heavily in advanced markets such as the US and Europe. This makes Asian assets less vulnerable to any liquidation of investment by Japanese investors under repatriation needs. Taking in to account the size of the local markets within Asia, Indonesia and Malaysia could be affected to a relatively larger extent but the impact will still likely be mild.
The Japanese are more interested in direct investment in Asia
Japanese investors’ presence in Asia is much stronger in terms of direct investment which represents a more long-lasting business relationship. Over the past six years, 27% of Japan’s outward FDI went to Asia, 24% to the US and 22% to the EU. Total FDI from Japan between 2005 and 2010 in Asia amounted to JPY12.3trn, without taking into account valuation changes. By the nature of FDI, we do not expect any sudden reversal of flows triggered by the need for short-term liquidity. All in all, we see the supply chain link between Japan and Asia as the area that requires closer monitoring in the coming months, while Asia is likely to be able to manage the negative impact through weaker Japanese demand for Asian products or assets. Imports from Japan, selected items, % share to total imports of that item
2004 2005 2006 2007 2008 2009 2010
Korea Machineries Chemicals 30 10 26 11 24 11 22 11 21 11 19 13 20 13
Taiwan Machineries Chemicals 31 34 30 35 28 36 26 33 27 31 26 32 26 29
Sources: CEIC, Crédit Agricole CIB
06 April 2011
16
Emerging Market Monthly Roadmap
Hot topic 2: CNY FX options start trading onshore
[email protected] April saw the birth of a new derivative market in China: FX options. Initial trades had unique characteristics: vols exceeded offshore levels and were low, while volatility smile was skewed toward puts. The first feature is likely to be arbitraged away, but the two latter should persist. However, the market is unlikely to develop until two-way risk appears in the CNY spot rate.
FX options join growing array of CNY derivatives First FX product in four years
April brought another important addition to the growing array of financial instruments traded in China’s financial markers – onshore FX options. This is the first new FX derivative allowed on the China Foreign Exchange Trading System (CFETS) in four years, following the introduction of FX forwards in 2005, swaps in 2006 and cross currency swaps in 2007. Reportedly, the two first options dealt on 1 April were USD/CNY 3M and 6M at the money options (ATMs) with implied volatilities of 2.65 and 3.30 respectively – low but above offshore levels. This note discusses the unique features of Chinese market regulation, its growth prospects, which are poor in the medium term, and the likely shape of USD/CNY volatility smile.
Strict regulatory regime Only European style options allowed
The market is governed by State Administration of Foreign Exchange (SAFE) regulation of 16 February, stipulating interbank trading and client business rules. (1) The CFETS platform must be used for interbank trading, with both banks and FX brokerages allowed to participate. (2) Only European style options for CNY against foreign currencies are permitted. (3) Given the rule of physical settlement in client business, the underlying can only be CNY rates versus currencies against which it trades in the spot market: USD, EUR, JPY, GBP, HKD, MYR and RUB. (4) Option settlement should use CNY as premium currency.
Clients can only buy options; selling is not permitted
Client business is subject to additional rules. (1) They can only buy options, a requirement that does not exist in other countries. This rule will slow market development as Asian corporates typically sell options. Clients are only allowed to sell existing long positions, on the condition the underlying commercial contract has changed and only in the corresponding amount. (2) Option transactions must be related to a commercial contract, with strict rules for verification by banks. This rule is designed to limit speculative activity but will slow market development. (3) The exercise should be done through physical settlement; cash settlement is allowed only for puts bought with existing foreign currency current account deposits.
Unique pricing: vols low but above offshore levels First deals see volatilities well below levels in EM Asia…
The start of trading revealed three unique features of the Chinese market. First, implied volatilities are very low vis-à-vis the rest of Asia, as is the case in offshore CNY and CNH option markets. This reflects the controlled nature of the spot CNY market, with low historical volatility and established trend of gradual decline which most players expect to continue in the medium-term. We see low volatilities persisting as long as China maintains its policy of gradual CNY appreciation.
…but higher than in the offshore market
Second, implied volatility in initial trades was higher than offshore. Elsewhere in Asia the opposite tends to be the case as volatility of non-deliverable forward (NDF) FX rates, which is the underlying for most offshore options, exceeds the deliverable forward (DF) market, which is the underlying for onshore options. This reflects the fact that there are few natural buyers onshore as clients tend to sell to receive premium but rarely buy as they find it difficult to accept the idea of paying for protection. However, natural buyers exist offshore, eg, hedge funds buy deep out of the money (OTM) calls to protect their investments from local currency depreciation in case of a crisis. Moreover, DF liquidity is higher. Finally, regulation may curb onshore volatility but cannot impact offshore markets. On the other hand, regulatory ban prevents corporate selling in China, removing this key source of downward pressure on implied volatilities. Moreover, they may be boosted by the relatively high actual volatility of CNY intraday spot rate.
Onshore volatility premium likely to be arbitraged away
However, we think that after starting to trade at a premium, onshore volatility will decline vis-à-vis the offshore market due to arbitrage. Such activity typically fails to fully bridge the onshore / offshore gap as elsewhere in Asia arbitrage involves
06 April 2011
17
Emerging Market Monthly Roadmap
buying onshore and selling offshore, and offshore banks are reluctant to be long onshore options due to risk of regulatory changes in times of crisis. This issue will not exist in China as onshore volatility is higher, making banks sellers onshore and buyers offshore. As a result, the premium should be arbitraged away, or at least significantly compressed.
Unique pricing: volatility smile skewed toward puts USD puts are more expensive than calls
The third special feature of USD/CNY options is that the volatility smile favours USD puts. This phenomenon can also be found in CNH and offshore CNY markets. By contrast, elsewhere in Asia volatility smiles are skewed towards USD calls (only TWD and THB markets have symmetrical volatility smiles). The unique pricing of USD/CNY options reflects overwhelming consensus that CNY will continue to appreciate, which reduces demand for calls and creates natural demand for puts.
USDCNY ATM vols onshore exceed offshore levels
Volatility smile is skewed towards puts
8 4
USDCNY Onshore (3M) USDCNY Offshore (3M) USDCNH Onshore (3M)
6
3 4 2
USDCNY Onshore USDCNY Offshore USDCNH Onshore
2
1
0 1M
3M
6M
1Y
Source: Bloomberg, Crédit Agricole CIB
2Y
3Y
5Y
5P
20P
35P
ATM
35C
20C
5C
Source: Bloomberg, Crédit Agricole CIB
Outlook for volatility smile Smile to become more clearly skewed in favour of puts
Puts are likely to stay more expensive than calls as long as CNY keeps appreciating gradually in the spot market. However, we believe that the shape of the smile may gradually change on the call side to resemble the CNH smile more closely. On the first day of trading, slightly-OTM calls were priced to be the cheapest, to resemble offshore volatilities. However, this feature of the offshore market reflects corporates selling in order to earn premium due to their conviction that USD/CNY spot is highly unlikely to see a significant rebound. Ban on client onshore selling should make slightly-OTM calls more expensive versus ATMs. On the other hand, deep OTM calls should become cheaper. They are more expensive offshore due to demand from hedge funds for protection against the unlikely event of a crisis in China and a spike in USD/CNY spot. A lack of foreign hedge fund presence onshore will prevent deep OTM call prices from being high.
Market potential: low under current FX policy Clients unlikely to buy either calls on puts as long as spot CNY is on a gradual appreciation path
06 April 2011
We expect the onshore market to see only very slow growth as interest from natural users will need a long time to grow. Private corporates have developed a habit of only selling options and their mentality will need to change so that they accept the need to pay for hedging and buy them; this will not happen overnight. SOEs (state-owned enterprises) have not used options out of fear of being accused of speculating in offshore markets and in theory may move into the onshore market to support policy efforts to develop it. In particular, SOE exporters have the incentive to hedge against the highly likely scenario of a continued decline of USD/CNY spot. However, in practice, it is cheaper to do so in the DF market as long as one has a strong view that the spot trend will be maintained – otherwise buying a put would imply wasting the premium. Therefore, the onshore options market will probably not take off until a significant two-way risk appears in the spot rate, which is highly unlikely either this or next year.
18
Emerging Market Monthly Roadmap
Hot topic 3: Central Europe: a long way to Maastricht
[email protected] Recent comments from Central European politicians prove that the desire to join the Eurozone is lacking at the moment. We developed a convergence index, which assesses the level of convergence achievement. The road to the Eurozone will be long and bumpy. The Polish and Czech 5Y5Y rates have the best potential to convergence towards the 5Y5Y EUR rate.
Convergence: not yet for sure While joining the Eurozone was apparently on the agenda in a foreseeable future for Central Europe countries – Czech Republic, Hungary, Poland and to a lesser extent Romania, prior to the 2008-09 turmoil, the outlook has radically changed since then. Recent comments coming from local authorities over the past few weeks do not suggest a rapid integration and a willingness to join. For instance, the Hungarian Prime Minister Viktor Orban stated that the Hungarian adoption is unimaginable before 2020. Still, the Czech Republic has no intention in nominating a date before July 2014 according to their Prime Minister Petr Necas. Romania is still trying to recover and has just extended a two year SBA with the IMF. Therefore, Poland is very likely the only clear potential candidate, though it is too early for the Polish authorities to talk about any dates.
Recent politicians’ comments point to a late EUR adoption
Politics are not in rush to join Poland
Hungary
Czech Rep.
Romania
Local view
no rush but still wants to join
> 2020
>2014
2015, wants to join
Our view
2015 at best, likely the first to join
not in view
2016 at best
2015 is too optimist
Source: Crédit Agricole CIB
This u-turn from Central Europe countries, which were eager to join two years ago, might be seen as a natural protectionist reaction. It may also reflect increased reluctance to give up FX flexibility, which can prove a useful tool during periods of turbulence.
A long way to Maastricht, the convergence index While several criteria were met before the crisis, the road to Maastricht today is long, for sure. To assess the progress in meeting the criteria we have calculated an aggregate convergence score, which ranges between 0 and 1. A value closer to zero indicates a greater degree of convergence. Budget pushed very high the index (Poland)
The Convergence index 0.60
0.80 Aggregate score
0.55
Hungary Poland
Czech Rep 0.70
FX Budget
0.60 0.50 0.50 0.45 0.40 0.43 signals Euro convergence 0.40 Feb-03 Feb-05 Feb-07 Source: Crédit Agricole CIB, Bloomberg
06 April 2011
0.30 Feb-09
Feb-11
2003 2004 2005 2006 2007 2008 2009 2010 2011 Source: Crédit Agricole CIB, Bloomberg
19
Emerging Market Monthly Roadmap
In the past a score of around 0.43, just before the EU agreement to join the monetary union, has been sufficient to ensure that nominal convergence has taken place. This was the case for Greece (2001), Slovenia (2007), Slovakia (2009) and even Estonia (2011). These countries show a similar path in the runup to monetary union. CE4 countries score in 2008 before the turmoil was close to this threshold, suggesting that the convergence process was almost achieved. The convergence index is far from pre-crisis levels. Harsh budget reforms are needed
Nevertheless, the convergence index is now far from its pre-crisis levels and the way to the Eurozone is still very long. Harsh adjustment is especially needed in terms of budget deficit. Indeed, the main contributor to the index rise during the turmoil has been the rising budget deficit as well as FX volatility. Therefore, it is clear that any desire to join to the Eurozone would imply a significant budget adjustment that the current governments in force are not ready to handle at the moment. It may prove to be a risky bet as there is a risk of a complete economic disanchoring from the Eurozone and then the adjustment would be harsher.
Poland is likely the first to join despite a high score
Given the past experience of Greece, one can surmise that the EU will be even tougher when studying the new candidatures. Still, candidates should have to also exhibit sound current account balances or a stable financial sector, which is not the case at all. On these points, CE4 countries, and Poland to a lesser extent, are far from presenting sound situations. Based on the convergence moves before 2008, it is clear that a return to the 0.43 threshold could take more than two years should the authorities tackle the issues. Assuming that the CE4 will start thinking again about joining the Eurozone, but not before 2013, they would therefore adopt the EUR at very best in 2016.
Convergence trade: it could be the right time soon EUR adoption may be back on the agenda soon
The convergence trade is not longer a one way bet. The tightening of the 5Y5Y swap rate spread is less of a macro trade than previously. One has to be highly selective in picking countries. Nevertheless, the popularity of this macro-trade may return to the limelight soon. When the dust settles and CE4 countries deal with their ongoing issues, we will likely hear more about the Eurozone. It would not be easy for politicians to avoid the subject. Since they are members of the EU, and as they do not benefit from an opt-out option, CE4 countries are supposed to adopt the EUR, in theory. The Swedish case suggests there could always be a way out, but the pressure from the EU will likely be strong anyway. Convergence trade: spread to the Eurozone 400
bp
300 200 100 0 Poland 5Y5Y - EU 5Y5Y
-100 -200 Apr-03
Hungary 5Y5Y - EU 5Y5Y Czech Rep. 5Y5Y - EU 5Y5Y Apr-04
Apr-05
Apr-06
Apr-07
Apr-08
Apr-09
Apr-10
Apr-11
Source: Bloomberg, Crédit Agricole CIB
Polish and Czech 5Y5Y rates have the best potential to converge towards the 5Y5Y EUR rate.
06 April 2011
To this extent, Romania and Hungary are likely seen as the laggards even if Hungary is presenting the best score. The banking sector is still highly leveraged and the external debt is close to 118% of GDP. Given its sound economic situation and the intact desire to join the Eurozone, Poland is the country to watch, though its score is high. The Czech Republic, due to its close integration with the German economy is likely the one which may benefit the most from the EUR. Therefore The Polish and Czech 5Y5Y rates have the best potential to converge towards the 5Y5Y EUR rate.
20
Emerging Market Monthly Roadmap
Hot topic 4: Safe play on KZT gradual appreciation maxim.oreshkin @ca-cib.com Strong balance of payments (as a result of commodity price growth and strong FDI inflows) and growing inflation pressures pushed NBK to move to a managed floating exchange rate regime, allowing for KZT appreciation. With NBK promising to keep the FX market stable, a bet on KZT strength can be a safe play.
Balance of payments – fundamentally strong If we look at the structure of Kazakhstan exports we will find that 80% of it is represented by oil products, metals and wheat. All these goods delivered very good price performance in the past year boosting the exports, moreover export volumes are on a longer-term rising trend (especially due to expected oil production growth), which adds long-term stability to the current account balance.
With 80% of exports presented by oil, metals and wheat – balance of payments strength is not surprising
At the same time financial inflows also remain at a solidly positive level. And do not be mislead by the FDI plunge in H210 – it was mainly result of the reclassification of investments from a direct to portfolio category. Balance of payments gives strong support for KZT (USDbn) 25
10
Foreign investment
Exports (SA)
8 20
6 15
4
10
2 0
5
-2 0 06
07
08
09
-4
10
07
Source: NBK, Crédit Agricole CIB
NBK bought USD6bn since the start of the year
Sum of tw o components Direct investments Increase in portfolio liabilities 08 09
10
Source: NBK, Crédit Agricole CIB
Despite fast growing imports, foreign currency inflows are far behind foreign currency outflows. In this situation, in order to prevent fast KZT appreciation, the NBK was forced to step in with massive KZT interventions on the FX market. Since the beginning of the year NBK bought USD6bn from the market. International reserves are sky rocketing on NBK interventions 35
International reserves (USD bn)
30
25
20
15 Jan-08
Jul-08
Jan-09
Jul-09
Jan-10
Jul-10
Jan-11
Source: NBK
06 April 2011
21
Emerging Market Monthly Roadmap
KZT REER decreased by 2.9% since January 2008, while RUB appreciated by 11.6%
The National Bank of Kazakhstan was continuously preventing currency appreciation for the last year and a half by intervening on the FX market. The resulting increase in monetary aggregates has not lead to an acceleration in inflation as the economy was still recovering from the slump of 2007-2009. As a result, the KZT is much weaker nowadays in terms of its real effective exchange rate than the RUB: while the RUB is 11.6% stronger now than in January 2008, a similar result for KZT is -2.9%.
Inflation: second force behind KZT appreciation NBK will use KZT appreciation as an anti-inflation measure
At the same time, rising inflation pressures became evident with headline CPI reaching 8.9% – its highest level since December 2008 and above the upper band of NBKs target for this year (6-8%). NBK treats currency appreciation as one of the anti-inflationary tools, especially in the situation where credit channels in the economy are not fully operational due to the consequences of the banking crisis. Rising inflation pressure makes NBK tolerant for KZT appreciation 10%
9%
8%
7%
6%
Headline CPI, % Core CPI, %
5% 09
09
10
10
11
Source: NBK, ASRK, Crédit Agricole CIB
On 1 March NBK officially announced a move to a managed floating regime for KZT after it was trading in a tight range for two years following the currency devaluation in February 2009. It will allow the currency to move beyond former trading bands and will result in increased volatility. NBK promises to keep the currency stable, limiting future volatility of the KZT
Under the above mentioned conditions we expect KZT to continue along its appreciation trend that started earlier this year. As we do not expect any significant political changes in Kazakhstan in the next few years (with key personalities remaining in place) the probability of a change to NBK’s policy is very low. NBK continuously repeats that stability on FX market is one of its goals, this is why we do not expect volatility to increase dramatically. With equilibrium rate for KZT/USD well below its current level and taking into account NBKs promise to keep the currency stable we expect the gradual appreciation to continue throughout the year. Thus, we advise going short USD/KZT NDF 12M targeting a move to 140.00 by year end from the current level of 144.9 with a stop-loss of 147.3. Although the potential gain in this trade is quite limited, it offers quite a safe bet with limited probability of a downside move.
06 April 2011
22
Emerging Market Monthly Roadmap
Hot Topic 5: Where is MENA going?
[email protected] It is hard to foretell the political end game of the region, yet calls for a voice and participation do not seem to abate. Libya’s future is uncertain as developments in Syria are shifting attention to the Mashreq. Events in Bahrain require vigilance and Yemen is changing. US foreign policy in the region is exhibiting a differentiation between values and realpolitik interests.
Instability shifting East Uncertainty still high
Few in the MENA region have been immune to the “Arab Revolts”. Friday has become the most watched day by everyone in the region and outside. It seems this trend will continue. Calls for a voice, accountability, transparency and less corruption are hallmarks of the “Arab Revolts.” It is hard to predict the political end game of the region. It seems more likely that calls for a voice and participation will not abate. Those countries initially perceived as more able to withstand the winds of change in the Arab world are less immune today. Events in Libya continue to look murky and confrontation is bound to continue. Algeria, Morocco and Jordan should be closely watched over the coming weeks. Developments in Syria over the last week have also raised concern about the impact of the “Arab Revolts” in more ’buffered‘ states, predicated on a heavy security apparatus. The former Minister of Agriculture has been appointed as Prime Minister and has been asked to form a government. It remains to be seen how society will react to Bashar Al Assad’s reform pledges, including setting up studies into replacing emergency law with anti-terrorism legislation and addressing Kurdish grievances. Instability in the Mashreq will have greater geopolitical implications than global oil market implications such as Libya and the Gulf. Changes in the political landscape in the Mashreq could have implications on Iran’s role in the wider region. The worsening of the political landscape in Syria could have wider implications for Lebanon’s balance of power.
Gulf economies: not immune Oman: focus on economics
The Gulf economies have not been immune from calls to reform the political economy. For Gulf societies the key issue is legitimacy which remains largely unchallenged, unlike other parts of the wider region. Protesters in Oman have focused on demands for better wages, jobs and an end to corruption. Sultan Qaboos of Oman sacked twelve ministers last month in a response to calls to end corruption. It remains to be seen how change is managed in the coming weeks, as constitutional amendments have been promised. Protests in Oman had, so far, a measured impact on the economy, far less than in the case of Bahrain. However, major disruptions and violence could impact the country’s image and damage the country’s tourism sector. We maintain our GDP growth for Oman at 4.1% for 2011.
Yemen: hardly any spill over effect on Saudi Arabia
In Yemen, the president is under significant pressure. The currency has taken a fresh plunge as dollarization is favoured. The situation in Yemen will remain precarious but we do not expect spill over effects in neighbouring Saudi Arabia. The risk to oil production in Saudi Arabia from an Al Qaeda attack emanating from Yemen is quite remote. Similar calls were made during the 2003 Iraq invasion as spill over effects were once again uttered and with time discounted. Saudi Arabia has made significant security upgrades over the recent years in all of its strategic installations, including all its oil installations. There has never been any successful attack that has damaged Saudi’s oil infrastructure or disrupted oil supplies in the course of the country’s oil history. Saudi Arabia’s current spare capacity is c.3.5million barrels allowing it to offset any additional oil lost.
Saudi Arabia buffered Saudi Arabia: huge stimulus
06 April 2011
The macro outlook for Saudi Arabia is solid, based on higher oil production, higher oil prices and high government spending. We have increased our growth forecast for Saudi Arabia from 4.2% to 5.5%, mainly due to higher than previously expected oil and government GDP contributions. Saudi Arabia has announced an estimated USD130bn worth of hand outs and structurally supportive measures, such as the building of half a million housing units. More emphasis is required toward productivity gains than short term private consumption measures.
23
Emerging Market Monthly Roadmap
Bahrain: towards normalisation?
The rest of the Gulf’s economies will continue to be positively impacted by higher oil revenues. Bahrain’s political quagmire seems to be decelerating or at least unrest seems less disruptive for now. The return to normality is gradually gaining pace with the opening of the Causeway between Saudi Arabia and Bahrain. Nevertheless, we downgraded Bahrain’s growth forecasts for 2011, from a previous estimate of 4.1% to 2%. Bahrain will continue to be geopolitically and strategically supported by the rest of the GCC in light of any systemic threats. Bahrain’s careful political navigation in the next few weeks requires vigilance. For Kuwait, the recent resignation of the cabinet is not surprising given the assertiveness of its parliament and the delay of important economic reform projects over the last few years. Markets have priced in such political disruptions which have never impaired Kuwait’s oil export capacity. Just like in the case of Saudi Arabia and the UAE, Kuwait will be able to benefit from anticipated higher oil revenues. Oil price breakeven: up 100 90 80 70 60 50 40 30 20 10 0
2010 2011 Algeria Bahrain
Iran
Iraq
Kuw ait Oman
Qatar
Saudi Yemen Arabia
Source: Bloomberg, Crédit Agricole CIB
US realpolitik Realpolitik differentiation
06 April 2011
There is a bit more clarity about US foreign policy in the region than at the outset of the “Arab revolts”. US policy in the Middle East shows signs of realpolitik differentiation. Egypt is perceived as strategically important, due to its proximity and peace treaty with Israel. In the Gulf, Saudi Arabia is the most important strategic partner due to its systemic role in the global oil market (Saudi Arabia is the source of 12% of crude supply to the US) as well as its geopolitical position in Iran. Mindful of the US military obligation on the ground in Iraq, as well as Afghanistan, the US will not opt for an open-ended military involvement. In the event of an Iranian military engagement in the Gulf region, US military resolve would be put to the test as downside risks will be deleterious.
24
Emerging Market Monthly Roadmap
Economic forecasts USA JAPAN EUROZONE Germany France Italy Spain Greece Norway Sweden Switzerland Canada Australia New Zealand United Kingdom Asia China Hong Kong India Indonesia Korea Malaysia Philippines Singapore Taiwan Thailand Vietnam Latin America Argentina Brazil Mexico Emerging Europe Czech Republic Hungary Poland Russia Romania Turkey Africa & Middle East Algeria Egypt Kuwait Lebanon Morocco Qatar Saudi Arabia South Africa United Arab Emirates Tunisia Total Industrialised countries Emerging countries
Real GDP (YoY. %) 10 11 12 2.8 2.9 3.2 3.9 -0.1 2.5 1.7 1.8 1.7 3.5 2.6 2.0 1.5 1.5 1.7 1.2 1.0 1.1 -0.1 0.5 0.9 -4.5 -3.2 0.2 0.4 2.8 2.8 5.3 4.7 3.1 1.6 1.9 2.2 3.1 3.3 3.4 2.7 3.1 3.4 1.5 2.0 3.5 1.3 1.5 2.0 9.1 8.2 8.1 10.3 9.5 9.0 6.8 6.3 6.8 8.3 8.4 8.3 6.1 5.8 5.8 6.1 6.1 6.5 7.2 4.1 6.8 7.3 5.0 6.6 14.5 6.7 7.1 10.8 5.8 6.3 7.8 5.3 6.0 6.8 6.5 7.4 6.6 4.0 4.4 7.0 4.0 4.0 7.5 4.0 4.3 5.3 4.0 4.8 4.2 3.7 3.4 2.3 2.3 2.3 1.2 2.3 2.0 3.8 3.3 3.0 4.0 3.7 3.3 -1.3 1.5 2.9 7.5 5.5 4.5 4.3 4.4 4.7 4.1 3.2 4.3 5.2 3.7 5.5 3.2 3.5 4.4 7.5 5.3 6.0 3.2 3.5 4.4 16.1 12.4 10.2 3.8 5.5 4.4 2.5 3.5 4.0 2.0 3.4 3.8 3.4 1.0 3.0 4.9 4.2 4.4 2.6 2.2 2.6 7.6 6.6 6.6
10 1.7 -1.0 1.6 1.2 1.5 1.6 2.0 4.7 2.4 1.3 0.7 1.8 2.9 2.3 3.3 4.6 3.3 2.4 9.6 5.1 3.0 1.7 3.8 2.8 1.0 3.3 9.2 6.8 17.0 5.8 4.2 7.0 1.5 4.9 2.6 8.8 6.1 8.3 5.0 3.9 11.1 4.0 4.3 1.4 -2.2 5.3 4.3 1.0 4.4 3.2 1.3 5.3
CPI (YoY. %) 11 2.8 0.4 2.4 2.4 2.0 2.3 2.8 2.3 1.8 2.5 1.0 2.4 3.5 3.9 3.7 5.3 5.0 4.1 7.0 6.8 4.0 2.6 4.8 5.6 2.3 4.0 12.1 6.3 17.0 5.0 4.0 6.8 2.3 3.4 3.0 9.0 5.5 7.0 5.6 4.8 10.0 4.2 5.6 3.0 2.7 5.6 4.7 3.1 4.7 3.9 2.3 5.7
12 1.9 0.6 1.9 2.1 1.6 1.9 2.1 1.1 2.3 2.5 1.2 1.9 3.3 3.3 1.7 4.4 3.8 3.8 6.0 6.2 3.6 2.4 5.2 4.0 2.7 4.3 9.8 6.1 17.0 4.5 4.0 7.6 2.0 2.5 2.5 11.0 3.9 7.0 5.2 4.3 9.3 4.3 3.0 2.7 3.9 4.1 5.0 3.9 5.0 3.3 1.8 5.2
Current Account (% GDP) 10 11 12 -3.3 -3.3 -3.2 3.6 2.6 3.8 -0.3 0.3 0.5 5.8 6.1 5.6 -2.1 -2.2 -2.3 -3.4 -3.1 -2.8 -4.5 -3.8 -3.2 -10.0 -8.2 -5.6 14.0 15.0 13.1 7.0 7.0 7.3 9.5 8.0 9.0 -3.1 -2.8 -2.1 -2.6 -3.5 -2.8 -2.3 -2.9 -2.7 -2.2 -1.6 -1.2 3.2 2.7 2.2 5.1 4.0 2.9 8.7 10.5 11.2 -4.3 -3.8 -4.2 0.9 0.5 -0.1 2.8 3.0 3.4 11.8 6.9 8.9 4.5 8.9 8.1 22.2 24.7 25.2 9.4 9.0 9.4 4.6 3.9 4.4 -7.8 -8.6 -7.9 -1.2 -1.7 -1.8 1.5 1.5 1.1 -2.3 -3.0 -2.8 -0.6 -1.0 -1.5 0.3 -0.8 -2.0 -3.0 -2.8 -3.0 2.3 -1.6 -1.8 -2.6 -3.0 -2.8 4.8 3.0 0.0 -5.8 -6.9 -6.4 -6.0 -5.5 -4.5 4.5 4.3 4.9 4.2 5.6 4.1 0.3 0.4 1.8 32.1 29.1 28.3 -12.0 -15.0 -7.0 -7.2 -13.0 -9.0 21.8 26.5 27.6 9.5 9.7 9.9 -3.5 -4.0 -4.0 5.5 6.1 7.2 -2.2 -3.8 -3.3 0.5 0.3 0.2 -1.0 -1.0 -0.7 2.3 1.7 1.2
* For UK: HICP; for India: wholesale prices; for China, retail price index; for Brazil: IPCA, for South Africa: CPI-X ** For India: Fiscal year ending in March Source: Crédit Agricole CIB
06 April 2011
25
Emerging Market Monthly Roadmap
Exchange rate forecasts 06-Apr
Jun-11
Se p-11
De c-11
M ar -12
Jun-12
Se p-12
De c-12
USD Ex cha nge ra te Indus trialis e d countr ie s Euro
EUR/USD
1.43
1.32
1.28
1.25
1.23
1.21
1.20
1.18
Japan
USD/JPY
85
85
90
94
96
98
100
102
United Kingdom
GBP/USD
1.63
1.61
1.60
1.60
1.60
1.59
1.60
1.59
Sw itzerland
USD/CHF
0.92
1.02
1.06
1.12
1.15
1.17
1.19
1.22
Canada
USD/CA D
0.96
0.97
0.96
0.95
0.94
0.93
0.92
0.90
A ustralia
A UD/USD
1.04
1.05
1.05
1.06
1.07
1.09
1.11
1.12
New Zealand
NZD/USD
0.78
0.80
0.80
0.81
0.82
0.83
0.84
0.84
As ia China
USD/CNY
6.54
6.43
6.36
6.30
6.24
6.18
6.11
6.05
Hong Kong
USD/HKD
7.78
7.77
7.77
7.77
7.77
7.77
7.77
7.77
India
USD/INR
44.17
45.10
45.33
45.50
45.12
44.74
44.36
43.98
Indonesia
USD/IDR
8653
9250
9200
9150
9100
9050
9000
8950
Malaysia
USD/MY R
3.02
3.11
3.10
3.09
3.07
3.05
3.03
3.01
Philippines
USD/PHP
43.2
42.7
42.1
41.5
41.2
41.0
40.7
40.5
Singapore
USD/SGD
1.26
1.24
1.23
1.23
1.22
1.22
1.20
1.19
South Korea
USD/KRW
1087
1095
1075
1050
1035
1020
1005
990
Taiw an
USD/TWD
29.0
29.8
29.6
29.5
29.3
29.1
29.0
28.8
Thailand
USD/THB
30.1
29.6
29.4
29.2
29.0
28.8
28.6
28.4
V ietnam
USD/V ND
20913
20900
21400
21400
21900
21900
22500
22500
Latin Am e r ica A rgentina
USD/A RS
4.05
4.10
4.15
4.20
4.25
4.30
4.35
4.40
Brazil
USD/BRL
1.60
1.65
1.65
1.70
1.70
1.70
1.75
1.80
Mexico
USD/MXN
11.80
11.80
11.70
11.50
11.45
11.40
11.30
11.20
Afr ica South A f rica
Em e r ging Eur ope Poland Russia Turkey
USD/ZA R
6.70
6.70
6.70
6.90
7.00
7.10
7.20
7.30
TRY /ZA R
4.40
4.47
4.56
4.76
4.76
4.80
4.83
4.87
USD/PLN
2.79
2.95
3.01
3.00
3.04
3.07
3.08
3.14
USD/RUB
28.23
29.46
31.71
32.45
31.22
32.69
33.48
34.14
Basket/RUB
33.68
33.70
35.70
36.10
34.45
35.78
36.49
36.90
USD/TRY
1.52
1.50
1.47
1.45
1.47
1.48
1.49
1.50
Euro Cross ra te s Indus trialis e d countr ie s Japan
EUR/JPY
122
112
115
118
118
119
120
120
United Kingdom
EUR/GBP
0.878
0.820
0.800
0.780
0.770
0.760
0.750
0.740
Sw itzerland
EUR/CHF
1.31
1.35
1.36
1.40
1.41
1.42
1.43
1.44
Sw eden
EUR/SEK
9.02
8.70
8.90
9.05
9.20
9.15
9.10
9.00
Norw ay
EUR/NOK
7.79
8.00
7.80
7.70
7.80
7.70
7.60
7.40
EUR/CZK
24.43
24.14
24.00
23.80
23.80
23.60
23.60
23.60
Ce ntr al Eur ope Czech Rep. Hungary
EUR/HUF
264
272
270
270
270
270
270
270
Poland
EUR/PLN
3.98
3.90
3.85
3.75
3.74
3.72
3.70
3.70
Romania
EUR/RON
4.10
4.25
4.25
4.25
4.25
4.25
4.25
4.25
Source: Crédit Agricole CIB
06 April 2011
26
Emerging Market Monthly Roadmap
Policy rate forecasts 06-Apr
Jun-11
Se p-11
De c-11
M ar -12
Jun-12
Se p-12
De c-12
G3 USA Japan Eurozone
Fed f unds Call Repo
0.25 0.06 1.00
0-0.25 0-0.10 1.25
0-0.25 0-0.10 1.50
0-0.25 0-0.10 1.75
0-0.25 0-0.10 2.00
0-0.25 0-0.10 2.25
0.75 0-0.10 2.50
1.25 0-0.10 2.50
1Y lending rate Base rate Repo rate BI rate Call rate OPR Repo rate 6M SOR Redisc Repo Base rate
6.31 0.50 6.75 6.75 3.00 2.75 4.25 0.36 1.75 2.50 9.00
6.56 0.50 6.75 7.00 3.25 3.00 4.50 0.67 2.00 2.75 11.00
6.56 0.50 7.00 7.25 3.50 3.25 4.75 0.67 2.00 3.00 12.00
6.56 0.50 7.00 7.25 3.50 3.25 4.75 0.70 2.00 3.00 12.00
6.81 0.50 7.00 7.25 3.50 3.25 5.00 0.71 2.00 3.00 12.00
6.81 0.50 7.25 7.25 3.50 3.50 5.00 0.76 2.00 3.00 12.00
7.06 0.75 7.25 7.25 3.75 3.50 5.25 1.10 2.25 3.25 12.00
7.06 1.25 7.50 7.25 4.00 3.50 5.25 1.34 2.50 3.50 12.00
3M deposit Overnight/Selic Overnight rate
10.93 11.75 4.50
10.50 12.50 4.50
11.00 12.50 4.50
11.00 12.50 4.50
11.00 12.00 5.25
11.25 11.25 5.50
11.50 10.75 5.75
11.50 10.50 6.00
14D repo 2W repo 7D repo 2W repo O/N Deposit rate 1W repo rate
0.75 6.00 4.00 6.25 3.00 6.25
1.00 6.00 4.25 6.25 3.75 6.25
1.25 6.00 4.25 6.25 4.00 7.00
1.50 6.00 4.50 5.75 4.00 8.00
1.75 6.00 4.75 5.50 4.75 8.00
1.75 6.00 4.75 5.50 6.00 8.00
2.00 6.00 4.75 5.50 7.50 8.50
2.00 6.00 4.75 5.50 9.00 9.00
5.50 1.00 2.00
5.50 1.00 2.00
5.50 1.00 2.00
5.75 1.00 2.00
6.50 1.00 2.00
7.00 1.00 2.00
7.50 1.25 2.25
8.00 1.75 2.75
As ia China Hong Kong India Indonesia Korea Malaysia Philippines Singapore Taiw an Thailand V ietnam Latin Am e r ica A rgentina Brazil Mexico Em e r ging Eur ope Czech Rep. Hungary Poland Romania Russia Turkey
Afr ica & M iddle Eas t South A f rica UA E Saudi A rabia
Repo Repo Repo
Source: Crédit Agricole CIB
06 April 2011
27
Emerging Market Monthly Roadmap
Interest rate forecasts 06-Apr
Jun-11
Sep-11
Dec-11
Mar-12
USA 3 month 2Y 10Y
0.29 0.81 3.48
0.40 0.95 3.65
0.40 1.45 3.85
0.40 1.75 4.10
0.45 1.85 4.25
Japan 3 month 2Y 10Y
0.20 0.21 1.30
0.34 0.20 1.10
0.34 0.20 1.15
0.35 0.22 1.20
0.35 0.23 1.25
Eurozone 3 month 2Y (Ger) 10Y (Ger)
1.21 1.84 3.40
1.75 2.45 3.60
2.00 3.00 3.80
2.25 3.25 4.00
2.50 3.50 4.20
Korea Call rate 91D CD 3Y IRS 10Y IRS
3.00 3.39 3.98 4.36
3.25 3.50 4.30 4.60
3.50 3.50 4.50 4.80
3.50 3.60 4.50 4.90
3.50 3.60 4.60 5.10
Hong Kong Base rate 3M HIBOR 2Y IRS 10Y IRS
0.50 0.26 0.89 3.18
0.50 0.50 1.05 3.30
0.50 0.50 1.45 3.60
0.50 0.80 1.80 3.80
0.50 0.90 1.90 3.95
Thailand Repo rate 6M THBFIX 2Y IRS 10Y IRS
2.50 2.73 3.28 4.28
2.75 2.80 3.50 4.50
3.00 2.90 3.60 4.60
3.00 2.60 3.80 4.80
3.00 2.50 3.80 4.80
Singapore 6M SOR 2Y IRS 10Y IRS
0.36 0.87 2.87
0.67 1.05 3.10
0.67 1.55 3.40
0.70 1.75 3.60
0.71 2.00 3.80
China 1Y lending rate 7-day repo 2Y IRS (7-day repo) 10Y IRS (7-day repo)
6.31 2.40 3.63 4.47
6.56 3.00 3.75 4.60
6.56 3.30 3.80 4.40
6.56 3.50 3.70 4.30
6.81 3.50 3.60 4.30
Taiwan Rediscount rate 90D CP 2Y IRS 10Y IRS
1.75 0.74 1.03 1.77
2.00 0.85 1.25 2.10
2.00 0.90 1.40 2.30
2.00 1.00 1.60 2.60
2.00 1.10 1.80 2.60
India Repo rate O/N NSE MIBOR 2Y OIS 10Y OIS
6.75 6.02 7.58 8.15
6.75 6.60 7.30 8.50
7.00 6.75 7.50 8.30
7.00 7.00 7.70 8.30
7.00 6.85 7.60 8.20
Source: Crédit Agricole CIB
06 April 2011
28
Emerging Market Monthly Roadmap
Interest rate forecasts 06-Apr
Jun-11
Sep-11
Dec-11
Mar-12
Czech Republic 14D repo 3M PRIBOR 2Y IRS 10Y IRS
0.75 0.84 2.28 3.40
1.00 1.10 2.40 3.55
1.25 1.40 2.70 3.60
1.50 1.60 2.90 3.85
1.75 1.85 3.20 3.95
Poland 7D repo 3M WIBOR 2Y IRS 10Y IRS
4.00 4.15 5.25 5.63
4.25 4.55 5.30 5.85
4.25 4.60 5.40 6.00
4.50 4.80 5.65 6.20
4.75 5.05 5.97 6.40
Hungary 2W repo 6M BUBOR 2Y IRS 10Y IRS
6.00 6.10 6.29 6.64
6.00 6.20 6.52 6.60
6.00 6.20 6.60 7.00
6.00 6.20 6.50 7.00
6.00 6.20 6.40 7.10
Romania 2W repo 3M ROBOR
6.25 5.40
6.25 6.00
6.25 6.30
5.75 6.00
5.50 5.90
South Africa Repo 3M JIBAR 2Y IRS 10Y IRS
5.50 5.58 6.70 8.39
5.50 5.55 6.90 8.40
5.50 5.55 7.15 8.50
5.75 5.80 7.35 8.60
6.50 6.60 8.00 8.90
Turkey 1W repo 3M TRLIBOR 2Y CCY 10Y CCY
6.25 7.94 7.80 8.43
6.25 8.00 8.30 9.00
7.00 8.50 9.10 9.30
8.00 9.50 10.00 10.05
8.00 9.50 10.00 10.05
Russia Deposit rate 3M Mosprime 2Y IRS 10Y IRS
3.00 3.91 5.85 7.80
3.75 4.69 6.60 8.55
4.00 4.95 6.85 8.80
4.00 5.15 7.00 8.95
4.75 5.90 8.00 9.95
Mexico Overnight rate TIIE 28D 2Y IRS 10Y IRS
4.50 4.85 5.87 7.83
4.50 4.85 6.43 8.15
4.50 4.85 6.73 8.40
4.50 4.85 6.60 8.55
5.25 5.60 7.20 8.90
Brazil Selic rate 2Y DI 10Y DI
11.75 12.72 12.60
12.50 12.40 11.80
12.50 11.75 11.50
12.50 11.75 11.50
12.00 11.50 11.50
Source: Crédit Agricole CIB
06 April 2011
29
Emerging Market Monthly Roadmap
Commodities forecasts Oil price forecasts 2010
Ave r age pr ice s WTI Brent
USD/bl USD/bl
Q1 79 76
Q2 78 78
Q1 84 80
Q2 76 75
End quar te r pr ice s WTI Brent
2011 Q3 76 77
Q4 85 86
Q1 93 104
Q2 78 85
Q3 82 83
Q4 91 93
Q1 90 98
Q2 79 85
2010
USD/bl USD/bl
2012 Q3 79 84
Q4 82 86
Q1 83 87
Q2 73 76
Q3 81 85
Q4 83 87
Q1 78 82
Q2 75 78
Q4
Year
2,900
2011
Q3 77 80
Q4 83 87
Q3 80 84
Q4 84 88
2012
Source: Crédit Agricole CIB
Metals forecasts 06-Apr
2010 Year
Q1
Q2
2011 Q3
Q4
2012
2,650
Year
Q1
Q2
Q3
2,800
3,000
2,900
Long-term Prices
Base metals Aluminium USD/t
2,610
2,450
2,475
2,550
2,750
2,606
Copper
USD/t
9,370
8,725
9,500
9,800 10,000 10,500
9,950
Nickel
USD/t
25,381
24,500
27,000
Zinc
USD/t
2,404
2,475
2,420
2,450
2,500
2,700
2,518
2,700
2,800
2,600
2,700
2,700
1,764 (80c/lb)
Lead
USD/t
2,832
2,544
2,580
2,450
2,500
2,700
2,558
2,800
2,900
2,700
3,000
2,850
1,323 (60c/lb)
Tin
USD/t
31,600
25,000
34,000 36,000 34,000 36,000 35,000
15,000 (680c/lb)
2,500 24,000 26,000 25,500
29,460 30,000 30,000 34,540 31,000
2,900
2,650 (120c/lb)
9,750 10,500
4,960 (225c/lb)
25,000 26,000 26,000 27,000 26,000
15,432 (700c/lb)
10,750 11,000 10,500
Precious metals Gold
USD/oz
1,455
1,325
1,425
1,500
1,475
1,400
1,450
1,375
1,300
1,250
1,175
1,275
Silver
USD/oz
39.3
27.5
29.0
34.0
31.0
29.0
31.5
27.0
26.0
25.0
24.0
25.5
700 7.0
Platinum
USD/oz
1,796
1,765
1,725
1,900
1,875
1,960
1,884
1,950
2,000
2,050
2,080
2,020
1,200
Palladium
USD/oz
789
775
700
900
875
950
881
975
1,025
1,000
1,080
1,020
300
Source: Crédit Agricole CIB
06 April 2011
30
Emerging Market Monthly Roadmap FIM Research contact details Hervé Goulletquer Global FX Strategy Mitul Kotecha Daragh Maher Simon Smollett Adam Myers
Head of FIM Research Head of Global FX Strategy Deputy Head of Global FX Strategy Senior FX Options Strategist/Technical Analyst Senior FX Strategist
+33 1 41 89 88 34 +852 2826 9821 +44 20 7214 7469 +44 20 7214 5609 +44 20 7214 7468
Commodities Research Christophe Barret Robin Bhar
Global Oil Analyst Senior Metals Analyst
+44 20 7214 6537 +44 20 7214 7404
Emerging Market Strategy Sébastien Barbé Frances Cheung Dariusz Kowalczyk Maxim Oreshkin John Sfakianakis Guillaume Tresca Vladimir Vale
Head of EM Research and Strategy Senior Strategist – Asia ex-Japan Senior Economist/Strategist – Asia ex-Japan Senior Strategist – Russia and CIS Chief Economist BSF Crédit Agricole Group Emerging Market Strategist Chief Strategist Crédit Agricole Brasil SA DTVM
+33 1 41 89 15 97 +852 2826 1520 +852 2826 1519 +7 495 937 0581 +966 1 276 4611 +33 1 41 89 18 47 +55 11 3896 6418
Global Interest Rate Strategy Global Head of Interest Rates Strategy David Keeble Head of European Interest Rates Strategy Luca Jellinek Interest Rates Strategist Peter Chatwell Interest Rates Strategist Orlando Green
+1 212 261 3274 +44 20 7214 6244 +44 20 7214 5289 +44 20 7214 7467
Macro Research Isabelle Job Hélène Baudchon Frederik Ducrozet Slavena Nazarova
Head of Macro Research Economist – USA Economist – Eurozone Economist – UK, Scandinavia
+44 20 7214 5767 +33 1 43 23 27 61 +33 1 41 89 98 95 +33 1 41 89 99 18
Michael P. Carey Sireen Hajj
Chief Economist – North America Associate – North America
+1 212 261 7134 +1 212 261 7139
Susumu Kato Yoshiro Sato
Chief Economist – Japan Associate – Japan
+81 3 4580 5336 +81 3 4580 5337
Asset Allocation Jean-François Perrin
Asset Allocation Strategist
+33 1 57 87 32 60
Certification The views expressed in this report accurately reflect the personal views of the undersigned analyst(s). In addition, the undersigned analyst(s) has not and will not receive any compensation for providing a specific recommendation or view in this report. Sébastien Barbé, Frances Cheung, Mitul Kotecha, Dariusz Kowalczyk, Maxim Oreshkin, John Sfakianakis, Guillaume Tresca, Vladimir Vale Disclaimer © 2011, CRÉDIT AGRICOLE CORPORATE AND INVESTMENT BANK All rights reserved. This research report or summary has been prepared by Crédit Agricole Corporate and Investment Bank or one of its affiliates (collectively “Crédit Agricole CIB”) from information believed to be reliable. Such information has not been independently verified and no guarantee, representation or warranty, express or implied, is made as to its accuracy, completeness or correctness. This report is a “commercial communication” as defined in article 6 of the Directive 2000/31/CE of 8 June 2000. For the avoidance of doubt, it is not a “communication à caractère promotionnel” within the meaning of the Règlement General AMF. It is provided for information purposes only. Nothing in this report should be considered to constitute investment, legal, accounting or taxation advice and you are advised to contact independent advisors in order to evaluate this report. It is not intended, and should not be considered, as an offer, invitation, solicitation or personal recommendation to buy, subscribe for or sell any of the financial instruments described herein, nor is it intended to form the basis for any credit, advice, personal recommendation or other evaluation with respect to such financial instruments and is intended for use only by those professional investors to whom it is made available by Crédit Agricole CIB. Crédit Agricole CIB does not act in a fiduciary capacity to you in respect of this report. Crédit Agricole CIB may at any time stop producing or updating this report. Not all strategies are appropriate at all times. Past performance is not necessarily a guide to future performance. The price, value of and income from any of the financial instruments mentioned in this report can fall as well as rise and you may make losses if you invest in them. Independent advice should be sought. In any case, investors are invited to make their own independent decision as to whether a financial instrument or whether investment in the financial instruments described herein is proper, suitable or appropriate based on their own judgement and upon the advice of any relevant advisors they have consulted. Crédit Agricole CIB has not taken any steps to ensure that any financial instruments referred to in this report are suitable for any investor. Crédit Agricole CIB will not treat recipients of this report as its customers by virtue of their receiving this report. Crédit Agricole CIB, its directors, officers and employees may effect transactions (whether long or short) in the financial instruments described herein for their own accounts or for the account of others, may have positions relating to other financial instruments of the issuer thereof, or any of its affiliates, or may perform or seek to perform securities, investment banking or other services for such issuer or its affiliates. Crédit Agricole CIB may have issued, and may in the future issue, other reports that are inconsistent with, and reach different conclusions from, the information presented in this report. Crédit Agricole CIB is under no obligation to ensure that such other reports are brought to the attention of any recipient of this report. Crédit Agricole CIB has established a “Policy for Managing Conflicts of Interest in relation to Investment Research” which is available upon request. A summary of this Policy is published on the Crédit Agricole CIB website: http://www.ca-cib.com/groupoverview/the-markets-in-financial-instruments-directive-mifid.htm. This Policy applies to its investment research activity. None of the material, nor its content, nor any copy of it, may be altered in any way, transmitted to, copied or distributed to any other party without the prior express written permission of Crédit Agricole CIB. To the extent permitted by applicable securities laws and regulations, Crédit Agricole CIB accepts no liability whatsoever for any direct or consequential loss arising from the use of this document or its contents. France: Crédit Agricole Corporate and Investment Bank is authorised by the Autorité de Contrôle Prudentiel (“ACP”) and supervised by the ACP and the Autorité des Marchés Financiers (“AMF”). United Kingdom: Approved and/or distributed by Crédit Agricole Corporate and Investment Bank, London branch. Crédit Agricole Corporate and Investment Bank is authorised by the ACP and supervised by the ACP and the AMF in France and subject to limited regulation by the Financial Services Authority. Details about the extent of our regulation by the Financial Services Authority are available from us on request. United States of America: This research report is distributed solely to persons who qualify as “Major U.S. Institutional Investors” as defined in Rule 15a-6 under the Securities and Exchange Act of 1934 and who deal with Crédit Agricole Corporate and Investment Bank. Recipients of this research in the United States wishing to effect a transaction in any security mentioned herein should do so by contacting Crédit Agricole Securities (USA), Inc. (a broker-dealer registered with the Securities and Exchange Commission). The delivery of this research report to any person in the United States shall not be deemed a recommendation of Crédit Agricole Securities (USA), Inc. to effect any transactions in the securities discussed herein or an endorsement of any opinion expressed herein. Italy: This research report can only be distributed to, and circulated among, professional investors (operatori qualificati), as defined by the relevant Italian securities legislation. Spain: Distributed by Crédit Agricole Corporate and Investment Bank, Madrid branch and may only be distributed to institutional investors (as defined in article 7.1 of Royal Decree 291/1992 on Issues and Public Offers of Securities) and cannot be distributed to other investors that do not fall within the category of institutional investors. Hong Kong: Distributed by Crédit Agricole Corporate and Investment Bank, Hong Kong branch. This research report can only be distributed to professional investors within the meaning of the Securities and Futures Ordinance (Cap.571) and any rule made there under. Japan: Distributed by Crédit Agricole Securities Asia B.V. which is registered for securities business in Japan pursuant to the Law Concerning Foreign Securities Firms (Law n°5 of 1971, as amended), and is not intended, and should not be considered, as an offer, invitation, solicitation or recommendation to buy or sell any of the financial instruments described herein. This report is not intended, and should not be considered, as advice on investments in securities which is subject to the Securities Investment Advisory Business Law (Law n°74 of 1986, as amended). Luxembourg: Distributed by Crédit Agricole Corporate and Investment Bank, Luxembourg branch. It is only intended for circulation and/or distribution to institutional investors and investments mentioned in this report will not be available to the public but only to institutional investors. Singapore: Distributed by Crédit Agricole Corporate and Investment Bank, Singapore branch. It is not intended for distribution to any persons other than accredited investors, as defined in the Securities and Futures Act (Chapter 289 of Singapore), and persons whose business involves the acquisition or disposal of, or the holding of capital markets products (as defined in the Securities and Futures Act (Chapter 289 of Singapore)). Switzerland: Distributed by Crédit Agricole (Suisse) S.A. This report is not subject to the SBA Directive of January 24, 2003 as they are produced by a non-Swiss entity. Germany: Distributed by Crédit Agricole Corporate and Investment Bank, Frankfurt branch and may only be distributed to institutional investors. Australia: Distributed to wholesale investors only. This research, and any access to it, is intended only for “wholesale clients” within the meaning of the Australian Corporations Act. THE DISTRIBUTION OF THIS DOCUMENT IN OTHER JURISDICTIONS MAY BE RESTRICTED BY LAW, AND PERSONS INTO WHOSE POSSESSION THIS DOCUMENT COMES SHOULD INFORM THEMSELVES ABOUT, AND OBSERVE, ANY SUCH RESTRICTIONS. BY ACCEPTING THIS REPORT YOU AGREE TO BE BOUND BY THE FOREGOING.
06 April 2011
31