OPEC Monthly Oil Market Report 11 November 2016
Feature article:
Developments in global oil inventories
Oil market highlights
1
Feature article
3
Crude oil price movements
5
Commodity markets
12
World economy
17
World oil demand
34
World oil supply
44
Product markets and refinery operations
59
Tanker market
65
Oil trade
69
Stock movements
77
Balance of supply and demand
85
Monthly endnotes
92
Organization of the Petroleum Exporting Countries Helferstorferstrasse 17, A-1010 Vienna, Austria E-mail: prid(at)opec.org Website: www.opec.org
Oil market highlights Crude Oil Price Movements The OPEC Reference Basket rose by $4.98 in October, to average $47.87/b. ICE Brent and NYMEX WTI also surged, up by $4.15 and $4.71, to average $51.39/b and $49.94/b, respectively. Prices were lifted by declining US oil inventory levels and discussions to bring forward market rebalancing. However, prices came under pressure from a rise in US oil rig counts, a stronger US dollar, and profit taking. The ICE Brent-NYMEX WTI spread narrowed to $1.45/b, encouraging US imports of Brent-related grades.
World Economy World economic growth forecasts remain unchanged at 2.9% for this year and 3.1% for 2017. The OECD forecast also remains at 1.6% and 1.7% for 2016 and 2017, respectively, although growth in the Eurozone has been revised up to 1.6% and 1.3% for this and the coming year. The forecasts for China were also revised up to 6.7% in 2016 and 6.2% in 2017, while growth in India has been left unchanged at 7.5% for this year and 7.2% for the coming year. Russia is forecast to see a stronger recovery of 0.8% in 2017, following a contraction of 0.6% this year. Brazil’s growth was unchanged at 0.4% in 2017 after a contraction of 3.4% this year.
World Oil Demand World oil demand growth is expected to increase by 1.23 mb/d in 2016 to average 94.40 mb/d. This follows a marginal downward adjustment to account for the slower-thanexpected performance of Latin America and the Middle East, which was almost entirely offset by better-than-expected oil demand growth data from OECD Europe and Asia Pacific. In 2017, world oil demand growth is seen at 1.15 mb/d, unchanged from the October MOMR to average 95.55 mb/d.
World Oil Supply Non-OPEC oil supply in 2016 is now expected to contract by 0.78 mb/d, following a downward revision of around 0.1 mb/d from the October MOMR, to average 56.20 mb/d. In 2017, non-OPEC supply growth was revised down slightly by 10 tb/d to 0.23 mb/d, averaging 56.43 mb/d. OPEC NGLs are expected to average 6.43 mb/d in 2017, an increase of 0.15 mb/d over the current year. OPEC crude production, according to secondary sources, increased by 0.24 mb/d in October to average 33.64 mb/d.
Product Markets and Refining Operations Product markets in the Atlantic Basin continued to strengthen in October. The positive performance of the middle of the barrel, amid stronger demand and falling inventories, allowed gasoil crack spreads to show a sharp recovery. Meanwhile, some outages fuelled a tightening sentiment in the gasoline market. In Asia, margins remained healthy, supported by stronger regional demand amid the peak of regional refinery maintenance.
Tanker Market Tanker market sentiment experienced a general improvement in October, as freight rates in both dirty and clean segments of the market increased. Dirty tanker spot freight rates averaged 13% higher over the previous month on the back of improved tonnage requirements and seasonal demand, with VLCCs achieving the highest gains. Chartering activities edged up in October, although mostly remaining below year-ago levels.
Stock Movements OECD total commercial stocks fell in September to stand at 3,052 mb, some 304 mb above the five-year average, as crude and product inventories showed surpluses of 165 mb and 138 mb, respectively. In terms of days of forward cover, OECD commercial inventories stood at 65.7 days in September, some 6.5 days above the seasonal average.
Balance of Supply and Demand Demand for OPEC crude in 2016 is estimated to stand at 31.9 mb/d, a gain of 1.9 mb/d over last year. In 2017, demand for OPEC crude is forecast at 32.7 mb/d, an increase of 0.8 mb/d over the current year.
OPEC Monthly Oil Market Report – November 2016
1
2
OPEC Monthly Oil Market Report – November 2016
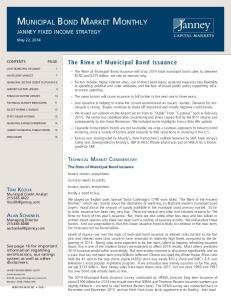
Developments in global oil inventories Global oil inventories have grown rapidly since oil prices began to fall in the middle of 2014. The steady decline in prices came as total oil production outpaced world oil demand. Lower prices and the wide contango structure of the market have provided the financial incentive to place large volumes of oil in storage. This has led to an increase in OECD commercial inventories by more than 400 mb since the end of 2Q14, along with an estimated build of 240 mb in non-OECD inventories. In addition, floating storage has also seen a gain of 50 mb over the same period. Altogether, OECD total commercial stocks saw a slowing build in the first three quarters of this year, increasing by 67 mb compared to a build of 248 mb over the same period last year. The slowdown in the build of OECD oil inventories can also be seen in the declining trend of the difference with the latest five-year average. The stock overhang currently stands at 304 mb, compared with 350 mb at the end of last year (Graph 1). Graph 1: OECD commercial stocks, mb 400 300 200 100 0 -100 -200
Jan 14 Mar 14 May 14 Jul 14 Sep 14 Nov 14 Jan 15 Mar 15 May 15 Jul 15 Sep 15 Nov 15 Jan 16 Mar 16 May 16 Jul 16 Sep 16
3,200 3,050 2,900 2,750 2,600 2,450 2,300
Graph 2: Oil supply/demand balance, mb/d 3.0 2.5
2.1 mb/d
2.0 1.5
1.1 mb/d
1.0 0.5 0.0 1Q15
2Q15
3Q15
4Q15
1Q16
2Q16
3Q16
Difference to 5-year average (RHS)
Difference between global supply & world demand
Absolute level (LHS)
Average (1Q-3Q)
Source: OPEC Secretariat.
Source: OPEC Secretariat.
Within the components, both the pace and period of stock-building has differed. Crude inventories rose slightly over the first nine months, compared to the massive build of 150 mb during the same period a year ago. In contrast, OECD product stocks have seen more consistent builds, increasing by 70 mb since the start of this year, which is broadly in line with the 90 mb increase seen in the same period a year ago. The slower build in crude oil stocks in 2016 has been due to lower global supply growth, which has been below the substantial rise seen last year. Indeed, from January to September this year, global oil supply grew by only 0.3 mb/d, compared to an increase of almost 3.0 mb/d in the same period last year. For product stocks, the main driver for the persistent build has been higher middle distillates production, amid reduced demand for this product. Oil inventories in the non-OECD have seen a reduced build this year. China’s inventories have only increased by 60 mb since the beginning of this year, compared with more than 90 mb last year. This could be explained by the fact that the country has approached its goal to fill the second phase of its SPR by the end of this year more rapidly than expected and as a result has begun to slow purchases. The recent increase in oil prices, up from the low levels seen at the start of this year, may also have discouraged China from importing more crude for storage. The slowing build in global oil inventories is furthermore confirmed by the difference between global oil supply and total world oil demand – the “implied stock change”. Over the first three quarters of 2016, the implied stock change averaged 1.1 mb/d, compared with almost double this amount last year during the same period (Graph 2). Looking ahead, it is important to consider the immediate impact that the assumed global supply/demand balance has on inventories, given the expected demand for OPEC crude in 2017 of 32.7 mb/d. Adjustments in both OPEC and non-OPEC supply will accelerate the drawdown of the existing substantial overhang in global oil stocks and help bring forward the rebalancing of the market.
OPEC Monthly Oil Market Report – November 2016
3
4
OPEC Monthly Oil Market Report – November 2016
Crude Oil Price Movements
Crude Oil Price Movements The OPEC Reference Basket (ORB) improved substantially in October, rising by almost 12% to $47.87/b, its highest monthly average in 15 months. Alongside the oil complex, the ORB rose compared to the previous month after an OPEC agreement was reached in Algiers that seeks to bring forward market balance. However, year-to-date (y-t-d), the ORB value was about 24% lower at $39.45/b. Crude oil futures prices also increased, trading at a 12-month-high, as the market reacted to the Algiers Accord. Declining inventory levels also supported the market. Nevertheless, prices came under pressure from a double-digit rise in the US oil rig count and a strengthening of the US dollar. Prices have also stalled as investors have taken profits and await more news on fundamental supply and demand. ICE Brent ended up $4.15 to average $51.39/b in October, but was around 21% lower y-t-d. NYMEX WTI surged $4.71 to average $49.94/b last month, but was down about 16% y-t-d. The ICE Brent/NYMEX WTI spread narrowed further to $1.45/b, encouraging a surge in US crude imports of Brent-related grades. US data for the last week in October showed a significant increase in imports by 2 mb/d.
OPEC Reference Basket The ORB value improved by almost 12% in October, to its highest monthly average since July 2015. It rallied alongside the oil complex starting at the end of the previous month after an OPEC accord was reached in Algiers to support market rebalancing. The ORB value rose to its highest level so far in 2016, before softening toward the end of the month. Consecutive weeks of counter-seasonal declines in US crude oil stocks and hurricanerelated logistical disruptions for US Gulf Coast (USGC) oil facilities – which affected imports – also supported oil prices in October. Healthy northeast Asian oil demand in anticipation of the winter season and firm refining margins helped to elevate Middle East crude benchmark values, which aided the notable increase in the ORB price. Crude demand for Asia also picked up as China ramped up imports. Graph 1.1: Crude oil price movement
OPEC Basket
WTI
Nov 16
Oct 16
Sep 16
Aug 16
20
Jul 16
20
Jun 16
30
May 16
30
Apr 16
40
Mar 16
40
Feb 16
50
Jan 16
50
Dec 15
60
Nov 15
US$/b
60
Oct 15
US$/b
Brent Dated
Sources: Argus Media, OPEC Secretariat and Platts.
OPEC Monthly Oil Market Report – November 2016
5
Crude Oil Price Movements Table 1.1: OPEC Reference Basket and selected crudes, US$/b Sep 16 42.89 42.70 41.88 47.77 45.69 46.66 41.39 41.22 43.51 37.38 40.28 46.42 41.22 45.51 47.09
Oct 16 47.87 48.26 46.79 50.83 48.74 49.37 47.30 47.04 48.13 42.36 45.20 51.19 45.98 48.15 49.79
Change Oct/Sep 4.98 5.56 4.91 3.06 3.05 2.71 5.91 5.82 4.62 4.98 4.92 4.77 4.76 2.64 2.70
% 11.6 13.0 11.7 6.4 6.7 5.8 14.3 14.1 10.6 13.3 12.2 10.3 11.5 5.8 5.7
Year-to-date 2015 2016 51.99 39.45 52.41 39.66 50.38 38.18 55.26 42.94 53.62 41.67 55.31 42.52 38.12 51.51 37.89 50.79 53.27 40.11 32.32 43.72 51.59 40.31 56.14 43.61 47.08 37.12 55.27 41.64 54.98 43.27
Other Crudes Brent Dubai Isthmus LLS Mars Urals WTI
46.69 43.67 44.55 46.79 42.33 44.48 45.16
49.74 48.94 49.91 51.35 46.79 48.24 49.89
3.05 5.27 5.36 4.56 4.46 3.76 4.73
6.5 12.1 12.0 9.7 10.5 8.5 10.5
54.66 53.50 53.28 54.49 50.36 54.30 50.49
42.67 40.09 40.93 43.94 38.99 41.01 42.18
Differentials Brent/WTI Brent/LLS Brent/Dubai
1.53 -0.10 3.02
-0.15 -1.61 0.80
-1.68 -1.51 -2.22
-
4.17 0.17 1.16
0.49 -1.26 2.58
Basket Arab Light Basrah Light Bonny Light Es Sider Girassol Iran Heavy Kuwait Export Qatar Marine Merey Minas Murban Oriente Rabi Light Sahara Blend
Sources: Argus Media, Direct Communication, OPEC Secretariat and Platts.
On a monthly basis, the ORB value surged $4.98, or 11.6%, to average $47.87/b. Compared to the previous year, the ORB value was lower by $12.54, or 24%, to average $39.45/b. All ORB component values improved over the month, but at much varying levels, with each echoing its relevant benchmark. The 5-14% increase is an unusually wide range. Middle East crude benchmarks witnessed a notable uplift in value amid firm demand, while the North Sea benchmark saw a lower increase due to oversupply. The US benchmark was supported by notable US stocks draws. The major crude oil benchmarks – namely Dated Brent, WTI and Dubai spot prices – all improved in October by $3.05, $4.73 and $5.27, respectively. The healthy crude oil demand in the Asian market – which was reflected in the flattening of the Dubai contango structure – lent support to the Middle Eastern spot components as well as multi-destination grades. Arab Light, Basrah Light, Iran Heavy and Kuwait Export, which are sold to multiple regions and priced on a weighted average basis linked to sales destinations, increased $5.55 on average, or a hefty 13.3%, to $47.35/b for the month. Similarly, the Middle Eastern spot components, Murban and Qatar Marine, saw their value improve, on average, by $4.70, or 10.4%, to $49.66/b. The increase in their pricing formula (OSPF) offsets for October loading also helped. Firm refining margins and northeastern Asian winter demand supported December-loading Mideast Gulf crudes prices. Qatari medium sour firmed to a premium to Dubai for the first time in four months. Tighter sour crude supply in the Mediterranean region has supported medium sour Mideast Gulf crudes delivered to Europe.
6
OPEC Monthly Oil Market Report – November 2016
Crude Oil Price Movements Latin American ORB components were up the most in October thanks to a bullish US market due to lower crude inventories and some logistical constraints. Latin American sour grades were also supported by lower supply of Colombian heavy sour Vasconia as the force majeure at the Cano Limon-Convenas pipeline continued. Venezuela’s Merey and Ecuador’s Oriente increased by $4.98, or 13.3%, and $4.76, or 11.5%, respectively, to average $42.36/b and $45.98/b. The light sweet crudes from Africa saw the least improvement. This was mainly attributed to the less strong performance of the Dated Brent market given the continued regional and local oversupply in the North Sea physical market. The reduced OSPF offsets for the month of October also negatively affected these grades. This was despite healthy demand for West African barrels to Asia, particularly to China and India. The narrow Brent-Dubai spread over the month also opened arbitrage opportunities to the Asian Pacific region. The value of West and Northern African light sweet Basket components – Saharan Blend, Es Sider, Girassol, Bonny Light and Gabon’s Rabi – edged up $2.83 or 6.1%, on average, to $49.38/b. Indonesian Minas was up significantly amid good demand for Asia-Pacific light sweet crudes due to healthy gasoline and naphtha margins. The grade was 12.2%, or $4.92, higher for the month at $45.20/b. On 10 November, the ORB stood at $42.67/b.
The oil futures market Crude oil futures surged, trading at a 12-month-high, as the market reacted to the Algiers Accord. Crude futures returned above $50/b for the first time since late June, before dipping late in the month. ICE Brent and NYMEX WTI crude oil futures were up significantly in October for the second month in a row. Crude oil prices were also lifted in part by declining US inventory levels. In the week to 21 October, crude stocks fell by 553,000 b to 468.2 mb. This was the lowest since 22 January this year. Crude oil stocks have dropped by 27.1 mb in the last eight weeks at a time when crude inventories typically build as refineries go into maintenance, producing less gasoline and other refined products. Nevertheless, toward the end of the month, prices came under pressure from a doubledigit rise in the US oil rig count and a strengthening US dollar, after the European Central Bank kept interest rates unchanged and US data showed home resales surged in September. Prices dipped below $50/b, as investors took profits and awaited more news on fundamental supply and demand. The restart of Britain's Buzzard oilfield also weighed on prices. Buzzard, the North Sea field that contributes to the Forties crude stream and which pumps about 180 tb/d, restarted late in the month, from a month-long planned maintenance. Significant increases in speculator short positions at the end of the month also weighed on the oil market. ICE Brent ended October up $4.15, or 8.8%, at $51.39/b on a monthly average basis, while NYMEX WTI increased $4.71, or 10.4%, to $49.94/b. Year-to-date, ICE Brent was down $11.87, or around 21%, at $43.98/b, while NYMEX WTI declined by $8.15, or 16%, to $42.37/b. On 10 November, ICE Brent stood at $45.84/b and NYMEX WTI at $44.66/b.
OPEC Monthly Oil Market Report – November 2016
7
Crude Oil Price Movements Table 1.2: Crude oil futures, US$/b
NYMEX WTI ICE Brent Transatlantic spread
Sep 16 45.23 47.24
Oct 16 49.94 51.39
2.01
1.45
Change Oct/Sep % 10.41 4.71 4.15 8.78 -0.56
Year-to-date 2015 2016 50.49 42.37 55.85 43.98
-1.63
5.36
1.61
Sources: CME Group, Intercontinental Exchange and OPEC Secretariat.
As speculators bet on price declines, commitment of traders’ data showed that money managers boosted short positions in crude futures contracts in the last week of October. There was an increase of more than 6% in short positions in two weeks for WTI and a bump of more than 10,000 short positions for ICE crude. As a result, shorts have increased by about 25% on the Brent side during that period, putting pressure on oil prices in late October. This was the first increase in money manager short positions since the week ending 20 September. M-o-m, however, net length positions in both exchanges increased significantly on speculation that oil prices will rise when OPEC implements its planned production cut to bring forward market rebalancing. Money managers’ net length in NYMEX WTI crude jumped 86,737 contracts, or by a hefty 48%, to 268,189 contracts in the period by end October, compared to the same period in the previous month when OPEC held its meeting. During the same period, ICE Brent speculators increased net long positions in ICE Brent futures and options by 86,532 contracts, or 30%, to 376,710 lots. Total futures and options open interest volume in the two exchanges was 3% higher on the month, an increase of 175,155 contracts, rising to 5.55 million contracts. Graph 1.3: ICE Brent price vs. speculative activity
'000 Contracts
US$/b 60
450 400 350 300 250 200 150 100 50 0
50 40 30
Oct 15 Nov 15 Dec 15 Jan 16 Feb 16 Mar 16 Apr 16 May 16 Jun 16 Jul 16 Aug 16 Sep 16 Oct 16
20
Managed money net long positions (RHS) NYMEX WTI (LHS) Sources: CFTC and CME Group.
US$/b
'000 Contracts 450 400 350 300 250 200 150 100 50 0
60 50 40 30 20
Oct 15 Nov 15 Dec 15 Jan 16 Feb 16 Mar 16 Apr 16 May 16 Jun 16 Jul 16 Aug 16 Sep 16 Oct 16
Graph 1.2: NYMEX WTI price vs. speculative activity
Managed money net long positions (RHS) ICE Brent (LHS) Source: IntercontinentalExchange.
During October, the daily average traded volume for NYMEX WTI contracts dropped 62,458 lots, down 5.4% to 1,096,161 contracts, while that of ICE Brent was 38,652 contracts, or 4.8% lower, at 765,073 lots. The daily aggregate traded volume for both crude oil futures markets decreased 101,110 contracts to 1.86 million (mn) futures contracts, slightly less than 2 billion b/d of crude oil. The total traded volume in both exchanges was lower in October, with NYMEX WTI at 23.02 mn lots, down from 24.33 mn contracts the month before, and ICE Brent at 16.07 mn lots, down from 17.68 mn contracts in September.
8
OPEC Monthly Oil Market Report – November 2016
Crude Oil Price Movements
The futures market structure Healthy physical Asian demand flattened the Dubai market’s contango structure, while light-sweet eastern Atlantic basin oversupply widened the Bent contango almost twofold. Consecutive weeks of draws narrowed the WTI contango slightly. The Dubai contango flipped into a slight backwardation on a monthly basis, as the improvement in Asian physical crude oil demand intensified in October. Growing demand was due to improving refining margins, steady Chinese buying interest, as well as stockpiling for winter heating demand, particularly in the northern Asia Pacific region – Japan and Korea. The Dubai M1-M3 discount of 60¢/b flipped into a premium of 2¢/b. Furthermore, medium and heavy sour grades are in backwardation across key trading centres. Nearly 50% of the declines in non-OPEC supply over the past year have come from medium and heavy grades. Sharply dropping Latin America production has reduced the import of medium sour and heavy crudes into the US, while sharp declines in China’s domestic production – the bulk of which is medium sour – has meant China’s sour crude imports have surged this year. North Sea Brent came under pressure as the Northwest Europe and Mediterranean markets were oversupplied. Increased output from Russia and Kazakhstan’s massive Kashagan oilfield in the Caspian Sea, as well as returning Nigerian and Libyan output, left the region amply supplied. North Sea production also returned from summer maintenance. At the same time, refineries that process oil were undergoing seasonal work, eroding their demand. A further complication was that freight costs had risen from summer lows, hampering long-haul shipping and preventing traders from selling the European surplus into Asian markets or putting it into floating storage. This resulted in a widening in the Brent contango further where the M1-M3 discount moved out to almost $1.50/b on average in October, from 90¢/b in September. In the US, the WTI contango eased slightly over the month, supported by a considerable drawdown in US crude inventories at a time when the market expected a build in inventories due seasonal refinery maintenance. The WTI contango (M1-M3) dropped 12¢ to $1.04/b. Graph 1.4: NYMEX WTI and ICE Brent forward curves US$/b 56
US$/b 56
54
54
52
52
50
50
48
48
46
46
44 1FM
2FM
3FM
4FM
5FM
6FM
ICE Brent: 26 Sep 16 NYMEX WTI: 26 Sep 16
7FM
8FM
9FM
10FM
11FM
44 12FM
ICE Brent: 26 Oct 16 NYMEX WTI: 26 Oct 16
Note: FM = future month. Sources: CME Group and Intercontinental Exchange.
OPEC Monthly Oil Market Report – November 2016
9
Crude Oil Price Movements The ICE Brent-NYMEX WTI spread narrowed further in October, encouraging a surge in US crude imports of West African crudes and other Brent-related grades. EIA data for the last week in October showed a significant increase in US imports – reaching 2 mb/d – considering the relatively tight $1-$2/b Brent-WTI spread. The relative weakness in ICE Brent continued as a result of the return of oversupply in Europe that started in the second half of the previous month, as Libya and Nigeria partially resumed supply of light sweet crudes. The unsold cargoes in northern Europe also added pressure. The return of supply from the Buzzard oilfield from maintenance compounded the North Sea oversupply dilemma. On the other hand, NYMEX WTI continued to be supported by several weeks of crude oil stock draws and pipeline issues in the US. The prompt-month ICE Brent-NYMEX WTI spread narrowed to $1.45/b in October, from $2.01/b the month before. Table 1.3: NYMEX WTI and ICE Brent forward curves, US$/b NYMEX WTI 26 Sep 16 26 Oct 16 Change
1FM 45.93 49.18 3.25
2FM 46.49 49.83 3.34
3FM 47.08 50.45 3.37
6FM 48.68 51.89 3.21
12FM 50.36 53.13 2.77
12FM-1FM 4.43 3.95 -0.48
26 Sep 16 26 Oct 16 Change
1FM 47.35 49.98 2.63
2FM 47.93 51.04 3.11
3FM 48.45 51.75 3.30
6FM 49.93 53.34 3.41
12FM 51.75 54.86 3.11
12FM-1FM 4.40 4.88 0.48
ICE Brent
Note: FM = future month. Sources: CME Group and Intercontinental Exchange.
The light sweet/medium sour crude spread Apart from the US Gulf coast (USGC), where the sweet/sour differentials remain flat, the spread narrowed significantly in October, amid robust sour crude demand and significant oversupply of light sweet grades, particularly in the Atlantic Basin. In Europe, Urals medium sour crude managed to reduce its discount to light sweet North Sea Brent by more than 30% from the previous month, where it reached its highest value in more than two years. The Dated Brent-Med Urals spread narrowed to $1.50/b in October from $2.20/b in September. Sour crude supply in the Mediterranean region has been relatively tight, driving up the price of Russian Urals. Further support has come from firmer European fuel oil margins, which have been bolstered by exports from Northwest Europe and the Mediterranean to Asia-Pacific, despite higher freight rates for very large crude carriers (VLCC). In contrast, North Sea Brent has been pressured by increasing supply of regional light sweet crudes from Nigeria, Libya and Kazakhstan. The return from maintenance of the Buzzard field also added to North Sea crude supplies, as did the 6 mb of North Sea crude that was still waiting for buyers.
10
OPEC Monthly Oil Market Report – November 2016
Crude Oil Price Movements Graph 1.5: Brent dated vs. sour grades (Urals and Dubai) spread US$/b
US$/b
Dubai
Nov 16
-4
Oct 16
-4
Sep 16
-2
Aug 16
-2
Jul 16
0
Jun 16
0
May 16
2
Apr 16
2
Mar 16
4
Feb 16
4
Jan 16
6
Dec 15
6
Nov 15
8
Oct 15
8
Urals
Sources: Argus Media, OPEC Secretariat and Platts.
In Asia, the healthy demand for Mideast Gulf sour crudes to meet peak winter consumption in northern Asia helped cut the Tapis premium over Dubai in half in October. The Tapis-Dubai spread narrowed by $2.23, or 45%, on a monthly basis to $2.95/b. Mounting demand was due to improving refining margins, steady Chinese buying interest, as well as stockpiling for winter heating demand, particularly in the northern Asia Pacific – Japan and Korea. Nevertheless, Asian Pacific light crudes found support from healthy regional gasoline and naphtha margins, but ample arbitrage supply amid a significantly narrower Brent-Dubai spread and the return of African crude production stalled their performance. The Dated Brent-Dubai spread narrowed to 80¢/b – the narrowest this year – from $3.02/b in the previous month. In the USGC, the Light Louisiana Sweet (LLS) premium over medium sour Mars was almost unchanged in October at $4.55/b, up 10¢. USGC sour crudes firmed after Hurricane Matthew pushed a key Bahamas storage hub offline and imports to the USGC tightened. Mars was further supported after completion of works to Shell’s key US Gulf Amberjack pipeline system and as refineries emerged from maintenance.
OPEC Monthly Oil Market Report – November 2016
11
Commodity Markets
Commodity Markets Energy commodity prices advanced on average, led by increasing crude oil prices on expectations for market rebalancing, along with soaring coal prices due to mining limitations in China. Meanwhile, in the group of non-energy commodities, agricultural prices were weighed down by drops in palm oil and rice prices, while, conversely, base metals were supported by continuing expansion in Chinese industrial production and higher energy costs. Gold prices declined on increasing expectations of a rate hike in December by the US Federal Reserve.
Trends in selected commodity markets Commodity market sentiment was supported by a rally in oil prices during the month, following OPEC’s decision in Algiers to bring forward market rebalancing, along with a jump in coal prices for the second consecutive month, with gains feeding into energyintensive commodities, such as aluminium. Metals were also supported by continuing improvements in global manufacturing conditions, with JP Morgan manufacturing PMI improving to 52.0 in October from 51.0 in the previous month. Meanwhile, gold prices declined strongly, due to firming expectations by market participants on possible interest rate increases by the US Federal Reserve at its December meeting. Agricultural commodity prices showed mixed developments during the month. The US Department of Agriculture (USDA) made minor downward revisions to its end-ofseason world stock forecast for the 2016/2017 marketing year for wheat and corn, which supported prices for these commodities. On the other hand, soybean stocks were forecast to increase in the next year as Brazilian output recovers from El Niñoinduced drought, which reduced output this year and triggered a surge in US soybean exports. USDA rice stock estimations increased strongly, partly on higher expected output from Thailand and lower consumption, which pushed its prices down. Palm oil prices were under pressure due to an increase in stocks in Malaysia at the end of September, due to a drop in exports. Sugar prices increased mainly due to reports of lower output from the main producing region in Brazil during the second half of September and the first half of October. Metal prices generally increased, supported by continuing expansion in China’s housing market. Prices of newly-constructed residential buildings increased in 63 of the 70 largest cities in September, according to the National Bureau of Statistics. Further support was provided by a rally in both thermal and coking coal prices, which fed into the cost structure of the metallurgical industry. Moreover, improving manufacturing activity across the world, and particularly in China, as shown by the country’s manufacturing PMI of 51.2 for October versus 50.1 in the previous month, have also supported prices. However, commodity market regulators in China recently expressed their concerns about price spikes in commodity futures markets and higher margins have been established for futures trading. Meanwhile, crude steel output increased by 2.0% y-o-y worldwide in September, mainly following a 3.9% y-o-y increase in Chinese output, according to the World Steel Association. This has been supportive for iron ore prices. Energy prices advanced, led by a rally in crude oil prices following the Algiers Accord. Meanwhile, coal prices jumped on the impact of mining restrictions implemented by the government of China, which include limited working days during the year. These restrictions have translated into a reduction in coal output in China by 10.5% in the first
12
OPEC Monthly Oil Market Report – November 2016
Commodity Markets nine months of the year. Natural gas declined slightly in the US as temperatures were warmer than expected. According to US Energy Information Administration (EIA) data, the inventory overhang has been reduced to around 5% above the five-year average from 52% at the end of March, though still close to a record. Meanwhile, in Europe both hub-based and term-contract prices advanced during the month. Table 2.1: Commodity price data Monthly averages Commodity
Unit
% Change
Year-to-date
Sep 16
Oct 16
Oct/Sep
2015
2016
57.6 67.4 44.9 2.8 81.6 90.9 94.5 403.0
58.1 72.9 45.0 3.0 81.0 90.5 93.6 372.0
63.7 93.2 49.3 2.9 80.8 89.5 92.8 367.5
9.5 27.8 9.5 -0.7 -0.3 -1.1 -0.9 -1.2
67.6 58.5 52.9 2.7 83.6 90.0 91.8 404.3
53.2 60.4 41.6 2.4 79.7 89.0 92.1 382.4
814.0 413.0 78.7 150.2 149.2 0.4 68.9 1,639.3 4,751.7 61.0 1,835.5 10,336.0 18,427.0 2,279.1 105.8 1,340.2 19.6
829.0 405.0 76.5 148.4 150.8 0.5 68.2 1,592.4 4,722.2 58.0 1,947.6 10,191.8 19,499.5 2,292.3 104.6 1,326.6 19.4
853.0 403.5 76.5 152.3 151.8 0.5 69.5 1,662.5 4,725.8 59.0 2,023.3 10,250.9 20,060.5 2,304.4 99.0 1,266.3 17.6
2.9 -0.4 -0.1 2.6 0.7 3.5 1.9 4.4 0.1 1.7 3.9 0.6 2.9 0.5 -5.4 -4.5 -8.8
759.6 394.5 89.8 170.7 208.7 0.3 75.6 1,701.1 5,668.7 58.2 1,812.9 12,440.0 16,336.3 2,006.9 92.0 1,176.6 16.0
791.5 403.7 83.2 160.6 170.7 0.4 66.5 1,578.2 4,729.8 54.8 1,800.8 9,303.2 17,283.5 1,984.2 98.2 1,259.2 17.2
Aug 16 World Bank commodity price indices (2010 = 100)
Energy Coal, Australia Crude oil, average Natural gas, US Non-energy Agriculture Food Soybean meal Soybean oil Soybeans Grains Maize Wheat, US, HRW Sugar, world Base Metal Aluminum Copper Iron ore, cfr spot Lead Nickel Tin Zinc Precious Metals Gold Silver
US$/mt US$/b US$/mbtu
US$/mt US$/mt US$/mt US$/mt US$/mt US$/kg US$/mt US$/mt US$/dmtu US$/mt US$/mt US$/mt US$/mt US$/toz US$/toz
Source: World Bank, Commodity price data.
Average energy prices in October increased by 9.5% m-o-m, led by a 9.5% increase in average crude oil prices and a 27.8% rise in benchmark thermal coal prices. Natural gas prices decreased in the US by 0.7% m-o-m, while average prices in Europe increased by 1.9%. Agricultural prices decreased by 1.1%, with a 0.9% decline in average food prices and a 2.1% decline in raw material prices, as well as a 0.4% beverage price decline. Palm oil and Thai benchmark rice prices led to decreases in food prices, with the two products down by 5.8% and 3.9%, respectively. Average base metal prices increased by 1.9%, mainly due to a 4.4% decrease in aluminum. Average iron ore prices were up by 1.7%. In the group of precious metals, gold prices declined by 4.5% as expectations for higher interest rates in the US firmed, while silver prices declined by 8.8%.
OPEC Monthly Oil Market Report – November 2016
13
Commodity Markets Graph 2.1: Major commodity price indices Index 120
Index 120
100
100
80
80
60
60
40
40 Base year 2010 = 100
Energy
Non-energy
Agriculture
Base metals
HH natural gas
Gold
Oct 16
Sep 16
Jul 16
Aug 16
Jun 16
May 16
Apr 16
Mar 16
Feb 16
Jan 16
Dec 15
Oct 15
Nov 15
Sep 15
Aug 15
Jul 15
Jun 15
May 15
Apr 15
Mar 15
Jan 15
Feb 15
Dec 14
Nov 14
20
Oct 14
20
Food
Source: World Bank, Commodity price data.
In October, the Henry Hub natural gas index declined slightly. The average price was down 2¢ or 0.7% to $2.95 per million British thermal units (mmbtu) after trading at an average of $2.97/mmbtu the previous month. The US Energy Information Administration (EIA) said utilities added 54 billion cubic feet (bcf) of gas to storage during the week ending 28 October. This was above median analysts’ expectations of an increase of around 56 bcf. Total working gas in storage stood at 3,963 bcf, or 1.2%, higher than that at the same time the previous year and 4.6% higher than the previous five-year average. The EIA noted that temperatures during the reported week averaged higher than normal throughout the Lower 48 States. Graph 2.2: Inventories at the LME '000 Tonnes
'000 Tonnes
600
3,500
500
3,000 2,500
400
2,000
300
1,500
200
1,000
100
500 0
Copper
Lead
Nickel
Tin
Zinc
Oct 16
Sep 16
Aug 16
Jul 16
Jun 16
May 16
Apr 16
Mar 16
Feb 16
Jan 16
Dec 15
Nov 15
Oct 15
0
Pr. Aluminium (RHS)
Sources: London Metal Exchange and Thomson Reuters.
14
OPEC Monthly Oil Market Report – November 2016
Commodity Markets
Investment flows into commodities Open interest volume (OIV) increased in October for selected US commodity markets such as crude oil, natural gas, copper, livestock and agriculture, while decreasing for precious metals. Meanwhile, in monthly terms, speculative net length positions increased for crude oil, natural gas, agriculture, copper and livestock, while declining for precious metals. Table 2.2: CFTC data on non-commercial positions, ‘000 contracts Net length
Open interest Sep 16
Oct 16
Sep 16
% OIV
Oct 16
% OIV
Crude oil Natural gas Agriculture Precious metals Copper Livestock
1,834 1,059 4,914 774 194 524
1,846 1,142 5,054 705 197 543
151 81 261 320 -24 48
8 8 5 41 -12 9
247 126 344 203 -3 48
13 11 7 29 -1 9
Total
9,299
9,488
837
60
965
68
Source: US Commodity Futures Trading Commission.
Agriculture’s OIV increased by 2.9% to 5,054,325 contracts in October. Meanwhile, money managers increased net long positions by 31.8% to 343,938 lots, largely because of increasing net length in corn. Henry Hub’s natural gas OIV increased by 7.8% m-o-m to 1,141,618 contracts in October. Money managers increased net length by 55.6% to 125,896 lots on a continuing decline in the inventory overhang. Graph 2.3: Speculative activity in key commodities, net length '000 contracts 800
'000 contracts 800 600
600
400
400
200
200 0
0
Agriculture
Gold
WTI
Natural gas
Livestocks
Oct 16
Sep 16
Aug 16
Jul 16
Jun 16
May 16
Apr 16
Mar 16
Feb 16
Jan 16
-400
Dec 15
-400
Nov 15
-200
Oct 15
-200
Copper
Source: US Commodity Futures Trading Commission.
Copper’s OIV increased by 1.4% m-o-m to 197,230 contracts in October. Money managers’ short positions decreased to 2,639 as copper inventories in the LME system declined for the first month since May. Precious metals’ OIV decreased by 8.9% m-o-m to 705,397 contracts in October. Money managers decreased net long positions by 36.4% to 203,323 lots.
OPEC Monthly Oil Market Report – November 2016
15
Commodity Markets Graph 2.4: Speculative activity in key commodities, as percentage of open interest
Agriculture
Gold
WTI
Livestocks
Copper
Oct 16
Sep 16
Aug 16
Jul 16
Jun 16
May 16
Apr 16
Mar 16
Feb 16
Jan 16
Dec 15
Nov 15
% 70 60 50 40 30 20 10 0 -10 -20 -30
Oct 15
% 70 60 50 40 30 20 10 0 -10 -20 -30
Natural gas
Source: US Commodity Futures Trading Commission.
16
OPEC Monthly Oil Market Report – November 2016
World Economy
World Economy Global growth remains unchanged for 2016 at 2.9% and 3.1% in 2017. While OECD growth remains at 1.6% for 2016 and 1.7% for 2017, Euro-zone and UK figures have been revised up from 1.5% to 1.6% and 1.6% to 1.8%, respectively, in 2016 and from 1.2% to 1.3% and 0.7% to 0.8%, respectively, in 2017. The US GDP growth forecast remains unchanged at 1.5% for 2016 and 2.1% for 2017, but given that the economic agenda of the incoming US administration needs still to be specified, uncertainties to both the upside and the downside exist. Also, Japan’s GDP growth forecast remains unchanged at 0.7% for 2016 and 0.9% for 2017. The forecast for major emerging economies also remains at the same level as in the previous month, with the exception of Russia, which was revised up to a GDP growth forecast of 0.8% in 2017, and China, for both this year and the next. China experienced three solid quarters of 6.7% growth, leading to a 2016 GDP growth forecast of the same level. Consequently, the 2017 GDP growth forecast was also revised up to 6.2% from 6.1%. Numerous uncertainties for global economic growth throughout the remainder of the year and for 2017 remain. Among these uncertainties, policy issues across the globe bear considerable weight, as do monetary policy decisions, which remain important in the near term. It is expected that the US Federal Reserve (Fed) will raise interest rates in December, while the European Central Bank (ECB), the Bank of Japan (BoJ), the Bank of England (BoE), and the People’s Bank of China (PBoC) will maintain relatively more accommodative stances. Table 3.1: Economic growth rate and revision, 2016-2017, % World
OECD
US
Japan Euro-zone
China
India
Brazil
Russia
2016*
2.9
1.6
1.5
0.7
1.6
6.7
7.5
-3.4
-0.6
Change from previous month
0.0
0.0
0.0
0.0
0.1
0.2
0.0
0.0
0.0
2017*
3.1
1.7
2.1
0.9
1.3
6.2
7.2
0.4
0.8
Change from previous month
0.0
0.0
0.0
0.0
0.1
0.1
0.0
0.0
0.1
Note: * 2016 = Estimate and 2017 = Forecast. Source: OPEC Secretariat.
OECD OECD Americas US As expected, 3Q16 GDP growth was strong at 2.9% q-o-q on a seasonally-adjusted annualized rate (SAAR), following weak 1H16 growth of only 1.1%. The most important supportive factors were private investment and ongoing solid private household consumption, which rose by 2.1% SAAR, albeit coming from a higher level of 4.3% q-o-q SAAR in 2Q16. It is forecast that support from private household consumption will continue, reinforced by an improving situation in the labour market. The energy sector’s capex cuts continued, as investments into mining shaft and wells declined by more
OPEC Monthly Oil Market Report – November 2016
17
World Economy than 30%, despite some rebalancing in the oil market during 3Q16. It remains to be seen whether the considerably negative effects from reduced investment will continue. While subdued development in the US economy in 1H16 has kept the Fed from further raising interest rates, it now seems more likely that a rate hike may materialise in December. The Fed indicated it will do so when appropriate and with ongoing improvements in the labour market and a stronger GDP, as well as a more resilient situation in the major emerging economies, the current situation would offer such a window of opportunity. Also, the guiding inflation trend has moved in the right direction. It is obvious that this will constitute a very important area to monitor as it would have an impact on exchange rates, foreign investment, particularly in emerging economies, and might also impact the oil market in various dimensions. After some improvement in the US economy materialised in 3Q16, labour market conditions also improved in the latest October readings. The unemployment rate fell back to 4.9% in September, while non-farm payroll additions rose by 161,000, which was slightly below the September level of an upwardly revised 191,000. Average hourly earnings improved again, rising by 2.8% y-o-y. The labour force participation rate remained at about the previous month’s level of 62.8% in October, after reaching 62.9% in September. Total industrial production is still weak and remains significantly impacted by challenges in the energy sector. It declined by 1.0% y-o-y in September, after contracting 1.1% y-o-y in August. Mining, including oil sector-related output, fell considerably again, dropping by 9.5% in September. However, some improvements are filtering through in manufacturing orders, which rose by 0.6% y-o-y in September, the first monthly rise in almost two years. Nevertheless, the trend in orders’ growth from the energy sector remained significantly negative at 25.0% in September, but this is considerably better than in the previous months. With improving oil markets, this may slowly recover. Positive momentum in private household consumption from recent GDP numbers was visible in the latest retail sales levels, albeit the growth trend is somewhat slowing. Retail sales growth in 3Q16 stood at 2.4% y-o-y, marginally lower than in 2Q16, when retail sales stood at 2.6% y-o-y. This slightly weakening trend is also visible in the Conference Board’s Consumer Confidence Index, which fell to 98.6 from 103.5 in September. Graph 3.1: Manufacturing and non-manufacturing ISM indices Index 60
55
54.8 51.9
50
ISM manufacturing index
Oct 16
Sep 16
Aug 16
Jul 16
Jun 16
May 16
Apr 16
Mar 16
Feb 16
Jan 16
Dec 15
Nov 15
Oct 15
45
ISM non-manufacturing index
Sources: Institute for Supply Management and Haver Analytics.
18
OPEC Monthly Oil Market Report – November 2016
World Economy July’s Purchasing Manager’s Index (PMI) for the manufacturing sector, as provided by the Institute of Supply Management (ISM), indicated some improvements in the underlying economy as the manufacturing PMI moved higher to reach 51.9 in October, after hitting 51.5 in September and stood at 49.4 in August. The very important services sector index fell slightly, but remained at a solid level of 54.8, from 57.1 in September. The high September level was the best reading since October 2015. Given that the better 2H16 performance had already been anticipated, the 2016 growth forecast remains at 1.5%. More data over the coming months will provide further insight to allow a more detailed review of the US economic situation, particularly after the most recent elections. The 2017 growth forecast of 2.1% also remains unchanged.
Canada Some weakness remains in the Canadian economy. The situation in the oil market also led once again to muted industrial production growth, which rose by only 0.5% y-o-y in August, but was better than the level recorded in July of 0.4% y-o-y. Output from the mining, oil and gas sectors was soft again, also showing a slowing trend at a decline rate of 1.0% y-o-y in August, after reaching -0.9% y-o-y in July. The PMI for manufacturing remained low, but indicated further expansion in the sector as it stood at 51.1 in October, after reaching 50.3 in September. Considering the ongoing weakness in the Canadian economy, the GDP growth forecast was revised down to 1.2% for 2016 from 1.3% the previous month. The 2017 forecast remains unchanged at 1.7%.
OECD Asia Pacific Japan The Japanese economy has recently started to improve, as government actions have supported growth momentum. Industrial production rose for two consecutive months, and the export decline decelerated. Thus, while slightly improving, the economy remains challenged by a variety of factors, mainly a decline in exports and weak domestic demand. Further development of the Japanese yen will certainly need close monitoring after a sharp intraday rise, following the release of the results of the US presidential election. A rise in the yen, due to its status as a save-haven currency, could considerably derail efforts for a further recovery in the economy, as it would negatively impact exports. Moreover, domestic demand remains weak and the deflationary trend is not abating, despite efforts by the Bank of Japan (BoJ). Inflation remained in negative territory, while the BoJ is still trying – according to its official target − to achieve an inflation rate of 2%. However, after having turned slightly positive in February, inflation has been declining ever since and fell by 0.5% y-o-y again in August, the third consecutive month at this significant level, representing the highest decline in more than three years. When excluding the two volatile groups of energy and food, the country’s core inflation figure stood at only 0.1% in August, the lowest level in about three years. Real income continued to rise, but pay increases were at relatively low levels over the past two months, gaining 0.4% y-o-y in September, after reaching 0.5% y-o-y in August. The unemployment rate remained ultra-low in an extremely tight labour market. In September, it stood at only 3.0%, even marginally lower than the 3.1% seen in August.
OPEC Monthly Oil Market Report – November 2016
19
World Economy Japanese exports continued their declining trend of 11 consecutive months. In September, exports fell again, down by 6.9% y-o-y, but better than the August number of -9.6% y-o-y. This translated into a slight monthly rise of 0.4% y-o-y. Industrial production rose for the second month in a row, up by 0.8% y-o-y in September, after hitting 1.1% y-o-y in August. This comes after 13 months of declines. However, a negative trend in manufacturing orders points to no material improvement in production, so this recovery might turn out to be temporary. Manufacturing orders dropped by 9.3% y-o-y in August, after seeing a decline of 4.0% y-o-y in July. The challenging environment has also been reflected in domestic demand. Retail trade remained negative and declined again by 1.2% y-o-y in September, after seeing a decline in August of 2.1% y-o-y. Graph 3.2: Japanese retail trade
Graph 3.3: Japanese PMI indices
% change y-o-y
Index
3
54
2
53 52
1
51
Manufacturing PMI Services PMI
0
50.5
50 -1
51.4
49
Sep 16
Jul 16
Aug 16
Jun 16
Apr 16
May 16
Mar 16
Feb 16
Jan 16
Dec 15
Nov 15
Oct 15
Sep 15
-3
Sources: Ministry of Economy, Trade and Industry and Haver Analytics.
48 47
Oct 15 Nov 15 Dec 15 Jan 16 Feb 16 Mar 16 Apr 16 May 16 Jun 16 Jul 16 Aug 16 Sep 16 Oct 16
-1.9
-2
Sources: IHS Markit, Nikkei and Haver Analytics.
Some improvements in the Japanese economy are reflected in the latest PMI numbers provided by IHS Markit. The PMI for manufacturing improved slightly and now stands at 51.4 in October, after reaching a level of only 50.4 in September. The services sector PMI also improved to stand above the growth-indicating level of 50, rising to 50.5 in October from a decline-indicating level of 48.2 a month earlier. Having already taken the current slow growth momentum into account, the GDP growth forecast for 2016 remains at 0.7% and at 0.9% for the coming year. Numerous challenges remain, and it remains to be seen to which extent ongoing stimulus measures will be able to lift growth above current forecast levels.
South Korea The situation in the South Korean economy remains mixed as the country continues to be impacted by a decline in exports, which fell by 4.5% in October. This was nonetheless better than the decline seen in September, of 12.0%. Despite trading challenges, the economy continued to enjoy growth as reflected in industrial output, which rose by 1.3% in September. However, industrial production did not improve materially, as the September level showed the lowest growth in more than one year. The latest PMI number for the manufacturing sector in August indicates a declining momentum in the manufacturing sector. The index stood below the growth-indicating level of 50 again, but improved slightly in October, when it stood at 48.0, compared with 47.6 in September. While near-term developments warrant close monitoring, the GDP growth forecast for this month remains unchanged at 2.6% for 2016 and 2.5% for 2017.
20
OPEC Monthly Oil Market Report – November 2016
World Economy
OECD Europe Euro-zone The economic situation in the Euro-zone continues to improve slightly, but in select geographies and areas. While Germany, and to some extent France, are the main drivers of the recovery, Spain and some peripheral economies are also enjoying a rebound from past years’ low levels. However, the latest data from France and Germany was mixed, and Italy, Greece, Portugal and Finland are doing less well. Moreover, the ECB is likely to consider whether it should continue its monetary stimulus programme, given that it seems to be becoming less effective. The unemployment rate remains high, with no considerable change in the past months, and banking sector-related weakness has not abated materially. Positively, 3Q16 GDP growth was better than expected at 0.3% q-o-q seasonally adjusted growth rate – the same level as in 2Q16 and only slightly below the 0.5% reached in 1Q16. Current estimates for 4Q16 are below these levels, given the most recent mixed data. In the next year, uncertainties prevail, both economically and politically. Next year’s federal government elections in France and Germany will be important in the political debate. The upcoming referendum on the constitution in Italy may add another challenge to the political arena. The latest industrial production figures highlighted the volatile business environment and the lack of a clear trend in output growth. After a decline of 0.4% y-o-y in July, growth again rose to 1.9% y-o-y in August. Manufacturing growth stood at a firm 2.2% y-o-y, while considerable support came from mining and quarrying, with a rise of 1.4% y-o-y after a decline of 16.2% y-o-y in July. It remains to be seen whether this is a temporary hike, or whether it signals a turnaround. Retail sales growth in value terms increased by 1.1% in September, also signalling an improvement, after a decline of 0.8% y-o-y in August. Some support may still come from slight improvements in the labour market. The unemployment rate in the Euro-zone remained at 10.0% in September, the same level as in August and July. After the latest rounds of ECB stimulus, inflation remained low, but increased to a more considerable level, rising by 0.5% y-o-y in October after reaching 0.4% y-o-y in September. Core inflation – the CPI excluding energy, tobacco and food − stood at 0.8% y-o-y, the same as the previous month. While slightly improving, the diminishing effectiveness of ECB stimulus seems to be mirrored again in credit supply figures. September’s growth stood at only 0.4%, after hitting 0.5% in August. Given this trend, the expectation for further monetary stimulus is slim, but some fiscal stimulus may be enacted in the Euro-zone. The latest PMI indicators point to a continuation in Euro-zone improvements. The manufacturing PMI for October stood at 53.5, after September’s level of 52.6 and 51.7 in August. The important services PMI increased to 52.8 in October, after reaching 52.2 in September.
OPEC Monthly Oil Market Report – November 2016
21
World Economy Graph 3.4: Euro-zone PMI índices
Graph 3.5: Euro-zone consumer price index and lending activity
Index
% change y-o-y
55
4 Services PMI
53
52.8
3 2 1
52 51
53.5
3 2 1 0 -1 -2 -3 -4
0 Manufacturing PMI -1
50
Oct 15 Nov 15 Dec 15 Jan 16 Feb 16 Mar 16 Apr 16 May 16 Jun 16 Jul 16 Aug 16 Sep 16 Oct 16
49
Sources: IHS Markit and Haver Analytics.
Oct 11 Mar 12 Aug 12 Jan 13 Jun 13 Nov 13 Apr 14 Sep 14 Feb 15 Jul 15 Dec 15 May 16 Oct 16
54
% change y-o-y
CPI (LHS)
MFI lending (RHS)
Sources: Statistical Office of the European Communities, European Central Bank and Haver Analytics.
While recovery in the Euro-zone is ongoing, multiple challenges remain. The betterthan-expected growth trend in the first three quarters led to an upward revision of growth in 2016 from 1.5% to 1.6%. Also growth in 2017 is seen higher now at 1.3%, compared with 1.2% the previous month.
UK While the Prime Minister continues to aim for March 2017 to start the two-year period of EU-exit negotiations, the high court has in the meantime ruled that the Parliament must be included in such a decision. However, the government appealed and the case will now be judged by the Supreme Court, adding further to uncertainties about the dealings of a UK exit from the EU and probably triggering early elections in 2017. With all the latest developments a so-called “hard exit” seems more likely, contrary to a soft exit − a scenario that would allow the UK to continue with most of its trade agreements with the EU. More positively, the latest performance of the UK’s economy shows it being relatively strong and better than initially expected after the Brexit vote, but the negative implications of such a hard and more severe exit scenario may soon be felt. The PMI for manufacturing remained at a solid level in October of 54.3, after reaching 55.2 in September. Even more important for economic growth in the UK, the services sector PMI rose to 54.5, in October compared with 52.6 in September. However, the positive momentum in industrial production abated somewhat recently as it picked up by only 0.3% y-o-y in September and 0.8% y-o-y in August. Domestic consumption held up very well as retail values increased by 2.2% in September, after an even stronger rise of 4.5% y-o-y in August. This better-than-expected post-Brexit development has led to an upward revision in growth estimates for both 2016 and 2017. The forecast for 2016 has been revised up to 1.8%, from 1.6%, and growth expectations for 2017 now stand at 0.8%, compared with 0.7% the previous month. However, the underlying assumption of a severe negative impact of the Brexit on the UK economy in the short term has not changed.
22
OPEC Monthly Oil Market Report – November 2016
World Economy
Emerging and Developing Economies The outlook for the economy of Brazil remains unchanged this month, with expectations for a contraction of 3.4% this year and weak growth of 0.4% in the coming year. Despite some improvements in consumer and business sentiment due to expectations for less economic policy uncertainty going forward, it remains unclear whether still open corruption scandals and public governance issues will affect the new government. Moreover, actual economic data has not yet mirrored the optimism seen in sentiment indices. The economy of Russia is forecast to decelerate by 0.6% this year, before returning to growth territory at around 0.8% in 2017. The notable easing in the rate of inflation holds out encouraging prospects for household consumption. The central bank’s cautious steps towards lower interest rates should be taken positively and prompt better expectations for spending, lending and investment. That said, the economy is anticipated to return to growth territory next year. The outlook for India’s GDP growth rate moderated to 7.2% in 2017 from 7.5% in 2016. It seems the Indian banking sector has become fragile and, for this, the Reserve Bank of India (RBI) has warned that risks to Indian banks have increased. External conditions continue to pose downside risks to growth, both in terms of sluggish global demand and periodic risks of capital outflows. India’s CPI has fallen further, driven by a steep decline in food, beverage and tobacco prices, and with annual industrial production growth, there is a possibility for another 25 basis point (bp) cut to 6%. This will likely come at the RBI’s December policy meeting, ahead of a potential US Federal Reserve Bank (Fed) rate hike. India’s PMI in October was supported by new orders, output and stocks of purchases. China’s GDP growth remained unchanged from the 1H16 at 6.7% in 3Q16. Despite a temporary improvement in property sales in September and October, developments in the real estate sector remain the main downside risk in the economy in 2017. China's PPI inflation rate returned to the positive zone for the first time in October after being in negative territory for four and half years. Manufacturing PMI in October climbed to 51.2, up 1.1 points compared to the previous month, marking the fastest growth seen in the sector in two years amid apparent signs of an improvement. China’s GDP growth expectation for 2016 was revised up to 6.7% from the 6.5% figure expected in the previous report. For 2017, GDP growth is forecast at 6.2%, up from 6.1% figure in the October MOMR. Table 3.2: Summary of macroeconomic performance of BRIC countries GDP growth rate
Brazil Russia India China
Consumer price index, % change y-o-y
Current account balance, US$ bn
Government fiscal balance, % of GDP
Net public debt, % of GDP
2016
2017
2016
2017
2016
2017
2016
2017
2016
2017
-3.4 -0.6 7.5 6.7
0.4 0.8 7.2 6.2
8.4 7.1 5.5 2.1
5.5 5.5 5.1 2.0
-15.0 40.6 -21.0 328.1
-18.8 67.3 -28.4 279.9
-6.4 -3.7 -3.8 -3.8
-6.9 -2.2 -3.6 -4.2
73.0 13.2 52.0 20.1
80.5 14.6 50.7 24.8
Note: 2016 = Estimate and 2017 = Forecast. Sources: Consensus Economics, Economic Intelligence Unit, Financial Times, OPEC Secretariat and Oxford.
OPEC Monthly Oil Market Report – November 2016
23
World Economy
Brazil Brazil’s GDP contracted by 3.8% y-o-y in 2Q16, following a contraction of 5.4% in 1Q16. This brings the 1H16 deceleration to 4.6% y-o-y. After 14 months of holding its benchmark interest rate at 14.25%, the central bank reduced it last month to 14.00% as a result of the slowly easing trend in inflation since the beginning of the year. Inflation posted a rate of 9.2% in September, compared to 11.3% in January. The three-month moving average unemployment rate remained unchanged at its highest reading ever of 11.8% in September. Graph 3.6: Brazilian inflation vs. interest rate % change y-o-y 12
Graph 3.7: Brazilian unemployment rate
% per annum 15
% 11.8
12.0 11.5
11
14 14.0
10.5 13
9.2
10.0 9.5
8
Oct 15 Nov 15 Dec 15 Jan 16 Feb 16 Mar 16 Apr 16 May 16 Jun 16 Jul 16 Aug 16 Sep 16 Oct 16
12
9.0 8.5
Sources: Banco Central do Brasil, Instituto Brasileiro de Geografia e Estatística and Haver Analytics.
Sep 16
Aug 16
Jul 16
Jun 16
May 16
Apr 16
Mar 16
Jan 16
Feb 16
Dec 15
Nov 15
8.0
National consumer price index (LHS) Selic rate (RHS)
Oct 15
9
Sep 15
10
11.0
Sources: Instituto Brasileiro de Geografia e Estatística and Trading Economics.
In October, the country’s services sector remained in recession, which started in February 2015. The Services Business Activity Index fell to 43.9, from September’s 45.3, pointing to a faster deceleration in output. The manufacturing sector also remained in contraction, with its PMI registering 46.3, due to sharp declines in new export orders, job creation and buying levels. Production also declined at a faster rate. Graph 3.8: Brazilian manufacturing and services PMIs
Index
Index 50
84.4
86 Manufacturing PMI
46.3
45
82 78
43.9 40
Graph 3.9: Brazilian consumer confidence index
Services PMI
74 70 66
24
Oct 16
Sep 16
Aug 16
Jul 16
Jun 16
May 16
Apr 16
Mar 16
Feb 16
Jan 16
Dec 15
Oct 15
Oct 15 Nov 15 Dec 15 Jan 16 Feb 16 Mar 16 Apr 16 May 16 Jun 16 Jul 16 Aug 16 Sep 16 Oct 16 Sources: HSBC, IHS Markit and Haver Analytics.
Nov 15
62
35
Sources: Fundação Getúlio Vargas and Haver Analytics.
OPEC Monthly Oil Market Report – November 2016
World Economy Slower growth in consumer prices helped the consumer confidence index to improve to 84.4 points, up 81.3 points a month earlier, the highest since December 2014. Brazil’s GDP forecasts for 2016 and 2017 remain intact, with a negative 3.4% seen this year and 0.4% seen for next year, with no strong indication of any change in the expected economic circumstances.
Russia Russia’s GDP declined by 0.6% y-o-y in 2Q16, after seeing a 1.2% drop in 1Q16. This represents the smallest contraction in the economy since it fell into recession in 1Q15. The ruble appreciated 3.1% m-o-m in October and nearly 10% since the beginning of the year. Inflation eased further to 6.1% from 6.4% a month earlier, marking its lowest reading since January 2014. After lowering its benchmark interest rate in September, the Russian central bank kept the interest rate unchanged in October at 10.0%. Graph 3.10: Russian inflation vs. interest rate
Graph 3.11: Russian PMIs
% 18
Index
16
54
56
14 Interest rate 10.0
10 8
52.7 52.4
52
48
Inflation rate 6.1
6
50
46
Manufacturing PMI
44
Oct 15 Nov 15 Dec 15 Jan 16 Feb 16 Mar 16 Apr 16 May 16 Jun 16 Jul 16 Aug 16 Sep 16 Oct 16
4
Sources: Federal State Statistics Service, Central Bank of Russia and Haver Analytics.
Oct 15 Nov 15 Dec 15 Jan 16 Feb 16 Mar 16 Apr 16 May 16 Jun 16 Jul 16 Aug 16 Sep 16 Oct 16
12
Services PMI
Sources: HSBC, IHS Markit and Haver Analytics.
Last month, business conditions in Russia’s services sector continued improving as suggested by the Services Business Activity Index, posting 52.7. However, the survey revealed a deceleration growth alongside lower employment. Retail sales dropped by 3.6% y-o-y in September, its lowest rate since January 2015. In contrast, the manufacturing sector in Russia witnessed a marked upturn in October with its respective PMI posting a four-year high reading. The index increased to 52.4, up from 51.1 in the previous month, on a substantial increase in production and a solid gain in new orders. Industrial production decreased slightly by 0.8% y-o-y in September.
OPEC Monthly Oil Market Report – November 2016
25
World Economy Graph 3.12: Russian industrial production % change y-o-y
Graph 3.13: Russian retail sales % change y-o-y
2
0
0
-4
Sources: Federal State Statistics Service and Haver Analytics.
Sep 16
Jul 16
Aug 16
Jun 16
May 16
Apr 16
Mar 16
Feb 16
Jan 16
Dec 15
Sep 15
Sep 16
Jul 16
Aug 16
Jun 16
Apr 16
May 16
Mar 16
Feb 16
Jan 16
Dec 15
-16
Oct 15
-6
Nov 15
-12
Sep 15
-4
Oct 15
-8
Nov 15
-0.8
-2
-3.6
Sources: Federal State Statistics Service and Haver Analytics.
The economy of Russia is forecast to decelerate by 0.6% this year, before returning to growth of around 0.8% in 2017, slightly higher than in the previous assessment.
India India’s GDP growth is expected at 7.2% in 2017 after growing by 7.5% in 2016. Consumer spending, especially urban consumption, likely picked up due to higher public sector wages, although private investment remains sluggish. Following weak investment seen in 1H16, other sluggish trends have emerged across investment indicators, such as core imports and capital goods output. Meanwhile, fiscal constraints on public infrastructure spending continue, as confirmed by cycle analysis. The passage of the goods and services tax (GST) bill seems like it should boost investor confidence by attracting more FDI. Furthermore, the failure of the special tax council to agree to a rate change suggests partial adoption of India's landmark tax reform over 2017. The central government's proposal is for prescribed lists of taxable items with bands of 6%, 12%, 18% and 26%. External conditions continue to pose downside risks to growth, both in terms of sluggish global demand and periodic risks of capital outflows. Sluggish credit growth and weak private investment remain key sources of concern for the Indian economy, but this is due more to structural reasons – including slow monetary policy transmission and the legacy of bad loans – rather than insufficient easing by the RBI. It seems the Indian banking sector has become fragile and because of this, the RBI has warned that the risks to Indian banks have increased. Despite the latest RBI action in terms of cutting the repo rate by about 25 bp, it seems the balance of economic risks have remained unchanged from the previous policy meeting. India's CPI stood at 4.34% y-o-y in September 2016, easing from 5.01% growth in the previous month. It was the lowest inflation rate since September 2015, as food costs rose at a slower pace. The decline in India’s CPI was driven by a steep drop in food, beverages and tobacco prices. With annual industrial production growth, there is the possibility for another 25 bp cut (to 6%) at the December policy meeting, ahead of a potential US Fed rate hike. The WPI decreased to 3.65% y-o-y, down from 3.77% y-o-y in August.
26
OPEC Monthly Oil Market Report – November 2016
World Economy Graph 3.15: Indian inflation vs. Repo rate
5
1Q 16 2Q 16
1Q 15 2Q 15 3Q 15 4Q 15
1Q 14 2Q 14 3Q 14 4Q 14
Oct 16
Sep 16
Aug 16
Jul 16
Jun 16
Repo rate Consumer price index (CPI) CPI lower target bond CPI higher target bond Wholesale price index (WPI) WPI confort zone
4
1Q 13 2Q 13 3Q 13 4Q 13
Apr 16
6
May 16
6.4
Oct 15
7
Mar 16
7.1
7.0
Jan 16
7.9
7.3
6.25
Feb 16
8
% 8 6 4 2 0 -2 -4 -6
Dec 15
% change y-o-y 9
Nov 15
Graph 3.14: Indian GDP growth
Sources: National Informatics Centre (NIC) and Haver Analytics.
Sources: Ministry of Commerce and Industry, Reserve Bank of India and Haver Analytics.
India’s September exports grew 4.6% y-o-y to $22.9 billion, showing the strongest performance since November 2014. The boost to growth came from non-oil exports. The magnitude of contraction in imports was also lower in September, with merchandise imports down 2.5% y-o-y to $31.2 billion compared to a 14.1% y-o-y contraction in August. Although likely to be temporary, these improvements could support the overall economy, which so far has relied on domestic consumption for growth. Yet the risks to exports are not entirely over, particularly as demand in Europe – from where much export growth has come so far – may still suffer in 2017, if and when the UK begins its Brexit procedures. UK trade accounts for about one-third of all Indian merchandise exports and imports. Graph 3.16: Indian net exports 22.9
-8.3
Exports
Imports
Sep 16
Aug 16
Jul 16
Jun 16
Apr 16
May 16
Mar 16
Feb 16
Jan 16
Dec 15
Nov 15
Oct 15
Sep 15
Aug 15
Jul 15
Jun 15
May 15
Apr 15
Mar 15
Jan 15
Feb 15
Dec 14
Nov 14
-31.2
Oct 14
Sep 14
US$ bn 30 20 10 0 -10 -20 -30 -40 -50
Trade balance
Sources: Ministry of Commerce and Industry and Haver Analytics.
India’s PMI in October was supported by new orders, output and stocks of purchases. The manufacturing PMI rose from 52.1 in September to 54.4 in October, marking the 10th straight month of growth and the strongest performance in nearly four years. The latest reading was indicative of a robust improvement in total output, which has been attributed to a sharp rise in new orders, that was in line with the long-run series average. October’s data provides positive news for India’s economy, as manufacturing output and new orders expanded at their fastest pace in 46 and 22 months, respectively.
OPEC Monthly Oil Market Report – November 2016
27
World Economy Graph 3.17: Indian PMIs
Graph 3.18: Indian industrial production breakdown
Index 56
55.4 54.5 54.4
54
% change y-o-y 15 0
52 -15
Oct 15 Nov 15 Dec 15 Jan 16 Feb 16 Mar 16 Apr 16 May 16 Jun 16 Jul 16 Aug 16 Sep 16 Oct 16
48
Composite Services business activity Manufacturing
-30
Aug 15 Sep 15 Oct 15 Nov 15 Dec 15 Jan 16 Feb 16 Mar 16 Apr 16 May 16 Jun 16 Jul 16 Aug 16
50
Total IP
Manufacturing IP
Food products IP Sources: Central Statistical Organisation of India and Haver Analytics.
Sources: Nikkei, IHS Markit and Haver Analytics.
China Chinese GDP growth in 3Q16 remained unchanged from 1H16 at 6.7%. Despite a temporary improvement in property sales in September and October, the real estate sector remains the main downside risk in the economy in 2017. According to data published by the Ministry of Finance, the profits of Chinese state-owned enterprises (SOE) fell at a faster pace in September, contrary to expectations. Although overall real growth was stable, services sector growth accelerated by 0.1 percentage points (pp), while industry and construction growth decelerated 0.2 pp, and agricultural sector growth accelerated 0.9 pp. Nominal GDP growth accelerated to 7.8%, the fastest nominal expansion since 3Q14. This acceleration was due especially to faster growth in industry and construction, with its deflator growth increasing 2.0 pp, although the nominal growth of the services sector also strengthened. Improving nominal growth in industry – where a substantial portion of risky debt is concentrated – is a positive factor for China's ability to service debt. Graph 3.19: Chinese GDP growth
Graph 3.20: Contributions to Chinese GDP growth
% change y-o-y 8.0
% change y-o-y 20
7.8
4.1 7.6
7.3
7.2
10
6.9 6.7
6.8
3.9
7.4
6.1
5
7.8
8.3
2.9
3.1
3.5
6.1
5.9
6.1
6.1
8.3
7.6
7.5
7.6
4Q
1Q
2Q
3Q
0
6.4
2014 2015 2015
2013
2014
2015
1Q 2Q 3Q
1Q 2Q 3Q 4Q
1Q 2Q 3Q 4Q
1Q 2Q 3Q 4Q
6.0 2016
Sources: China's National Bureau of Statistics and Haver Analytics.
28
3.9
15
Agriculture Industry & construction
2016 Services
Sources: China's National Bureau of Statistics and Haver Analytics.
OPEC Monthly Oil Market Report – November 2016
World Economy Foreign exchange reserves fell to $3.17 trillion in September. Compared with the prior month, this $18.8 billion decline in reserves was the largest since May 2016, and compares with the $15.8 billion decline in August. In September, the Chinese yuan depreciated by approximately 0.4% against the US dollar. It seems the reason behind the decline of Chinese foreign reserves is partly related to the fact that authorities are liquidating them to ease the pace of the yuan’s depreciation. It is also partly the result of changes in the value of non-US dollar reserves, which account for as much as half of China's foreign reserves. Since July 2014 China's reserves have declined by a monthly average of $30.6 billion, with monthly declines from November 2015 to January 2016 averaging $98.2 billion. It seems the Chinese yuan will continue to depreciate gradually through 2017. Also, China's flagship central bank publication has added to the warnings against rapid capital account opening. Given the expectations of a weakening housing market and a US rate hike later this year continuing into 2017, both of which will add to outflow pressures, China is likely to track a far more gradual, multi-year opening of its capital account that will span into the next decade. China's inflation accelerated more-than-expected in September and producer prices increased for the first time since 2012 on higher commodity prices. China’s CPI rose 2.1% y-o-y in September, compared with the 1.5% gain in August, while the market expected a 1.6% increase. It was the highest inflation rate since May, as politically sensitive food and non-alcoholic beverage prices increased by 3.6%, while non-food costs rose at a slower 1.6 %. The cost of consumer goods gained 1.7% and those of services advanced 2.4%. China's PPI inflation returned to the positive zone for the first time after being in negative territory for four and half years. The PPI will recover further given a more satisfying base for comparison from the drop in commodity prices seen late last year. China reported a $41.99 billion trade surplus in September, compared to a $59.60 billion surplus a year earlier, missing market estimates for a $53.0 billion surplus. It was the smallest trade surplus since March, as exports fell much more than imports. Exports declined 10% from a year earlier to $184.51 billion, following a 2.8% drop in the preceding month and market expectation for a 3% fall. Imports unexpectedly decreased by 1.9% to $142.52 billion, compared to a 1.5% rise in August, despite market consensus for 1% growth. In yuan-denominated terms, sales fell 5.6% from a year ago, the first contraction since February, and inbound shipments went up 2.2%.
CPI PPI Official interest rate Average house price in 100 cities Sources: China Index Academy, China National Bureau of Statistics, Soufan and Haver Analytics.
OPEC Monthly Oil Market Report – November 2016
178
49
-129
Oct 15 Nov 15 Dec 15 Jan 16 Feb 16 Mar 16 Apr 16 May 16 Jun 16 Jul 16 Aug 16 Sep 16 Oct 16
Oct 16
Jun 16
Aug 16
Apr 16
Feb 16
Dec 15
Oct 15
Jun 15
Aug 15
Apr 15
Feb 15
US$ bn 250 200 150 100 50 0 -50 -100 -150 -200
Dec 14
Graph 3.22: Chinese trade balance
% change y-o-y 20 15 10 5 0 -5 -10
Oct 14
Graph 3.21: Chinese CPI vs. PPI
Exports
Imports
Trade balance
Sources: China Customs and Haver Analytics.
29
World Economy The Caixin China General manufacturing PMI for October climbed to 51.2, up 1.1 points compared to the previous month, marking the fastest growth seen in the sector in two years amid apparent signs of an improvement. The index readings for new orders and output for October were both much higher than in September, and those for input and output prices rose even more, indicating a return of inflationary pressures. The economy seems to be stabilizing for the moment, owing primarily to policies implemented to sustain growth. China’s services PMI compiled by Caixin/Markit rose to 52.4 in October on a seasonally-adjusted basis from 52.0 in September, posting the strongest reading since June. Graph 3.24: Chinese industrial production
Index 54 53 52
Composite PMI Services PMI 52.9 52.4 51.2
51 50 49 48
Manufacturing PMI
Oct 15 Nov 15 Dec 15 Jan 16 Feb 16 Mar 16 Apr 16 May 16 Jun 16 Jul 16 Aug 16 Sep 16 Oct 16
47
Sources: Caixin, IHS Markit and Haver Analytics.
% change y-o-y 7.0 6.8 6.6 6.4 6.2 6.0 5.8 5.6 5.4 5.2 5.0
6.1
Sep 15 Oct 15 Nov 15 Dec 15 Jan 16 Feb 16 Mar 16 Apr 16 May 16 Jun 16 Jul 16 Aug 16 Sep 16
Graph 3.23: Chinese PMIs
Sources: China National Bureau of Statistics and Haver Analytics.
China’s GDP growth expectation for 2016 increased to 6.7% from 6.5% expected in the last report. For 2017, GDP growth is now forecast at 6.2%, up from 6.1% in the last report.
OPEC Member Countries In Saudi Arabia, consumer price inflation posted 3.0% y-o-y in September, its lowest level since the beginning of the year. Growth in the non-oil private sector continued in October, though at a slower pace. Production and new business grew in October but slower than in September. The survey noted that firms started to reduce charges last month as a result of subdued input costs and in an effort to stimulate demand. The economy of Indonesia grew by 5.0% y-o-y in 3Q16, following growth of 4.9% and 5.2% in 1Q16 and 2Q16, respectively. Household consumption expanded 5.0% while general government consumption expenditures shrank 3.0% y-o-y. Exports of goods and services declined by 6.0%, whereas imports decreased by 3.9%. Gross Fixed Capital Formation increased by 4.1%. Growth in the non-oil private sector of the United Arab Emirates continued in October, albeit at a slower pace. The country’s PMI reading stood at 53.3 in October, down from 54.1 a month earlier. This marks the lowest reading of the index in six months. The survey showed strong output growth. However, new orders rose at a comparatively slower pace.
30
OPEC Monthly Oil Market Report – November 2016
World Economy Graph 3.25: PMIs of Indonesia, Saudi Arabia and UAE Index 65 60 55
53.2 53.3
50
48.7
Indonesia
Saudi Arabia
Oct 16
Sep 16
Jul 16
Aug 16
Jun 16
May 16
Apr 16
Mar 16
Feb 16
Jan 16
Dec 15
Nov 15
Oct 15
Sep 15
Aug 15
Jul 15
Jun 15
May 15
Apr 15
Mar 15
Feb 15
Jan 15
Dec 14
Oct 14
Nov 14
45
UAE
Sources: Emirates NBD, IHS Markit, Nikkei and Haver Analytics.
Other Asia Consumer prices in the Philippines increased by 2.3% y-o-y in October, the same as the previous month’s rise and the highest since March 2015. This came on the back of a currency depreciation of more than 2.5% in the past two months. The manufacturing sector showed a marked improvement last month, with the respective PMI registering 56.5. GDP growth accelerated in 2Q16 by nearly 7% from 6.8% the previous quarter, representing the highest rate of growth since 2Q13. Both private and government consumption expenditures increased, by 7.3% and 13.5% in 2Q16, respectively, up from 7.0% and 11.8% in 1Q16. The increase in consumer price inflation in Thailand remained in positive territory at 0.3% y-o-y in October, following the period of deflation between January 2015 and March 2016. The manufacturing sector survey showed strong improvement in operating conditions last month. The index stood at 52.7 in October, up from 52.2 in September, on solid expansion in production and total new business, including export orders. GDP grew by 3.5% in 2Q16, up from 3.2% the previous quarter, despite a sharp drop in government consumption from nearly 8% in 1Q16 to only 2.2% in 2Q16, while private consumption notably increased from 2.4% to 3.8% in same period.
Africa In Egypt, inflation continued posting a double-digit increase in September at 14.6%. The non-oil private sector remained in the contraction territory last month. Emirates NBD Egypt PMI dropped to a 39-month low of 42.0 in October. Currency depreciation resulted in increased inflation, while output and new orders declined. The central bank policy rate was at 11.75% in October, unchanged from the previous four months. In South Africa, last month witnessed an acceleration in the private sector’s output growth, as suggested by the PMI survey outcomes. Standard Bank South Africa PMI of October posted 50.5, nearly unchanged from 50.6 in September. The PMI reading of October indicates further growth in the private sector for a second month in a row. It also showed ongoing increases in output and employment.
OPEC Monthly Oil Market Report – November 2016
31
World Economy
Latin America In Argentina, the peso appreciated by 0.5% m-o-m in October, after depreciating by 1.7% in September. The peso depreciated by nearly 50% between December 2015 and July 2016. The consumer confidence index stayed at below the neutral line in October, posting 46.0, while the inflation expectation over the next 12 months stood at 27.6% in October. In Chile, inflation posted 3.1% y-o-y in September, the lowest since January 2014. GDP growth in 2Q16 slowed to the lowest growth since 3Q14 at 1.5% y-o-y, down from 2.2% in the previous quarter, despite a marked increase in government consumption. Private consumption growth was at 1.7% in 2Q16, versus 2.6% in 1Q16. Government consumption growth stood at 7.0%, up from 4.4%.
Transition region In the Czech Republic, industrial production grew 2.7% y-o-y in September down from more than 13% increase in August. In October, the unemployment rate stood at 5.0%, down from 5.2% a month earlier and its lowest since December 2008. In October, the manufacturing sector posted its fastest improvement in operational conditions since May on a substantial increase in production and new orders. GDP grew by 3.6% y-o-y in 2Q16, higher than the 2.7% seen in 1Q.
Oil prices, US dollar and inflation The US dollar strengthened in October against major currencies. On average it gained 6.5% against the pound sterling, following an announcement by the British PM that March 2017 could become the potential deadline for formally activating the withdrawal procedure from the EU. The dollar gained 1.8% against the Euro in October and rose against the Swiss franc by 1.4%. It also advanced by 1.8% against the yen. Compared with the Chinese yuan, the US dollar rose by 1.1% m-o-m on average in October – its second consecutive monthly increase. It was flat m-o-m against the Indian rupee. Compared with the Brazilian real, the dollar fell by 2.2% m-o-m on average and by 3.1% against the Russian ruble, mainly on the effect of higher commodity prices in both cases. In general, the dollar was supported during the month by firming expectations by market participants of an interest rate hike by the US Federal Reserve in its December meeting, following continuing improvement in the US labour market and solid 3Q16 GDP preliminary readings. Furthermore, the Fed affirmed at its November meeting that “the case for an increase in the federal funds rate has continued to strengthen”. On the other hand, the ECB, the BoJ and the PBoC are expected to remain accommodative. This would keep the dollar supported in the near term. More recently, in the immediate aftermath of the US presidential election, significant currency market volatility has been observed; the US dollar ended up by 8.4% against the Mexican peso at the end of following trading session – it hit 13.5% up at session highs – and rose by 1.0% against the Canadian dollar on the uncertainty of the outlook for trade relations with the US. In nominal terms, the price of the OPEC Reference Basket (ORB) increased by $4.98, or 11.6%, from $42.89/b in September to $47.87/b in October. In real terms, after accounting for inflation and currency fluctuations, the ORB increased to $32.86/b from $28.84/b (base June 2001=100). Over the same period, the US dollar advanced by
32
OPEC Monthly Oil Market Report – November 2016
World Economy 2.1% against the import-weighted modified Geneva I + US dollar basket*, while inflation increased by 0.1%. Graph 3.26: Impact of inflation and currency fluctuations on the spot OPEC Reference Basket price* US$/b 120 100 80 60 40
$47.87/b
20
Base: June 2001 = 100
$32.86/b
Nominal Reference Basket price
Oct 16
Aug 16
Apr 16
Jun 16
Feb 16
Dec 15
Oct 15
Jun 15
Aug 15
Apr 15
Feb 15
Dec 14
Oct 14
Jun 14
Aug 14
Apr 14
Feb 14
Dec 13
Oct 13
Aug 13
Jun 13
Apr 13
Feb 13
Dec 12
Oct 12
0
Real Reference Basket price
Source: OPEC Secretariat.
*
The ‘modified Geneva I+US$ basket’ includes the euro, the Japanese yen, the US dollar, the pound sterling and the Swiss franc, weighted according to the merchandise imports of OPEC Member Countries from the countries in the basket.
OPEC Monthly Oil Market Report – November 2016
33
World Oil Demand
World Oil Demand World oil demand growth for 2016 was adjusted down slightly by 10 tb/d from the previous month’s report to stand at 1.23 mb/d, averaging 94.40 mb/d. For 2017, growth is expected to be around 1.15 mb/d, unchanged from the previous report, at 95.55 mb/d. Graph 4.1: Quarterly world oil demand growth tb/d 2,000 1,500 1,000 500 0 -500 1Q
2Q
3Q
4Q
1Q
2015
2Q
3Q
4Q
2016 (Estimate)
OECD
1Q
3Q
2Q
4Q
2017 (Forecast)
Non-OECD
Total world
Source: OPEC Secretariat.
Table 4.1: World oil demand in 2016*, mb/d Change 2016/15 % Growth 0.20 0.81 0.19 0.98 0.14 1.04 -0.04 -0.49 0.30 0.65
Americas of which US Europe Asia Pacific Total OECD
2015 24.60 19.84 13.73 8.03 46.35
1Q16 24.57 19.91 13.63 8.57 46.78
2Q16 24.74 20.03 13.90 7.63 46.27
3Q16 25.08 20.22 14.23 7.64 46.95
4Q16 24.80 19.97 13.72 8.11 46.63
2016 24.80 20.03 13.87 7.99 46.66
Other Asia of which India Latin America Middle East Africa Total DCs
12.04 4.05 6.56 7.97 3.99 30.57
12.42 4.51 6.19 7.94 4.12 30.68
12.63 4.25 6.49 7.79 4.09 31.01
12.42 4.14 6.76 8.44 4.03 31.65
12.73 4.44 6.45 7.92 4.17 31.26
12.55 4.34 6.47 8.02 4.10 31.15
0.51 0.29 -0.09 0.05 0.11 0.58
4.22 7.05 -1.30 0.63 2.78 1.91
FSU Other Europe China Total "Other regions"
4.62 0.67 10.95 16.25
4.49 0.68 10.83 16.01
4.37 0.64 11.37 16.39
4.73 0.68 11.11 16.52
5.04 0.77 11.61 17.42
4.66 0.70 11.23 16.59
0.04 0.02 0.28 0.34
0.81 3.57 2.56 2.11
Total world Previous estimate Revision
93.17 93.17 0.00
93.47 93.46 0.01
93.66 93.70 -0.04
95.13 95.15 -0.02
95.31 95.29 0.02
94.40 94.40 -0.01
1.23 1.24 -0.01
1.32 1.33 -0.01
Note: * 2016 = Estimate. Totals may not add up due to independent rounding. Source: OPEC Secretariat.
34
OPEC Monthly Oil Market Report – November 2016
World Oil Demand Table 4.2: World oil demand in 2017*, mb/d Change 2017/16 % Growth 0.20 0.79 0.15 0.75 0.01 0.07 -0.06 -0.71 0.15 0.32
Americas of which US Europe Asia Pacific Total OECD
2016 24.80 20.03 13.87 7.99 46.66
1Q17 24.79 20.05 13.61 8.51 46.91
2Q17 24.89 20.13 13.89 7.56 46.34
3Q17 25.32 20.44 14.26 7.62 47.20
4Q17 24.96 20.12 13.75 8.05 46.76
2017 24.99 20.18 13.88 7.93 46.80
Other Asia of which India Latin America Middle East Africa Total DCs
12.55 4.34 6.47 8.02 4.10 31.15
12.75 4.66 6.28 8.07 4.23 31.32
13.02 4.40 6.53 7.91 4.19 31.65
12.80 4.34 6.81 8.53 4.14 32.28
13.10 4.57 6.54 8.03 4.29 31.97
12.92 4.49 6.54 8.13 4.21 31.81
0.37 0.16 0.07 0.11 0.11 0.65
2.92 3.62 1.07 1.35 2.63 2.09
FSU Other Europe China Total "Other regions"
4.66 0.70 11.23 16.59
4.56 0.71 11.11 16.38
4.42 0.66 11.63 16.72
4.79 0.70 11.40 16.89
5.10 0.80 11.85 17.75
4.72 0.72 11.50 16.94
0.06 0.02 0.27 0.35
1.30 3.15 2.38 2.11
Total world Previous estimate Revision
94.40 94.40 -0.01
94.61 94.60 0.01
94.71 94.75 -0.04
96.37 96.39 -0.02
96.48 96.46 0.02
95.55 95.56 -0.01
1.15 1.15 0.00
1.22 1.22 0.00
Note: * 2017 = Forecast. Totals may not add up due to independent rounding. Source: OPEC Secretariat.
World Oil Demand for 2016 and 2017 OECD Americas The latest US monthly data for August 2016 implied a solid y-o-y increase in oil requirements of around 0.34 mb/d, or 1.7%. The increase represents a return to growth after registered declines in July, y-o-y. Transportation fuels – especially gasoline and jet/kerosene – were responsible for the bulk of the growth in August, in line with the continued low fuel price environment, increasing fleet traffic, and growth in the overall economy. During the same month, diesel oil requirements remained flat, primarily the result of a slowdown in construction activities compared with the same month in 2015, as well as fuel substitution. Graph 4.2: US oil consumption, y-o-y changes tb/d 1,200 800 400 0 -400
All other
Diesel oil
Gasoline
Oct 16
Sep 16
Aug 16
Jul 16
Jun 16
May 16
Apr 16
Mar 16
Feb 16
Jan 16
Dec 15
Nov 15
Oct 15
-800
Total
Source: US Energy Information Administration.
OPEC Monthly Oil Market Report – November 2016
35
World Oil Demand Available data for the 10 months of 2016 – monthly data to August and preliminary weekly data for September and October – shows US oil demand growing by around 0.3 mb/d, with gasoline, fuel oil and jet/kerosene taking the largest share in gains, while distillate demand declined compared with the same period in 2016. Slight decreases have also been registered in demand for propane/propylene. The overall potential for US oil demand for the remainder of 2016 and for 2017 is slightly skewed to the upside, yet with some factors that might weigh on oil demand. Upside potential relates to anticipated improving growth of the economy and consumption in the road transportation sector due to the low fuel price environment, while downside risks originate mainly from fuel substitution and, to some extent, from developments in vehicle efficiencies. Table 4.3: US oil demand, tb/d
Propane/propylene Gasoline Diesel oil Jet/kerosene Fuel oil Other products US 50
Average January - October 2016 2015 1,076 1,095 9,320 9,167 3,824 4,020 1,608 1,534 378 243 1,076 1,095 19,653
19,401
253
1.3
397
374
23
6.1
20,050
19,774
275
1.4
US territories Total
Change 2016/15 tb/d % -19 -1.7 153 1.7 -196 -4.9 75 4.9 56.0 136 -19 -1.7
Source: US Energy Information Administration.
Mexican oil demand in September shrank sharply for the fifth month in a row, down 0.14 mb/d, or 8.3%, y-o-y, implying an overall bearish year-to-date picture in 2016. The bulk of oil demand declines in September came from fuel oil and LPG due to substitution with natural gas, while demand for diesel oil remained flat. Losses have nevertheless been partly offset during the same month by growing gasoline and jet/kerosene requirements. As in the US, these positive performances stem from improvement in the overall economy and the fuel price environment. The risks for Mexican oil demand in 2016 and 2017 are skewed to the downside, predominantly as a result of anticipated fuel substitution and given a slowing economy. In Canada, August demand rose y-o-y. Gains in gasoline, naphtha, jet/kerosene and diesel oil demand more than offset declines in required LPG and fuel oil. The prospects for Canadian oil demand in 2016 and 2017 are slightly positive supported by a slowly growing economy, while existing downside risks concern vehicle efficiencies and fuel substitution. In 2016, oil demand in OECD Americas is expected to grow by 0.20 mb/d over the previous year. In 2017, OECD Americas’ oil demand is projected to continue to grow at this year’s level of 0.20 mb/d.
36
OPEC Monthly Oil Market Report – November 2016
World Oil Demand
OECD Europe August data showed strong y-o-y European oil demand growth with all countries, except Spain and Portugal, exhibiting solid gains. The most notable oil demand growth was witnessed in the Netherlands, with preliminary increases exceeding 0.16 mb/d y-o-y, as a result of exceptional naphtha demand growth. Dutch naphtha demand was up by around 0.13 mb/d y-o-y in August, as a result of a low base, due to naphtha cracker shutdowns in the same month last year and cheap naphtha prices boosting demand in petrochemical plants. In Germany, one of the major naphtha demand centers in Europe, demand for naphtha eased to 0.03 mb/d y-o-y, due to an unplanned outage at Shell’s Wesseling cracker and continued to be weak due to recent outages at the BASF chemical plant, which could remain offline for up to three months. However, y-o-y, demand for naphtha in Europe still increased by 0.17 mb/d. Another source of European oil demand growth was diesel oil, which saw solid y-o-y growth in August, driven by increasing auto sales data. During that month, the positive momentum in auto sales returned with an increase of more than 10%, after showing a decline in July of 1.4% y-o-y, which broke 34 consecutive months of growth. According to data from the European Automobile Manufacturers Association (ACEA), most major auto markets expanded, including Italy, Spain and Germany. Early indications for September showed losses in oil demand of approximately 0.08 mb/d for Germany and 0.06 mb/d for France, while oil requirements in Italy and the UK grew or remained flat, respectively. While the outlook for European oil demand for the remainder of 2016 and into 2017 is generally optimistic, it also faces large uncertainties, mostly concerning the region’s economy. These become more pronounced when forecasting 2017 oil demand growth. Projected improvements in most economies in the region would imply increases in future oil requirements; however, the high historical baseline, a reduced oil price effect on road transportation fuels and economic uncertainties continue to accentuate risks to the downside. Table 4.4: Europe Big 4* oil demand, tb/d LPG Naphtha Gasoline Jet/kerosene Diesel oil Fuel oil Other products Total
Sep 16 440 633 1,122 807 3,449 250 640
Sep 15 432 616 1,135 828 3,520 275 657
Change 8 17 -14 -21 -71 -26 -16
Change, % 1.9 2.7 -1.2 -2.6 -2.0 -9.3 -2.5
7,340
7,463
-123
-1.6
Note: * Germany, France, Italy and the UK. Sources: JODI, OPEC Secretariat, UK Department of Energy and Climate Change and Unione Petrolifera.
OECD Europe oil demand is projected to grow by 0.14 mb/d in 2016, while 2017 oil demand will grow slightly by 0.01 mb/d compared with 2016.
OPEC Monthly Oil Market Report – November 2016
37
World Oil Demand
OECD Asia Pacific Oil demand in Japan decreased during September by 0.16 mb/d y-o-y, with negative performance in almost all main product categories, the only exception being fuel oil. The largest declines were observed in relation to naphtha and jet fuel requirements, while demand for gasoline and diesel oil remained flat y-o-y. Losses have also been registered in oil demand for direct burning – crude and fuel oil – mainly as a result of fuel substitution. The negative overall Japanese oil demand growth seen so far this year is generally in line with developments in the country’s main economic indicators. Consumption is expected to continue to contract over the remainder of this year and in 2017. Additional downside risks for 2017 include a possible restart of offline nuclear power plants, which would imply losses in fuel oil and crude direct burning demand next year. Table 4.5: Japanese domestic sales, tb/d LPG Naphtha Gasoline Jet/kerosene Diesel oil Fuel oil Other products Direct crude burning Total
Sep 16 388 714 908 228 593 374 59 33
Sep 15 389 853 915 254 595 344 61 47
Change -1 -140 -7 -26 -2 29 -3 -13
Change, % -0.3 -16.4 -0.8 -13.1 -0.3 8.4 -4.4 -28.7
3,296
3,459.3
-163
-4.7
Source: Ministry of Economy Trade and Industry of Japan.
In South Korea, oil demand was bullish for another month in August, registering y-o-y increases of 0.17 mb/d, equivalent to 6.4%. Diesel oil usage in the industrial and transportation sectors, gasoline demand in the transportation sector, and fuel oil requirements in the industrial sector took the lions’ share of overall growth. Solid y-o-y increases have also been observed in August in demand for jet/kerosene. The outlook for South Korean oil demand during the remaining part of 2016 and for 2017 is positive, with potential to the upside. OECD Asia Pacific oil demand is expected to fall by 0.04 mb/d in 2016, and decline by a further 0.06 mb/d in 2017.
Other Asia Indian oil demand turned negative in September for the first time since October 2014, with a decline of around 90 tb/d, or 2.0%, compared with a year earlier. This can be mainly attributed to a delayed, and then heavy, monsoon season producing substantial rain and flooding in various parts of the country. However, total product consumption averaged 4.27 mb/d in the month of September. In terms of products, diesel oil was the major source of the decline as it dipped by more than 0.19 mb/d, or 11.3%, y-o-y. Diesel oil consumption, which accounts for around 40% of total Indian oil consumption, reached 1.49 mb/d in September. The shrinkage in diesel oil demand was caused by the combination of minor easing in manufacturing and weather conditions. Moreover, floods in many areas of the country decelerated road and building construction activities. Gasoline demand also declined in September, for the first time since May 2014, as the product shed some 19 tb/d, or around 3.4%,
38
OPEC Monthly Oil Market Report – November 2016
World Oil Demand y-o-y and averaged 0.55 mb/d for the month. Severe flooding resulted in the closure of businesses and schools for some days, negatively affecting transportation activities. On the other hand, passenger car sales grew by around 15% y-o-y in September, with continuing double-digit sales growth for two-wheelers, which rose by 21% y-o-y. On a further positive note, LPG continued its relentless growth, up by around 0.11 mb/d y-o-y, with total consumption at a record level of 0.79 mb/d, as robust housing demand continues to support LPG consumption. Graph 4.3: Changes in Indian oil demand, y-o-y
LPG
Gasoline
Jet/kerosene
Diesel oil
Fuel oil
Sep 16
Aug 16
Jul 16
Jun 16
May 16
Apr 16
Mar 16
Feb 16
Jan 16
Dec 15
Nov 15
Oct 15
Sep 15
tb/d 600 500 400 300 200 100 0 -100 -200 -300
Other products
Sources: OPEC Secretariat and Petroleum Planning and Analysis Cell of India.
For the remainder of 2016, India is anticipated to be the main contributor to growth in the Other Asia region. Middle distillates are foreseen to be the product leading oil consumption in the region, followed by gasoline. Table 4.6: Indian oil demand by main products, tb/d LPG Gasoline Jet/kerosene Diesel oil Fuel oil Other products Total
Sep 16 796 551 270 1,491 237 921
Sep 15 688 570 271 1,681 239 906
Change 108 -19 -1 -190 -2 16
Change, % 15.7 -3.4 -0.4 -11.3 -0.7 1.7
4,266
4,355
-88
-2.0
Sources: OPEC Secretariat and Petroleum Planning and Analysis Cell of India.
Taiwan’s latest available data for August indicates increased oil requirements of 31 tb/d, or 3.3%, y-o-y. The bulk of these volumes originated in fuel oil and distillate fuels, namely jet fuel and diesel oil, highlighting improvements in the industrial and transportation sectors. In Indonesia, positive August oil demand growth stemmed from increasing requirements for fuel oil and diesel oil, hinting at an improvement in industrial fuel requirements. Indonesia consumed around 1.58 mb/d for the month, some 24 tb/d higher than the same period a year ago. For 2017, Other Asia’s oil demand growth is anticipated to continue at a healthy pace, with major assumptions based on continuing healthy economic growth coupled with steady retail prices. Within the region, India is seen to be the largest contributor to growth and other countries in the region – such as Indonesia, Thailand, Singapore and
OPEC Monthly Oil Market Report – November 2016
39
World Oil Demand the Philippines – are projected to also contribute positively to oil demand growth. Light distillate products – including LPG, naphtha and gasoline – will lead oil demand growth next year. Other Asia’s oil demand is projected to grow by 0.51 mb/d in 2016, followed by growth of 0.37 mb/d in 2017.
Latin America Brazilian oil demand continued its sluggish performance in September, with oil demand dipping by 72 tb/d y-o-y, consistent with weakening macroeconomic conditions. This has taken total consumption in Brazil to 2.44 mb/d. Declines were witnessed across all products, with the exception of gasoline and marginal growth in LPG. On the other hand, fuel oil and middle distillates weakened the most over the month. Gasoline demand in Brazil showed positive data, as it remained more economically viable to end users than ethanol, which was affected by rising sugar prices. Gasoline gained some 56 tb/d, or 8.1%, y-o-y. Ethanol demand dropped sharply by around 61 tb/d, or 17.7%, y-o-y. Diesel oil demand was lower by 33 tb/d, representing a contraction of 3.2% y-o-y, its seventh-successive decline. Potential diesel oil demand growth turned into a contraction in 2016, mainly as a result of slowing economic factors. Demand from different sectors was sluggish, but mainly in industry, in line with poor manufacturing activities. Fuel oil demand declined by more than 28 tb/d y-o-y in September, for a contraction of 33.8%. Weakening economic conditions contributed adversely to fuel oil demand numbers as less consumption was observed in power generation and in the use of fuel oil as a bunker. Table 4.7: Brazilian inland deliveries, tb/d LPG Gasoline Jet/kerosene Diesel oil Fuel oil Alcohol Total
Sep 16 238 752 113 1,001 54 282
Sep 15 234 696 125 1,034 82 342
Change 5 56 -12 -33 -28 -61
Change, % 2.1 8.1 -9.7 -3.2 -33.8 -17.7
2,441
2,513
-72
-2.9
Source: Agência Nacional do Petróleo, Gás Natural e Biocomb ustíveis of Brazil.
Oil consumption in Argentina was in positive territory during the month of August, gaining some 10 tb/d, or 1.5%, y-o-y, with mixed performances by products. All transportation fuels were in the negative, with jet/kerosene, diesel oil and gasoline declining by around 3.0%, 1.0% and 1.6% y-o-y, respectively. Fuel oil also recorded significate progress, adding some 10.3% y-o-y. Total oil consumption reached 0.67 mb/d in August. Looking ahead, the risks to the forecast for the remainder of 2016 continue to be tilted toward the downside, as economic conditions in Brazil and other countries in the region are anticipated to wane and government spending on projects is anticipated to be reduced. On the other hand, the presence of lower oil prices, in addition to unusual weather conditions in the region, should support demand for power generation.
40
OPEC Monthly Oil Market Report – November 2016
World Oil Demand In 2017, projections will be largely dependent on possible improvements in the overall economy. Oil demand should also improve as a result, while this year’s low numbers should provide a lower baseline of comparison. In terms of products, diesel oil and gasoline have higher growth potential and are expected to fuel the industrial and transportation sectors. Graph 4.4: Oil demand growth in Latin America, y-o-y tb/d
tb/d
500 400 300 200 100 0 -100 -200 -300 -400
500 400 300 200 100 0 -100 -200 -300 -400 Dec
Jan
Feb
Mar
Historical range
Apr
May
Jun
Jul
Aug
Historical average
Sep
Oct 2015
Nov
2016
Sources: ANP, Joint Organisations Data Initiative and OPEC Secretariat.
Latin American oil demand is anticipated to decline by 0.09 tb/d in 2016. During 2017, oil demand growth is forecast to return to growth, increasing by 0.07 tb/d.
Middle East Oil demand in Saudi Arabia saw a declining trend in September, falling sharply by 0.39 mb/d, or 13.4%, y-o-y to average around 2.52 mb/d. On a cumulative basis, using data from January–September, oil demand growth in the Kingdom is also sharply in the negative with a reduction of about 76 tb/d, or around 3.0% y-o-y. Most products saw negative growth in September, with direct crude burning and diesel oil declining the most. Substitution by natural gas, particularly after commencement of the Wasit gas plant, caused crude for direct burning to sharply drop by more than 0.25 mb/d, which equates to nearly 34.2% y-o-y, pressuring the country’s overall consumption figures. Moreover, diesel oil use also declined by around 25.2% y-o-y, as a result of less consumption in the transportation and industrial sector. Total direct crude demand for burning was at 0.49 mb/d in September. The Other Products category, gasoline and jet/kerosene also weakened, dropping by 44.5%, 14.8% and 1.0% y-o-y, respectively. Easing in road transportation fuel use was mainly the result of a higher base of comparison. In addition, a drop in the consumption of Other Products could be largely attributed to lower-than-anticipated demand in various sectors, such as road building and construction. Similarly, oil demand figures for September in Iraq were on a declining trend, with a reduction in demand by 14 tb/d, or 1.9%, y-o-y, despite mixed product performance. Fuel oil, LPG, gasoline and diesel oil showed increases, while jet/kerosene and the Other Products category declined sharply. Oil requirements also fell in Kuwait and Iran by 5.8% and 1.5% y-o-y, respectively. Shrinkage in fuel oil demand appeared to be the main source of the declines in both countries.
OPEC Monthly Oil Market Report – November 2016
41
World Oil Demand Going forward, risks for the remainder of 2016 appear to be tilted to the downside, as increasing substitution, as well as slower economic indicators weigh on demand growth potential in the region. In 2017, oil demand growth is expected to gain momentum over levels experienced in the current year. This will mainly be the result of assumed improvements in the economy. On the other hand, geopolitical concerns, as well as increasing substitution, are assumed to contribute negatively to demand growth in 2017. Graph 4.5: Oil demand growth in the Middle East, y-o-y tb/d 600
tb/d 600
500
500
400
400
300
300
200
200
100
100
0
0
-100
-100
-200 Jan
Feb
Mar
Historical range
Apr
May
Jun
Jul
Aug
Historical average
Sep
Oct
2015
Nov
-200 Dec 2016
Sources: ANP, Joint Organisations Data Initiative and OPEC Secretariat.
Middle East oil demand for 2016 is expected to increase by 0.05 mb/d and is projected to grow by 0.11 mb/d in 2017.
China September Chinese oil demand registered growth of around 0.39 mb/d, with total consumption reaching 11.4 mb/d, according to Secretariat calculations based on the latest statistics. Increasing LPG requirements for the petrochemical industry, in combination with rising gasoline and jet fuel demand, accounted for the bulk of these gains. LPG demand is bouncing back after a temporary halt in industrial activities during the G-20 Summit. Total consumption for products is at around 1.55 mb/d, as propane dehydrogenation capacities (PDH) continue to expand. Chinese PDH capacity is projected to reach 4 metric tons per year in 2016, compared with 2 metric tons per year in 2015. Gasoline demand was higher by around 0.16 mb/d y-o-y in September, with support from healthy sport utility vehicle (SUV) sales. According to data from the China Association of Automobile Manufacturers (CAAM), passenger cars sales in September witnessed an increase of around 30% y-o-y, compared with a rise of 26% y-o-y in August, with SUV sales surging by around 54% y-o-y. Jet/kero total consumption was at 0.63 mb/d, up by 41 tb/d, boosted by additional requirements from the aviation sector. The overall outlook for the remainder of 2016 remains balanced, mainly due to equal weighting between the risk of a somewhat slowing economy and the implementation of some measures against air pollution in cities, as well as expansion in the petrochemical industry and rising car sales.
42
OPEC Monthly Oil Market Report – November 2016
World Oil Demand Projections for oil demand developments in China for 2017 are broadly in line with the current year, taking into account assumptions such as the rising use of transportation and industrial fuels, slightly lower GDP growth, the continuation of fuel quality programmes targeting lower emissions, and continued substitution by natural gas and coal. Graph 4.6: Changes in Chinese apparent oil demand, y-o-y changes tb/d
tb/d
1,000
1,000
750
750
500
500
250
250
0
0
-250
-250
-500 Jan
Feb
Mar
Apr
Historical range
May
Jun
Jul
Historical average
Aug
Sep
Oct
2015
Nov
-500 Dec 2016
Sources: Argus Global Markets, China OGP (Xinhua News Agency), Facts Global Energy, JODI, National Bureau of Statistics of China and OPEC Secretariat.
Chinese oil demand is projected to grow by 0.28 mb/d in 2016 and 0.27 mb/d in 2017.
OPEC Monthly Oil Market Report – November 2016
43
World Oil Supply
World Oil Supply World liquids supply in October increased by 0.97 mb/d m-o-m to average 96.32 mb/d. Year-o-year, the global supply rose 0.88 mb/d. Non-OPEC supply in October, including OPEC NGLs, increased by 0.74 mb/d to average 62.68 mb/d, while OPEC crude oil production rose by 0.24 mb/d to average 33.64 mb/d, according to secondary sources. The non-OPEC oil supply estimation for 2016 has been revised down by 0.1 mb/d since the October MOMR to now show a contraction of 0.78 mb/d to average 56.20 mb/d. This revision was due to higher-than-expected 3Q16 declines in the US, Mexico, Norway, the UK, Malaysia, Kazakhstan and China, which were partially offset by higher output from Canada, Russia and other OECD Europe. Non-OPEC production in 2H16 is expected to be lower than in 1H16, despite the continued rise in US rig counts, the end of seasonal maintenance, and the startup of new projects. For 2017, non-OPEC supply growth has also been revised down by a marginal 10 tb/d to show an increase of 0.23 mb/d. For the year, non-OPEC supply is expected to average 56.43 mb/d. Expectations for OPEC NGL production remain unchanged, growing by 0.16 mb/d in 2016 and 0.15 mb/d in 2017. Table 5.1: Non-OPEC oil supply in 2016*, mb/d Change 2016/15 Growth % -0.54 -2.54 -0.42 -3.02 -0.01 -0.24 -0.02 -4.48 -0.56 -2.23
Americas of which US Europe Asia Pacific Total OECD
2015 21.07 14.04 3.76 0.46 25.29
1Q16 21.05 13.81 3.90 0.44 25.39
2Q16 20.13 13.68 3.73 0.42 24.28
3Q16 20.48 13.50 3.60 0.45 24.53
4Q16 20.46 13.48 3.78 0.46 24.69
2016 20.53 13.62 3.75 0.44 24.72
Other Asia Latin America Middle East Africa Total DCs
2.72 5.19 1.27 2.13 11.31
2.76 4.98 1.27 2.10 11.10
2.68 5.06 1.28 2.07 11.09
2.68 5.17 1.29 2.13 11.27
2.74 5.24 1.28 2.15 11.40
2.71 5.11 1.28 2.11 11.22
-0.01 -0.08 0.01 -0.02 -0.09
-0.32 -1.46 0.50 -0.75 -0.83
FSU of which Russia Other Europe China Total "Other regions" Total non-OPEC production Processing gains
13.69 10.85 0.14 4.38 18.21
13.95 11.07 0.13 4.22 18.31
13.73 10.98 0.13 4.11 17.97
13.70 11.05 0.13 4.00 17.84
14.02 11.08 0.15 4.02 18.19
13.85 11.05 0.14 4.09 18.08
0.16 0.20 0.00 -0.29 -0.14
1.16 1.84 -0.76 -6.70 -0.75
54.81
54.80
53.34
53.63
54.28
54.01
-0.80
-1.45
2.17
2.19
2.19
2.19
2.19
2.19
0.01
0.60
Total non-OPEC supply Previous estimate Revision
56.98 56.98 0.00
56.98 56.93 0.05
55.53 55.48 0.05
55.82 56.10 -0.28
56.47 56.69 -0.23
56.20 56.30 -0.10
-0.78 -0.68 -0.10
-1.37 -1.19 -0.18
Note: * 2016 = Estimate. Source: OPEC Secretariat.
44
OPEC Monthly Oil Market Report – November 2016
World Oil Supply Table 5.2: Non-OPEC oil supply in 2017*, mb/d Change 2017/16 Growth % -0.16 -0.79 -0.15 -1.13 -0.01 -0.32 0.00 0.51 -0.17 -0.69
Americas of which US Europe Asia Pacific Total OECD
2016 20.53 13.62 3.75 0.44 24.72
1Q17 20.42 13.44 3.87 0.45 24.74
2Q17 20.27 13.40 3.73 0.46 24.46
3Q17 20.30 13.43 3.54 0.45 24.29
4Q17 20.49 13.57 3.82 0.42 24.72
2017 20.37 13.46 3.74 0.44 24.55
Other Asia Latin America Middle East Africa Total DCs
2.71 5.11 1.28 2.11 11.22
2.73 5.27 1.27 2.17 11.44
2.72 5.29 1.26 2.19 11.46
2.72 5.33 1.25 2.21 11.51
2.71 5.42 1.24 2.23 11.60
2.72 5.33 1.26 2.20 11.50
0.01 0.22 -0.02 0.09 0.29
0.29 4.21 -1.90 4.14 2.55
FSU of which Russia Other Europe China Total "Other regions" Total non-OPEC production Processing gains
13.85 11.05 0.14 4.09 18.08
14.11 11.12 0.15 4.04 18.29
13.92 11.01 0.15 3.98 18.06
13.98 11.00 0.15 3.96 18.10
14.14 11.09 0.16 3.97 18.26
14.04 11.06 0.15 3.99 18.18
0.19 0.01 0.02 -0.10 0.10
1.34 0.09 12.89 -2.49 0.56
54.01
54.47
53.97
53.89
54.59
54.23
0.22
0.40
2.19
2.20
2.20
2.20
2.20
2.20
0.01
0.50
Total non-OPEC supply Previous estimate Revision
56.20 56.30 -0.10
56.67 56.78 -0.11
56.17 56.28 -0.11
56.09 56.20 -0.11
56.79 56.90 -0.11
56.43 56.54 -0.11
0.23 0.24 -0.01
0.40 0.42 -0.02
Note: * 2017 = Forecast. Source: OPEC Secretariat.
Non-OPEC supply Non-OPEC supply growth in 2016 has been revised down by 100 tb/d since the October MOMR, driven by various downward revisions in 3Q16, namely 161 tb/d in Norway, 42 tb/d in the UK, 30 tb/d in the US, 28 tb/d in Malaysia, 21 tb/d in Kazakhstan and 30 tb/d in China. These were followed by downward revisions to 4Q16 in Norway, the UK, Malaysia, Colombia, Egypt, Azerbaijan and China due to weaker expectations for output, which was impacted by higher declines in mature fields and a lack of new project startups. These downward revisions to 2H16 were partially offset by upward revisions in Canada, Other OECD Europe, Russia and Kazakhstan. Graph 5.1: Non-OPEC quarterly oil supply, 2015-2017 mb/d 58
57
56
55
54 1Q
2Q
3Q 2015
4Q
1Q
2Q
3Q
2016 (Estimate)
4Q
1Q
2Q
3Q
4Q
2017 (Forecast)
Source: OPEC Secretariat.
OPEC Monthly Oil Market Report – November 2016
45
World Oil Supply The expected growth for 2017 was revised down by only 10 tb/d to average 0.23 mb/d, mainly in Norway, the UK, Malaysia and Kazakhstan, while the forecast for the US, Other OECD Europe, Colombia and China saw an upward revision. Non-OPEC oil supply is now forecast to contract by 0.78 mb/d in 2016, to average 56.20 mb/d. On a regional basis, OECD Americas was revised up by 21 tb/d to average 20.53 mb/d, indicating a contraction of 0.54 mb/d this year. Graph 5.2: Regional non-OPEC supply growth, y-o-y mb/d 1.0
15/14
16/15
17/16
0.8 0.6 0.4 0.2 0.0 -0.2 -0.4 -0.6 OECD Americas
OECD Europe
OECD Asia Pacific
Other Asia
Latin America
Middle East
Africa
FSU
China
Source: OPEC Secretariat.
In 2017, OECD Americas’ supply was revised up by 10 tb/d to show a reduced contraction of 0.16 mb/d next year. OECD Europe in 2016 was revised down by 77 tb/d to show a contraction of 10 tb/d this year to average 3.75 mb/d. A 10 tb/d decrease is also anticipated in 2017. OECD Asia Pacific figures have been left unchanged, showing a contraction of 20 tb/d for 2016 and steady production in 2017. Altogether, the OECD is expected to see contractions of 0.56 mb/d in 2016 and 0.17 mb/d in 2017. Graph 5.3: Non-OPEC quarterly supply change, 2016-2017, y-o-y change mb/d 2
mb/d 2
1
1
0.23
0
0
-1
-1 -0.78
-2 1Q
2Q
3Q
2016 (Estimate) OECD Americas Total DCs China 2017 annual avg. (RHS)
-2 4Q
1Q
2Q
3Q
4Q
2017 (Forecast) OECD Europe FSU ex. Russia Non-OPEC supply (RHS)
OECD Asia Pacific Russia 2016 annual avg. (RHS)
Source: OPEC Secretariat.
In the Developing Countries (DCs), a contraction of 90 tb/d is expected in 2016, mainly in Latin America, while growth of 0.29 mb/d is forecast for next year, with the main contributor being Latin America with growth of 0.22 mb/d. Despite the strong impact of low oil prices on supply in non-OPEC producers, growth in the FSU is expected at 0.16 mb/d and 0.19 mb/d in 2016 and 2017. In the latest forecast, China’s oil supply is
46
OPEC Monthly Oil Market Report – November 2016
World Oil Supply expected to see contractions of 0.29 mb/d and 0.10 mb/d in 2016 and 2017, respectively. Non-OPEC supply in 3Q16 is estimated to have grown by 0.29 mb/d q-o-q, due to increased production in OECD Americas, mainly from the Alberta province of Canada after it recovered from the wildfires in May. OECD Asia Pacific, Latin America and Africa, mainly Ghana and Congo also contributed. The incremental production in 3Q16 was partially offset by declines in OECD Europe, FSU and China. Non-OPEC supply forecast comparison in 2016 and 2017 at a glance Table 5.3: Non-OPEC supply forecast comparison in 2016 and 2017, mb/d 2016
Change 2016/15
2017
Change 2017/16
OECD Americas OECD Europe OECD Asia Pacific Total OECD
20.53 3.75 0.44 24.72
-0.54 -0.01 -0.02 -0.56
20.37 3.74 0.44 24.55
-0.16 -0.01 0.00 -0.17
Other Asia Latin America Middle East Africa Total DCs
2.71 5.11 1.28 2.11 11.22
-0.01 -0.08 0.01 -0.02 -0.09
2.72 5.33 1.26 2.20 11.50
0.01 0.22 -0.02 0.09 0.29
FSU Other Europe China
13.85 0.14 4.09
0.16 0.00 -0.29
14.04 0.15 3.99
0.19 0.02 -0.10
Non-OPEC production Processing gains Non-OPEC supply
54.01 2.19 56.20
-0.80 0.01 -0.78
54.23 2.20 56.43
0.22 0.01 0.23
Region
Note: * 2016 = Estimate and 2017 = Forecast. Source: OPEC Secretariat.
OECD Total OECD liquids production in 2016 is expected to contract by 0.56 mb/d to average 24.72 mb/d. This represents a downward adjustment of 56 tb/d from the October MOMR. Output in 3Q16 was revised down by 207 tb/d to average 24.53 mb/d, mainly due to the low performance in the North Sea, and the 4Q16 forecast by 118 tb/d, to 24.69 mb/d. In 2017, the forecast for OECD supply has also been revised down by 24 tb/d to average 24.55 mb/d, representing a contraction of 0.17 mb/d.
OECD Americas OECD Americas’ oil supply has been revised higher by 21 tb/d since the October MOMR to now show a contraction of 0.54 mb/d and an average of 20.53 mb/d. The revision is due to the fact that the previous forecast did not fully take into consideration the recovery in oil sands output in Alberta. For 2016, supply in the US and Mexico is expected to decline by 0.42 mb/d and 0.13 mb/d, respectively, while production in Canada is anticipated to see minor growth of 10 tb/d.
OPEC Monthly Oil Market Report – November 2016
47
World Oil Supply Graph 5.4: OECD Americas quarterly oil supply, 2015-2017
Graph 5.5: US quarterly oil supply, 2015-2017
mb/d
mb/d
21.5
14.5
21.0 14.0 20.5 13.5 20.0
19.5
13.0 1Q
2015
2Q
2016 (Estimate)
Source: OPEC Secretariat.
3Q
4Q
2017 (Forecast)
1Q 2015
2Q
2016 (Estimate)
3Q
4Q
2017 (Forecast)
Source: OPEC Secretariat.
US Total US oil production in 2016 is anticipated to decline by 0.42 mb/d to average 13.62 mb/d, representing an upward revision of 8 tb/d from the October MOMR. Domestic oil production is now expected to fall more slowly than previously anticipated due to the recent increase in rig counts and well completions. Nevertheless, total US supply for 3Q16 – based on actual data for July and August – with a downward revision of 30 tb/d from the previous MOMR, averages 13.50 mb/d, representing a decline of 30 tb/d. US crude oil production in August 2016 declined by 51 tb/d m-o-m and by 0.64 mb/d, or 6.8%, y-o-y to average 8.744 mb/d, despite there being 40 more rigs in August than in July. The decline was due to unexpectedly lower output in North Dakota, which dropped by 52 tb/d. US independent Hess has announced plans to step up drilling activity in the Bakken shale in 2017. Hess has lowered drilling and completion costs to $4.7 million/well, down by 11% from a year earlier. With the number of oil rigs rising by 84 over July, August and September to reach a total of 425 rigs, drilling for oil is expected to contribute to more domestic monthly oil production in the coming months. Crude output dropped by 171 tb/d in June, but decreased by only 18 tb/d and 51 tb/d in July and August, respectively. In Texas, crude oil production, which is coming from the two main tight oil plays of Eagle Ford and Permian, was more or less steady, showing a minor decline of 7 tb/d m-o-m to average 3.16 mb/d in August. Nevertheless, crude oil output increased m-o-m in the US Gulf at the end of seasonal maintenance, to average 1.65 mb/d, representing y-o-y growth of 1.2%. Oil production in Alaska also increased by 12.5% y-o-y to average 0.46 mb/d in August. US oil rig count The total US rig count increased by 12 to 569 rigs in the week ended 4 November, with 9 of these rigs added for oil fields. In all, 450 rigs were active in oil fields and 118 rigs for gas. This is still 202 less rigs than a year ago. In terms of oil rigs, there is still a gap of 122 rigs compared to a year ago, with a gap of 11 rigs in the US Gulf. Active horizontal rigs are 29 rigs lower, y-o-y.
48
OPEC Monthly Oil Market Report – November 2016
World Oil Supply
Rig
%
1,800 1,600 1,400 1,200 1,000 800 600 400 200
85 80 75 70 65
Oct 16
Jul 16
Apr 16
Jan 16
Oct 15
Jul 15
Apr 15
60
Oct 14
Oct 16
Jul 16
Apr 16
Jan 16
Oct 15
Jul 15
Apr 15
Jan 15
mb/d 9.8 9.6 9.4 9.2 9.0 8.8 8.6 8.4 8.2 8.0
Oct 14
Rigs 1,800 1,600 1,400 1,200 1,000 800 600 400 200
Graph 5.7: US weekly oil right count vs. horizontal drilling change
Jan 15
Graph 5.6: US weekly oil rig count vs. crude oil production
US weekly oil rig count (LHS)
US weekly oil rig count (LHS) Crude oil production (RHS)
Horizontal drilling change (RHS) Source: Baker Hughes.
Sources: Baker Hughes and EIA.
US liquids production in 2017 has been adjusted 10 tb/d higher this month to show a decline of 0.15 mb/d for the year to average 13.46 mb/d. US onshore crude oil is forecast to decline by 0.37 mb/d to average 6.86 mb/d in 2017. Table 5.4: US liquids production breakdown forecast, 2016-2017, tb/d Tight crude Gulf of Mexico crude Other crudes Unconventional NGL Other NGL Biofuels + Other liquids US total supply
2014 3,926 1,397 3,441 1,594 1,420 1,238
2015 4,524 1,515 3,376 1,961 1,382 1,283
Change 598 118 -65 367 -39 45
2016 3,910 1,625 3,324 2,183 1,280 1,295
Change -614 110 -52 222 -102 11
2017 3,628 1,775 3,234 2,260 1,250 1,315
Change -282 150 -90 77 -30 20
13,017
14,041
1,024
13,617
-424
13,462
-155
Note: * 2016 = Estimate and 2017 = Forecast. Source: OPEC Secretariat.
Graph 5.8: Trend of US oil production's components, 2005-2017 mb/d 14 12 Unconventional sources
10 8 6 4
Conventional sources
2 0 2005 2006 2007 2008 2009 2010 2011 2012 2013 2014 2015 2016* 2017* Other crudes
Gulf of Mexico crude
Other NGL
Biofuels + Other liquids
Tight crude
Unconventional NGL
Note: * 2016 = Estimate and 2017= Forecast. Source: OPEC Secretariat.
Some of the declines in onshore crude will be offset by growth of 0.15 mb/d in the US Gulf. Moreover, NGL and biofuel output is expected to increase by 47 tb/d and 20 tb/d, respectively. The main component of US oil output – tight oil – is forecast to
OPEC Monthly Oil Market Report – November 2016
49
World Oil Supply contract by 0.28 mb/d y-o-y. Growth in US Gulf oil production in 2017 will mostly be on the back of ramp-ups of projects implemented in 2016. Graph 5.9: US liquids vs. non-OPEC supply, q-o-q growth mb/d 0.4
0.36
0.3 0.2
0.07
0.1
0.03
0.03
0.06 0.04
0.06 0.02
0.08 0.04
-0.02
-0.03
-0.04
4Q16
1Q17
2Q17
0.15
0.05 0.03 0.02
0.21 0.15
0.07
0.0 -0.1 -0.2 -0.3
-0.08
-0.12 -0.19 -0.28
-0.4 1Q16
2Q16
3Q16
US liquids growth
Non-OPEC supply excl. US
3Q17
4Q17
Total liquids growth
Source: OPEC Secretariat.
Canada and Mexico Oil supply in Canada recovered in July, rising by 0.68 mb/d compared to June, to average 4.62 mb/d, mainly due to an Alberta oil sands contribution of 0.6 mb/d. According to official data, oil supply in 1Q, 2Q and 3Q16 has been revised up by 54 tb/d, 56 tb/d and 14 tb/d, respectively. Hence, annual oil production in 2016 was revised up by 31 tb/d to average 4.43 mb/d, indicating growth of 10 tb/d. Preliminary estimates by Canadian national sources reported an increase of about 0.6 mb/d in oil sands output in July following an increase of 83 tb/d in NGL production. The number of active rigs in Canada more than double to 152 land rigs in the weekended 4 November 2016. The share of oil and gas rigs in Canada at this time is equal, at 50% each. Oil supply in 2H16 is expected to be 0.21 mb/d higher than in 1H16. Table 5.5: Canadian oil sand projects in 2016 Project
Operator
Method
Vawn Lloyd Thermal Project Edam East Thermal ** Edam West Thermal Christina Lake Phase 1F Horizon Phase 2B Foster Creek Phase G
Husky Energy * Husky Energy Husky Energy Cenovus Energy CNR Cenovus Energy
Steam-assisted gravity Steam-assisted gravity Steam-assisted gravity Steam-assisted gravity Bitumen to SCO Dteam-assisted gravity
drainage drainage drainage drainage drainage
tb/d
Start-up
10.0 10.0 4.5 50.0 45.0 40.0
3Q 16 2Q 16 3Q 16 2H 16 4Q 16 3Q 16
Note: * Husky’s heavy oil production is currently ab out 135 tb /d, 74 tb /d of which come from thermal projects. The three new Saskatchewan projects are expected to add an additional 24.5 tb /d of production capacity. ** The 10 tb /d Edam East project officially opened on 1 March 2016 and took seven weeks to reach production after steaming operations b egan, according to the Calgary-b ased company, 19 April 2016. The company said in March that it expected 40% of overall production to come from low sustaining capital projects like its new heavy oil thermal operations b y the end of 2016, up from 8% in 2010. Source: OPEC Secretariat b ased on companies' report.
Oil sands output in 3Q16 is expected to increase by 0.54 mb/d over the previous quarter to average 2.52 mb/d, as upgraders return to work and total liquids’ production is anticipated to reach 4.51 mb/d. By adding the upgraders, higher synthetic crude output is expected to be online in the coming months, but there is still a gap of about 300 tb/d in order to reach last year’s level of 0.95 mb/d.
50
OPEC Monthly Oil Market Report – November 2016
World Oil Supply Graph 5.10: Canada production by crude type
Graph 5.11: Canada production by crude type, y-o-y change
mb/d 2.7
mb/d 0.50
2.4 0.25
2.1 1.8
0.00
1.5 -0.25
Synthetic crude + Crude bitumen
Synthetic crude + Crude bitumen
Conventional
Conventional
Source: OPEC Secretariat.
Oct 16
Oct 15
Oct 14
Oct 13
Oct 12
-0.50
Oct 11
Oct 16
Oct 15
Oct 14
Oct 13
Oct 12
Oct 11
Oct 10
0.9
Oct 10
1.2
Source: OPEC Secretariat.
Canada is expected to be the third largest source of non-OPEC supply growth after Brazil and Kazakhstan in 2017, expanding by 0.17 mb/d y-o-y to 4.60 mb/d. Growth will come mainly from the ramp-up of oil sands projects (Surmont 2, Christian Lake, Sunrise and Kearl), as well as new startups of heavy oil thermal projects (Edam East, West and Vawm) in 2017. Graph 5.12: Canada quarterly oil supply, 2015-2017
Graph 5.13: Mexico quarterly oil supply, 2015-2017
mb/d
mb/d
4.8
2.9
4.6
2.4
4.4
1.9
4.2 1.4 4.0 0.9
3.8
0.4
3.6
-0.1
3.4 1Q 2015
2Q 2016 (Estimate)
3Q
4Q
2017 (Forecast)
Source: OPEC Secretariat.
1Q 2015
2Q 2016 (Estimate)
3Q
4Q
2017 (Forecast)
Source: OPEC Secretariat.
Mexican liquids production in 2016 is expected to decline by 0.13 mb/d to average 2.47 mb/d, revised down by 10 tb/d compared to the October MOMR. Total Mexican oil supply in September declined by 50 tb/d to average 2.42 mb/d, the lowest level seen since October 1995. According to Pemex, crude oil and NGL output declined in September by 31 tb/d and 18 tb/d m-o-m, to average 2.11 mb/d and 0.30 mb/d, respectively. Mexican oil supply declined in 3Q16 by 0.14 mb/d or 5.4% y-o-y and is estimated to experience a higher decline of 0.18 mb/d in 4Q16 compared to the same period a year ago.
OPEC Monthly Oil Market Report – November 2016
51
World Oil Supply Following steep declines in smaller domestic fields and a cut in spending by Pemex, Mexico plans to shut down parts of its low-profile oilfields. The Pemex budget for 2017 is expected to fall by $4.6 bn from this year to $21 bn. The Mexican government said it expects domestic crude production to decline to just over 1.9 mb/d in 2017 from around 2.2 mb/d currently. Next year, the country’s total liquids’ production is forecast to decline by 0.18 mb/d to average 2.30 mb/d.
OECD Europe OECD Europe oil supply is expected to decline this year by 10 tb/d, to average 3.75 mb/d, revised down by 77 tb/d in this month’s analysis. The reason for this revision is the lower-than-expected output in Norway and the UK in 3Q16, which was carried over to the rest of the year. In contrast, the growth forecast in Other OECD Europe countries has been revised up by 11 tb/d since the October MOMR. Norway’s oil supply is expected to grow by 20 tb/d from the previous year to average 1.96 mb/d in 2016, revised down by 68 tb/d from the previous MOMR. Preliminary production figures for September 2016 showed an average production of 1.59 mb/d for crude oil, NGLs and condensates, which was 0.34 mb/d, or about 18%, lower than in August 2016. Oil production in September was about 11% below the year-ago level and 4% below the forecast issued by the Norwegian Petroleum Directorate (NPD). The main reason for these huge drops is that several fields were closed for maintenance, although production from Goliat started again on 27 September. The NPD has granted consent for production startup on the Ivar Aasen field in the North Sea. The operator, AkerBP, has scheduled the startup for December. Despite this development, Norwegian oil supply is likely to contract by 10 tb/d next year. Graph 5.14: Norway quarterly oil supply, 2015-2017
Graph 5.15: UK quarterly oil supply, 2015-2017
mb/d
mb/d
2.1
1.2 1.0
2.0 0.8 1.9
0.6 0.4
1.8 0.2 1.7
0.0 1Q 2015
2Q 2016 (Estimate)
Source: OPEC Secretariat.
3Q
4Q
2017 (Forecast)
1Q 2015
2Q 2016 (Estimate)
3Q
4Q
2017 (Forecast)
Source: OPEC Secretariat.
The UK’s oil supply, despite higher maintenance this year, is predicted to increase by 50 tb/d in 2016 y-o-y to average 1.02 mb/d, revised down by 20 tb/d from the October MOMR. UK oil production in 3Q16 was previously expected to decline by 70 tb/d because of maintenance at different fields, but the actual output in August and
52
OPEC Monthly Oil Market Report – November 2016
World Oil Supply September dropped by about 0.14 mb/d compared to July. Therefore, the 3Q16 and 4Q16 estimates were revised down by 42 tb/d and 30 tb/d, respectively. A decline of 10 tb/d is also forecast for the UK next year.
Developing Countries Total oil production from DCs was revised down this month by 33 tb/d to average 11.22 mb/d in 2016, a contraction of 0.09 mb/d compared with growth of 0.20 mb/d and 0.25 mb/d in 2015 and 2014, respectively. One of the main reasons for this year’s decline is lower output levels coming from Latin America, which is partially due to lower spending and fewer new projects. For 2017, growth of 0.29 mb/d is anticipated in DCs, and total oil supply is forecast to average 11.50 mb/d.
Latin America Latin America’s oil supply is estimated to decline by 0.08 mb/d to average 5.11 mb/d in 2016, revised down by 10 tb/d from the October MOMR. Latin America, which was the second highest driver of growth among all non-OPEC regions in recent years, is now expected to contract in 2016, due to heavy declines in Colombia and lower growth in Brazil compared with the remarkable growth seen in 2014 and 2015. For 2017, supply is expected to grow by 0.22 mb/d in Latin America, to reach an average of 5.33 mb/d. Brazil’s liquid supply is expected to average 3.14 mb/d in 2016, an increase of 0.08 mb/d over the previous year, unchanged from the October MOMR. Petrobras set more oil and gas production records in the months of August and September. Preliminary production data indicates that Brazilian liquids supply in 3Q16 increased by 0.17 mb/d to average 3.26 mb/d, consisting of 2.61 mb/d of crude oil, 0.1 mb/d of NGLs and 0.55 mb/d of biofuels. Petrobras plans to connect just 64 production and injection wells this year, with the majority of them in the Santos pre-salt fields, down from 73 in 2015 and a peak of 87 in 2014. Despite this reduction, well productivity increased remarkably – rising above the global average – with some pre-salt wells already producing around 35 tb/d. Some 25 wells were completed from January to June, and another 39 have been scheduled for the remainder of this year, including 11 pre-salt production wells. Brazil’s Petrobras will begin seeking offers in 2017 for the construction of seven new offshore oil platforms envisioned in its current investment plans. Petrobras has planned to add these seven FPSOs in the Santos Basin: three in the Lula field – including Lula South (FPSO P-66) and Lula South Extension (FPSO P-68) – two in the Buzios field, one in the Lapa field and one at the giant Libra area. Oil production is expected to increase by 0.25 mb/d to average 3.40 mb/d when these seven new projects materialize next year. Petrobras is seeking to ramp up production as part of a five-year, $74.1-billion capital-spending plan announced in late September. It slashed investments from a prior plan by 25%, seeking to refocus on core operations. Brazil's transition government is working on various reforms aimed at attracting investors to three bid rounds planned for next year, including a sub-salt auction planned for 2H17. That auction will cover four fields – Carcara, Gato do Mato, Tartaruga Mestica and Sapinhoa – with sub-salt reservoirs extending beyond existing concessions, known as unitization areas. Government officials say the law should be sanctioned by year-end.
OPEC Monthly Oil Market Report – November 2016
53
World Oil Supply Graph 5.16: Brazil quarterly oil supply, 2015-2017
Graph 5.17: Colombia quarterly oil supply, 2015-2017
mb/d
mb/d
4.0
1.20
3.5
1.00
3.0 0.80
2.5
0.60
2.0 1.5
0.40
1.0 0.20
0.5
0.00
0.0 1Q 2015
2Q 2016 (Estimate)
Source: OPEC Secretariat.
3Q
1Q
4Q
2017 (Forecast)
2015
2Q
2016 (Estimate)
3Q
4Q
2017 (Forecast)
Source: OPEC Secretariat.
Colombia Oil production in Colombia is estimated to decline by 0.11 mb/d to average 0.92 mb/d in 2016, following a downward revision of 10 tb/d from the previous MOMR. Statecontrolled Ecopetrol restarted the 220 tb/d Cano Limon-Coveñas crude pipeline on 10 September. This pipeline transports crude from US Occidental's Cano Limon complex and also receives other Llanos Basin crude from the 120 tb/d Bicentenario pipeline. Ecopetrol says all pipelines are currently operating normally, except the 85 tb/d Transandino, which is out of service for maintenance. Oil production in Colombia is also expected to decline in 2017, but at a slower pace of 20 tb/d to average 0.9 mb/d. The forecast is uncertain due to several factors – lower output because of limited pipelines or possible y-o-y growth coming from an improvement in oil prices.
Middle East Non-OPEC oil supply from the Middle East is estimated to increase by 10 tb/d in 2016 to average 1.28 mb/d. A decline of 20 tb/d to average 1.26 mb/d is expected for 2017, due to lower output forecast in Bahrain and Oman. News reports indicate that efforts are being made to resume production in Yemen. The news concerned the lifting of some 3 mb of crude stored at the southern oil port of Ash Shihr. Hence, the possibility of restarting production from the Masila Basin fields in eastern Hadramawt province remains. Production from Marib and exports from the western oil port of Ras Issa remain suspended, but the eastern area, including Hadramawt, could see a possible restart of production and exports. The two blocks are capable of a combined 65 tb/d and are linked to Ash Shihr by the coast. Sources say production restarted at the PetroMasila-operated Blocks 10 and 14, two of the country's largest upstream assets. Nearby Blocks 51 and 53, which are also operated by state oil companies, have likewise restarted and were pumping at a combined rate of 30 tb/d in late September.
54
OPEC Monthly Oil Market Report – November 2016
World Oil Supply
Africa Africa’s oil supply is projected to average 2.11 mb/d in 2016, representing a decline of 20 tb/d y-o-y and a downward revision of 10 tb/d from the October MOMR. In 2016, oil production from Congo is expected to grow by 50 tb/d to average 0.31 mb/d. Output in other African countries is seen declining by 20 tb/d, to average 0.3 mb/d in 2016, despite increasing output from Ghana’s production startup in the “TEN” project and the production ramp-up at the Jubilee field in 2H16. In 2017, Congo and “Africa Other” – supported by Ghana – are anticipated to increase by 70 tb/d and 60 tb/d, respectively. As result, overall oil supply in Africa will grow by 90 tb/d, averaging 2.20 mb/d next year.
FSU, other regions Total FSU oil supply is expected to grow by 0.16 mb/d in 2016 to average 13.85 mb/d, an upward revision of 15 tb/d from the previous report. In 2016, oil production in Russia and Azerbaijan will increase, while decreasing in Kazakhstan – despite the early startup of the Kashagan field in October – and in FSU Others. The oil production growth forecast for 2017 was revised down this month by 8 tb/d to 0.19 mb/d due to a minor adjustment in Kazakh production next year. Graph 5.18: FSU quarterly oil supply, 2015-2017
Graph 5.19: Russia quarterly oil supply, 2015-2017
mb/d
mb/d
14.2
11.2 11.1 11.1 11.0 11.0 10.9 10.9 10.8 10.8 10.7 10.7
14.1 14.0 13.9 13.8 13.7 13.6 13.5 13.4 13.3 1Q 2015
2Q 2016 (Estimate)
3Q
4Q
2017 (Forecast)
Source: OPEC Secretariat.
1Q 2015
2Q
2016 (Estimate)
3Q
4Q
2017 (Forecast)
Source: OPEC Secretariat.
Russia Russian oil output is expected to increase by 0.20 mb/d – revised up by 12 tb/d from the October MOMR – to average 11.05 mb/d in 2016. Official data showed crude oil output increased by 90 tb/d in October, to average 10.59 mb/d, while NGL production was steady at 0.73 mb/d. As a result, Russia’s oil production in October reached 11.32 mb/d, an increase of 0.45 mb/d y-o-y, which is about three times the growth seen between October 2014 and October 2015. Nevertheless, crude oil exports in October did not increase compared to September. For next year, Russia is expected to see minor growth of 10 tb/d. Oil production in Russia is increasing through the addition of new production coming from the Vostochno-Messoyakhskoye (East Messoyakh) field, Russia’s northernmost onshore field, harboring recoverable crude oil and gas condensate reserves of 2.49 billion barrels. Oil production flowed commercially from 21 September, with production planned at
OPEC Monthly Oil Market Report – November 2016
55
World Oil Supply 44 tb/d this year. Rosneft also aims to launch the Suzunskoye field this October as part of the Vankor cluster of fields. Suzunskoye’s output would be at around 90 tb/d. Additional new volume in Russia from Lukoil’s Filanovsky field in the Caspian Sea came onstream on 31 October with total output of 70 tb/d forecast for this year. A week earlier, Lukoil also started up its 30 tb/d Pyakyakhinskoye field on 25 October.
Caspian Kazakhstan’s oil production was revised up by 10 tb/d to now show a lesser decline of 30 tb/d for the year 2016, yet with growth of 0.26 mb/d forecast for 4Q16. This growth was partially due to the Tengiz field returning to full production after some of the heaviest-ever maintenance and from the Kashagan ramp-up. Crude oil output in September increased by 0.23 mb/d, compared with August, to average 1.23 mb/d, and total liquids supply reached 1.50 mb/d. Growth of 0.21 mb/d is forecast next year for an average of 1.77 mb/d. Azerbaijan’s oil supply is anticipated to average 0.87 mb/d, indicating minor growth of 10 tb/d in 2016. Azeri crude oil output in August was 40 tb/d less than in July to average 0.77 mb/d, according to JODI. Crude plus NGLs was pegged at 0.85 mb/d. The level of production is expected to increase in the coming months due to the continuation of heavy maintenance at the Deepwater Guneshli platform. It is anticipated that oil output will decline by 30 tb/d to average 0.84 mb/d next year. Graph 5.20: Kazakhstan quarterly oil supply, 2015-2017
Graph 5.21: China quarterly oil supply, 2015-2017
mb/d
mb/d
2.0
4.50
1.5
4.25
1.0
4.00
0.5
3.75
0.0
3.50 1Q 2015
2Q 2016 (Estimate)
Source: OPEC Secretariat.
3Q
4Q
2017 (Forecast)
1Q 2015
2Q
2016 (Estimate)
3Q
4Q
2017 (Forecast)
Source: OPEC Secretariat.
China China’s supply in 2016 is expected to contract by 0.29 mb/d from the previous year to average 4.09 mb/d. This represents a downward revision of 28 tb/d from the previous report, due to the weaker q-o-q production performance of 110 tb/d in 3Q16. Chinese crude oil output increased by 29 tb/d to 3.90 mb/d m-o-m in September, following a drop of 64 tb/d in August. China also produced around 100 tb/d of unconventional fuels such as coal-to-liquids (CTL), biodiesel and ethanol. In late September, CNOOC started production from the Enping 18-1 oilfield in the South China Sea. Currently, three wells are online producing around 2 tb/d. Within a year, production should reach the intended peak of roughly 11.8 tb/d. Declining oil output in China could be attributed to hefty spending cuts in 2016 by major Chinese oil companies CNPC, Sinopec and CNOOC.
56
OPEC Monthly Oil Market Report – November 2016
World Oil Supply In 2017, oil production is expected to continue in the same direction, but at a slower pace, dropping by 0.10 mb/d y-o-y to an average of 3.99 mb/d. Offshore companies plan to start up new projects at Chunxiao, Weizhou 11-4 North Phase II and Enping 231 in 2017, but the main state-owned oil companies have cut their capital expenditures, as well as output.
OPEC NGLs and non-conventional oils Output of OPEC NGLs and non-conventional liquids is estimated to average 6.29 mb/d in 2016, unchanged from the previous MOMR and representing growth of 0.16 mb/d over the previous year. In 2017, production of OPEC NGLs and non-conventional liquids is projected to average 6.43 mb/d, also unchanged and representing an increase of 0.15 mb/d over the previous year. Table 5.6: OPEC NGLs + non-conventional oils, 2014-2017
Total OPEC
2014 2015 6.00 6.13
Change 15/14 0.13
1Q16 6.24
2Q16 6.27
3Q16 6.30
4Q16 2016 6.34 6.29
Change Change 16/15 2017 17/16 0.16 6.43 0.15
Note: 2016 = Estimate and 2017 = Forecast. Source: OPEC Secretariat.
OPEC crude oil production According to secondary sources, OPEC crude oil production in October increased by 0.24 mb/d compared to the previous month to average 33.64 mb/d. Crude oil output increased the most in Nigeria, Libya and Iraq, while production in Angola showed the largest decline. Table 5.7: OPEC crude oil production based on secondary sources, tb/d Algeria Angola Ecuador Gabon Indonesia Iran, I.R. Iraq Kuwait Libya Nigeria Qatar Saudi Arabia UAE Venezuela
2015 1Q16 2Q16 3Q16 Aug 16 Sep 16 Oct 16 2014 1,123 1,106 1,092 1,084 1,089 1,088 1,086 1,088 1,654 1,754 1,766 1,772 1,769 1,786 1,751 1,586 544 544 543 549 547 543 550 549 222 219 219 217 217 221 212 202 695 696 714 723 726 726 724 722 2,778 2,840 3,096 3,539 3,644 3,647 3,663 3,690 3,270 3,938 4,242 4,290 4,394 4,375 4,472 4,561 2,781 2,730 2,765 2,731 2,810 2,810 2,825 2,838 470 405 370 312 311 270 360 528 1,953 1,865 1,785 1,547 1,437 1,419 1,458 1,628 714 667 667 662 655 657 640 646 9,688 10,123 10,147 10,301 10,597 10,603 10,583 10,532 2,759 2,859 2,815 2,861 2,979 2,976 2,993 3,007 2,361 2,357 2,278 2,177 2,105 2,107 2,090 2,067
Oct/Sep 2.2 -165.0 -0.3 -10.8 -2.0 27.5 88.3 13.3 167.5 170.2 5.8 -51.7 14.5 -22.8
Total OPEC
31,012 32,103 32,500 32,764 33,279 33,227 33,407 33,643
236.7
Note: Totals may not add up due to independent rounding. Source: OPEC Secretariat.
OPEC Monthly Oil Market Report – November 2016
57
World Oil Supply Table 5.8: OPEC crude oil production based on direct communication, tb/d 2014 2015 1Q16 2Q16 3Q16 Aug 16 Sep 16 Oct 16 1,193 1,157 1,128 1,126 1,162 1,159 1,182 1,171 1,654 1,767 1,773 1,730 1,720 1,747 1,649 1,507 557 543 548 554 551 549 560 542 .. .. .. .. .. .. .. .. 697 690 739 739 743 742 742 .. 3,117 3,152 3,385 3,570 3,653 3,630 3,710 3,920 3,110 3,504 4,598 4,523 4,666 4,622 4,774 4,776 2,867 2,859 3,000 2,934 2,969 2,987 2,970 3,000 480 .. .. .. .. .. .. .. 1,807 1,748 1,667 1,485 1,209 1,104 1,253 1,476 709 656 675 655 644 643 610 639 9,713 10,193 10,225 10,360 10,651 10,630 10,650 10,625 2,794 2,989 2,944 3,035 3,174 3,154 3,186 3,188 2,683 2,654 2,510 2,392 2,331 2,303 2,334 2,316
Algeria Angola Ecuador Gabon Indonesia Iran, I.R. Iraq Kuwait Libya Nigeria Qatar Saudi Arabia UAE Venezuela Total OPEC
..
..
..
..
..
..
..
Oct/Sep -11.0 -142.0 -18.1 .. .. 210.0 2.0 30.0 .. 223.1 28.4 -25.0 2.0 -17.8
..
..
Note: Totals may not add up due to independent rounding. .. Not availab le. Source: OPEC Secretariat.
World oil supply Preliminary data indicates that global oil supply increased by 0.97 mb/d in October to average 96.32 mb/d. The increase in non-OPEC supply – including OPEC NGLs – of 0.74 mb/d and OPEC crude oil of 0.24 mb/d boosted global oil output in October. The share of OPEC crude oil in total global production stood at 34.9% in October, down 0.1% from the month before. Estimates are based on preliminary data for non-OPEC supply, direct communication for OPEC NGLs and non-conventional liquids, and secondary sources for OPEC crude oil production. Graph 5.22: OPEC and world oil supply mb/d 34
mb/d 97
OPEC crude production (LHS)
Oct 16
Sep 16
Aug 16
Jul 16
Jun 16
May 16
Apr 16
Mar 16
Feb 16
Jan 16
Dec 15
Nov 15
Oct 15
90
Sep 15
27
Aug 15
91
Jul 15
92
28
Jun 15
29
May 15
93
Apr 15
94
30
Mar 15
31
Feb 15
95
Jan 15
32
Dec 14
96
Nov 14
33
World supply (RHS)
Source: OPEC Secretariat.
58
OPEC Monthly Oil Market Report – November 2016
Product Markets and Refinery Operations
Product Markets and Refinery Operations Product markets in the Atlantic Basin continued strengthening during October on the back of positive performance at the middle of the barrel as stronger demand and falling inventories allowed gasoil crack spreads to sharply recover. At the top of the barrel, gasoline got support from some outages, fuelling tightening sentiment. Meanwhile, Asian margins remained healthy, supported by stronger regional demand amid peak refinery maintenance in the region. Graph 6.1: Refinery margins US$/b
US$/b
WTI (US Gulf)
Brent (Rotterdam)
Oct 16
Sep 16
Aug 16
Jul 16
Jun 16
May 16
0
Apr 16
0
Mar 16
5
Feb 16
5
Jan 16
10
Dec 15
10
Nov 15
15
Oct 15
15
Oman (Singapore)
Sources: Argus Media and OPEC Secretariat.
US middle distillate demand showed a strong recovery, hitting 4.0 mb/d in October. The sharp increase seen in domestic demand, amid a heavy maintenance season and higher export opportunities, allowed inventories to reverse the upward movement seen in recent months, fueling tight sentiment with the onset of the winter season. In addition, despite seasonally lower gasoline demand following the end of the driving season, gasoline margins strengthened. US Gulf Coast (USGC) refinery margins for WTI crude gained 25¢ versus the previous month to average around $6.4/b during October. Product markets in Europe continued strengthening during October, with gasoline gaining momentum from stronger export opportunities, while the continued recovery witnessed at the middle of the barrel on the back of stronger demand and slowing inflows to the region have allowed gasoil crack spreads to hit their highest level this year. The refinery margin for Brent crude in Northwest Europe showed a gain of more than $1.5 versus the previous month to average $7/b during October. The Asian market continued to be supported during October and refinery margins retained part of the recovery seen in the previous month on the back of firm regional demand amid tightening sentiment fueled by the peak of the refinery maintenance season in the region. Continued strengthening at the middle of the barrel also lent support to the market. Refinery margins in Singapore averaged around $8/b in October, maintaining a healthy level, although falling slightly by 40¢ versus the previous month.
OPEC Monthly Oil Market Report – November 2016
59
Product Markets and Refinery Operations
Refinery operations Refinery utilization in the US averaged around 86% in October, corresponding to 15.5 mb/d, falling sharply by around 1 mb/d versus the previous month, though achieving a level similar to that of the same month a year ago. Refinery levels slowed after peaking in August, following the end of the driving season and amid the peak of refinery maintenance. The sector was also impacted by some outages, including limited operations on the Colonial Pipeline, as well as by hurricane Matthew. Graph 6.2: Refinery utilisation rates %
US
Japan
Oct 16
Sep 16
Aug 16
Jul 16
Jun 16
Feb 16
EU-16
May 16
70
Apr 16
70
Mar 16
80
Jan 16
80
Dec 15
90
Nov 15
90
Oct 15
100
% 100
Singapore
Sources: Argus Media and OPEC Secretariat.
European refinery runs averaged around 89% of capacity in September, corresponding to a throughput of 10.5 mb/d, which was around 190 tb/d lower than in the previous month and 80 tb/d lower than the same month a year ago. Refinery runs fell, impacted by heavy maintenance and a stock overhang from previous months. In Asia, refinery utilization rates dropped, impacted by peak refinery maintenance in the region amid some outages. Refinery runs in India averaged 4.7 mb/d during September, around 100 tb/d lower than in the previous month, as the sector was impacted by maintenance activities. China averaged 10.6 mb/d, following maintenance seen at several teapots refineries. Refinery runs in Singapore for September averaged around 90%, 1 pp lower than in previous months, while Japanese throughput averaged 74% of capacity in October, 8 pp lower than the previous month.
US market US gasoline demand stood at around 9.1 mb/d in October, approximately 240 tb/d lower than in the previous month and more than 150 tb/d lower than in the same month a year earlier. Despite seasonally lower gasoline demand following the end of the driving season, gasoline margins strengthened during October on the back of tightening sentiment, fueled by several factors. A heavy refinery maintenance season amid concerns about the potential impact of hurricane Matthew and limited capacity on the Colonial Pipeline contributed to tightening in the gasoline market. Additional support came from increasing exports to Latin America amid falling inventories. The gasoline crack spread gained more than $1 compared with the previous month’s level to average $20/b in October.
60
OPEC Monthly Oil Market Report – November 2016
Product Markets and Refinery Operations Graph 6.3: US Gulf crack spread vs. WTI US$/b
US$/b
30
30
20
20
10
10
0
0
Premium gasoline
Jet/Kerosene
Diesel
Nov 16
Oct 16
Sep 16
Aug 16
Jul 16
Jun 16
May 16
Apr 16
Mar 16
Feb 16
Jan 16
-20
Dec 15
-20
Nov 15
-10
Oct 15
-10
Fuel oil
Sources: Argus Media and OPEC Secretariat.
Middle distillate demand stood at around 4.1 mb/d in October, more than 450 tb/d higher than in the previous month and around 80 tb/d higher than in the same month a year earlier. The middle distillate market continued receiving support from higher export opportunities to Latin America, which, along with the sharp increase seen in domestic demand, amid a heavy maintenance season, allowed inventory levels to reverse the trend from previous months. They dropped by around 10 mb , thus easing the overhang and fueling tightening sentiment with the onset of the winter season. The USGC gasoil crack spread averaged around $9.4/b in October, gaining almost $1 from the previous month. At the bottom of the barrel, the fuel oil market weakened during October due to slower domestic demand amid pressure coming from the supply side with increasing volumes of high sulfur fuel oil (HSFO) arriving at the USGC from Europe and rising inventories. The USGC HSFO crack dropped by more than $1 to average minus $9/b in October. Meanwhile, low-sulfur vacuum gasoil (VGO) demand picked up for use as secondary feedstock due to heavy distillation unit maintenance in the region.
European market Product markets in Europe continued strengthening during October, with gasoline supported by stronger export opportunities. The continued recovery witnessed at the middle of the barrel on the back of stronger demand and slowing inflows to the region also supported the market. The gasoline market continued to be supported by increasing arbitrage to the US, due to tightening sentiment in the USEC and higher export opportunities to Latin America and Africa, mainly to Nigeria and Egypt. Additional support came from the supply side as refinery maintenance caused reduced output, fueling tightening sentiment to the market. The gasoline crack spread against Brent saw an increase of 50¢ from the previous month to average around $20.4/b during October. The light distillate naphtha crack continued to recover, gaining more than $2/b in October, on the back of an opening in arbitrage to Asia. Additional support came from news that two crackers in the region were re-starting and on expectations of increasing demand for petrochemical feedstock, with a seasonal upside in LPG prices.
OPEC Monthly Oil Market Report – November 2016
61
Product Markets and Refinery Operations Graph 6.4: Rotterdam crack spreads vs. Brent US$/b
US$/b
30
30
20
20
10
10
0
0
Premium gasoline
Jet/Kerosene
Gasoil
Nov 16
Oct 16
Sep 16
Aug 16
Jul 16
Jun 16
May 16
Apr 16
Mar 16
Feb 16
Jan 16
-20
Dec 15
-20
Nov 15
-10
Oct 15
-10
Fuel oil
Sources: Argus Media and OPEC Secretariat.
The European gasoil market continued showing strong recovery on the back of support from firm domestic demand and tight sentiment, fueled by slower inflows into the region. Refinery maintenance and increasing demand in several regions kept inflows slow, with some sources reporting September and October inflows at only half of the levels seen in the second quarter. US exports of gasoil to Europe slowed due to dropping inventory levels, which tightened availability of winter grade gasoil in Europe. In addition, Russian volumes were thin due to maintenance and preparation for the winter season. Meanwhile, requirements for Black Sea volumes from Turkey and Lebanon were on the rise. The gasoil crack spread against Brent crude at Rotterdam showed a sharp gain of almost $3 to average around $12/b in October, hitting the highest level seen this year. At the bottom of the barrel, the fuel oil market continued its recovery trend on the back of stronger regional bunker demand amid recent open arbitrage opportunities to Singapore, lending support with increasing export volumes, despite the rise seen recently in VLCC freight rates. On the other hand, the market witnessed some pressure due to several cargoes waiting at Alexandria port to discharge. The NWE fuel oil crack gained more than $1 compared with the previous month to average around minus $6/b in October.
Asian market The Asian market retained part of the recovery seen the previous month on the back of firm regional demand amid tight sentiment, fueled by the peak of the maintenance season in the region. Continued strengthening at the middle of the barrel offset the slight weakening seen in gasoline and fuel oil margins. The Asian gasoline market partially retained the strong recovery seen in previous months, supported by the supply side, as peaking refinery maintenance in the region reduced supplies and caused exports from India, China and South Korea to fall, thus tightening market sentiment. Additional support came from some arbitrage opportunities to the USEC.
62
OPEC Monthly Oil Market Report – November 2016
Product Markets and Refinery Operations The gasoline crack spread against Oman crude in Singapore averaged around $11/b in October, falling slightly by 40¢ compared with the previous month’s level. Any uptick was negated by the approaching end of the maintenance season. The Singapore naphtha crack remained flat in October as support from the demand side with the return from maintenance of cracker capacity was offset by news of operations starting at a condensate splitter unit in Qatar. In the coming weeks an upside in the naphtha crack spread is expected, with more crackers back from maintenance and less competition from seasonal increasing prices in LPG. Graph 6.5: Singapore crack spread vs. Oman US$/b
US$/b 30
30
20
20
10
10
0
0
Premium gasoline
Jet/Kerosene
Gasoil
Nov 16
Oct 16
Sep 16
Aug 16
Jul 16
Jun 16
May 16
Apr 16
Mar 16
Feb 16
Jan 16
-20
Dec 15
-20
Nov 15
-10
Oct 15
-10
Fuel oil
Sources: Argus Media and OPEC Secretariat.
At the middle of the barrel, the gasoil crack spread continued to recover in October on the back of stronger regional demand amid peak refinery maintenance. Firm East of Suez domestic consumption tightened the market with significantly fewer Indian and Middle East cargoes en route to Europe, while additional support came from increasing export opportunities to Africa. On the other hand, demand continued to show a typical seasonal rise, boosted by harvest season requirements in the northern Asian region. The gasoil crack spread in Singapore against Oman averaged around $12.4/b in October, gaining more than $1 compared with the previous month. The Asian fuel oil market partially lost the ground it had gained the previous month due to supply-side pressure as exports from Japan rose amid expectations of increasing inflows from the West. In addition, availability from the Middle East is set to increase following the summer season due to lower power requirements. The fuel oil crack spread in Singapore against Oman averaged about minus $5/b in October, losing 70¢ from the previous month. Losses were capped by the growing demand from the power sector, with higher requirements from South Korea and Taiwan.
OPEC Monthly Oil Market Report – November 2016
63
Product Markets and Refinery Operations Table 6.1: Refined product prices, US$/b Sep 16
Oct 16
Change Oct/Sep
Year-to-date 2016 2015
US Gulf (Cargoes FOB): Naphtha* Premium gasoline (unleaded 93) Regular gasoline (unleaded 87) Jet/Kerosene Gasoil (0.2% S) Fuel oil (3.0% S)
45.45 64.10 59.26 56.11 53.74 36.33
50.32 70.31 62.73 61.20 59.29 40.07
4.87 6.21 3.47 5.09 5.55 3.74
61.37 81.45 70.76 67.41 66.83 43.47
43.99 62.30 56.43 51.37 48.64 30.18
Rotterdam (Barges FoB): Naphtha Premium gasoline (unleaded 98) Jet/Kerosene Gasoil/Diesel (10 ppm) Fuel oil (1.0% S) Fuel oil (3.5% S)
43.57 66.62 55.92 55.93 39.48 34.97
48.60 70.13 61.50 61.82 43.83 38.10
5.03 3.51 5.58 5.89 4.35 3.13
52.18 78.23 69.33 68.97 42.93 43.58
41.23 62.70 52.02 51.71 32.20 27.76
Mediterranean (Cargoes FOB): Naphtha Premium gasoline** Jet/Kerosene Diesel Fuel oil (1.0% S) Fuel oil (3.5% S)
43.20 59.38 54.78 57.04 40.02 37.45
48.18 62.36 60.06 62.83 44.46 40.72
4.98 2.98 5.28 5.79 4.44 3.27
49.29 72.18 66.48 70.63 44.60 43.44
40.36 55.26 50.43 52.89 32.58 30.41
Singapore (Cargoes FOB): Naphtha Premium gasoline (unleaded 95) Regular gasoline (unleaded 92) Jet/Kerosene Gasoil/Diesel (50 ppm) Fuel oil (180 cst 2.0% S) Fuel oil (380 cst 3.5% S)
42.54 58.00 55.38 55.07 55.12 41.11 38.72
47.70 62.99 60.06 61.02 61.60 45.33 43.06
5.16 4.99 4.68 5.95 6.48 4.22 4.34
53.71 71.56 68.39 67.24 68.74 48.71 46.91
41.42 54.71 51.83 51.33 51.35 34.98 32.79
Note: * Barges. ** Cost, insurance and freight (CIF). Sources: Argus Media and OPEC Secretariat.
Table 6.2: Refinery operations in selected OECD countries Refinery throughput, mb/d
US France Germany Italy UK Euro-16 Japan
Aug 16 16.69 1.19 1.91 1.35 1.06 10.69 3.41
Sep 16 16.52 1.19 1.90 1.34 1.12 10.50 3.19
Oct 16 15.48 2.90
Refinery utilization, %
Change Oct/Sep -1.04 -0.29
Aug 16 93.11 84.57 87.16 66.18 75.61 90.20 86.96
Sep 16 92.18 84.78 86.75 65.40 79.81 88.63 81.50
Oct 16 86.36 73.99
Change Oct/Sep -5.81 -7.51
Sources: Argus Media, EIA, Euroilstock, IEA, METI, OPEC Secretariat and Petroleum Association of Japan.
64
OPEC Monthly Oil Market Report – November 2016
Tanker Market
Tanker Market In October, tanker spot freight rates for dirty and clean vessels saw gains across all classes trading on various routes. Although the size of the gains varied, VLCC rates achieved the strongest growth among all reported routes. Both crude and product spot freight rates registered gains in October on most reported routes compared with the previous month, though remaining mostly below the levels of the previous year. In the dirty segment, VLCC, Suezmax and Aframax spot freight rates increased by 52%, 6%, and 1%, respectively, over the previous month. These improvements were mostly driven by higher vessel demand and seasonal requirements. Clean tanker freight rates were mixed in October, with those for West of Suez increasing by 8%, while East of Suez rates remained weak, down from one month ago by 4%. Winter requirements supported freight rates in western destinations.
Spot fixtures In October, OPEC spot fixtures increased by 15.2% from the previous month to average 11.22 mb/d, according to preliminary data. The increase came on the back of higher spot fixtures on both the Middle East-to-East and Middle East-to-West routes, rising by 0.19 mb/d and 0.03 mb/d, respectively, in October to average 5.3 mb/d and 2.53 mb/d. In addition, fixtures outside the Middle East were up by 1.27 mb/d in October, averaging 3.4 mb/d. Table 7.1: Tanker chartering, sailings and arrivals, mb/d Aug 16
Sep 16
Oct 16
Change Oct 16/Sep 16
Spot Chartering All areas OPEC Middle East/East Middle East/West Outside Middle East
13.72 9.63 4.62 2.40 2.61
13.67 9.74 5.11 2.50 2.13
15.43 11.22 5.30 2.53 3.40
1.76 1.48 0.19 0.03 1.27
Sailings OPEC Middle East
23.68 16.91
23.63 17.10
23.75 17.12
0.12 0.02
Arrivals North America Europe Far East West Asia
9.76 12.34 8.35 4.88
9.39 12.21 8.56 4.58
9.54 12.13 8.30 4.87
0.15 -0.08 -0.26 0.29
Source: Oil Movements.
Sailings and arrivals OPEC sailings increased by 0.12 mb/d, or 0.5%, in October to stand at 23.75 mb/d. Middle East sailings increased, rising by 0.02 mb/d over the previous month to average 17.12 mb/d. Crude oil arrivals increased in October at North American and west Asian ports, up by 1.6% and 6.2% respectively, over the previous month, while arrivals in European and Far eastern ports showed a drop of 0.6% and 3.1%, respectively, from the previous month.
OPEC Monthly Oil Market Report – November 2016
65
Tanker Market
Spot freight rates VLCC VLCC freight rates showed remarkable gains in October across all reported routes following months of gradual decline. Rates surged on all major trading routes from a month before, though remaining below those of the previous year. October tonnage availability tightened and market activities experienced their usual seasonal uptick. Active markets in West Africa initially drove freight rate gains up as high tonnage demand affected vessel availability in different regions. Freight rates did correct downwards towards the end of the month simultaneously with tonnage build, mainly in the Middle East, while a decline in West Africa took place to a lesser degree. VLCC Middle East-to-East spot freight rates showed the strongest gain, up by 71% in October to stand at WS60 points, followed by freight rates registered for tankers trading on the Middle East-to-West route, which increased by WS12 points to average WS36 points in October. VLCC spot freight rates on the West Africa-to-East route also rose by 48% to average WS67 points. October gains were only seen on a monthly basis, as rates were were down compared with the same period a year earlier. Graph 7.1: Monthly averages of crude oil spot freight rates Worldscale 140
Worldscale 140
Mediterranean/Northwest Europe (Aframax) Middle East/Far East (VLCC)
Oct 16
Sep 16
Aug 16
20
Jul 16
20
Jun 16
40
May 16
40
Apr 16
60
Mar 16
60
Feb 16
80
Jan 16
100
80
Dec 15
100
Nov 15
120
Oct 15
120
West Africa/USGC (Suezmax)
Sources: Argus and Platts.
Suezmax Suezmax spot freight rates continued strengthening, showing further gains from one month earlier, despite a downward correction in rates, mainly in West Africa, at the beginning of the month as replacement requirements were totally covered. The Suezmax market experienced occasional softer sentiment when activities waned. Average Suezmax freight rates remained healthy, supported by higher rates registered for tankers trading on the Northwest Europe-to-US route, which gained 13% to stand at WS67 points. Similarly, an increase of 13% was seen over rates for the same month in 2015. Meanwhile, Suezmax spot freight rates for tankers operating on the West Africato-US route remained flat from a month before to stand at WS67 points, below those of the same month a year before by 14%.
66
OPEC Monthly Oil Market Report – November 2016
Tanker Market Table 7.2: Spot tanker crude freight rates, Worldscale
Crude Middle East/East Middle East/West West Africa/East West Africa/US Gulf Coast Northwest Europe/US Gulf Coast Indonesia/East Caribbean/US East Coast Mediterranean/Mediterranean Mediterranean/Northwest Europe
Size 1,000 DWT
Aug 16
Sep 16
230-280 270-285 260 130-135 130-135 80-85 80-85 80-85 80-85
37 24 41 35 41 71 82 66 62
35 24 42 67 59 64 92 87 74
Change Oct 16 Oct 16/Sep 16 60 36 62 67 67 82 97 71 68
26 12 20 0 8 19 6 -17 -7
Sources: Argus Media and OPEC Secretariat.
Aframax Spot freight rates in the Aframax market varied on different routes. Average Aframax spot freight rates rose slightly in October, increasing by only WS1 point from a month earlier. This minor increase came as a result of mixed movement seen on different trading routes. Aframax spot freight rates were high at the beginning of the month due to active loading in the Baltics before rates came under pressure due to increased number of ballasters and strong competition between ship owners, as loading requirements in the market were limited. Spot freight rates dropped in the Mediterranean – even when activity levels increased, rates did not follow suit – declining despite delays at the Black Sea and Trieste ports. Spot freight rates on the Mediterranean-to-Mediterranean and Mediterranean-to-Northwest Europe routes dropped by 19% and 9%, respectively, from the previous month to stand at WS71 and WS68 points. The Aframax market was also affected by reduced delays at the Turkish Straits, which were kept at a minimum. On the other hand, a positive trend impacted freight rates on the Indonesia-to-East route, edging up on average by 29% from a month before to stand at WS82 points. Transatlantic fixtures also turned positive as the market benefitted from anticipated weather delays ahead of an approaching hurricane in combination with a tightening positions list. In the Caribbean, spot freight rates for Aframax operating on the Caribbean-to-US route registered an increase of 6% in October to stand at WS97 points.
Clean spot freight rates Clean tanker spot freight rates gained 3% on average in October compared with the previous month. The increase is attributed to a firmer West-of-Suez market. Mediumrange tankers trading on the West of Suez route achieved higher freight rates along several major routes, benefitting from demand ahead of the winter season. Clean spot freight rates on the Northwest Europe-to-US East Coast (USEC) route increased by WS2 points to stand at WS80 points. Similarly the Mediterranean-to-Mediterranean and Mediterranean-to-Northwest Europe routes increased by 11% and 9%, respectively, in October to stand at WS110 and WS117 points, respectively. In the East, spot freight rates for tankers operating on the Middle East-to-East and Singapore-to-East routes dropped by WS3 point and WS5 points, respectively, from the previous month. The medium-range tanker market was uneventful, leading to an overall reduction in freight rates in October, with individual rates slightly softening or remaining flat.
OPEC Monthly Oil Market Report – November 2016
67
Tanker Market Graph 7.2: Monthly average of clean spot freight rates Worldscale
Middle East/Far East
Oct 16
Sep 16
Aug 16
Jul 16
Feb 16
Northwest Europe/USEC
Jun 16
50
May 16
50
Apr 16
100
Mar 16
100
Jan 16
150
Dec 15
150
Nov 15
Worldscale 200
Oct 15
200
Mediterranean/Mediterranean
Sources: Argus Media and OPEC Secretariat.
Table 7.3: Spot tanker product freight rates, Worldscale Size 1,000 DWT
Aug 16
Sep 16
30-35 30-35 33-37 30-35 30-35
111 118 86 113 123
89 117 78 99 108
Products Middle East/East Singapore/East Northwest Europe/US East Coast Mediterranean/Mediterranean Mediterranean/Northwest Europe
Change Oct 16 Oct 16/Sep 16 85 112 80 110 117
-4 -5 3 11 9
Sources: Argus Media and OPEC Secretariat.
68
OPEC Monthly Oil Market Report – November 2016
Oil Trade
Oil Trade Preliminary data for October shows that US crude oil imports fell by 224 tb/d from a month earlier to average 7.7 mb/d, while still reflecting a gain of 593 tb/d from the same month one year ago. US monthly product imports similarly fell from one month ago to average 2.1 mb/d, the lowest level since March 2016. However, on an annual comparison, they increased by 321 tb/d or 18%. Japanese crude oil imports rose slightly in September by 30 tb/d, or 1%, to average 3.2 mb/d. In a y-o-y comparison, crude imports showed a decline of 27 tb/d, or 8%. Japan’s product imports showed a drop of 142 tb/d to average 433 tb/d, reflecting a loss of 25% m-o-m and 35% y-o-y. China’s crude imports increased in September by 310 tb/d, reaching a peak and averaging 8.1 mb/d, up by 4% from the previous month and 18% from the previous year. China’s product imports were almost stable at the previous month’s levels, averaging 1.2 mb/d and showing an annual decline of 127 tb/d. India’s crude imports dropped from the previous month’s levels by 142 tb/d to average 4.3 mb/d in September. Nevertheless, crude imports reflected an annual gain of 448 tb/d, or 12%. Product imports increased by 73 tb/d from the previous month to average 789 tb/d, a y-o-y increase of 172 tb/d.
US Preliminary data for October shows that US crude oil imports dropped to average 7.7 mb/d, down by 224 tb/d from the previous month, while still reflecting a gain of 593 tb/d from the same month one year earlier. On a y-t-d basis, US crude imports in October were 552 tb/d higher from a year earlier. Graph 8.1: US imports of crude and petroleum products mb/d 3.0 2.5 2.0 1.5 1.0 0.5 0.0
mb/d 8.5 7.5 6.5 5.5
Others* Jet fuel/kerosene
Propane/propylene Fuel oil
Oct 16
Sep 16
Aug 16
Jul 16
Jun 16
May 16
Apr 16
Mar 16
Feb 16
Jan 16
Dec 15
Nov 15
Oct 15
4.5
Gasoline Crude (RHS)
Note: *Others: Contains natural gas liquids, liquefied refinery gases (LRG's), other liquids and all finished petroleum products except gasoline, jet fuel/kerosene, fuel oil and propane/propylene. Sources: US Energy Information Administration and OPEC Secretatiat.
US monthly product imports dropped from one month ago to average 2.1 mb/d, the lowest level since March, however increasing by 321 tb/d, or 18%, from the same month a year earlier. Y-t-d, product imports were higher by just 51 tb/d from the same period a year ago. US product exports for October were 606 tb/d less than a month ago to average 4 mb/d. In an annual comparison, product exports were lower than a year earlier by
OPEC Monthly Oil Market Report – November 2016
69
Oil Trade 112 tb/d or 3%. As a result, US total net imports increased in October by 346 tb/d to average 5.3 mb/d. Graph 8.2: US exports of crude and petroleum products tb/d 6,000 5,000 4,000 3,000 2,000 1,000 0
Others* Jet fuel/kerosene
Propane/propylene Fuel oil
Oct 16
Sep 16
Aug 16
Jul 16
Jun 16
May 16
Apr 16
Mar 16
Feb 16
Jan 16
Dec 15
Nov 15
Oct 15
tb/d 700 600 500 400 300 200 100 0
Gasoline Crude (RHS)
Note: *Others: Contains natural gas liquids, liquefied refinery gases (LRG's), other liquids and all finished petroleum products except gasoline, jet fuel/kerosene, fuel oil and propane/propylene. Sources: US Energy Information Administration and OPEC Secretatiat.
In August, the top first and second crude suppliers to the US maintained the same order as seen the previous month. Canada remained the premier crude supplier, accounting for 41% of total US crude imports, up from the previous month by 354 tb/d. Saudi Arabia maintained its position as second-largest supplier, increasing its exports to the US by 91 tb/d. Venezuela came in as third-top supplier, accounting for 9% of US crude imports, though this was lower by 136 tb/d from a month before. Crude imports from OPEC Member Countries fell in August from the previous month, dropping by 384 tb/d, or 11%, and accounting for 39% of total US crude imports. On the other hand, US product imports from OPEC Member Countries were almost stable from the previous month to stand at 304 tb/d. Canada and Russia maintained their positions as first and second product suppliers to the US, accounting for 24% and 18%, respectively. Canada’s product exports to the US in August were up by 32 tb/d from the previous month, while Russian volumes were down by 66 tb/d from a month ago. Algeria came in as third supplier to US, with product exports up by 57 tb/d from the previous month. Regarding US crude imports by region, August imports from North America – the main import region for the US – averaged 3.3 mb/d, followed by imports from Latin America, which averaged 2.3 mb/d. The Middle East was the third-largest import region to the US, with an average of 1.8 mb/d – stable from the previous month. Imports from Africa were down from the previous month, following an increase in the previous month, to average 422 tb/d. Looking at crude imports by PADDs, in PADD1, crude imports were higher from the former Soviet Union (FSU) and Latin America, while dropping from Africa and the Middle East. PADD2 mostly sourced its imports from North America, averaging 2.2 mb/d, up by 236 tb/d m-o-m. Imports from the Middle East averaged 26 tb/d, down by 10 tb/d from one month earlier. The majority of imports in PADD3 came from Latin America and the Middle East. In August, Middle Eastern imports were stable from a month before, while imports from Latin America were 4% lower. Imports from the regions averaged 1.2 mb/d and 1.8 mb/d, respectively. PADD4 previously covered its imports from North America, averaging 265 tb/d in August; volumes dropped by 22 tb/d
70
OPEC Monthly Oil Market Report – November 2016
Oil Trade from a month ago. The West Coast imported the most from the Middle East, averaging 485 tb/d in August, followed by Latin America and North America, which averaged 331 tb/d and 236 tb/d, respectively. Table 8.1: US crude and product net imports, tb/d
Crude oil Total products Total crude and products
Oct 16 7,260 -1,944 5,316
Sep 16 7,429 -2,460 4,969
Aug 16 7,378 -2,181 5,197
Change Oct 16/Sep 16 -169 516 346
Sources: US Energy Information Administration and OPEC Secretatiat.
Japan Japan’s crude oil imports rose slightly in September by 30 tb/d, or 1%, to average 3.2 mb/d. A y-o-y comparison of crude imports shows a decline of 27 tb/d, or 8%. As seen previously, Saudi Arabia, the UAE and Qatar were top crude suppliers to Japan in September. Saudi Arabia maintained its spot as prime crude supplier with a share of 32% of total crude imports. The UAE came in as second-largest supplier with a share of 26% of total crude imports, while Qatar held the third position in September with a share of 10%. Imports from Saudi Arabia were up from the month before by 51 tb/d and imports from the UAE and Qatar increased by 16 tb/d and 7 tb/d, respectively. On the other hand, Japan’s product imports dropped in September by 142 tb/d to average 433 tb/d, reflecting a loss of 25% m-o-m and 35% y-o-y. Graph 8.3: Japan’s imports of crude and petroleum products tb/d
mb/d
1,200
5
1,000
4
800
3
600 2
400
Others*
LPG
Naphtha
Fuel oil
Sep 16
Aug 16
Jul 16
Jun 16
May 16
Apr 16
Mar 16
Feb 16
Jan 16
Dec 15
0
Nov 15
0
Oct 15
1
Sep 15
200
Crude oil
Note: *Others: Contains gasoline, jet fuel, kerosene, gasoil, asphalt and paraffin wax. Sources: Ministry of Economy, Trade and Industry of Japan and OPEC Secretariat.
Japan’s domestic oil product sales fell by 1.9% in September from a year before to average 2.8 mb/d. The country’s product exports in September reached a record-high level to average 662 tb/d, up by 14 tb/d, or 2%, m-o-m. In a y-o-y comparison, the figure shows an increase of 43 tb/d, or 7%.
OPEC Monthly Oil Market Report – November 2016
71
Oil Trade Graph 8.4: Japan’s exports of petroleum products tb/d 700
tb/d
600
600
500
500
400
400
300
300
200
200
100
100
700
Fuel oil
Gasoil
Jet fuel
Sep 16
Aug 16
Jul 16
Jun 16
May 16
Apr 16
Mar 16
Feb 16
Jan 16
Dec 15
Nov 15
Oct 15
0
Sep 15
0
Others*
*Others: Contains LPG, gasoline, naphtha, kerosene, lubricating oil, asphalt and paraffin wax. Sources: Ministry of Economy, Trade and Industry of Japan and OPEC Secretariat.
Accordingly, Japan’s net imports dropped in September by 125 tb/d to average 3 mb/d, down by 4% m-o-m and 9% y-o-y. Table 8.2: Japan’s crude and product net imports, tb/d
Crude oil Total products Total crude and products
Jul 16 3,144 -29 3,115
Aug 16 3,206 -73 3,133
Sep 16 3,236 -229 3,008
Change Sep 16/Aug 16 30 -156 -125
Sources: Ministry of Economy, Trade and Industry of Japan and OPEC Secretariat.
China China’s crude imports increased in September by 310 tb/d to reach a peak, averaging 8.1 mb/d in September. This is up by 4% from the previous month and 18% from the previous year. The country’s crude imports increased in September, while oil stocks also rose. On a y-t-d basis, the figures reflect an increase of 909 tb/d or 13%. Regarding crude oil supplier share, Angola, Iraq and Russia were the top suppliers to China in September, accounting for 13%, 12%, and 12%, respectively. Crude imports from Angola and Iraq increased from the previous month by 250 tb/d and 424 tb/d, respectively, while crude imports from Russia were lower by 129 tb/d from a month earlier. Saudi Arabia was the fourth-largest supplier to China in September, down from the previous month by 78 tb/d. China’s product imports were almost stable at the previous month’s levels, averaging 1.2 mb/d, showing an annual decline of 127 tb/d.
72
OPEC Monthly Oil Market Report – November 2016
Oil Trade Graph 8.5: China’s imports of crude and petroleum products tb/d
tb/d
1,600
10,000 8,000
1,200
6,000 800 4,000 400
2,000
Others Diesel
LPG Fuel oil
Naphtha Asphalt
Sep 16
Aug 16
Jul 16
Jun 16
May 16
Apr 16
Mar 16
Feb 16
Jan 16
Dec 15
Nov 15
Oct 15
0
Sep 15
0
Gasoline Crude (RHS)
Jet fuel
Sources: Argus China Petroleum and China, Oil and Gas Petrochemicals and OPEC Secretariat.
China doubled its September product exports from a month earlier to average 106 tb/d, the highest number since March. The country’s product exports were also up by 186 tb/d or 19% from the previous month, increasing by 197 tb/d or 20% from the previous year. Graph 8.6: China’s exports of crude and petroleum products tb/d 1,400
tb/d 180
1,200
140
1,000 800
100
600
60
400
20
200
Others Diesel
LPG Fuel oil
Naphtha Asphalt
Gasoline Crude (RHS)
Sep 16
Aug 16
Jul 16
Jun 16
May 16
Apr 16
Mar 16
Feb 16
Jan 16
Dec 15
Nov 15
Oct 15
-20
Sep 15
0
Jet fuel
Sources: Argus China Petroleum and China, Oil and Gas Petrochemicals and OPEC Secretariat.
As a result, China’s net oil imports rose by a slight 74 tb/d from the previous month to average 7.9 mb/d, up by 829 tb/d from a year ago. Table 8.3: China’s crude and product net imports, tb/d
Crude oil Total products Total crude and products
Jul 16 7,278 -68 7,210
Aug 16 7,706 158 7,864
Sep 16 7,961 -23 7,938
Change Sep 16/Aug 16 255 -181 74
Sources: Argus China Petroleum and China, Oil and Gas Petrochemicals and OPEC Secretariat.
OPEC Monthly Oil Market Report – November 2016
73
Oil Trade
India In September, India’s crude imports dropped from the previous month by 142 tb/d, to average 4.3 mb/d. Nevertheless, crude imports reflected an annual gain of 448 tb/d, or 12%. Product imports in September increased by 73 tb/d from the previous month to average 789 tb/d, an increase y-o-y of 172 tb/d. Monthly product imports were mainly higher in LPG, where an increase of 11% was seen over a month ago. Graph 8.7: India’s imports of crude and petroleum products tb/d
tb/d
1000
5,000
800
4,000
600
3,000
400
2,000
200
1,000
Sep 16
Aug 16
Jul 16
Jun 16
May 16
Apr 16
Mar 16
Feb 16
Jan 16
Dec 15
Nov 15
Oct 15
0
Sep 15
0
Others
LPG
Naphtha
Gasoline
Kerosene
Gasoil
Fuel oil
Crude (RHS)
Sources: Petroleum Planning & Analysis Cell of India and OPEC Secretariat.
India’s product exports remained high in September, rising from a month earlier by 36 tb/d, or 2%, to average 1.6 mb/d. Y-o-y, product exports were up by 208 tb/d or 15%. India’s monthly product exports were higher for all products except fuel oil exports, which declined by16 tb/d from the previous month. Graph 8.8: India’s exports of petroleum products tb/d
tb/d
1,600
1,600
1,200
1,200
800
800
400
400
Fuel oil
Gasoil
Kerosene
Gasoline
Naphtha
Sep 16
Aug 16
Jul 16
Jun 16
May 16
Apr 16
Mar 16
Feb 16
Jan 16
Dec 15
Nov 15
Oct 15
0
Sep 15
0
Others
Sources: Petroleum Planning & Analysis Cell of India and OPEC Secretariat.
Consequently, India’s net imports declined m-o-m by 104 tb/d, or 2%, to average 3.5 mb/d, but showed a gain of 412 tb/d, or 13%, y-o-y.
74
OPEC Monthly Oil Market Report – November 2016
Oil Trade Table 8.4: India’s crude and product net imports, tb/d
Crude oil Total products Total crude and products
Jul 16 4,065 -551 3,513
Aug 16 4,442 -809 3,633
Sep 16 4,300 -771 3,529
Change Sep 16/Aug 16 -142 38 -104
Note: India data tab le does not include information for crude import and product export b y Reliance Industries. Sources: Petroleum Planning & Analysis Cell of India and OPEC Secretariat.
FSU Total crude oil exports from the Former Soviet Union in September increased by 861 tb/d, or 15%, to average 6.8 mb/d, as exports through Russian pipelines increased by 340 tb/d, or 8%, to average 4.4 mb/d. Total shipments from the Black Sea increased, up from Novorossiysk port by 155 tb/d, or 30%, to average 674 tb/d. However, total Baltic Sea exports dropped by 16 tb/d in September, mainly because shipments from Primorsk port terminal were down by 106 tb/d. Total shipments through the Druzhba pipeline increased by 23 tb/d to average 1.1 mb/d and Kozmino shipments also increased by 143 tb/d, or 25%, to average 720 tb/d. Exports through the Lukoil system increased from the previous month. In the Barents Sea, exports from the Varandey offshore platform rose by 41 tb/d. Baltic Sea shipments through Kalinigrad port terminal showed a gain of 8 tb/d. Other routes showed mostly higher exports in September over the previous month. Russia’s far east total exports were up by 244 tb/d from the previous month, as a result of higher exports from De Kastri port terminal, where they rose by 238 tb/d from a month earlier to average 261 tb/d. Central Asian total exports rose by 48 tb/d through the Kenkiyak-Alashankou pipeline to stand at 231 tb/d. Black Sea total exports increased by 247 tb/d from the previous month, with all ports showing increased volumes. The Novorossiyk port terminal (cbc) showed the highest exports, up by 235 tb/d. In the Mediterranean Sea, BTC supplies showed a decline of 61 tb/d, or 9%, from the previous month to average 593 tb/d. FSU total products exports dropped by 78 tb/d, or 3%, from the previous month to average 2.9 mb/d. The drop came as a result of a decline seen in all product exports with the exception of jet and fueloil, which were higher than the previous month by 13 tb/d and 39 tb/d, respectively. Exports of gasoil, naphtha, gasoline and VGO all dropped in September from the previous month.
OPEC Monthly Oil Market Report – November 2016
75
Oil Trade Table 8.5: Recent FSU exports of crude and petroleum products by source, tb/d Transneft system Europe
Asia
Black sea total Novorossiysk port terminal - total of which: Russian oil Others Baltic sea total Primorsk port terminal - total of which: Russian oil Others Ust-Luga port terminal - total of which: Russian oil Others Druzhba pipeline total of which: Russian oil Others Pacific ocean total Kozmino port terminal - total China (via ESPO pipeline) total China Amur
Total Russian crude exports Lukoil system Europe & N. America Europe
Barents sea total Varandey offshore platform Baltic sea total Kalinigrad port terminal
Other routes Asia
Europe
Russian Far East total Aniva bay port terminal De Kastri port terminal Central Asia total Kenkiyak-Alashankou Black sea total Novorossiysk port terminal (CPC) Supsa port terminal Batumi port terminal Kulevi port terminal Mediterranean sea total BTC
Russian rail Russian rail of which: Russian oil Others Total FSU crude exports Products Gasoline Naphtha Jet Gasoil Fuel oil VGO Total FSU product exports Total FSU oil exports
Aug 16 Sep 16
2014
3Q15
4Q15
605 605 438 166 1,304 842 834 8 462 284 177 1,005 973 32 507 507 342 342
622 622 461 161 1,632 1,062 1,062 0 570 388 182 1,047 1,015 32 645 645 348 348
580 580 425 156 1,561 1,005 1,005 0 556 360 196 1,097 1,066 31 658 658 311 311
519 519 347 172 1,581 1,071 1,071 0 511 325 186 1,090 1,058 32 577 577 300 300
674 674 520 154 1,565 965 965 0 600 384 216 1,113 1,081 31 720 720 335 335
3,763
4,295
4,207
4,067
4,406
2014
3Q15
4Q15
120 120 12 12
157 157 14 14
163 163 14 14
2014
3Q15
4Q15
275 112 162 228 228 982 855 80 39 9 602 602
424 128 296 183 183 979 862 81 36 0 701 701
274 95 179 200 200 948 822 77 49 0 663 663
2014 46 8 38
3Q15 46 42 4
4Q15 35 33 2
6,028
6,798
6,505
2014 124 485 5 933 1,487 245
3Q15 204 474 39 999 1,065 282
4Q15 139 536 54 859 1,013 323
3,280
3,064
2,925
3,023
2,945
9,308
9,862
9,430
8,959
9,742
Aug 16 Sep 16 132 132 11 11
174 174 19 19
Aug 16 Sep 16 116 93 23 183 183 735 635 63 37 0 653 653
360 99 261 231 231 982 869 65 48 0 593 593
Aug 16 Sep 16 39 33 36 31 2 1 5,936
6,797
Aug 16 Sep 16 115 114 589 584 41 54 915 830 1,015 1,054 348 309
Sources: Argus Nefte Transport and Argus Glob al Markets.
76
OPEC Monthly Oil Market Report – November 2016
Stock Movements
Stock Movements OECD commercial oil stocks fell in September to stand at around 304 mb above the latest five-year average. Crude surpluses of around 165 mb and 138 mb, respectively, above In terms of days of forward cover, OECD commercial stocks 6.5 days higher than the latest five-year average.
3,052 mb, which is and products saw the seasonal norm. stood at 65.7 days,
Preliminary data for October shows that total commercial oil stocks in the US fell by 8.3 mb to settle at 1,341 mb, which is around 57 mb above the same period a year ago and 195 mb higher than the latest five-year average. Within the components, crude stocks rose by 13.5 mb, while products fell by 21.8 mb. The latest information for China showed a drop of 3.3 mb in total commercial oil inventories in September to stand at 372.6 mb. Within the components, crude stocks rose by 5.6 mb, while product inventories fell by 9.0 mb.
OECD Preliminary data for September shows that total OECD commercial oil stocks fell by 13.4 mb to stand at 3,052 mb, which is around 99 mb higher than at the same time one year ago and 304 mb above the latest five-year average. Within the components, crude and product stocks fell by 13.0 mb and 0.4 mb, respectively. During the first three quarters of this year, OECD commercial stock builds have shown signs of slowing as they increased by only 67 mb, compared with a build of 248 mb last year during the same period. This slower build was due to lower global supply growth, which was below the considerable growth seen last year. Graph 9.1: OECD’s commercial oil stocks mb
mb
3,200
3,200
3,100
3,100
3,000
3,000
2,900
2,900
Max/Min 2011-2015
2,800
2,800
2,700
2,700
2,600
2,600
2,500 Jan
Feb 2014
Mar
Apr
May
Jun
2015
Jul 2016
Aug
Sep
Oct
Nov
2,500 Dec
Average 2011-2015
Sources: Argus Media, Euroilstock, IEA, METI, OPEC Secretariat and US Energy Information Administration.
OECD commercial crude stocks ended September at 1,481 mb, standing 30 mb above the same time one year earlier and around 165 mb higher than the latest fiveyear average. OECD Americas and OECD Europe experienced declines, while OECD Asia Pacific stocks rose. OECD product inventories also fell slightly by 0.4 mb, reversing the build of the last four months. At 1,571 mb, OECD product stocks were 73 mb above a year ago at the same time and 138 mb above the seasonal norm. Within the regions, OECD North America and OECD Asia Pacific saw builds, while OECD Europe experienced a drop.
OPEC Monthly Oil Market Report – November 2016
77
Stock Movements In terms of days of forward cover, OECD commercial stocks fell in September by 0.4 days to stand at 65.7 days, which is 2.0 days above the previous year over the same period and 6.5 days higher than the latest five-year average. Within the regions, OECD Americas had 8.1 more days of forward cover than the historical average to stand at 65.6 days in September. OECD Asia Pacific stood 3.4 days above the seasonal average to finish the month of September at 54.5 days. At the same time, OECD Europe indicated a surplus of 5.3 days above the seasonal norm, averaging 72.5 days in September. Commercial stocks in OECD Americas fell by 9.8 mb in September, following a drop of 3.4 mb in August, to settle at 1,616 mb, a surplus of 75 mb above a year ago and 220 mb higher than the seasonal norm. Within the components, crude stocks fell by 14.5 mb, while products rose by 4.7 mb. At the end of September, commercial crude oil stocks in OECD Americas fell, ending the month at 812 mb, which was 36 mb above the same time one year ago, and 165 mb above the latest five-year average. Lower crude imports were behind the decline in crude oil stocks. In contrast, product stocks in OECD Americas rose by 4.7 mb, ending September at 804 mb, a surplus of 39 mb above the same time one year ago and 84 mb higher than the seasonal norm. Lower consumption at the end of the summer season in the US was behind the build in product inventories. OECD Europe’s commercial stocks fell by 7.2 mb in September, ending the month at 994 mb, which is 27 mb higher than at the same time a year ago and 73 mb above the latest five-year average. Crude and products fell by 1.3 mb and 5.9 mb, respectively. OECD Europe’s commercial crude stocks fell in September, ending the month at 420 mb, which is 11 mb above the same period a year earlier and 30 mb higher than the latest five-year average. The fall in crude oil stocks came on the back of lower crude production in the region, as refinery runs dropped. OECD Europe’s commercial product stocks also fell by 5.9 mb to end September at 574 mb, which is 17 mb higher than a year ago at the same time and 43 mb higher than the seasonal norm. The small drop could be attributed to lower refinery output, combined with higher demand. OECD Asia Pacific commercial oil stocks rose by 3.6 mb in September, reversing the fall of the last month, to settle at 442 mb, which is 3 mb lower than a year ago, yet 10 mb above the five-year average. Within the components, crude and products stocks rose by 2.8 mb and 0.8 mb, respectively. In September, crude inventories ended the month at 248 mb, which is 21 mb below a year ago and 1.6 mb below the seasonal norm. OECD Asia Pacific’s total product inventories ended September at 193 mb, standing 18 mb higher than the same time a year ago and 12 mb above the seasonal norm.
78
OPEC Monthly Oil Market Report – November 2016
Stock Movements Table 9.1: OECD’s commercial stocks, mb
Crude oil Products
Jul 16 1,522 1,554
Aug 16 1,494 1,571
Sep 16 1,481 1,571
Change Sep 16/Aug 16 -13.0 -0.4
Sep 15 1,455 1,498
3,076
3,065
3,052
-13.4
2,953
65.9
66.1
65.7
-0.4
63.6
Total Days of forward cover
Sources: Argus Media, Euroilstock, IEA, METI, OPEC Secretariat and US Energy Information Administration.
EU plus Norway Preliminary data for September shows total European stocks fell by 7.2 mb to stand at 1,154.4 mb, which is 24.6 mb, or 2.2%, above the same time a year ago and 76.0 mb, or 7.1%, higher than the latest five-year average. Crude and product stocks fell by 1.3 mb and 5.9 mb, respectively. Graph 9.2: EU-15 plus Norway’s total oil stocks mb
mb
1,180
1,180
1,160
1,160
1,140
1,140
1,120
1,120 Max/Min 2011-2015
1,100
1,100
1,080
1,080
1,060
1,060
1,040 Jan
Feb 2014
Mar
Apr
May
Jun
2015
Jul 2016
Aug
Sep
Oct
Nov
1,040 Dec
Average 2011-2015
Source: Euroilstock.
European crude inventories fell in September for the fourth consecutive month to stand at 486.0 mb, which is 1.6 mb, or 0.3%, above the same period a year ago, and 23.6 mb, or 5.1%, higher than the seasonal norm. The decline could come from lower crude production from the North Sea, as crude throughput dropped by around 200,000 b/d in September over a month earlier, to stand at 10.5 mb/d. European product stocks also fell by 5.9 mb, ending September at 668.4 mb, which is 23.0 mb, or 3.6%, above the same time a year ago, and 52.5 mb, or 8.5%, above the seasonal norm. Within products, all the products witnessed stock draws, with the exception of naphtha, which remained unchanged. Distillate stocks fell by 4.0 mb, ending September at 450.2 mb, which is 15.0 mb, or 3.4%, higher than at the same time one year ago and 52.0 mb, or 13.1%, above the latest five-year average. The fall could be attributed to lower output, combined with higher demand. Despite this fall, distillate inventories remained historically higher, averaging more than 450 mb in the third quarter. Gasoline stocks fell by 0.8 mb in September to stand at 118.9 mb, which is 8.9 mb, or 8.1%, above a year earlier, and 10.7 mb, or 9.9%, higher than the seasonal norm. The
OPEC Monthly Oil Market Report – November 2016
79
Stock Movements fall may have been driven by lower gasoline output, as demand was almost unchanged in September, compared with August. Residual fuel oil stocks fell by 1.1 mb in September to stand at 75.5 mb, which is 1.3 mb, or 1.7%, less than the same month a year ago and 6.9 mb, or 8.4%, lower than the latest five-year average. The decline was a result of higher demand for bunker fuel in the region. Table 9.2: EU-15 plus Norway’s total oil stocks, mb Jul 16 491.7 118.2 24.6 448.5 75.7 667.0
Aug 16 487.3 119.7 23.8 454.3 76.6 674.3
Sep 16 486.0 118.9 23.8 450.2 75.5 668.4
Change Sep 16/Aug 16 -1.3 -0.8 0.0 -4.0 -1.1 -5.9
Sep 15 484.4 110.0 23.3 435.2 76.8 645.4
1,158.8
1,161.6
1,154.4
-7.2
1,129.8
Crude oil Gasoline Naphtha Middle distillates Fuel oils Total products Total
Sources: Argus and Euroilstock.
US Preliminary data for October shows that total commercial oil stocks in the US fell by 8.3 mb, following the drop of 18.6 mb in September, to settle at 1,340.7 mb, which is around 27 mb, or 2.0%, above the same period a year ago and 190 mb, or 16%, higher than the latest five-year average. Within the components, crude stocks rose by 13.5 mb, while products fell by 21.8 mb. Graph 9.3: US weekly commercial crude oil stocks mb
mb
550
550
500
500
450
450 Max/Min 2011-2015
400
400
350
350
300
300 1
4
7 2014
10
13
16
19 2015
22
25
28
31 2016
34
37
40
43
46
49
52
Average 2011-2015
Sources: US Energy Information Administration and OPEC Secretariat.
US commercial crude stocks rose in October, reversing the fall of the last four months, to stand at 482.6 mb, which is 27.4 mb, or 6.0%, above the same time one year ago and 118 mb, or 32.3%, above the latest five-year average. The bulk of the build occurred during the last week of October, increasing by 14.4 mb, the highest jump in almost 34 years. The main reason behind this build is the hike in crude imports, which increased massively, by nearly 2.0 mb/d, averaging 9.0 mb/d. Stocks in Cushing, Oklahoma, fell by around 3.0 mb to end October at 58.5 mb.
80
OPEC Monthly Oil Market Report – November 2016
Stock Movements In contrast, total product stocks fell by 21.8 mb in October, ending the month at 858.2 mb, which is around 30.0 mb, or 3.6%, above the level seen at the same time a year ago, and 77.0 mb, or 10.0%, above the seasonal norm. Within products, with the exception of residual fuel oil, all major products experienced a drop. Distillate stocks fell by 10.2 mb in October, ending the month at 150.6 mb, a surplus of 6.9 mb, or 4.8%, above the same period a year ago and 21.9 mb, or 17.1%, above the latest five-year average. The fall in middle distillate stocks came mainly on higher demand, which averaged around 4.1 mb/d, about 450,000 b/d higher than last month, while lower output limited a further build in distillate stocks. Graph 9.4: US weekly distillate stocks mb 180
mb 180
170
170
160
160
150
150
140
140
130
130
120
120
Max/Min 2011-2015
110
110
100
100 1
4
7
10
13
16
2014
19
22
25
2015
28
31
34
2016
37
40
43
46
49
52
Average 2011-2015
Sources: US Energy Information Administration and OPEC Secretariat.
Gasoline stocks fell by 3.6 mb in October to settle at 223.8 mb, which is 6.4 mb, or 3.0%, above the same period a year ago and 14.9 mb, or 7.1%, above the latest fiveyear average. The decline came mainly on the back of lower production, which averaged 9.8 mb/d, 100,000 b/d lower than in the previous month. Jet fuel stocks also fell by 1.6 mb, ending October at 42.4 mb, which is 4.9 mb, or 13.1%, above the same period a year ago, and 1.9 mb, or 4.6%, higher than the latest five-year average. In contrast, residual fuel oil inventories rose by 0.6 mb to 39.8 mb in October, which is 3.4 mb, or 7.9%, lower than the same period a year ago, yet 1.7 mb, or 4.4%, above the seasonal norm. Table 9.3: US onland commercial petroleum stocks, mb
Crude oil Gasoline Distillate fuel Residual fuel oil Jet fuel
Aug 16 483.6 229.9 159.5 39.6 42.7
Sep 16 469.1 227.4 160.7 39.2 44.0
Oct 16 482.6 223.8 150.6 39.8 42.4
Change Oct 16/Sep 16 13.5 -3.6 -10.2 0.6 -1.6
Oct 15 455.2 217.4 143.6 43.2 37.5
Total
1,367.7
1,349.1
1,340.7
-8.3
1,283.5
695.1
695.1
695.1
0.0
695.1
SPR
Source: US Energy Information Administration.
OPEC Monthly Oil Market Report – November 2016
81
Stock Movements
Japan In Japan, total commercial oil stocks rose by 3.6 mb in September to stand at 157.1 mb, which is 13.0 mb, or 7.7%, less than the same time a year ago and 16.4 mb, or 9.4%, below the latest five-year average. Within the components, crude and product stocks went up by 2.8 mb and 0.8 mb, respectively. Graph 9.5: Japan’s commercial oil stocks mb
mb
190
190
180
180
Max/Min 2011-2015
170
170
160
160
150
150
140 Jan
Feb
Mar 2014
Apr
May
Jun
2015
Jul 2016
Aug
Sep
Oct
Nov
140 Dec
Average 2011-2015
Source: Ministry of Economic, Trade and Industry of Japan.
In September, Japanese commercial crude oil stocks rose, ending the month at 88.8 mb, which is 11.0 mb, or 10.0%, below the same period a year ago, and 9.5 mb, or 9.6%, below the seasonal norm. The build was driven by higher crude imports, which increased by 30,000 b/d, or 1.0%, to average 3.2 mb/d. Lower crude throughput, which fell by 240,000 b/d, or 7.8%, to stand at 3.2 mb/d, also contributed to this build. Japan’s total product inventories also rose by 0.8 mb in September for the third consecutive month to stand at 68.3 mb. This build was mainly driven by the fall in Japanese domestic oil sales, which dropped by 70,000 b/d, or 2.8%, from a month earlier to average 2.8 mb, the lowest level for the month in 31 years. With this stockbuild, total product inventories stood at 2.1 mb, or 2.9%, below the same time a year ago, and 6.9 mb, or 9.2%, below the five-year average. Within products, the picture was mixed. Distillate stocks experienced a build, while residual fuel inventories witnessed a decline. Gasoline and naphtha stocks remained unchanged. Distillate stocks rose by 1.0 mb in September to stand at 34.1 mb for the third consecutive month. At this level, they stood at 0.3 mb, or 0.8%, lower than the same period a year ago and 1.6 mb, or 4.6%, below the seasonal average. Within distillate components, jet fuel and kerosene stocks rose by 3.5% and 14.8%, respectively, while gasoil inventories fell by 13.3%. The build in jet fuel and kerosene stocks was driven by higher output. However, the increase in domestic sales limited further builds. In contrast, the fall in gasoil stocks came on the back of lower output, combined with higher domestic demand. In contrast, total residual fuel oil stocks fell by 0.2 mb in September to stand at 13.5 mb, which is 1.8 mb, or 11.5%, lower than a year ago and 3.1 mb, or 18.7%, below the latest five-year average. Within fuel oil components, fuel oil A fell by 3.3%, while fuel oil B.C stocks rose by 2.0%. The fall in fuel oil A inventories came on the back of lower output, which declined by 1.2%, and higher domestic sales, which increased by 7.2%. The build in fuel oil B.C was driven mainly by lower demand, which fell by 5.2%.
82
OPEC Monthly Oil Market Report – November 2016
Stock Movements Gasoline and naphtha inventories remained unchanged in September at 10.2 mb and 10.5 mb, respectively. Gasoline stocks remained 0.1 mb, or 0.6%, higher than a year ago at the same time and 1.8 mb, or 14.7%, lower than the seasonal norm. Naphtha inventories were 0.1 mb, or 1.0 %, lower than last year at the same time, and 0.4 mb, or 3.8%, below the five-year average. Table 9.4: Japan’s commercial oil stocks*, mb
Crude oil Gasoline Naphtha Middle distillates Residual fuel oil Total products Total**
Jul 16 93.4 10.6 9.1 29.6 13.1 62.3
Aug 16 86.1 10.2 10.4 33.1 13.7 67.5
Sep 16 88.8 10.2 10.5 34.1 13.5 68.3
Change Sep 16/Aug 16 2.8 0.0 0.0 1.0 -0.2 0.8
Sep 15 99.8 10.1 10.6 34.4 15.2 70.4
155.8
153.6
157.1
3.6
170.2
Note: * At the end of the month. ** Includes crude oil and main products only. Source: Ministry of Economy, Trade and Industry of Japan.
China The latest information for China showed a drop of 3.3 mb in total commercial oil inventories in September to stand at 372.6 mb, which is 29.2 mb lower than the previous year at the same time. Within the components, crude rose by 5.6 mb, while product inventories fell by 9.0 mb. In September, commercial crude stocks rose to 234.5 mb, following a build of 9.8 mb in the previous month. Despite this build, they were still 23.8 mb below the previous year at the same time. The build could be attributed to higher imports, which increased by 310 tb/d to average 8.1 mb/d in September. Lower crude throughput also contributed to this build. In contrast, total product stocks in China fell by 9.0 mb in September for the second month to settle at 138 mb, which is 5.3 mb below the same time a year ago. All products dropped, with diesel experiencing the largest fall. Diesel inventories fell 7.8 mb in September to stand at 53.4 mb, the lowest since November 2010 and 21.3 mb below the same time a year ago. This fall was driven mainly by lower output, as apparent demand dropped from the previous month. Gasoline and kerosene stocks fell in September by 0.7 mb and 0.5 mb, respectively. At 66.9 mb, gasoline stocks stood at 14.5 mb above the same time a year ago, while kerosene ended September at 17.8 mb, which is 1.4 mb above the same period last year. The fall in gasoline stocks was driven by higher demand, which increased by more than 100,000 b/d. For kerosene, the decline in inventories came mainly from lower production.
OPEC Monthly Oil Market Report – November 2016
83
Stock Movements Table 9.5: China’s commercial oil stocks, mb
Crude oil Gasoline Diesel Jet kerosene Total products Total
Jul 16 219.1 68.6 73.6 19.8 161.9
Aug 16 228.9 67.5 61.2 18.3 147.0
Sep 16 234.5 66.9 53.4 17.8 138.0
Change Sep 16/Aug 16 5.6 -0.7 -7.8 -0.5 -9.0
Sep 15 258.4 52.3 74.6 16.4 143.4
381.1
375.9
372.6
-3.3
401.8
Sources: China Oil and Gas Petrochemicals and OPEC Secretariat.
Singapore and Amsterdam-Rotterdam-Antwerp (ARA) At the end of September, product stocks in Singapore rose slightly by 0.4 mb, reversing the fall of last month. At 48.7 mb, they stood at 4.6 mb, or 8.7%, below the same period a year ago. Within products, the picture was mixed, with light distillate and middle distillate stocks falling and fuel oil stock inventories rising. Residual fuel oil stocks rose by 3.5 mb in September, reversing the fall of last month, to end the month at 24.0 mb, which is 4.0 mb, or 14.3%, less than at the same time a year ago. The build could mainly be attributed to higher exports in the region, reflecting higher demand. In contrast, light distillate and middle distillate stocks fell in September by 1.7 mb and 1.4 mb, respectively. At 12.0 mb, light distillate inventories stood almost in line with last year at the same time, while middle distillates ended September at 12.7 mb, which is 0.6 mb, or 4.7%, less than a year ago in the same period. Product stocks in Amsterdam-Rotterdam-Antwerp (ARA) fell by 1.2 mb to end September at 42.8 mb, which is 7.0 mb, or 14.1%, lower than at the same time a year ago. Within products, the picture was mixed; gasoline and gasoil went down, while residual fuel oil, jet oil and naphtha witnessed stock builds. Gasoline inventories fell by 1.8 mb, ending September at 6.3 mb, which is 1.7 mb, or 21.0%, lower than the same month of the previous year. The main reason behind this fall was healthy demand in the region. Gasoil also fell by 0.5 mb to stand at 23.5 mb, which is 2.9 mb, or 10.8%, below a year ago at the same time. In contrast, fuel oil stocks rose by 0.3 mb in September to stand at 5.3 mb, which is 2.0 mb, or nearly 27%, lower than in the same period a year ago. This build was mainly driven by lower demand from marine bunkers in the region. Jet fuel stocks rose by 0.4 mb, ending September at 5.3 mb, which is 0.7 mb, or 12%, less than in the previous year at the same time.
84
OPEC Monthly Oil Market Report – November 2016
Balance of Supply and Demand
Balance of Supply and Demand Demand for OPEC crude in 2016 was revised up by 0.1 mb/d to stand at 31.9 mb/d, which is 1.9 mb/d higher than the 2015 level. In 2017, demand for OPEC crude is projected to be 32.7 mb/d, around 0.1 mb/d higher than in the last report and 0.8 mb/d higher than this year.
Estimate for 2016 Demand for OPEC crude for 2016 was revised up by 0.1 mb/d to stand at 31.9 mb/d, representing an increase of 1.9 mb/d from last year’s level. The upward revision is mainly driven by a downward adjustment in non-OPEC supply, as world demand remained almost unchanged. Within the quarters, the third and fourth quarters were revised up by 0.3 mb/d and 0.2 mb/d, respectively, while the second quarter was revised down by 0.1 mb/d. The first quarter remained unchanged. The first and the second quarters rose by 1.2 mb/d and 2.5 mb/d, respectively, versus the same quarters last year, while the third and the fourth quarters are estimated to show growth of 1.8 mb/d and 1.9 mb/d, respectively. Table 10.1: Summarized supply/demand balance for 2016*, mb/d (a) World oil demand Non-OPEC supply OPEC NGLs and non-conventionals (b) Total non-OPEC supply and OPEC NGLs
2015 93.17 56.98 6.13 63.11
1Q16 93.47 56.98 6.24 63.22
2Q16 93.66 55.53 6.27 61.79
3Q16 95.13 55.82 6.30 62.11
4Q16 95.31 56.47 6.34 62.80
2016 94.40 56.20 6.29 62.48
Difference (a-b)
30.06
30.24
31.86
33.01
32.50
31.91
OPEC crude oil production Balance
32.10 2.04
32.50 2.26
32.76 0.90
33.28 0.27
Note: * 2016 = Estimate. Totals may not add up due to independent rounding. Source: OPEC Secretariat.
Forecast for 2017 For 2017, demand for OPEC crude was also revised up by 0.1 mb/d from the previous report and projected to increase by 0.8 mb/d to average 32.7 mb/d. Within the quarters, all the quarters were revised up by 0.1 mb/d. The first and second quarters are expected to increase by 1.3 mb/d and 0.3 mb/d, respectively, while the third and the fourth quarters are projected to increase by 0.8 mb/d and 0.7 mb/d, respectively, versus the same quarters this year. Table 10.2: Summarized supply/demand balance for 2017*, mb/d (a) World oil demand Non-OPEC supply OPEC NGLs and non-conventionals (b) Total non-OPEC supply and OPEC NGLs
2016 94.40 56.20 6.29 62.48
1Q17 94.61 56.67 6.36 63.02
2Q17 94.71 56.17 6.40 62.57
3Q17 96.37 56.09 6.45 62.53
4Q17 96.48 56.79 6.52 63.31
2017 95.55 56.43 6.43 62.86
Difference (a-b)
31.91
31.58
32.14
33.84
33.17
32.69
Note: * 2017 = Forecast. Totals may not add up due to independent rounding. Source: OPEC Secretariat.
OPEC Monthly Oil Market Report – November 2016
85
Balance of Supply and Demand Graph 10.1: Balance of supply and demand mb/d
mb/d
35
35
34
34
33
33
32
32
31
31
30
30
29
29
28
28 1Q16
2Q16
3Q16
4Q16
OPEC crude production
1Q17
2Q17
3Q17
4Q17
Required OPEC crude
Source: OPEC Secretariat.
86
OPEC Monthly Oil Market Report – November 2016
Table 10.3: World oil demand and supply balance, mb/d 2013
2014
2015
1Q16
2Q16
3Q16
4Q16
2016
1Q17
2Q17
3Q17
4Q17
2017
OECD
46.1
45.8
46.4
46.8
46.3
47.0
46.6
46.7
46.9
46.3
47.2
46.8
46.8
Americas
24.2
24.2
24.6
24.6
24.7
25.1
24.8
24.8
24.8
24.9
25.3
25.0
25.0
Europe
13.6
13.5
13.7
13.6
13.9
14.2
13.7
13.9
13.6
13.9
14.3
13.8
13.9
8.3
8.1
8.0
8.6
7.6
7.6
8.1
8.0
8.5
7.6
7.6
8.0
7.9
DCs
29.1
29.9
30.6
30.7
31.0
31.7
31.3
31.2
31.3
31.7
32.3
32.0
31.8
FSU
4.5
4.6
4.6
4.5
4.4
4.7
5.0
4.7
4.6
4.4
4.8
5.1
4.7
World demand
Asia Pacific
Other Europe
0.6
0.7
0.7
0.7
0.6
0.7
0.8
0.7
0.7
0.7
0.7
0.8
0.7
China
10.3
10.7
11.0
10.8
11.4
11.1
11.6
11.2
11.1
11.6
11.4
11.9
11.5
(a) Total world demand
90.7
91.6
93.2
93.5
93.7
95.1
95.3
94.4
94.6
94.7
96.4
96.5
95.5
OECD
22.2
24.3
25.3
25.4
24.3
24.5
24.7
24.7
24.7
24.5
24.3
24.7
24.6
Americas
18.2
20.1
21.1
21.1
20.1
20.5
20.5
20.5
20.4
20.3
20.3
20.5
20.4
3.6
3.6
3.8
3.9
3.7
3.6
3.8
3.7
3.9
3.7
3.5
3.8
3.7
Non-OPEC supply
Europe Asia Pacific
0.5
0.5
0.5
0.4
0.4
0.5
0.5
0.4
0.4
0.5
0.4
0.4
0.4
DCs
10.9
11.1
11.3
11.1
11.1
11.3
11.4
11.2
11.4
11.5
11.5
11.6
11.5
FSU
13.6
13.5
13.7
14.0
13.7
13.7
14.0
13.9
14.1
13.9
14.0
14.1
14.0
Other Europe
0.1
0.1
0.1
0.1
0.1
0.1
0.1
0.1
0.1
0.2
0.2
0.2
0.2
China
4.2
4.3
4.4
4.2
4.1
4.0
4.0
4.1
4.0
4.0
4.0
4.0
4.0
Processing gains
2.1
2.2
2.2
2.2
2.2
2.2
2.2
2.2
2.2
2.2
2.2
2.2
2.2
53.2
55.5
57.0
57.0
55.5
55.8
56.5
56.2
56.7
56.2
56.1
56.8
56.4
5.8
6.0
6.1
6.2
6.3
6.3
6.3
6.3
6.4
6.4
6.4
6.5
6.4
(b) Total non-OPEC supply and OPEC NGLs
59.0
61.5
63.1
63.2
61.8
62.1
62.8
62.5
63.0
62.6
62.5
63.3
62.9
OPEC crude oil production (secondary sources)
31.2
31.0
32.1
32.5
32.8
33.3
Total supply
90.2
92.5
95.2
95.7
94.6
95.4
Balance (stock change and miscellaneous)
-0.5
0.9
2.0
2.3
0.9
0.3
Commercial
2,559
2,705
2,985
3,015
3,052
3,052
SPR
1,584
1,580
1,587
1,593
1,591
1,595
4,144
4,285
4,571
4,608
4,643
4,647
909
924
1,017
1,055
1,094
1,068
Total non-OPEC supply OPEC NGLs + non-conventional oils
OECD closing stock levels (mb)
Total Oil-on-water
Days of forward consumption in OECD Commercial onland stocks
55.9
58.4
64.0
65.2
65.0
65.4
SPR
34.6
34.1
34.0
34.4
33.9
34.2
90.4
92.5
98.0
99.6
98.9
99.7
Total Memo items FSU net exports (a) - (b)
9.0
8.9
9.1
9.5
9.4
9.0
9.0
9.2
9.5
9.5
9.2
9.0
9.3
31.7
30.1
30.1
30.2
31.9
33.0
32.5
31.9
31.6
32.1
33.8
33.2
32.7
Note: Totals may not add up due to independent rounding. Source: OPEC Secretariat.
OPEC Monthly Oil Market Report – November 2016
87
Table 10.4: World oil demand/supply balance: changes from last month's table* , mb/d 2013
2014
2015
1Q16
2Q16
3Q16
4Q16
2016
1Q17
2Q17
3Q17
4Q17
2017
World demand OECD
-
-
0.1
0.1
0.2
0.2
0.1
0.2
0.2
0.2
0.3
0.1
0.2
Americas
-
-
0.1
0.1
0.2
0.1
0.1
0.1
0.1
0.2
0.1
0.1
0.1
Europe
-
-
-
-
-
0.1
-
-
-
-
0.1
-
0.1
Asia Pacific
-
-
-
-
-
-
-
-
-
-
0.1
-
-
DCs
-0.1
-0.1
-0.1
-0.1
-0.1
-0.3
-0.2
-0.2
-0.2
-0.2
-0.3
-0.2
-0.2
FSU
-
-
-
-
-
-
-
-
-
-
-
-
-
Other Europe
-
-
-
-
-
-
-
-
-
-
-
-
-
China
0.1
0.1
-
-
-0.1
-
0.1
-
-
-0.1
-
0.1
-
(a) Total world demand
-
-
-
-
-
-
-
-
-
-
-
-
-
World demand growth
-
-
-
-
-
-
-
-
-
-
-
-
-
OECD
-
-
-
-
-
-0.2
-0.1
-0.1
-0.1
-0.1
-0.1
-0.1
-0.1
Americas
-
-
-
-
0.1
-
-
-
-
-
-
-
-
Europe
-
-
-
-
-
-0.2
-0.1
-0.1
-0.1
-0.1
-0.1
-0.1
-0.1
Asia Pacific
-
-
-
-
-
-
-
-
-
-
-
-
-
DCs
-
-
-
-
-
-0.1
-0.1
-
-
-
-
-
-
FSU
-
-
-
-
-
-
-
-
-
-
-
-
-
Other Europe
-
-
-
-
-
-
-
-
-
-
-
-
-
China
-
-
-
-
-
-
-0.1
-
-
-
-
-
-
Processing gains
-
-
-
-
-
-
-
-
-
-
-
-
-
Total non-OPEC supply
-
-
-
-
-
-0.3
-0.2
-0.1
-0.1
-0.1
-0.1
-0.1
-0.1
Total non-OPEC supply growth
-
-
-
-
-
-0.3
-0.2
-0.1
-0.2
-0.2
0.2
0.1
-
OPEC NGLs + non-conventionals
-
-
-
-
-
-
-
-
-
-
-
-
-
(b) Total non-OPEC supply and OPEC NGLs
-
-
-
-
-
-0.3
-0.2
-0.1
-0.1
-0.1
-0.1
-0.1
-0.1
OPEC crude oil production (secondary sources)
-
-
-
-
-
-
Total supply
-
-
-
-
0.1
-0.2
Balance (stock change and miscellaneous)
-
-
-
-
0.1
-0.2
-30
-32
-30
-31
-27
-
Non-OPEC supply
OECD closing stock levels (mb) Commercial SPR
-
-
-
-
-
-
Total
-30
-32
-30
-31
-27
-
-
-
-
-
-
-
-1
-1
-1
-1
-
Oil-on-water
Days of forward consumption in OECD Commercial onland stocks
-1
SPR
-
-
-
-
-
-
Total
-1
-1
-1
-1
-1
-
FSU net exports
-
-
-
-
-
-
-
-
-
-
-
-
-
(a) - (b)
-
-
-
-
-0.1
0.3
0.2
0.1
0.1
0.1
0.1
0.1
0.1
Memo items
Note: * This compares Table 10.3 in this issue of the MOMR with Table 10.3 in the October 2016 issue. This table shows only where changes have occurred. Source: OPEC Secretariat.
88
OPEC Monthly Oil Market Report – November 2016
Table 10.5: OECD oil stocks and oil on water at the end of period 2012
2013
2014
2015
4Q14
1Q15
2Q15
3Q15
4Q15
1Q16
2Q16
3Q16
Closing stock levels, mb OECD onland commercial Americas Europe Asia Pacific
2,655
2,559
2,705
2,985
2,705
2,789
2,877
2,953
2,985
3,015
3,052
3,052
1,338
1,286
1,414
1,560
1,414
1,458
1,507
1,541
1,560
1,589
1,609
1,616
912
881
886
990
886
939
940
967
990
1,004
1,006
994
405
392
405
435
405
392
430
445
435
421
438
442
1,547
1,584
1,580
1,587
1,580
1,583
1,585
1,579
1,587
1,593
1,591
1,595
Americas
696
697
693
697
693
693
696
697
697
697
697
697
Europe
436
470
470
473
470
470
471
467
473
477
473
477
Asia Pacific
415
417
417
416
417
420
418
415
416
419
421
421
4,202
4,144
4,285
4,571
4,285
4,371
4,462
4,532
4,571
4,608
4,643
4,647
879
909
924
1,017
924
864
916
924
1,017
1,055
1,094
1,068
OECD SPR
OECD total Oil-on-water
Days of forward consumption in OECD OECD onland commercial
58
56
58
56
58
61
61
64
64
66
65
66
Americas
54
54
55
53
58
60
60
63
64
65
65
66
Europe
68
66
67
65
66
69
66
71
73
72
70
73
Asia Pacific
49
47
49
48
47
52
56
54
51
55
57
54
34
33
34
35
34
35
34
34
34
35
34
34
Americas
30
29
29
29
28
28
28
28
28
29
28
28
Europe
30
31
32
35
35
35
33
34
35
34
33
35
Asia Pacific
51
49
50
51
48
55
54
51
49
55
55
52
91
90
91
90
92
96
95
98
98
100
99
100
OECD SPR
OECD total
Sources: Argus Media, Euroilstock, IEA, JODI, METI, OPEC Secretariat and US Energy Information Administration.
OPEC Monthly Oil Market Report – November 2016
89
Table 10.6: Non-OPEC supply and OPEC natural gas liquids, mb/d
US Canada Mexico OECD Americas* Norway UK Denmark Other OECD Europe OECD Europe Australia Other Asia Pacific OECD Asia Pacific Total OECD Brunei India Malaysia Thailand Vietnam Asia others Other Asia Argentina Brazil Colombia Trinidad & Tobago Latin America others Latin America Bahrain Oman Syria Yemen Middle East Chad Congo Egypt Equatorial Guinea South Africa Sudans Africa other Africa Total DCs FSU Russia Kazakhstan Azerbaijan FSU others Other Europe China Non-OPEC production Processing gains Non-OPEC supply OPEC NGL OPEC non-conventional OPEC (NGL+NCF) Non-OPEC & OPEC (NGL+NCF)
2013 2014 2015 11.2 13.0 14.0 4.0 4.3 4.4 2.9 2.8 2.6 18.2 20.1 21.1 1.8 1.9 1.9 0.9 0.9 1.0 0.2 0.2 0.2 0.7 0.7 0.7 3.6 3.6 3.8 0.4 0.4 0.4 0.1 0.1 0.1 0.5 0.5 0.5 22.2 24.3 25.3 0.1 0.1 0.1 0.9 0.9 0.9 0.6 0.7 0.7 0.4 0.4 0.4 0.3 0.3 0.4 0.2 0.2 0.2 2.6 2.6 2.7 0.7 0.7 0.7 2.6 2.9 3.1 1.0 1.0 1.0 0.1 0.1 0.1 0.3 0.3 0.3 4.8 5.0 5.2 0.2 0.2 0.2 0.9 0.9 1.0 0.1 0.0 0.0 0.1 0.1 0.0 1.4 1.3 1.3 0.1 0.1 0.1 0.3 0.3 0.3 0.7 0.7 0.7 0.3 0.3 0.3 0.2 0.1 0.1 0.2 0.3 0.3 0.3 0.3 0.3 2.1 2.1 2.1 10.9 11.1 11.3 13.6 13.5 13.7 10.6 10.7 10.8 1.6 1.6 1.6 0.9 0.9 0.9 0.4 0.4 0.4 0.1 0.1 0.1 4.2 4.3 4.4
3Q16 4Q16 2016 13.5 13.5 13.6 4.5 4.6 4.4 2.5 2.4 2.5 20.5 20.5 20.5 1.9 2.0 2.0 0.9 1.0 1.0 0.1 0.2 0.1 0.6 0.6 0.6 3.6 3.8 3.7 0.4 0.4 0.4 0.1 0.1 0.1 0.5 0.5 0.4 24.5 24.7 24.7 0.1 0.1 0.1 0.9 0.8 0.9 0.7 0.8 0.8 0.4 0.4 0.4 0.3 0.3 0.3 0.2 0.3 0.2 2.7 2.7 2.7 0.7 0.7 0.7 3.3 3.3 3.1 0.9 0.9 0.9 0.1 0.1 0.1 0.3 0.3 0.3 5.2 5.2 5.1 0.2 0.2 0.2 1.0 1.0 1.0 0.0 0.0 0.0 0.0 0.0 0.0 1.3 1.3 1.3 0.1 0.1 0.1 0.3 0.3 0.3 0.7 0.7 0.7 0.3 0.3 0.3 0.1 0.1 0.1 0.3 0.3 0.3 0.3 0.3 0.3 2.1 2.1 2.1 11.3 11.4 11.2 13.7 14.0 13.9 11.0 11.1 11.0 1.4 1.7 1.6 0.9 0.9 0.9 0.4 0.4 0.4 0.1 0.1 0.1 4.0 4.0 4.1
Change Change 16/15 1Q17 2Q17 3Q17 4Q17 2017 17/16 -0.4 13.4 13.4 13.4 13.6 13.5 -0.2 0.0 4.6 4.6 4.6 4.7 4.6 0.2 -0.1 2.4 2.3 2.3 2.2 2.3 -0.2 -0.5 20.4 20.3 20.3 20.5 20.4 -0.2 0.0 2.0 1.9 1.9 2.0 2.0 0.0 0.0 1.1 1.0 0.9 1.0 1.0 0.0 0.0 0.1 0.1 0.1 0.1 0.1 0.0 -0.1 0.6 0.6 0.6 0.6 0.6 0.0 0.0 3.9 3.7 3.5 3.8 3.7 0.0 0.0 0.4 0.4 0.4 0.4 0.4 0.0 0.0 0.1 0.1 0.1 0.1 0.1 0.0 0.0 0.4 0.5 0.4 0.4 0.4 0.0 -0.6 24.7 24.5 24.3 24.7 24.6 -0.2 0.0 0.1 0.1 0.1 0.1 0.1 0.0 0.0 0.9 0.9 0.9 0.9 0.9 0.0 0.0 0.8 0.8 0.8 0.8 0.8 0.0 0.0 0.4 0.4 0.4 0.4 0.4 0.0 0.0 0.3 0.3 0.3 0.3 0.3 0.0 0.0 0.3 0.3 0.3 0.3 0.3 0.0 0.0 2.7 2.7 2.7 2.7 2.7 0.0 0.0 0.7 0.7 0.7 0.7 0.7 0.0 0.1 3.3 3.3 3.4 3.5 3.4 0.3 -0.1 0.9 0.9 0.9 0.9 0.9 0.0 0.0 0.1 0.1 0.1 0.1 0.1 0.0 0.0 0.3 0.3 0.3 0.3 0.3 0.0 -0.1 5.3 5.3 5.3 5.4 5.3 0.2 0.0 0.2 0.2 0.2 0.2 0.2 0.0 0.0 1.0 1.0 1.0 1.0 1.0 0.0 0.0 0.0 0.0 0.0 0.0 0.0 0.0 0.0 0.0 0.0 0.0 0.0 0.0 0.0 0.0 1.3 1.3 1.3 1.2 1.3 0.0 0.0 0.1 0.1 0.1 0.1 0.1 0.0 0.0 0.4 0.4 0.4 0.4 0.4 0.1 0.0 0.7 0.7 0.7 0.7 0.7 0.0 0.0 0.3 0.3 0.3 0.3 0.3 0.0 0.0 0.1 0.1 0.1 0.1 0.1 0.0 0.0 0.3 0.3 0.2 0.2 0.2 0.0 0.0 0.3 0.4 0.4 0.4 0.4 0.1 0.0 2.2 2.2 2.2 2.2 2.2 0.1 -0.1 11.4 11.5 11.5 11.6 11.5 0.3 0.2 14.1 13.9 14.0 14.1 14.0 0.2 0.2 11.1 11.0 11.0 11.1 11.1 0.0 0.0 1.7 1.7 1.8 1.8 1.8 0.2 0.0 0.9 0.8 0.8 0.8 0.8 0.0 0.0 0.4 0.4 0.4 0.4 0.4 0.0 0.0 0.1 0.2 0.2 0.2 0.2 0.0 -0.3 4.0 4.0 4.0 4.0 4.0 -0.1
51.0
53.3
54.8
53.6
54.3
54.0
-0.8
54.5
54.0
53.9
54.6
54.2
0.2
2.1
2.2
2.2
2.2
2.2
2.2
0.0
2.2
2.2
2.2
2.2
2.2
0.0
53.2
55.5
57.0
55.8
56.5
56.2
-0.8
56.7
56.2
56.1
56.8
56.4
0.2
5.6 0.3 5.8
5.7 0.3 6.0
5.8 0.3 6.1
6.0 0.3 6.3
6.0 0.3 6.3
6.0 0.3 6.3
0.1 0.0 0.2
6.0 0.3 6.4
6.1 0.3 6.4
6.1 0.3 6.4
6.2 0.3 6.5
6.1 0.3 6.4
0.1 0.0 0.1
59.0
61.5
63.1
62.1
62.8
62.5
-0.6
63.0
62.6
62.5
63.3
62.9
0.4
Note: * Chile has been included in OECD Americas. Totals may not add up due to independent rounding. Source: OPEC Secretariat.
90
OPEC Monthly Oil Market Report – November 2016
Table 10.7: World Rig Count
US Canada Mexico
2012 2013 2014 2015 1,919 1,761 1,862 977 364 354 380 192
Change 2015/14 -885 -188
4Q15 754 169
1Q16 551 172
2Q16 420 49
52
-34
39
36
22
25
2,390 2,221 2,327 1,221
106
106
86
Oct 16 547 157
Change Oct/Sep 39 17
25
21
-4
3Q16 Sep 16 479 508 122 140
-1,107
962
759
490
626
673
725
52
Norway
17
20
17
17
1
15
18
17
18
16
9
-7
UK
18
17
16
14
-2
12
9
9
9
8
7
-1
119
135
145
117
-28
110
104
92
94
92
87
-5
24
27
26
17
-9
15
10
6
5
4
4
0
-1,144 1,087
873
588
724
769
816
47
Americas
Europe Asia Pacific Total OECD
2,533 2,383 2,499 1,355
Other Asia
172
180
194
175
-19
167
157
161
167
167
161
-6
Latin America
180
166
172
145
-27
128
83
62
64
64
65
1
Middle East
136
102
108
102
-6
106
98
92
85
81
78
-3
26
35
47
30
-16
22
21
19
15
14
17
3
513
484
521
452
-69
423
359
334
330
326
321
-5
922 1,055
1,095
1,137
42
Africa Total DCs Non-OPEC rig count Algeria
3,046 2,867 3,019 1,807 36
47
48
51
-1,213 1,511 1,232 3
49
52
54
55
53
53
0
9
11
15
11
-4
11
9
9
4
4
2
-2
20
26
24
12
-12
4
3
3
5
6
6
0
5
6
7
4
-3
2
1
1
0
0
0
0
Indonesia
45
38
34
27
-7
24
19
17
18
19
17
-2
Iran**
54
54
54
54
0
54
57
57
57
57
57
0
Iraq**
58
83
79
52
-27
51
49
42
39
40
42
2
Kuwait**
31
32
38
47
8
42
41
42
47
48
48
0
Libya**
9
15
10
3
-8
1
1
1
1
1
1
0
Nigeria
36
37
34
30
-4
28
27
25
24
24
23
-1
8
9
10
8
-3
6
7
7
7
9
12
3
112
114
134
155
21
158
157
154
155
155
157
2
Angola Ecuador Gabon
Qatar Saudi Arabia
24
28
34
42
8
52
50
50
51
53
54
1
Venezuela
117
121
116
110
-6
112
111
103
93
93
90
-3
OPEC rig count
562
620
637
606
-31
592
584
566
558
562
562
0
3,608 3,486 3,656 2,412
-1,244 2,103 1,816 1,488 1,612
1,657
1,699
42
2,594 2,611 2,795 1,727
-1,068 1,471 1,268 1,043 1,135
1,177
1,185
8
UAE
Worldwide rig count* of which: Oil Gas
886
746
743
563
-180
509
422
315
343
348
382
34
Others
106
109
95
100
5
102
106
110
116
114
114
0
Note: Totals may not add up due to independent rounding. na: Not available. Sources: Baker Hughes Incorporated & Secretariat's estimates.
OPEC Monthly Oil Market Report – November 2016
* Excludes China and FSU. ** Estimated figure when Baker Hughes Incorporated did not reported the data.
91
Monthly Endnotes
Monthly Endnotes 2016 World Oil Outlook underscores the increasingly complex nature of the oil industry Demand for OPEC crude is seen reaching 41 mb/d by 2040, with the estimated share of OPEC crude in total liquids supply increasing to 37% from 34% in 2015, according to OPEC’s World Oil Outlook (WOO) 1 which was released on 8 November. Meanwhile, oil-related investment required to cover future demand for oil over the forecast period of 2016-2040 is estimated at almost $10 trillion. Further highlights from this year’s WOO include: Total primary energy demand is set to increase by 40% in the period to 2040. Combined, oil and gas are expected to supply around 53% of global energy demand by 2040. The outlook for the long-term global economic growth rate to 2040 is 3.5% per annum, the same as in the 2015 WOO. Crude oil demand in the medium term has been revised upward by 1 mb/d, compared with WOO 2015, rising above 99 mb/d by 2021. In the long-term, oil demand has been revised slightly downwards by 0.4 mb/d, with total demand at over 109 mb/d by 2040. Developing countries will continue to lead demand growth, increasing by close to 25 mb/d, to reach over 66 mb/d by 2040. In sectorial terms, long-term demand growth comes mainly from the road transportation (6.2 mb/d), petrochemicals (3.4 mb/d) and aviation (2.8 mb/d) sectors. Oil demand in the road transportation sector is driven by the increasing car fleet in developing Countries and declining oil use per vehicle in the OECD region. Non-OPEC liquids supply is expected to drop from close to 57 mb/d in 2015 to just below 56 mb/d in 2017, before recovering slowly to just over 58.5 mb/d in 2021. In the long term, non-OPEC liquids output is anticipated to see a slow rise to just under 61.5 mb/d by 2027, before dropping to just under 59 mb/d by 2040. New refining capacity continues to follow demand growth to developing regions, led by Asia-Pacific, which is projected to add 9.5 mb/d by 2040. Capacity rationalization remains a long-term requirement, with some 2.5 mb/d of net refinery closures expected by 2040, an estimated 4 mb/d by 2025, and a further 5 mb/d are indicated as needed by 2040 if refining regions are to maintain utilization rates of at least 80%. The primary trend in long-term oil trade is expanding crude imports into the AsiaPacific from the Middle East, with an expected addition of 6.5 mb/d by 2040. The future tightening of climate change policies will likely lead to reduced energy demand and a further shift in the energy mix towards renewables.
1
An interactive version of the WOO can be found on the OPEC website at opec.org.
92
OPEC Monthly Oil Market Report – November 2016
Entry into force of Paris Agreement on climate change highlights potential of CCUS The Paris Agreement on climate change officially entered into force on 4 November. The agreement had earlier passed the threshold of 55 nations accounting for more than 55% of greenhouse gas emissions in October, which allowed it to come into force 30 days later. More than 100 of the 197 Parties to the Convention ratified the agreement ahead of this year’s UN Climate Change Conference, held in Marrakech, Morocco from 7–18 November 2016. Successful implementation of the Agreement is a priority for OPEC, and OPEC Member Countries have been involved in climate change negotiations and the implementation of the Convention since its inception. The Organization recognizes that climate change is a global challenge requiring global solutions. It has been said that there is no ‘silver bullet’ for climate actions, because no single energy source can achieve sustainability on its own. Across the spectrum – from renewables to coal and hydro to nuclear – all energy sources face varying barriers and hurdles, and local circumstances will have a strong influence on the energy mix used. Moreover, it is important to consider the strengths that various energy sources can bring to this global effort. As early as the mid-70s, OPEC highlighted the need for sustainable development and continuously sought opportunities to facilitate the spread of good practices through information sharing and the exchange of experiences. More broadly, the oil industry has a history of over 40 years of addressing environmental impacts by lowering sulphur dioxide emissions, improving energy efficiency, integrating cogeneration into production systems and utilizing CO2 for enhanced oil recovery (EOR). Large-scale deployment of carbon capture, utilization and storage (CCUS) has been seen as essential for achieving the objectives of the Paris Agreement. Enhanced oil recovery using CO2 – in which carbon dioxide is injected into oil reservoirs to enhance the amount of oil that can be recovered – has been commercially used for several decades, primarily in North America. Harnessing this practice for permanent storage of CO2 through CCS can provide a win-win solution. With modifications, CO2 EOR technology can be applied to a range of circumstances with additional co-benefits. In recognition of this potential, the United Arab Emirates opened a commercial-scale CCUS facility Al Reyadah earlier this month. The facility, which is a joint venture between state-owned Abu Dhabi National Oil Co. (ADNOC) and Abu Dhabi’s Masdar, will take 800,000 metric tons of carbon dioxide per year emitted by Abu Dhabi steel producer, Emirate Steel Industries (ESI) and re-inject it into nearby oil reservoirs for EOR. Further strengthening and supporting research and development (R&D) efforts could reduce the cost of deployment, making CCUS a viable component in a global emissions portfolio. As a win-win opportunity for developing and developed countries, CO2 utilization in EOR should be promoted through technical and financial support to facilitate its spread to the developing world. In this regard, the Paris Agreement could play a critical role in gearing its support mechanisms to promote CCUS development and deployment.
OPEC Monthly Oil Market Report – November 2016
93
Contributors to the OPEC Monthly Oil Market Report Editor-in-Chief Oswaldo Tapia, Head, Energy Studies Department, In Charge of Research Division email: otapia(at)opec.org
Editor Hojatollah Ghanimi Fard, Head, Petroleum Studies Department email: h.ghanimifard(at)opec.org
Analysts Crude Oil Price Movements
Eissa Alzerma email: ealzerma(at)opec.org
Commodity Markets
Hector Hurtado email: hhurtado(at)opec.org
World Economy
Afshin Javan email: ajavan(at)opec.org Imad Al-Khayyat email: ial-khayyat(at)opec.org Joerg Spitzy email: jspitzy(at)opec.org
World Oil Demand
Hassan Balfakeih email: hbalfakeih(at)opec.org
World Oil Supply
Mohammad Ali Danesh email: mdanesh(at)opec.org
Product Markets and Refinery Operations
Elio Rodriguez email: erodriguez(at)opec.org
Tanker Market and Oil Trade
Anisah Almadhayyan email: aalmadhayyan(at)opec.org
Stock Movements
Aziz Yahyai email: ayahyai(at)opec.org
Monthly Endnotes
Douglas Linton email: dlinton(at)opec.org
Technical and editorial team
Aziz Yahyai email: ayahyai(at)opec.org Douglas Linton email: dlinton(at)opec.org
Data services Adedapo Odulaja, Head, Data Services Department (aodulaja(at)opec.org), Hossein Hassani, Statistical Systems Coordinator (hhassani(at)opec.org), Pantelis Christodoulides (World Oil Demand), Klaus Stoeger (World Oil Supply and World Economy), Mouhamad Moudassir (Product Markets and Refinery Operations), Mohammad Sattar (Crude Oil Price Movements, Commodities, Tanker Market and Oil Trade), Ryszard Pospiech (Stock Movements)
Editing, production, design and circulation Alvino-Mario Fantini, Maureen MacNeill, Scott Laury, Viveca Hameder, Hataichanok Leimlehner, Andrea Birnbach
94
OPEC Monthly Oil Market Report – November 2016
Disclaimer
The data, analysis and any other information contained in the Monthly Oil Market Report (the “MOMR”) is for informational purposes only and is not intended as a substitute for advice from your business, finance, investment consultant or other professional. The views expressed in the MOMR are those of the OPEC Secretariat and do not necessarily reflect the views of its Governing Bodies and/or individual OPEC Member Countries. Whilst reasonable efforts have been made to ensure the accuracy of the MOMR’s content, the OPEC Secretariat makes no warranties or representations as to its accuracy, currency reference or comprehensiveness, and assumes no liability or responsibility for any inaccuracy, error or omission, or for any loss or damage arising in connection with or attributable to any action or decision taken as a result of using or relying on the information in the MOMR. The MOMR may contain references to material(s) from third parties whose copyright must be acknowledged by obtaining necessary authorization from the copyright owner(s). The OPEC Secretariat shall not be liable or responsible for any unauthorized use of third party material(s). All rights of the Publication shall be reserved to the OPEC Secretariat, including every exclusive economic right, in full or per excerpts, with special reference but without limitation, to the right to publish it by press and/or by any communications medium whatsoever, including Internet; translate, include in a data base, make changes, transform and process for any kind of use, including radio, television or cinema adaptations, as well as sound-video recording, audio-visual screenplays and electronic processing of any kind and nature whatsoever. Full reproduction, copying or transmission of the MOMR is not permitted in any form or by any means by third parties without the OPEC Secretariat’s written permission, however the information contained therein may be used and/or reproduced for educational and other noncommercial purposes without the OPEC Secretariat’s prior written permission, provided that OPEC is fully acknowledged as the copyright holder.
OPEC Monthly Oil Market Report – November 2016
95
OPEC Basket average price
US$/b
up 4.98 in October
October OPEC crude production up 0.24 in October
Economic growth rate
October 2016
47.87
September 2016
42.89
Year-to-date
39.45
mb/d, according to secondary sources
October 2016
33.64
September 2016
33.41
per cent
World
OECD
US
Japan
Euro-zone
China
India
2016
2.9
1.6
1.5
0.7
1.6
6.7
7.5
2017
3.1
1.7
2.1
0.9
1.3
6.2
7.2
Supply and demand 2016
mb/d
16/15
2017
17/16
World demand
94.4
1.2
Non-OPEC supply
56.2
–0.8
6.3
0.2
OPEC NGLs
31.9
1.9
Difference
OPEC NGLs Difference
World demand
95.5
1.2
Non-OPEC supply
56.4
0.2
6.4
0.1
32.7
0.8
OECD commercial stocks
mb
Jul 16
Aug 16 Sep 16
Sep 16/Aug 16
Sep 15
Crude oil
1,552
1,494
1,481
–13.0
1,455
Products
1,554
1,571
1,571
–0.4
1,498
Total
3,076
3,065
3,052
–13.4
2,953
65.9
66.1
65.7
–0.4
63.6
Days of forward cover
Next report to be issued on 14 December 2016.