Service Management – Supporting Facility Univ.-Prof. Dr.-Ing. Wolfgang Maass Chair in Economics – Information and Service Systems (ISS) Saarland University, Saarbrücken, Germany
WS 2011/2012 Thursdays, 8:00 – 9:30 a.m. Room HS 024, B4 1
General Agenda 1. 2. 3. 4. 5. 6. 7. 8. 9. 10. 11. 12. 13. 14. 15.
Introduction Service Strategy New Service Development (NSD) Service Quality Supporting Facility Forecasting Demand for Services (Part A) Forecasting Demand for Services (Part A) Managing Capacity and Demand Managing Waiting Lines Capacity Planning and Queuing Models Services and Information Systems ITIL Service Design IT Service Infrastructures Guest Lecture – Dr. Roehn, Deutsche Telekom Summary and Outlook
23.11.2011
Univ.-Prof. Dr.-Ing. Wolfgang Maass
Slide 2
Agenda Lecture 5 •
Servicescape • • •
• •
Definition Importance of Servicescape Design Framework
Facility Layout Process Analysis Facility Location • • •
23.11.2011
Strategic Location Considerations Modeling Considerations Huff Model
Univ.-Prof. Dr.-Ing. Wolfgang Maass
Slide 3
Servicescape: Definition People need orientation to feel comfortable: Design of service facilities important • • •
Hotels: Entrance atrium for better orientation Maps: „You are here‰ in shopping malls Discounter: Same product arrangement in each store
Servicescape: Servicescape: „[⁄] the manmade, physical surroundings as opposed to the natural or social environment [⁄]‰ (Bitner, 1992). • •
Customer & employee behavior are influenced by the servicescape E.g., expensive versus standard restaurant
(Bitner, 1992) 23.11.2011
Univ.-Prof. Dr.-Ing. Wolfgang Maass
Slide 4
Servicescape: Importance of Servicescape Design „[⁄] variables such as pricing, advertising [⁄] and special promotions are given much more attention than the physical setting as ways in which customers can be [⁄] satisfied by a firm's services.‰ (Bitner (Bitner 1992) Services are produced and consumed at the same time: Service is provided at companyÊs facilities: • • •
Servicescape influences customerÊs perception of service quality Servicescape offers hints regarding competences of company (Berry & Clark, 1986; Shostack, 1977; Rapoport, 1982) Servicescape influences ⁄ • • •
23.11.2011
companyÊs image customerÊs satisfaction with service quality (Bitner, 1990; Harrell, Hutt & Anderson,1980). satisfaction, productivity and motivation of employees (e.g., Becker ,1981; Davis,1984; Steele,1986).
Univ.-Prof. Dr.-Ing. Wolfgang Maass
Slide 5
Servicescape: Framework (1) Environmental Dimensions
(2) Holistic Environment
(3) Moderators
(4) Internal Responses
(5) Behavior
Cognitive/Emotional/ Physiological Employee Response Moderators
Ambient Conditions
Approach/Avoid Employee Responses
Space/Function
Perceived Servicescape
Social Interactions Customer Responses
Signs, Symbols & Artifacts
Customer Response Moderators
Approach/Avoid Cognitive/Emotional/ Physiological
No direct link between environmental dimensions/perceived servicescape and behavior (Bitner, 1992) 23.11.2011
Univ.-Prof. Dr.-Ing. Wolfgang Maass
Slide 6
Servicescape: Framework: Environmental Dimensions (1) Environmental dimensions: Physical environment that can be influenced by the company (= servicescape) •
• •
Ambient conditions: Background, can attract the desired clientele (music, temperature, illumination, colors, e.g., top charts music in a store for teenagers) Space/function: Organization of furnishings, layout and functionality (e.g., order or chaos, convenient or glamorous) Signs, symbols & artifacts: Signals for appropriate behavior and „rules‰ • Furniture: simple or elegant atmosphere • Pictures & decoration: competence, price range • E.g., quality of dishes, cutlery and servicing in a restaurant
Combination of environmental dimensions influences the perceived servicescape Measuring servicescape: Method consisting of 3 dimensions of Bitner (Pantouvakis, 2010)
(1) Environmental Dimensions
Ambient Conditions
Space/ Function
Perceived Servicescape
Signs, Symbols & Artifacts
(Bitner, 1992) 23.11.2011
Univ.-Prof. Dr.-Ing. Wolfgang Maass
Slide 7
Servicescape: Framework: Environmental Dimensions Environmental dimensions: Design components of servicescape • Company can change them to influence the customers Examples: Ambient conditions: Music is played in the background to influence behavior of customers: E.g., in-store music and also music tempo variations influence the in-store traffic flow & sales volume (Milliman, 1982)
Space/function: Layout and organization of merchandize influence customerÊs willingness to pay: E.g., in high design store (open layout, neat organization of merchandise) price acceptability of customers is higher than in other stores (Grewal & Baker, 1994)
Signs, symbols & artifacts: Decor influences consumerÊs expected price level: E.g., chic objects in the restaurant environment, compared to casual ones, positively affect price expectations (Verhoeven et al., 2009)
23.11.2011
Univ.-Prof. Dr.-Ing. Wolfgang Maass
Slide 8
Agenda Lecture 5 •
Servicescape • • •
• •
Definition Importance of Servicescape Design Framework
Facility Layout Process Analysis Facility Location • • •
23.11.2011
Strategic Location Considerations Modeling Considerations Huff Model
Univ.-Prof. Dr.-Ing. Wolfgang Maass
Slide 9
Facility Layout Process Analysis Example of a process: License renewal process
In
Step 1: Review application for correctness
Step 2: Process and record payment
Step 3: Check for violations and restrictions
Step 4: Conduct eye test
Step 5: Photograph applicant
Step 6: Issue temporary license
Management task: Capacity planning • How many employees are needed to serve a certain amount of customers? • How can the process be improved to increase the number of customers being served?
23.11.2011
Univ.-Prof. Dr.-Ing. Wolfgang Maass
Slide 10
Out
Facility Layout Process Analysis Layout of service delivery system important: Reduction of costs Some Processes of service delivery: Divided into sequence of steps, all customers must complete all of these (e.g., license renewal process) Terminology: • •
Cycle time (CT) = Average time of completion of one step (e.g., number of seconds needed for reviewing application for correctness) Bottleneck = Step with longest CT of a whole process (e.g., step which takes longest for completion) • • •
•
Capacity = Measure of output per unit of time if fully busy • • • •
•
Limits whole process of service delivery Defines maximum flow rate for whole process Reasons for bottleneck: Lack of personnel, number of customers arriving at the same time, slow information processing Maximum performance of one step or the whole system Capacity of one step: 1/CT Capacity of whole system: Determined by bottleneck capacity, 1/longest CT Capacity per day: 1/longest CT * 8 hours
Capacity utilization = Actual output compared to maximum output (actual output/capacity)
Number of step Capacity per hour CT in seconds
(Fitzsimmons & Fitzsimmons, 2011) 23.11.2011
Univ.-Prof. Dr.-Ing. Wolfgang Maass
Slide 11
Facility Layout Process Analysis Example: License renewal process: The activities of this process are shown in the table. The current process steps are demonstrated in the process flow chart below. Step 3 represents the bottleneck. Activity 1 2 3 4 5 6
In
1
Description Review application for correctness Process and record payment Check for violations and restrictions Conduct eye test Photograph applicant Issue temporary license
2
3
240 15
CT (in sec.)
30
15 30 60 40 20 30
4
120
Capacity per hour CT in seconds
5
60 60
Number of step
6
90 40
180 20
120 30
Bottleneck (Fitzsimmons & Fitzsimmons, 2011) 23.11.2011
Univ.-Prof. Dr.-Ing. Wolfgang Maass
Slide 12
Out
Facility Layout Process Analysis: Brainteaser
10 Minutes
23.11.2011
•
Have a look at the slide before. What is the current capacity of the whole system?
•
The capacity of the whole system is supposed to be increased to 120 by employing just one new clerk. How could this be done?
•
Please draw a process flow chart showing the improved process.
Univ.-Prof. Dr.-Ing. Wolfgang Maass
Slide 13
Facility Layout Process Analysis: Brainteaser: Solution • Current capacity of the system: 60 (capacity of bottleneck step) • To increase the capacity to 120, steps 1 and 4 need to be combined and both operated by one clerk. They need to be trained to be able to operate both tasks. • A new clerk for activity 3 is employed: 2 clerks working in parallel. Number of step Capacity per hour
In
1&4
CT in seconds
3 65
60
55
60
2
5
6
120 In
1&4
3 65
55 New capacity: 130
30
60
180 20
120
Out
30
60 New capacity: 120 (Fitzsimmons & Fitzsimmons, 2011)
23.11.2011
Univ.-Prof. Dr.-Ing. Wolfgang Maass
Slide 14
Facility Layout Process Analysis: Brainteaser: Solution • Why is it not possible to just employ a new clerk for step 3? Bottleneck would slip to step 4 (capacity: 90) • Calculation: New CT for step 1 & 4: New capacity for step 1 & 4:
CT 1 + CT 4 = 55 sec. per person 60 sec./55 sec. = 1,09 persons per min. 1,09 * 60 min. = 65 persons per hour
• New capacity for whole system: 120 (capacity of bottleneck step 2)
(Fitzsimmons & Fitzsimmons, 2011) 23.11.2011
Univ.-Prof. Dr.-Ing. Wolfgang Maass
Slide 15
Agenda Lecture 5 •
Servicescape • • •
• •
Definition Importance of Servicescape Design Framework
Facility Layout Process Analysis Facility Location • • •
23.11.2011
Strategic Location Considerations Modeling Considerations Huff Model
Univ.-Prof. Dr.-Ing. Wolfgang Maass
Slide 16
Facility Location: Strategic Location Considerations Several strategic location dimensions were identified in a study regarding hotel sites: •
Flexibility: Ability to react to a changing economic, demographic or competitive situations • • •
•
Competitive positioning: Ability to reduce threat from competitors • • •
•
Establish several branches at different locations: Increase „visibility‰ at the market Fast occupation of prime locations E.g., building a hotel next to the beach promenade
Demand management: Ability to manage demand regarding time and quantity • • •
•
Location decisions: long-term, high employment of capital Ability to adapt to changes and to compensate crisis is important E.g., building of a hotel near a convention center
Demand fluctuates due to economic situation, season or day of the week Measures are needed to create a stable demand or to adopt quickly E.g. hotel: different prices for summer and winter
Focus: Ability to offer the identical service at different locations • • •
Standard service defined for all branches of a company Expansion is easier due to transferability of service standards E.g., hotel: chain has a certain manner of addressing the customers, making the beds and offering of extra services
(Kimes et al., 1990) 23.11.2011
Univ.-Prof. Dr.-Ing. Wolfgang Maass
Slide 17
Facility Location: Modeling Considerations
Geographic Representation • Traditional resolution of location problems: Geographical conditions •
•
Location on network: Restricted possibilities of locating & linking two locations (only on network nodes) E.g., highway system as network, intersections are nodes: Only routes can be used for travelling, calculating the shortest distance Location on flat surface (plane): Infinite possibilities of locating & linking two locations: Latitudes & longitudes used for locating. Distance between locations measured at the extremes • •
Euclidian metric method Metropolitan metric method Modeling Considerations
Geographic Representation Network Euclidian Metric
Number of Facilities
Optimization Criteria
Plane Metropolitan Metric
(Fitzsimmons & Fitzsimmons, 2011) 23.11.2011
Univ.-Prof. Dr.-Ing. Wolfgang Maass
Slide 18
Facility Location: Modeling Considerations (1.a) Euclidian metric method • Vector (compare to Pythagorean theorem) • • •
dji = Distance between points i and j xi, yi = Coordinates of ith point xj, yj = Coordinates of jth point
Example euclidian metric: • •
Origin: xi, yi = 2; 2 Destination: xj, yj = 4; 4
(1.b) Metropolitan metric method • Rectangular displacement (i.e., north-south or east-west directions) Example metropolitan metric: • •
Origin: xi, yi = 2; 2 Destination: xj, yj = 4; 4
(Fitzsimmons & Fitzsimmons, 2011) 23.11.2011
Univ.-Prof. Dr.-Ing. Wolfgang Maass
Slide 19
Facility Location: Huff Model Huff model: model Model used for locating a retail outlet (e.g., locating a new „Globus‰ supermarket in the Saarland) Objective: Finding the optimal location Steps: • 1) Calculation of attraction Aij of a facility to consumers • Aij = Attraction fo facility j for consumer i • Sj = Size of the facility j • Tij = Travel time from consumer iÊs location to facility j • = Parameter estimated empirically to reflect the effect of travel time on different kinds of shopping (large shopping mall vs. small convenience store)
• 2) Calculation of probability Pij of consumer to travel to certain facility • Pij = Probability of consumer from statistical area i to travel to shopping facility j
(Fitzsimmons & Fitzsimmons, 2011; Huff 1966) 23.11.2011
Univ.-Prof. Dr.-Ing. Wolfgang Maass
Slide 20
Facility Location: Huff Model •
3) Calculation of estimated annual consumer expenditures Ejk • • • •
Ejk = Estimate of total annual consumer expenditures for product class k at a shopping facility j Ci = Number of consumers at area i Bik = Average annual shopping budget of a consumer at area i for product class k m = Number of areas
• 4) Calculation of estimated market share Mjk • Mjk = Estimate of market share captured by facility j of sales of product class k
(Fitzsimmons & Fitzsimmons, 2011; Huff 1966) 23.11.2011
Univ.-Prof. Dr.-Ing. Wolfgang Maass
Slide 21
Facility Location: Huff Model: Example Example: Calculation of expenditure & market share of an existing and a new supermarket • Existing size of the facility S: 1, new size S: 3 • =2 • Monthly expenditure Bik per person: 100 € • Number of possible customers Ci in community A: 2000, community B: 1000 Travel time Tij : Facility j New Existing
Community (=customers) i A B 8 6 5 7
Is it reasonable to build a new supermarket according to these data? (Fitzsimmons & Fitzsimmons, 2011; Huff 1966) 23.11.2011
Univ.-Prof. Dr.-Ing. Wolfgang Maass
Slide 22
Facility Location: Huff Model: Example: Solution Attraction Aij : Facility j New Existing
Community (=customers) i A B 0,0469 0,0833 0,0400 0,0204
Probability Pij : Facility j New Existing
Community (=customers) i A B 0,54 0,80 0,46 0,20
Expenditure Ejk & Market share Mjk Facility j New Existing
A 108.000 92.000
Community (=customers) i B Total Exp. Market share 80.000 188.000 0,63 20.000 112.000 0,37
According to these data, a new supermarket should be built. (Fitzsimmons & Fitzsimmons, 2011; Huff 1966) 23.11.2011
Univ.-Prof. Dr.-Ing. Wolfgang Maass
Slide 23
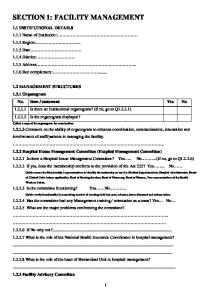
Facility Location: Huff Model: Actual: 4 Retailers (800-3.200 qm), Planned: 1 new retailer (800 qm),
= 1.2
(Spiekermann & Wegener, 2009) 23.11.2011
Univ.-Prof. Dr.-Ing. Wolfgang Maass
Slide 24
Outlook 1. 2. 3. 4. 5. 6. 7. 8. 9. 10. 11. 12. 13. 14. 15.
Introduction Service Strategy New Service Development (NSD) Service Quality Supporting Facility Forecasting Demand for Services (Part A) Forecasting Demand for Services (Part A) Managing Capacity and Demand Managing Waiting Lines Capacity Planning and Queuing Models Services and Information Systems ITIL Service Design IT Service Infrastructures Guest Lecture – Dr. Roehn, Deutsche Telekom Summary and Outlook
23.11.2011
Univ.-Prof. Dr.-Ing. Wolfgang Maass
Slide 25
Literature Books: • • • •
Becker, F.D. (1981), Workspace, Praeger Publishers New York. Fitzsimmons, J. A. & Fitzsimmons, M. J. (2011), Service Management - Operations, Strategy, Information Technology, McGraw – Hill. Rapoport, A. (1982), The Meaning of the Built Environment, Sage Publications, Inc. Beverly Hills. Steele, F. (1986), Making and Managing High-Quality Workplaces, Teachers College Press New York.
Papers: • • • • • • • • •
Bitner, M.J. (1990), "Evaluating Service Encounters: The Effects of Physical Surroundings and Employee Responses‰, Journal of Marketing, 54 (April), 69-82. Bitner, M.J. (1992), „The impact of Physical surroundings on customers and employees‰, Journal of Marketing, 56(2), pp. 57-71. Davis, T.R.V. (1984), „The influence of the physical environment in offices‰, Academy of Management Review, 9(2), pp. 271-283. Berry, L.L. & Clark,T. (1986), "Four Ways to Make Services More Tangible‰, Business (October-December), pp. 53-4. Grewal, D. & Baker, J. (1994), „Do retail store environmental factors affect consumersÊ price acceptability? An empirical examination‰, International Journal of Research in Marketing, 11, pp. 107-115. Pantouvakis, A. (2010), „The relative importance of service features in explaining customer satisfaction‰, Managing Service Quality, 20(4), pp. 366-387. Harrell, G.D. , Hutt, M.D. & Anderson, J.C. (1980), "Path Analysis of Buyer Behavior Under Conditions of Crowding„, Journal of Marketing Research, 17 (February), pp. 45- 51. Kimes, S.E. & Fitzsimmons, J.A. (1990), „Selecting Profitable Hotel Sites at La Quinta Motor Inns‰, Interfaces, 20(2), pp. 12-20. Kotler, P. (1973), „Atmospherics as a marketing tool‰, Journal of Retailing, 49(4), pp. 48-64.
23.11.2011
Univ.-Prof. Dr.-Ing. Wolfgang Maass
Slide 26
• • •
Milliman, R.E. (1992), „Using background music to affect the behavior of supermarket shoppers‰, Journal of Marketing, 46(3), pp. 86-91. Shostack, G. L. (1977), "Breaking Free From Product Marketing„, Journal of Marketing, 41(April), pp. 73-80. Verhoeven, J.W.M., van Rompay, T.J.L. & Pruyn, A.T.H. (2009), „The price facade: Symbolic and behavioral price cues in service environments‰, International Journal of Hospitality Management, 28, pp. 604-611.
Others: •
Spiekermann, K. & Wegener, M. (2009), „Standortwahl des Einzelhandels‰, Lehrveranstaltung "Modelle in der Raumplanung„, http://spiekermann-wegener.de/mir/pdf/MIR2_5_120509.pdf.
23.11.2011
Univ.-Prof. Dr.-Ing. Wolfgang Maass
Slide 27
Univ.-Prof. Dr.-Ing. Wolfgang Maass Chair in Information and Service Systems Saarland University, Germany
Univ.-Prof. Dr.-Ing. Wolfgang Maass