Norfolk County – Asset Management Plan – Sanitary Sewers
An overview of the County’s Asset Management Practices based on the Ontario Ministry of Infrastructure’s Building Together Initiative
Prepared for: Norfolk County 183 Main St. Delhi, Ontario N4B 2M3 Prepared by: Stantec Consulting Ltd. 49 Frederick St. Kitchener, Ontario
February 21, 2014
Sign-off Sheet
This document entitled Norfolk County – Asset Management Plan – Sanitary Sewers was prepared by Stantec Consulting Ltd. for the account of Norfolk County. The material in it reflects Stantec’s best judgment in light of the information available to it at the time of preparation. Any use which a third party makes of this report, or any reliance on or decisions made based on it, are the responsibilities of such third parties. Stantec Consulting Ltd. accepts no responsibility for damages, if any, suffered by any third party as a result of decisions made or actions based on this report.
Prepared by (signature) Andy Dalziel, B.Eng. Principal Infrastructure Management & Pavement Engineering
NORFOLK COUNTY – ASSET MANAGEMENT PLAN – SANITARY SEWERS
Table of Contents EXECUTIVE SUMMARY .............................................................................................................. V 1.0 1.1
INTRODUCTION ...........................................................................................................1.1 GOALS AND OBJECTIVES .............................................................................................. 1.1 1.1.1 Scope of Work.............................................................................................. 1.1
2.0 2.1
STATE OF LOCAL INFRASTRUCTURE .............................................................................2.1 SANITARY SEWER SYSTEM............................................................................................... 2.2 2.1.1 Valuations ..................................................................................................... 2.3 2.1.2 Age and Remaining Service Life ............................................................... 2.4 STRUCTURAL DETERIORATION OF SEWERS ................................................................... 2.8 2.2.1 Stresses in Sewers ......................................................................................... 2.8 2.2.2 Effect of Soils................................................................................................. 2.8 2.2.3 Fabric Decay................................................................................................ 2.9 2.2.4 Collapse Mechanisms ............................................................................... 2.10 METHODS OF INSPECTION........................................................................................... 2.13 2.3.1 Visual ........................................................................................................... 2.13 2.3.2 CCTV ........................................................................................................... 2.13 2.3.3 Zoom Camera............................................................................................ 2.13 2.3.4 Sonar ........................................................................................................... 2.14 2.3.5 Fog Testing .................................................................................................. 2.14
2.2
2.3
3.0
DESIRED LEVELS OF SERVICE .......................................................................................3.1
4.0 4.1 4.2 4.3
ASSET MANAGEMENT STRATEGY ................................................................................4.1 NON-INFRASTRUCTURE SOLUTIONS .............................................................................. 4.1 MAINTENANCE AND REHABILITATION ACTIVITIES ....................................................... 4.1 TECHNOLOGIES .............................................................................................................. 4.2 4.3.1 Open Cut Construction .............................................................................. 4.2 4.3.2 Sliplining......................................................................................................... 4.2 4.3.3 Diameter Reduction Sliplining .................................................................... 4.2 4.3.4 Fold and Form Sliplining .............................................................................. 4.3 4.3.5 Cured-in-Place Pipe (CIPP) ........................................................................ 4.3 4.3.6 Pipe Bursting ................................................................................................. 4.3 4.3.7 Horizontal Directional Drilling (HDD) .......................................................... 4.3 4.3.8 Internal Joint Seals ....................................................................................... 4.3 4.3.9 Panel and Section Insert Linings ................................................................ 4.4 4.3.10 Chemical Grouting...................................................................................... 4.4 4.3.11 Full Tunneling and Micro-tunneling ........................................................... 4.4 4.3.12 Auger Boring................................................................................................. 4.4 4.3.13 Pipe Eating.................................................................................................... 4.4
ch \\cd1004-f01\01620\active\162010337\phase\report\final_draft\rpt_norfolk_amp_sewers_20140221.docx
i
NORFOLK COUNTY – ASSET MANAGEMENT PLAN – SANITARY SEWERS
4.4 4.5 4.6 4.7 4.8
DISPOSAL ACTIVITIES ...................................................................................................... 4.4 EXPANSION ACTIVITIES .................................................................................................. 4.5 PROCUREMENT METHODS............................................................................................. 4.5 RISKS................................................................................................................................. 4.5 ASSET MANAGEMENT PLAN FUTURE UPDATES ............................................................ 4.6
5.0 5.1 5.2
FINANCING STRATEGY ................................................................................................5.1 HISTORICAL INVESTMENTS ............................................................................................. 5.1 SANITARY SEWER SYSTEM CAPITAL AND OPERATING REVENUE REQUIREMENTS ............................................................................................................... 5.1 BUDGET PROJECTIONS - CAPITAL ................................................................................ 5.4
5.3
ii
ch \\cd1004-f01\01620\active\162010337\phase\report\final_draft\rpt_norfolk_amp_sewers_20140221.docx
NORFOLK COUNTY – ASSET MANAGEMENT PLAN – SANITARY SEWERS
LIST OF TABLES Table 2.1: Sewer Assets Included in State of the Infrastructure Study ................................ 2.1 Table 2.2: Sanitary Network Inventory Summary ................................................................... 2.3 Table 2.3: Sanitary Sewer Network Replacement Value ..................................................... 2.3 Table 2.4: FIR Schedule of Tangible Capital Assets (Schedule 51) ..................................... 2.4 Table 2.5: Sanitary System Useful Life ...................................................................................... 2.5 Table 4.1: Sanitary Sewer Network Work Activities................................................................ 4.1 Table 4.2: Risks Associated with Not Reaching Defined Level of Service Targets ............ 4.5 Table 5.1: FIR Schedule of Operating Expenses (Schedule 40) ........................................... 5.1 Table 5.2: Sustainable Revenue - Capital (Millions) .............................................................. 5.4 Table 5.3 : Budget Projections & Funding Sources 2014 - 2023 ........................................... 5.4
LIST OF FIGURES Figure 2.1: Asset Replacement Value per Serviced Property/Household ......................... 2.2 Figure 2.2: Failure Distribution ................................................................................................... 2.5 Figure 2.3: Sanitary Sewer Estimated Asset Life Consumed................................................. 2.6 Figure 2.4: Sanitary Sewer Pipe Replacement Profile ........................................................... 2.7 Figure 2.5: Cracked Pipe Collapse Mechanism (WRc, 1986) ............................................ 2.11 Figure 2.6: Sewer Subsidence Collapse Mechanism (WRc, 1986) .................................... 2.12 Figure 5.1: Sanitary Pipe O&M Cost Distribution .................................................................... 5.2 Figure 5.2: Sanitary System Revenue Requirements ............................................................. 5.3
ch \\cd1004-f01\01620\active\162010337\phase\report\final_draft\rpt_norfolk_amp_sewers_20140221.docx
iii
NORFOLK COUNTY – ASSET MANAGEMENT PLAN – SANITARY SEWERS
Executive Summary
Municipalities are stewards of Community infrastructure. Well-managed infrastructure fosters prosperity, growth, and quality of life for a Community’s residents, businesses, and visitors. Most Canadian municipalities are struggling to maintain existing infrastructure under current tax and rate levels. They continue to deal with downloaded responsibilities and, at the same time, face growing needs to maintain and renew aged and decaying infrastructure. The subject of asset management has been gaining increasing public awareness as a result of the introduction of Bill 175, the Sustainable Water and Sewage Systems Act in 2002, and the implementation of “Full Cost Accounting” through the Public Sector Accounting Board (PSAB). The emphasis is now being placed on not only knowing the true cost of providing services to your customers today, but also understanding what will be required to maintain the services virtually in perpetuity (or as long as they are required), through the use of life cycle costing. In other words, we are moving towards Sustainable Asset Management. Ontario’s Ministry of Infrastructure has also recently released guidelines for the development of Municipal Asset Management Plans, which supports the Province’s 10-year infrastructure plan “Building Together”. The objective of these guidelines is to provide a basis for the standardization and consistency of asset management practices across Ontario’s municipalities. This document follows the Ministry’s guidelines for the development of an Asset Management Plan for the Sanitary Sewers.
ch \\cd1004-f01\01620\active\162010337\phase\report\final_draft\rpt_norfolk_amp_sewers_20140221.docx
v
NORFOLK COUNTY – ASSET MANAGEMENT PLAN – SANITARY SEWERS
1.0
Introduction
1.1
GOALS AND OBJECTIVES
This Asset Management Plan has been prepared in response to the Ontario Ministry of Infrastructure’s Building Together initiative, and provides the County with a medium-term business plan for ensuring long-term sustainability of the County’s infrastructure.
1.1.1
Scope of Work
The scope and format of this document follows the Ministry of Infrastructure’s Building Together: Guide for Municipal Asset Management Plans. The Guide outlines the specific elements of a detailed asset management plan, which includes: 1. 2. 3. 4. 5. 6.
Summary Introduction State of Local Infrastructure Desired Levels of Service Asset Management Strategy Financing Strategy
The County has developed individual Asset Management Plans following the Ministry’s guidelines and suggested format for roads, bridges, and water and wastewater systems. The County is not responsible for social housing, an asset group to be included, if applicable, as per the Ministry’s guide. This document focuses on the County’s Sanitary Sewer network.
ch \\cd1004-f01\01620\active\162010337\phase\report\final_draft\rpt_norfolk_amp_sewers_20140221.docx
1.1
NORFOLK COUNTY – ASSET MANAGEMENT PLAN – SANITARY SEWERS
2.0
State of Local Infrastructure
A State of the Infrastructure report provides the County with an understanding of the true cost of maintaining the infrastructure that is required to provide the services to the Community. The following State of the Infrastructure (SotI) assessment was developed through a Life Cycle Analysis, covering the County’s sanitary sewer network. The SotI was based on a high-level analysis of the replacement, rehabilitation, and maintenance needs of the County’s sanitary sewer network assets. This included the preparation of a report on the current and assumed future state of these assets. The following sanitary sewer assets were included in the study.
Sanitary Sewer
Table 2.1: Sewer Assets Included in State of the Infrastructure Study Pipes Manholes Services Pumping Station Structures and Equipment
In November 2003, the National Guide for Sustainable Municipal Infrastructure published a Best Practices for Municipal Infrastructure Asset Management. This publication included a listing of seven questions, which could be used as a framework for an asset management plan. The SotIR employs this framework: 1. What do you have and where is it? (Inventory) 2. What is it worth? (Costs/Replacement Rates) 3. What is its condition and expected remaining service life? (Condition and Capability Analysis) 4. What is the level of service expectation, and what needs to be done? (Capital and Operating Plans) 5. When do you need to do it? (Capital and Operating Plans) 6. How much will it cost and what is the acceptable level of risk(s)? (Short- and Long-term Financial Plan) 7. How do you ensure long-term affordability? (Short- and Long-term Financial Plan)
ch \\cd1004-f01\01620\active\162010337\phase\report\final_draft\rpt_norfolk_amp_sewers_20140221.docx
2.1
NORFOLK COUNTY – ASSET MANAGEMENT PLAN – SANITARY SEWERS State of Local Infrastructure February 21, 2014
The County’s Public Works assets have a replacement value of $2.2 billion. The breakdown of those replacement values per serviced property, based on serviced properties or household in the County, are shown in Figure 2.1 below. It can be noted that the sanitary sewer networks account for approximately 11.0% or $239 million, of the total asset replacement value for the County’s infrastructure.
Plants: Replacement Value Water: $56 million Wastewater: $69 million Per serviced property: $8,300
Road System: Inventory Road Length: 2,030 km Bridges & Culverts: 242 Replacement: Roads - $1.4 billion Bridges & Culverts - $212 million Per household: Roads - $49,600 Bridges & Culverts - $7,500 The Visible Infrastructure The Invisible Infrastructure
Water System: Inventory Pipe Length: 309 km # of Valves: 1,600 Replacement: $229.2 M Per serviced property: $15,280
Sanitary System: Inventory Pipe Length: 220 km # of Manholes: 2,910 Replacement: $238.9 M Per serviced property: $15,900
Figure 2.1: Asset Replacement Value per Serviced Property/Household
2.1
SANITARY SEWER SYSTEM
The County’s Sanitary Sewer Network consists of a group of components, including manholes, force mains, pumping stations, and so forth. The State of the Infrastructure analysis of these components was based upon existing inventories; the sources for these inventories include the County’s current asset management Geodatabase. The following table summarizes these inventories:
2.2
ch \\cd1004-f01\01620\active\162010337\phase\report\final_draft\rpt_norfolk_amp_sewers_20140221.docx
NORFOLK COUNTY – ASSET MANAGEMENT PLAN – SANITARY SEWERS State of Local Infrastructure February 21, 2014
Table 2.2: Sanitary Network Inventory Summary Asset Type
Asset Component
Inventory
Pipes
220 km
Manholes Sanitary System
2.1.1
2,910
Services
15,000 (assumed)
Pumping Station - Structures
21
Pumping Station - Equipment
21
Valuations
The County’s State of the Infrastructure analyses/reports did not use inflation rate factors. Table 2.3 outlines the assumptions made on asset valuation, within the state of the infrastructure report.
2.1.1.1 Replacement Cost Valuation The estimated current replacement value of the sanitary sewer network and associated assets is $238.9 million. Table 2.3 provides a breakdown of the contribution of each of the network components to the overall system value. If this total asset value is translated to provide an average value for each of the approximately 15,000 serviced properties, then an average serviced property will be responsible for approximately $15,900 for Sanitary System assets.
Table 2.3: Sanitary Sewer Network Replacement Value Asset Type
Asset Component Pipes
Sanitary System
Manholes Services
Inventory
Unit Replacement Cost (As noted)
220 km
Current Replacement Value (millions)
$220/m
$200.5
2,910
included
-
15,000 (assumed)
$2,000 ea
$30.0
Pumping Station - Structures
21
$300,000 ea
$6.3
Pumping Station - Equipment
21
$100,000 ea
$2.1 $238.9
ch \\cd1004-f01\01620\active\162010337\phase\report\final_draft\rpt_norfolk_amp_sewers_20140221.docx
2.3
NORFOLK COUNTY – ASSET MANAGEMENT PLAN – SANITARY SEWERS State of Local Infrastructure February 21, 2014
2.1.1.2 Financial Accounting Valuation Based upon the County’s 2012 Financial Information Return filed with the Ministry of Municipal Affairs the Net Book Value of the County’s Sewer assets at the end of 2012 was $24.5 million. The assets included in this figure are outlined in Table 2.4 below:
Table 2.4: FIR Schedule of Tangible Capital Assets (Schedule 51) Asset Type Sanitary Sewer Network
2.1.2
Asset Component Wastewater collection/conveyance
2012 Closing Net Book Value (million) $24.5
Age and Remaining Service Life
A useful life span can be assigned to an asset type; however, there are many conditions that can affect the true life of an asset, such as: design, construction, and manufacture quality, maintenance standards, quantity of use, surrounding environment, construction material, and so forth. For the purposes of the SotI analysis, the following intuitive failure distribution model was utilized to provide a more realistic representation of the actual asset replacement quantities than would be achieved if the analysis only assumed a fixed time of failure for all assets. The following example, based upon longer-lived assets such as water or sewer pipes, illustrates the failure model that was used. For an asset with a longer life, an assumption was made that: 5% would fail at 50% of the asset life; 15% would fail at 75% of the asset life; 15% would fail at 125% of the asset life; and the balance, or 65%, would fail at the prescribed or fixed asset life. An example of this method applied to an asset with a 100-year design life is represented graphically in Error! Reference source not found..
2.4
ch \\cd1004-f01\01620\active\162010337\phase\report\final_draft\rpt_norfolk_amp_sewers_20140221.docx
NORFOLK COUNTY – ASSET MANAGEMENT PLAN – SANITARY SEWERS State of Local Infrastructure February 21, 2014 80
Likelihood of Failure (%)
Average 60
40
20
Lemons
Early
Late
0
Years
Figure 2.2: Failure Distribution This principle was applied against the Sanitary Sewers included in this assessment. The level of intervention on infrastructure will vary significantly over the life cycle of an asset. The process of maintenance, rehabilitation, and failure is a very dynamic system. Therefore, it is essential that we take a life-cycle approach to assessing the financial needs for the future. This dynamic process of asset aging has a significant financial impact attached to it that can be quantified. Therefore, our financial analysis is based upon a life-cycle model that identifies upcoming trends in asset replacement and, hence, funding needs. County staff has the best understanding of the local variables that impact the useful lives of the sanitary sewer system assets. As a result, the range of values provided for the typical useful life of an asset was adjusted for the purposes of this Report, based on discussions with County staff, internationally recognized standards, and Canadian climate and conditions. These values can be refined over time, as more specific data becomes available. These values do, however, serve a purpose in planning financial investment requirements on a life-cycle basis, with specific projects being identified on a section-by-section basis, as part of the regular budget preparation process. The following tables identify the useful life used within the analysis for each Asset Component.
Table 2.5: Sanitary System Useful Life Asset Type
Asset Component
Typical Useful Life (years)
Pipes Sanitary System
60-100
Manholes
70
Services
70
ch \\cd1004-f01\01620\active\162010337\phase\report\final_draft\rpt_norfolk_amp_sewers_20140221.docx
2.5
NORFOLK COUNTY – ASSET MANAGEMENT PLAN – SANITARY SEWERS State of Local Infrastructure February 21, 2014
Asset Type
Asset Component
Typical Useful Life (years)
Pumping Station - Structures
70
Pumping Station - Equipment
25
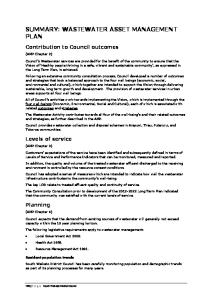
As can be seen from Figure 2.3, approximately 25% of the sanitary network is reaching the end of its design life. In addition, the 40% of the network identified as being in the last half of their life, suggests that over the next 15 - 20 years, the replacement requirements will increase significantly. Therefore, over the next 10 -15 years, the County will need to assess the overall condition of the sanitary sewer network in more detail, to determine the level of effort and associated funding required to meet the rehabilitation and replacement needs.
Life Consumed
0 – 25%
25 – 50%
50 – 75%
75 – 100%
21.9%
13.9%
39.7%
24.5%
Figure 2.3: Sanitary Sewer Estimated Asset Life Consumed
A key component of this high-level analysis required to estimate the timing of the major interventions specifically, rehabilitation and/or replacement, is the age of the asset, which would be based on the construction year. This data was available for the sanitary sewers within the
2.6
ch \\cd1004-f01\01620\active\162010337\phase\report\final_draft\rpt_norfolk_amp_sewers_20140221.docx
NORFOLK COUNTY – ASSET MANAGEMENT PLAN – SANITARY SEWERS State of Local Infrastructure February 21, 2014
County’s asset inventory, and formed the basis of the analysis to develop the 100-year replacement profile for the sanitary sewers shown in Figure 2.4.
25
20
Kilometres
15
10
5
2094
Year
2074
2054
2034
2014
0
Annual Replacement Quantity
Figure 2.4: Sanitary Sewer Pipe Replacement Profile The profile displayed represents the replacement of the sanitary sewers, and does not include any form of rehabilitation. There are a number of techniques that may be applicable for the rehabilitation of the pipes, within the County’s inventory, to extend the useful life. However, while rehabilitation may appear to be an attractive option to reduce the cost associated with maintaining the structural integrity of the pipes, in some cases, the unit cost of the treatment can be similar to that of replacement. Rehabilitation costs are dependent upon other factors such as the scale of the project, i.e. larger projects can achieve economies of scale; or the availability of local contractors that are capable of delivering the service. It should be noted that there are also situations where rehabilitation would not be appropriate, such as when the pipe requires upsizing to service growth, or the pipe is subject to frequent submersion due high water tables, that would increase costs associated with dewatering during the rehabilitation process.
ch \\cd1004-f01\01620\active\162010337\phase\report\final_draft\rpt_norfolk_amp_sewers_20140221.docx
2.7
NORFOLK COUNTY – ASSET MANAGEMENT PLAN – SANITARY SEWERS State of Local Infrastructure February 21, 2014
The decision to use rehabilitation techniques should be considered on a project by project basis after assessment of the suitability of the pipe for rehabilitation and the condition of other adjacent assets including the roads and watermains.
2.2
STRUCTURAL DETERIORATION OF SEWERS
In general, sewers tend to deteriorate due to the occurrence of random events, rather than through progressive deterioration over time. Consequently, sewer condition is assessed by considering a segment’s likelihood of collapse; then, from collected data, short-term rehabilitation strategies can be determined. The purpose of sewer condition assessment is to obtain the necessary information so that repairs can be implemented at the best possible point in a sewer’s deterioration cycle. This will enable proper sewer management practices to take on a cost-effective approach and should be combined with efforts by other County infrastructure programs to mitigate overall decline. Structural deterioration refers to the decline in the physical condition of a system. Determining short-term rehabilitation needs is often simple, but once the obvious defects are resolved, methods are needed to assess which sewers are experiencing active deterioration compared to those that are defective, yet stable. A relative risk of failure must therefore be established with consideration to cause and effect.
2.2.1
Stresses in Sewers
Stability of a sewer is generally independent of the strength of its material. Thus, it is essential to review other factors that affect the structural integrity of a sewer (WRc, 1986): • • • • • •
Surrounding soil type, Sewer hydraulics, Construction method, Location of groundwater table, Characteristics of the sewage, and Loading on the sewer.
2.2.2
Effect of Soils
Sewer deterioration is often dependent on the condition of the surrounding soil, its lateral support system. If a defect occurs, water may move out to the surrounding soil, while the soil itself may enter the sewer. The rate of soil loss into a sewer is affected by the size of the defect, location of water table, frequency and magnitude of surcharge, and soil properties such as particle size in cohesionless soil, and the plasticity index in cohesive soils. Defects can be classified by size; the larger the defect, the greater the risk of ground loss. In the case of large defects, typically greater than 10mm, migration may arise regardless of the nature of a soil. An exception can occur when the water table is lower than the sewer and the level of water in the sewer never reaches the height of the severe defect.
2.8
ch \\cd1004-f01\01620\active\162010337\phase\report\final_draft\rpt_norfolk_amp_sewers_20140221.docx
NORFOLK COUNTY – ASSET MANAGEMENT PLAN – SANITARY SEWERS State of Local Infrastructure February 21, 2014
Ground loss is rapid within silts, sands, and gravels, while ground loss in clays occurs over time and is dependent on plasticity. The more plastic a clay, the slower the rate of soil movement will be (WRc, 1986). The occurrence of soil migration in cohesive soils is usually dependent on the plasticity index (PI). If the PI is less than 15, soil movement may occur when severe or large defects are present, irrespective of surcharging. When the PI is greater than 15, ground loss is more likely to occur only if a severe defect is present. In the latter case, the location of the groundwater table becomes a factor. High groundwater levels tend to accelerate the process of soil erosion. Ground loss is also a function of various hydraulic conditions such as location of the groundwater table. If the groundwater level is above the pipe, infiltration can occur, allowing regular soil migration to happen. Infiltration may also be a factor due to flooding or water main failures. It should be noted that soil loss due to surcharging of a sewer is much greater than loss due to infiltration. This ground loss is primarily affected by surcharging frequency, rather than its magnitude. Surcharging reduces negative pore pressures within a soil and provides for water flow through the soil adjacent to the defective zone. Surcharging can encourage the following: reduction in negative pore water pressure, destruction of any arch in cohesionless soil, and the provision of a source of flowing water through the soil near the defect (WRc, 1986). Voids in the ground surface can occur, forming what are known as sinkholes. Voids formed around a sewer can result from the effects of soil washing through a defect, or from sewer fabric deterioration—a result of missing bricks or absent pieces of pipe. Voids will form more rapidly in the latter case, regardless of defect size or soil type, and will be worse when the water table sits below the pipe. In cohesionless soils, voids will be stable if the groundwater level is above the elevation of the pipe. In cohesive soils, voids can be supported above and below the water table (WRc, 1986).
2.2.3
Fabric Decay
While sewer materials are normally very durable, decay may still occur; there are three common descriptions of fabric decay: •
Loss of jointing material
•
Erosion of mortar (brick sewers) – mortar can erode and deform under loading, or be subjected to chemical attack
•
Chemical attack (concrete) – caused mainly by sulphide compounds
ch \\cd1004-f01\01620\active\162010337\phase\report\final_draft\rpt_norfolk_amp_sewers_20140221.docx
2.9
NORFOLK COUNTY – ASSET MANAGEMENT PLAN – SANITARY SEWERS State of Local Infrastructure February 21, 2014
2.2.4
Collapse Mechanisms
System failures are usually a result of random, independent events, generally unrelated to initial defects in the structural element. These events could include severe storms, nearby excavations or unaccounted for additional surface loading, for instance. This uncertainty makes it difficult to predict the exact moment of a pipe failure, therefore categorization of risk and, moreover, rating the condition of the system, provides a rehabilitation basis and data to classify system performance (NRC, 2004). It is essential to recognize factors leading to deterioration, such as type of ground, hydraulic inconsistencies, construction methods, ground water level, and the load on the sewer. Combining this knowledge with internal inspection data, aids in the assessment of the sewer system’s condition (WRc, 1986). •
Common methods of collapse:
•
Longitudinal cracked clay tile or concrete pipe
•
Leaking joints
•
Loss of mortar (brick sewer)
•
Corrosion of concrete pipes by exposure to hydrogen sulphide
A sewer goes through several defined stages before failure occurs. •
Stage 1: Formation of a defect during or after sewer construction
•
Stage 2: Deterioration of the sewer as a result of the initial defect
•
Stage 3: Collapse of the structure
An initial defect, often minor, can be a result of: •
A crack propagated by excessive vertical loading or improper bedding conditions
•
Construction errors that result in damage upon installation, or improper connections for instance
•
Leaking joints: water surrounding a pipe can cause the surrounding soil to fail, or an imbalance in loading on the structure
•
Damage caused in making connections
•
Third party damage (excavations nearby, etc.)
•
Material decay, such as pipe corrosion, loss of mortar
2.10
ch \\cd1004-f01\01620\active\162010337\phase\report\final_draft\rpt_norfolk_amp_sewers_20140221.docx
NORFOLK COUNTY – ASSET MANAGEMENT PLAN – SANITARY SEWERS State of Local Infrastructure February 21, 2014
Figure 2.5: Cracked Pipe Collapse Mechanism (WRc, 1986)
ch \\cd1004-f01\01620\active\162010337\phase\report\final_draft\rpt_norfolk_amp_sewers_20140221.docx
2.11
NORFOLK COUNTY – ASSET MANAGEMENT PLAN – SANITARY SEWERS State of Local Infrastructure February 21, 2014
Figure 2.6: Sewer Subsidence Collapse Mechanism (WRc, 1986)
2.12
ch \\cd1004-f01\01620\active\162010337\phase\report\final_draft\rpt_norfolk_amp_sewers_20140221.docx
NORFOLK COUNTY – ASSET MANAGEMENT PLAN – SANITARY SEWERS State of Local Infrastructure February 21, 2014
2.3
METHODS OF INSPECTION
The structural condition of the sewer infrastructure can be assessed through various methods of inspection. These methods each have their own benefits and drawback as can be seen from the discussion below.
2.3.1
Visual
A visual inspection is possible when the sewer infrastructure is accessible to an extent that allows for physical viewing of the structure. Most maintenance holes are located conveniently in the traveled way and covers can easily be removed for a quick visual inspection. It is also common practice to have ladder rungs for entry into the maintenance hole. All necessary safety precautions should be employed when performing these inspections. Depending upon the size and configuration of the sewers, it may even be practical to enter the pipe through the manhole. Although physical proximity to the actual structure would increase the ability to assess its condition, the limitation of this method lies in the safety issues inherent to confined space entry and the poor viewing access for smaller pipes.
2.3.2
CCTV
A CCTV, or closed circuit television, inspection is accomplished by inserting a camera through a sewer. This technology has become relatively common, and is easily accessed by the average municipality through a local CCTV specialist or by purchasing equipment and training municipal staff to perform the inspections. The County has selected the route of purchasing equipment and training municipal staff to facilitate frequent CCTV inspection of sewers. The benefits of this method of inspection are the ability to “see” down long sections sewer (especially small diameter pipe where entry is not an option), the safety aspect that results from maintaining a distance between the inspector and the sewer, and the ability to record the inspection for future use by multiple individuals. CCTV inspections are currently completed on approximately 10-15% of the County’s sewer network on an annual basis. Inspections have been completed in accordance with WRc’s Manual for Sewer Condition Coding; this standardised coding practice provides an objective assessment of the pipe conditions and allows the prioritisation of repairs. Data has been provided in digital format since 2011 and will be uploaded to the County’s asset management system for analysis and project selection.
2.3.3
Zoom Camera
A zoom camera inspection involves the use of a special camera with a powerful zoom lens. The camera is lowered into the maintenance hole on a telescopic boom and is able to rotate 360 degrees. Recordings are typically made of the entire maintenance hole structure, focusing in on any defects. Sewers are inspected by positioning the camera at the pipe opening and slowly zooming in to the furthest possible point. The limitations of this technology include a focal length of about fifty feet in a straight line (sewer curves will limit the length). The major benefits are
ch \\cd1004-f01\01620\active\162010337\phase\report\final_draft\rpt_norfolk_amp_sewers_20140221.docx
2.13
NORFOLK COUNTY – ASSET MANAGEMENT PLAN – SANITARY SEWERS State of Local Infrastructure February 21, 2014
speed of inspection (approximately 20 minutes per maintenance hole, including sewers), recorded images for future viewing, and safety of inspection personnel.
2.3.4
Sonar
If the sewer requiring inspection is semi-submerged, sonar can be used in conjunction with a CCTV camera to provide a 360 view. Sonar works by propagating sounds underwater which bounces of objects within the pipe and the pipe wall and the echoes received within the survey vehicle are plotted on a computer screen to supplement the traditional CCTV image. Defects can be identified in this composite image if there is no reflected signal meaning that the sound wave passed through the defect. Therefore, the success of this technique will be heavily dependent upon the type and severity of the defects within the sewer. The costs associated with mobilization and use of this equipment are high, therefore, use of the technology would typically be limited to situations where traditional CCTV inspection is not possible and the sewer is considered critical and the associated risk tolerance of failure is low. This technology is limited to use in pipes where the diameter is greater than 375 mm.
2.3.5
Fog Testing
Fog testing inspection of a sewer is performed by forcing a fog into a section of sewer to determine the source of inflows. Although this method could detect a major structural failure (i.e. a hole in the sewer with an air gap to the ground surface), it is predominantly used to identify illegal connections to the sewer. The fog should be seen escaping from rooftop plumbing vents. If, however, fog is seen escaping from a roof gutter of around a foundation, then the gutter or house tile drain may be illegally connected to the sewer. These connections can significantly increase the hydraulic loading on a sewer.
2.14
ch \\cd1004-f01\01620\active\162010337\phase\report\final_draft\rpt_norfolk_amp_sewers_20140221.docx
NORFOLK COUNTY – ASSET MANAGEMENT PLAN – SANITARY SEWERS
3.0
Desired Levels of Service
Levels of Service for sewers are a combination of the Community’s expectations and the County’s required and desired maintenance and performance targets to meet legislative requirements. It is important that the County first establish performance objectives for the Asset Management Plan (AMP). Some typical examples of performance objectives are listed below. •
Prevent sewer backups due to blockages on the main lines.
•
Maximize hydraulic capacity
•
Avert dry weather flow (average flow) overflows
•
Reduce structural deterioration due to poor maintenance
•
Perform system rehabilitation at the optimum point in the deterioration cycle
•
Conducting benchmarking both internally and with other similar communities
Performance objectives may be based upon legislative requirements, or industry best practices, and values/goals are agreed upon by the County and Community through Council policies Within future iterations of this Asset Management Plan, the County will consider further refining its service level targets for sewers. Under consideration will be: •
A desired network condition Index
•
A maximum desired backlog of work
•
A determination of funding and service goals for maintenance versus rehabilitation/replacement activities
•
Seek further Community input to further refine expectations and targets
ch \\cd1004-f01\01620\active\162010337\phase\report\final_draft\rpt_norfolk_amp_sewers_20140221.docx
3.1
NORFOLK COUNTY – ASSET MANAGEMENT PLAN – SANITARY SEWERS
4.0
Asset Management Strategy
4.1
NON-INFRASTRUCTURE SOLUTIONS
Accurate and reasonable population growth forecasting allows the County to adequately plan the sewer network expansion activities, and ensure that infrastructure is built only to meet reasonable demands. On a project-by-project basis, Environmental Assessment studies will explore various options, including alternatives to building new infrastructure, for any major developments being considered in the County.
4.2
MAINTENANCE AND REHABILITATION ACTIVITIES
The various stages in an asset’s life cycle can be split into four distinct phases of activity. These activities are described below for the sanitary sewer network.
Table 4.1: Sanitary Sewer Network Work Activities Activity
Definition
Minor Maintenance
Planned activities such as Zoom Camera and CCTV inspections, monitoring, cleaning and flushing, etc.
0-25% of asset life
Major Maintenance
Maintenance and repair activities are generally unplanned; however, they can be anticipated and would generally be accounted for with the County’s annual operating budget. These would include such events as repairing manholes and replacing localized sections of pipe, etc.
25-100% of asset life
Rehabilitation
Major activity required to upgrade or rehabilitate the system so that it can continue to provide service for an additional time period. Unlike the water network, there are many viable rehabilitation options that can be applied to sewer mains, which will, in effect, increase the asset’s useful life by an additional 75-100 years, if they are applied at the right point in the life cycle.
50-75% of asset life
Replacement
Some assets will reach the end of their structural and/or service useful life and require replacement. Experience has shown that the expected life of an asset will vary greatly, depending upon a number of environmental factors; however, by gathering data from the use of Zoom Camera and CCTV inspection, a better understanding can be gained of the performance of these assets.
75-100% of asset life
ch \\cd1004-f01\01620\active\162010337\phase\report\final_draft\rpt_norfolk_amp_sewers_20140221.docx
Asset Age
4.1
NORFOLK COUNTY – ASSET MANAGEMENT PLAN – SANITARY SEWERS Asset Management Strategy February 21, 2014
Rehabilitation of sewer infrastructure may involve either renovation or complete replacement upon consideration of structural integrity, deterioration of materials, and hydraulic capacity. It is important to note, when considering rehabilitation options, that not all available technologies can be described as proven methods for rehabilitation of sewer infrastructure. Even with what are considered to be proven technologies, there may exist a number of uncertainties with the particular strategy, such as the long-term material properties, installation requirements, and degree of expertise required. Rehabilitation technologies can be divided into several categories: main line sewer rehabilitation for full segment repairs, trenchless repair technology for spot repairs, manhole rehabilitation, and building connection, or service lateral rehabilitation.
4.3
TECHNOLOGIES
4.3.1
Open Cut Construction
The open cut construction method refers to the installation or replacement of sewers by trenching (NRC, 2001). This construction method has been used for many years, and the technique is well known. The following are some advantages and disadvantages of open cut construction:
4.3.2
Sliplining
Sliplining refers to the introduction of a flexible liner into a sewer. The liner is a continuous or discrete segment of pipe that is essentially pushed through the existing one. This results in the creation of a new pipe inside the old sewer – all without the need for excavation. The sliplined pipe is then simply reconnected to the existing sewer at both free ends. Sliplining can be applied to almost any pipe, is quick, and disruption of other nearby utilities is generally minimal. It is best used for pipes with few connections, and often installation can be accomplished without the need for bypass pumping.
4.3.3
Diameter Reduction Sliplining
This method of sliplining involves the insertion of a thermoplastic tube, temporarily deformed into the existing pipe. The tube is then returned to the proper diameter to create a close fit between the lining and the pipe wall. To reduce the diameter initially, the tube is passed through a set of dies, a process called swageing, or through compression rollers, and then inserted using a winch. When the tension on the winch is removed, the lining resumes its original shape. Thus, there is minimal loss of pipe diameter and no grouting is necessary compared to the original technique. Furthermore, the liner can provide full structural integrity if needed.
4.2
ch \\cd1004-f01\01620\active\162010337\phase\report\final_draft\rpt_norfolk_amp_sewers_20140221.docx
NORFOLK COUNTY – ASSET MANAGEMENT PLAN – SANITARY SEWERS Asset Management Strategy February 21, 2014
4.3.4
Fold and Form Sliplining
Using this technique, the liner is heated and folded at the factory before being transported to the work site. It is subsequently entered into the pipe and reformed with heat and pressure. PE liners are best used for pressure applications while PVC is optimal for use within gravity sewers. As with the other sliplining techniques, this method can be used in most pipes, is quick, and causes minimal site disturbance.
4.3.5
Cured-in-Place Pipe (CIPP)
With this method pre-insertion, a fabric tube is either injected with a thermosetting or ambient cured polyester, or an epoxy resin. The resin, once cured, then creates a stiff pipe. This new pipe can be engineered to have full structural or semi-structural capacity. As well, the tube can be designed for non-circular sections of pipe if needed, and the liners can turn through 90-degree bends.
4.3.6
Pipe Bursting
The method of pipe bursting involves the replacement of a defective sewer by breaking the old pipe and simultaneously inserting a replacement in the void produced. A pneumatic, hydraulic, or static bursting mechanism is used to break the host pipe, in turn, compressing the pipe fragments into the surrounding soil. Then the new pipe is pulled or pushed to fill the void left behind.
4.3.7
Horizontal Directional Drilling (HDD)
This technique involves several stages. Initially, a bore is made with a drilling rig, which is guided to make a hole at the required line and grade. Reamers are then used to enlarge the diameter of the hole to the required size. In the last stage of reaming, the service pipe is pulled back into the bore.
4.3.8
Internal Joint Seals
Internal joint seals are used to repair leaking pipes and are used mostly for water or force mains. The internal seal is flexible and water tight, while it allows water to flow without causing turbulent conditions. These joints are made of EPDM (ethylene propylene diene monomer) synthetic rubber. Since the application of these seals requires people to access the sewer, it must be sufficiently large to be a good contender.
ch \\cd1004-f01\01620\active\162010337\phase\report\final_draft\rpt_norfolk_amp_sewers_20140221.docx
4.3
NORFOLK COUNTY – ASSET MANAGEMENT PLAN – SANITARY SEWERS Asset Management Strategy February 21, 2014
4.3.9
Panel and Section Insert Linings
These are typically used only when person entry to the pipe can be done. GRP (glass-reinforced plastic), GRC (glass reinforced concrete), and Ferro-cement are the materials commonly used for this application. Panels are designed to be close fitting with fixed spacers, which are then grouted in position. Sewers large in diameter can be lined with sections instead of panels. The sections are brought into the pipe and then joined together in situ before being grouted in place.
4.3.10 Chemical Grouting Chemical grouting is used mostly for spot repairs, typically to seal joints and cracks. This type of grouting reduces or stops the movement of water into or out of the pipe by creating an external impermeable mass in the soil surrounding the location of the repair.
4.3.11 Full Tunneling and Micro-tunneling Deep installations generally use full tunneling or micro-tunneling techniques. While these methods are primarily used for new installations, they can also be utilized for the redirection of existing sewers when necessary.
4.3.12 Auger Boring “The process of simultaneously jacking casing through the earth, between two pre-sunk shafts, while removing the spoil inside the encasement, with a rotating flight auger.”
4.3.13 Pipe Eating Pipe eating is a method similar to microtunneling, where a pipe is replaced by excavating it with the surrounding soil. The replacement pipe is attached to the back of the tunneling shield and the existing pipe is substituted On a project-by-project basis, the County will review the available technologies to determine which activity is the most appropriate given the pipe condition and associated prevailing conditions.
4.4
DISPOSAL ACTIVITIES
The County does not anticipate the need for any sewer decommissioning.
4.4
ch \\cd1004-f01\01620\active\162010337\phase\report\final_draft\rpt_norfolk_amp_sewers_20140221.docx
NORFOLK COUNTY – ASSET MANAGEMENT PLAN – SANITARY SEWERS Asset Management Strategy February 21, 2014
4.5
EXPANSION ACTIVITIES
The County expects modest growth in the foreseeable future. Expansion activities are reflected in the County’s master plan. All major expansion projects are subject to Environmental Assessment studies, which evaluate the necessity of expansion of the asset portfolio and assess overall impact on the Community, environment, and so forth, for the various options available.
4.6
PROCUREMENT METHODS
To ensure the most efficient allocation of resources and funds, the County will consider: •
4.7
Bundling projects when issuing tenders, to realize cost-benefits of economy of scale
RISKS
There are several risks that could prevent the County from reaching/maintaining its target level of service for sewers:
Table 4.2: Risks Associated with Not Reaching Defined Level of Service Targets Potential Risk
Required Funding Not Secured
Potential Impact • • • • • •
Substantial Increase in M&R Unit Costs in Future
• • • •
Environment Change (e.g., severe weather, high population growth)
• • • •
Mitigation
Sewers deteriorate further Network condition decreases Sewers deteriorate beyond a condition where rehabilitation is a viable option Backlog of work increases More costly treatments are required
Ensure that annual funding is maintained at a level that is consistent with the investment required to sustain the water infrastructure
Inability to complete all planned projects with allotted budget levels Network condition decreases Sewers deteriorate beyond a condition where rehabilitation is a viable option Backlog of work increases More costly treatments are required
Ensure that sufficient reserve funds are available to provide additional funding required to meet increased funding needs resulting from exceptional increases in the unit costs of treatments/replacements
Increased infiltration and inflow Underestimated funding needs More costly treatments are required to increase capacity/reduce inflow Expanded sewer network required
Ensure that sufficient reserve funds are available to provide additional funding required to meet increased funding needs resulting impacts associated with climate change.
ch \\cd1004-f01\01620\active\162010337\phase\report\final_draft\rpt_norfolk_amp_sewers_20140221.docx
4.5
NORFOLK COUNTY – ASSET MANAGEMENT PLAN – SANITARY SEWERS Asset Management Strategy February 21, 2014
4.8
ASSET MANAGEMENT PLAN FUTURE UPDATES
The Asset Management Plan for sanitary sewer networks is a living document, and will require regular review and refinement. Specifically, the County will: •
Review the Asset Management Plan annually and confirm validity of assumptions
•
Update the Asset Management Plan every five years
•
Further refine its level of service targets by engaging in a Community outreach program, to help identify the desired levels of service of County’s residents.
4.6
ch \\cd1004-f01\01620\active\162010337\phase\report\final_draft\rpt_norfolk_amp_sewers_20140221.docx
NORFOLK COUNTY – ASSET MANAGEMENT PLAN – SANITARY SEWERS
5.0
Financing Strategy
5.1
HISTORICAL INVESTMENTS
The County’s investment in road operations for the period 2011-2012 is summarized in Table 5.1 below.
Table 5.1: FIR Schedule of Operating Expenses (Schedule 40) Asset Type
Asset Component
Sanitary Sewer Network
Wastewater Collection/Conveyance
1Excludes
2011 1
2012 1
(million)
(million)
$0.854
$1.172
amortization expense & interest on long term debt
This data was derived from the Financial Information Return (FIR) filed with the Ministry of Municipal Affairs and Housing (http://oraweb.mah.gov.on.ca/fir/welcome.htm).
5.2
SANITARY SEWER SYSTEM CAPITAL AND OPERATING REVENUE REQUIREMENTS
The analysis, which was completed to identify Capital and Operating revenue requirements, was based upon the following assumptions: 1. All values are calculated in current dollars (2012). 2. Replacement costs were based upon unit costs identified within Table 2.3 3. Investment in the replacement of the non-linear assets included in the study was defined as the total replacement value spread evenly across the useful life of the asset. 4. An allowance was made in the analysis for Engineering (15%) and Contingencies (5%). No allowance was included for Utility Costs and Overhead and Admin. 5. Operating investments were estimated as 1.1% of the total replacement values of the sanitary system and excludes allowances for Overhead and Admin. Figure 5.1 shows the Operations and Maintenance (O&M) Cost profile for sanitary pipes only and does not include the other asset components.
ch \\cd1004-f01\01620\active\162010337\phase\report\final_draft\rpt_norfolk_amp_sewers_20140221.docx
5.1
NORFOLK COUNTY – ASSET MANAGEMENT PLAN – SANITARY SEWERS Financing Strategy February 21, 2014
$2.5
$2.0
Millions
$1.5
$1.0
$0.5
$0.0 2002
2022
2042
2062
2082
Year Total O&M Cost
Figure 5.1: Sanitary Pipe O&M Cost Distribution
Therefore, based upon these assumptions, for the period 2012 to 2111, the average annual revenue required to sustain the County’s Sanitary System is $7.4 million. Over this same period, and excluding growth, this represents 3.1% of the Sanitary Systems replacement value of $238.9 million. Figure 5.2 illustrates the revenue profile from 2014 to 2113 derived from the analysis for all the assets within the Sanitary System.
5.2
ch \\cd1004-f01\01620\active\162010337\phase\report\final_draft\rpt_norfolk_amp_sewers_20140221.docx
NORFOLK COUNTY – ASSET MANAGEMENT PLAN – SANITARY SEWERS Financing Strategy February 21, 2014
$30
$25
Millions
$20
$15
$10
$5
2094
2074
2054
2034
2014
$Year Total O & M
Total Capital Requirements
Sustainable Funding Level
Figure 5.2: Sanitary System Revenue Requirements
Based on the SotI analysis results and a review of the 2014 - 2023 capital funding needs (as supplied by County Staff) for the 10-year period covered by the budget fall short of the sustainable revenue requirements. The table below illustrates the magnitude of this deficit for the County’s sanitary sewer network and associated assets. The analysis projects the finance requirements of each program over a 100-year period, to include the full life cycle of each asset type.
ch \\cd1004-f01\01620\active\162010337\phase\report\final_draft\rpt_norfolk_amp_sewers_20140221.docx
5.3
NORFOLK COUNTY – ASSET MANAGEMENT PLAN – SANITARY SEWERS Financing Strategy February 21, 2014
Table 5.2: Sustainable Revenue - Capital (Millions)
Program
2014-2023 Projected Revenue (average annual)
Projected Sustainable Revenue1 (average annual)
Overall Surplus/ (Deficit)
$1.4
$4.8
($3.4)
Sanitary Sewer 1.
5.3
Assumes no growth in the County’s population and infrastructure
BUDGET PROJECTIONS - CAPITAL
The County’s proposed 2014-2023 capital budget shows that approximately $13.75 million will be invested in the sanitary sewer network over this period. The projected capital investment and associated funding sources for the investment in the sanitary sewer network is summarized in Table 5.3.
Year
Table 5.3 : Budget Projections & Funding Sources 2014 - 2023 2014
2015
2016
2017
2018
2019
2020
2021
2022
2023
Total
$1.335
$1.840
$0.900
$1.055
$1.405
$1.350
$1.570
$1.600
$1.315
$1.380
$13.750
Debenture Proceeds
-
-
-
-
-
-
-
-
-
-
$0
Gas Tax Reserve Fund
-
-
-
-
-
-
$0.400
-
-
$0.400
Water & Wastewater Rates
-
-
-
-
-
-
-
-
-
-
$0
$1.335
$1.840
$0.900
$1.055
$1.340
$1.321
$1.570
$1.200
$1.315
$1.380
$13.256
-
-
-
-
$0.065
$0.029
-
-
-
-
$0.094
Funding Source
Budget (millions)
Wastewater Capital Replacement Reserve Fund Wastewater Development Charge Reserve Fund
5.4
-
ch \\cd1004-f01\01620\active\162010337\phase\report\final_draft\rpt_norfolk_amp_sewers_20140221.docx