BUILDING ASSET MANAGEMENT PLAN (2011 – 2030)
-i-
Table of Contents 1.
Executive summary .............................................................................................................................. 3
2.
Introduction........................................................................................................................................... 5
3.
Levels of service .................................................................................................................................................................. 8
4.
Future demand ................................................................................................................................................................... 12
5.
Risk management .............................................................................................................................. 14
5.
Lifecycle management plan ........................................................................................................................................... 16
6.
Financial summary............................................................................................................................................................ 28
7.
Asset management practices ............................................................................................................. 32
8.
Plan improvement and monitoring...................................................................................................... 36 Appendices......................................................................................................................................... 37
1. Executive Summary The City of Melville owns and maintains a building portfolio with a replacement valuation of approximately $263.1 million. This portfolio comprises 188 separate buildings consisting of administration facilities, libraries, sport and recreation facilities, clubrooms, community centres, toilets and change rooms, child health and education facilities, halls and storage facilities such as sheds. To ensure the City effectively manages these critical facilities, it is important that the organisation takes a tactical approach. This Building Asset Management Plan will assist in this process by identifying the size and value of the assets within this class, establish the current levels of service, determine the future demand and the risk profile that ownership attracts. Finally, lifecycle management of the portfolio is examined to identify opportunities for to achieve great value for money.
Levels of service for the provision of building infrastructure have been established and are based primarily on quality/condition, function and safety. These levels of service will be reviewed on an ongoing basis based on customer surveys and service requests.
The future demand on the portfolio as a whole is not expected to change significantly as the population of the City is expected to increase by only 9.8% over the next 20 years. Expectations will change, however, as the proportion of residents over 65 years of age is expected to increase by 32% by 2021.
The ownership of a large building portfolio with significant public use poses a considerable risk to the City. It is important that the organisation recognises and regularly reviews these risks and continues to take a risk management approach in developing future building renewal and maintenance programs.
The City undertakes comprehensive Building Condition Audits (BCA) on an ongoing basis and whilst the audit generally identifies that the portfolio is in a fair condition many of the community buildings are in need of a minor refurbishment. This work will be a focus over the life of this plan.
A comparison of past expenditures and building values indicates there has been an under spend on the City’s buildings in the past although this spend has recently been increased based on the results of the previous BAMP. This increased expenditure should be maintained to ensure the City continues to meet expectations in its provision of community building infrastructure. Opportunities for rationalisation should also continue to be pursued.
Overview Population served
99,609
Recreation buildings Civic buildings Community buildings Heritage Buildings Strategic buildings Amenity buildings Storage Total number of buildings
45 11 40 21 9 17 45 188
Replacement Value of Buildings (2010) Annual operational expenditure Annual maintenance expenditure Average annual renewal budget
$263.1 million
$976,672 $1.25 million $2.4 million
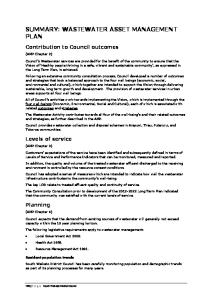
Building Condition 60%
Percentage of Buildings
50%
40%
2005
30%
20%
10%
0% 1
2
3
4
5
Condition Rating
79% of buildings are currently in an acceptable condition (=< condition 3) Recommendations The actions resulting from this BAMP are: 1. Update and maintain all building data in the Archibus AM system (rather than spreadsheets) 2. Develop a detailed five year capital works program to be included in future BAMPs.
2. Introduction The City of Melville delivers over 200 services to the community and in doing so, must ensure that the assets supporting these services are managed in a way that optimises performance for the lowest 'whole of life' cost. Building infrastructure assets usually represent the second largest infrastructure class (after roads) for most local governments and represent a significant risk if not managed effectively. The City has developed a comprehensive building inventory however some local governments are unaware of the exact extent of their building ownership despite the risk this ownership entails. The City’s building infrastructure assets include administration facilities, libraries, community centres, halls and sporting clubrooms, Child Health Centres, Pre Primary Schools, toilets and change rooms and represent a vast investment that supports modern living in our community. More than $5 million is spent annually on building asset management activities that include the planning, acquisition, operation, maintenance, renewal, replacement and disposal of the City’s building infrastructure. It is imperative that we employ best practice management skills and practices to ensure that related services are delivered economically and sustainably. This is the second Building Asset Management Plan (BAMP) developed by the City and seeks to provide a more formal approach to building asset management through the adoption of best practice asset management principles and methodology. This will be achieved by clearly defining the City’s building renewal and maintenance practices. This BAMP has been prepared to identify the current status of the asset group, propose levels of service and recommend improvements to current management practices. The BAMP demonstrates responsible stewardship of the building asset portfolio and should be made available to all stakeholders. The Building Asset Management Plan forms a major component of the City’s overall Asset Management Planning as it represents 41% of the City’s infrastructure (by value). This BAMP includes the assets shown in the table below. Class
Quantity
Recreation Civic Community Heritage Strategic Amenity Storage facilities TOTAL
45 11 40 21 9 17 45 188
Replacement Value ($ m) 128.6 52.5 42.0 24.8 11.8 3.6 Nil 263.1
Proportion 49% 20% 16% 9% 5% 1%
Building Assets covered by this Plan The extent of the building covered by the BAMP includes the structure (foundations and external walls), roof, services such as utilities and HVAC (heating ventilation and air conditioning) as well as fixtures and fittings (predominantly kitchen and bathrooms). The swimming pools at Melville Aquatic Fitness Centre are included as structures and, as such, the valuations and budgets in the BAMP will consider this asset. However, due to the specialised nature of the pools, maintenance and renewal activities will be managed by aquatic staff. The BAMP also shows expenditure on cleaning and energy as part of the ‘Operations’ budget although not all of these activities are managed by the Asset Management Service Area.
The BAMP does not include furniture or specialised equipment such as fitness equipment. Note that many buildings or parts of buildings, particularly those associated with sporting clubs, are subject to lease arrangements with varying levels of commitment to maintenance. They are included in the relevant asset category to enable a contingent liability to be allocated in the case of the City resuming full control of the building should the organisation cease to exist. Key stakeholders in the preparation and implementation of this BAMP can be divided into internal and external stakeholders. Internal stakeholders include: The Council, the Executive Management Team (EMT), the Operational Management Team (OMT), the Asset Management Team, the Finance Service Area, Operational Departments involved in the creation of infrastructure and all City of Melville service areas that provide support services. External Stakeholders Include: The City of Melville Community, building tenants, visitors, Local Government Insurance Scheme and State Emergency Services Goals and Objectives of Asset Management The City of Melville only exists to provide services to its Community and many of these services are supported by infrastructure assets such as buildings. These assets have been acquired by ‘purchase’, by contract, construction and by donation of buildings constructed by developers and others. The City’s goal in managing its building assets is to meet the required level of service in the most cost effective manner for both present and future consumers. The key elements of infrastructure asset management are: • • • • • • •
Taking a life cycle approach, Developing cost-effective management strategies for the long term, Providing a defined level of service and monitoring performance, Understanding and meeting the demands of growth through demand management and infrastructure investment, Managing risks associated with asset failures, Sustainable use of physical resources, Continuous improvement in asset management practices.
Linkages to Key Strategies This BAMP is prepared under the direction of the City’s vision, goals and objectives as contained in its Plan for the Future. The City’s vision is to: • • • •
Create a safe, attractive City where the consequences of our actions for future generations are taken into account. Ensure that natural and built facilities are, where practicable, accessible to everyone. Generate a sense of place, belonging and Community spirit. Ensure that all voices are heard through the creation of opportunities to participate in decisions that affect the lives of our Community.
This BAMP is a vital component of City’s overall strategic planning process. It links to the annual budget and to other Corporate Strategies listed below. • • • • •
The City of Melville’s Plan for the Future (2008-2012) People, Places, Participation A Community Plan for the City of Melville 2007 - 2017 Asset Management Policy (Policy No. CP-031) Asset Management Continuous Improvement Strategy Financial Sustainability – Forward Financial Planning and Funding Allocation Policy (Policy No. CP-008)
• • • • • • •
Borrowings and Asset Financial Policy (Policy No. CP-024) Accounting Policy (Policy No. CP-025) Strategic Financial Plan – The City’s long Term Financial Plan which outlines all aspects of the key financial strategy objectives and commitments and how future expenditure needs will be funded. Annual Budget of capital, operating and maintenance expenditure. Other internal policies and standards – these tools for asset creation and subsequent management are needed to support AM strategies. Risk Management (Policy No. OP-004) Risk Management Plan
Asset Management Framework This BAMP forms part of the City’s Asset Management Framework as depicted below and is included in the Property Class.
Plan Framework Key elements of this BAMP are: • Levels of service – specifies the services and levels of service to be provided by the City. • Future demand – how this will impact on future service delivery and how this is to be met. • Life cycle management – how the City will manage its existing and future building assets to provide the required services • Risk management • Financial summary – what funds are required to provide the required services. • Asset management practices • Monitoring – how the plan will be monitored to ensure it is meeting the city’s objectives. • Asset management improvement plan The BAMP forms the basis for short term budgets (5 years), medium term planning (10 years), and long term projections (20 years) for capital, operations and maintenance budgets.
3.
Levels of Service
Customer Research and Expectations The City participates in a community Business and Perceptions Survey every two years and the results are benchmarked against 17 other Councils in comparative Performance Measures in Local Government Customer Satisfaction Survey. This survey polls a sample of residents on their level of satisfaction with the City’s services. The City uses this information to gauge the level of satisfaction with building assets, amongst many other things, and the services they provide. These, along with service requests, are used to monitor levels of service and in turn assist in developing the Strategic Plan and allocation of resources in the budget. 2010 results relevant to buildings are summarised as follows: •
88% of respondents are satisfied with sport and recreation facilities (high)
•
73% of respondents are satisfied with community buildings, halls and toilets (relatively high)
The ‘Community Priorities Indicator’ shown below suggests that both satisfaction ratings are acceptable but do have room for improvement.
Legislative Requirements The City is also required to meet many legislative requirements including Australian and State legislation and State regulations. These must be considered in the development of levels of service and include:
Legislation
Requirement
Local Government Act (1995)
Sets out role, purpose, responsibilities and powers of local governments including the preparation of a Long Term Financial Plan supported by Asset Management Plans for sustainable service delivery.
Building Code of Australia (2005)
Construction and building standards for all buildings in Australia.
Aboriginal Heritage Act (1972)
Preservation of the community places and objects used by traditional owners
Aboriginal Heritage Regulations (1974)
Preservation of the community places and objects used by traditional owners
Dangerous Goods Safety Act (2004)
Relates to the safe storage, handling and transport of certain dangerous goods
Health Act (1911)
Relates to the handling and disposal of hazardous materials including asbestos.
Dividing Fences Act (1961)
Local government exemption from 50/50 contribution for dividing fences abutting public open space.
Disability Services Act (1993)
An Act for the establishment of the Disability Services Commission and the Ministerial Advisory Council on Disability, for the progress of principles applicable to people with disabilities, for the funding and provision of services to such people that meet certain objectives, for the resolution of complaints by such people and for related purposes.
Disability Services Regulations (2004)
Current amendments to Disability Services Act (1993)
OSH Act (1984)
The guidelines for employees and employers to undertake within the work environment
OSH Regulations (1996)
The guidelines for employees and employers to undertake within the work environment. Refers to current Australian Standards. Legislative Requirements
Current Levels of Service The City has defined its current service levels in two ways: 1. Community Levels of Service relate to how the community receives the service in terms of safety, quality, quantity, reliability, responsiveness, cost/efficiency and legislative compliance. 2. Technical Levels of Service supporting the community service levels to ensure that the minimum community levels of service are met. These technical measures relate to service criteria such as: • • •
Quality: Building condition and facility cleanliness Function: Facilities are fit for purpose and accessible Safety: Facilities are safe to enter and use
The City’s current service levels are detailed on the following page.
Key Performance Measure
Level of Service
Performance Measure Process
Performance Target
Current Performance
Ensure that buildings are clean, inviting, damage and graffiti free with suitable staff (if required) and reflect heritage values where appropriate.
No. of customer complaints per annum
70%
73% (2010)
Ensure that buildings are accessible where required and fully functional
No. of customer complaints per annum
80% of buildings in average condition or better (1-3)
79% (2011)
Building condition audit (5 yearly)
20% (or 30) per year
33 (2010/2011)
Building inspection(yearly)
80% (or 115) per year
130 (2010/2011)
Buildings are cleaned where appropriate
Cleaning inspection schedule
Average of 17 Inspections per week
17
Function
Facilities are fully operational
Reported defects actioned within 3 working days.
100%
100%
Safety
Ensure facilities are safe
COMMUNITY LEVELS OF SERVICE Quality
Function
Safety
Ensure that facilities are well lit, safe to enter and use.
3 (2010/2011)
1 (2010/2011)
TECHNICAL LEVELS OF SERVICE Quality
Buildings in good condition (