District of West Vancouver
Transportation Infrastructure Asset Management Plan
Prepared by: AECOM 3292 Production Way, Floor 4 Burnaby, BC, Canada V5A 4R4 www.aecom.com
Project Number: 60149252
Date: December 18, 2012
604 444 6400 604 294 8597
tel fax
AECOM 3292 Production Way, Floor 4 Burnaby, BC, Canada V5A 4R4 www.aecom.com
604 444 6400 604 294 8597
tel fax
December 18, 2012
Phil T. Bates, P.Eng. Manager, Engineering Services District of West Vancouver 750 17th Street West Vancouver, V7V 3T3
Dear Mr. Bates: Regarding:
Transportation Infrastructure Asset Management Plan
We are pleased to provide the revised report for the District of West Vancouver’s Transportation Infrastructure Asset Management Plan. As always, it was a pleasure working with you. Special thanks to Raymond Fung, John McMahon, Luke Hillan, Len Dixon, Gary Watt, Norm Wong and yourself for your input and invaluable contributions. If you have any questions please do not hesitate to contact me.
Sincerely, AECOM Canada Ltd.
Nancy Hill, P.Eng
[email protected] NH: Encl.
AECOM
District of West Vancouver
Transportation Infrastructure Asset Management Plan
Distribution List # of Hard Copies
PDF Required
6
yes
Name Phil Bates, District of West Vancouver
Revision Log Revision #
Revised By
1
NH/DM
Date
2
NH/YD
Oct. 5, 2010
Misc. revisions: Street lights service life, 100 year averages
3
NH
December 23, 2010
Revisions based on October 19 meeting and new budget figures.
4
NH
February10, 2011
Revisions based on DWV feedback
5
NH
October 10, 2012
Revisions based on DWV feedback
6
NH
December 18, 2012
Revisions based on DWV feedback
Sept. 22, 2010
AECOM Signatures
Report Prepared By: Nancy Hill, P.Eng. Project Manager
Report Reviewed By: David Main Senior Reviewer
Aecom Transportation Amp Dec 2012
Issue / Revision Description st
1 complete draft th
AECOM
District of West Vancouver
Transportation Infrastructure Asset Management Plan
Executive Summary The District of West Vancouver’s Engineering and Transportation Department owns and maintains $222 million worth (as per replacement value) of transportation related assets, which includes: roadways; lanes; bridges; roundabouts; traffic circles; sidewalks; curbs; signals; crosswalks; street lights; signs; ditches; retaining walls; concrete barriers; and a dock. These assets are collectively known in West Vancouver as “above ground” engineering assets. A replacement value based summary of these assets, based on 2012 dollars is provided in Figure ES.1. Figure ES.1
Replacement Value of West Vancouver’s Transportation Infrastructure ($ Millions)
p
($
) Roads $141
Signs and posts $1 Roundabouts and Circles $3
Bridges $33
Sidewalks $2
Curbs $16 Street lights $9
Other* $5
Traffic and Ped Signals $4 Retaining wall $2
Lanes $5
* Other includes ditches (open and culverted), gardens, dock, special cross walks and barriers. The inventory shown above is based on the best data that is currently available. District staff is currently reviewing its retaining wall inventory as part of the District’s asset management program. Further updates will be provided which may increase or decrease the funding requirements identified below. A 100 year forecast for the estimated cost of renewing these assets so that they can continue to provide the same level of service that they are currently providing is shown in Figure ES.2. The average cost of renewing these assets over the 100 year planning horizon is approximately $4.9 million per year, based on 2012 dollars. Currently, West Vancouver spends approximately $3.5 million per year on its transportation infrastructure, which includes renewal of existing infrastructure as well as the installation of new curbs, sidewalks and traffic calming measures.
i
AECOM
District of West Vancouver
Figure ES.2
Transportation Infrastructure Asset Management Plan
Capital Renewal Forecast (100 year view)
$11,000,000 Bridges $10,000,000
Other Transportation Infrastructure Roads
$9,000,000 $8,000,000
Rodgers Creek Development Budget 100 year average
$7,000,000 $6,000,000 $5,000,000 $4,000,000 $3,000,000 $2,000,000 $1,000,000 $0 2010 2015 2020 2025 2030 2035 2040 2045 2050 2055 2060 2065 2070 2075 2080 2085 2090 2095 2100 2105 Note: Other Transportation Infrastructure includes Traffic signals, Pedestrian signals, Street lights (Ornamental Lamps), Signs, Sign posts, Retaining walls, Dock, Special Cross Walks, Barriers, Roundabouts and Traffic Circles
Figure ES.2 shows that the first significant renewal hump is approximately 5 years away and there is an opportunity and a need to begin planning for this funding requirement. In addition to simply seeking additional funding, the District can evaluate the following options: 1. Determine if the current level of service that is provided by the present infrastructure can be feasibly reduced yet still provide infrastructure services that are acceptable to District residents and stakeholders; and 2. Determine if asset life-cycle costs can be reduced by considering alternative asset rehabilitation options to what the District current uses and to assess maintenance practices that affect the lifecycle of the District’s transportation assets. Should one or both of the strategies outlined above offer significant savings it’s possible that the District can delay and reduce proposed increases in funding requirements while still sustaining an acceptable level of service with its Transportation infrastructure. Figure ES.3 shows how the anticipated accumulated renewal requirements compare with the existing renewal budget levels. The infrastructure gap measures the difference between the required capital renewal budget and the current capital renewal budget. Assuming that the transportation capital renewal budget is only raised to keep up with inflation, there is no forecasted infrastructure gap until 2020. However, by 2035 (approx. 25 years) the infrastructure gap is projected to be $21 million and by 2109 (approx. 100 years) it is projected to be $135 million.
ii
AECOM
District of West Vancouver
Figure ES.3
Transportation Infrastructure Asset Management Plan
Projected Infrastructure Gap (100 Years)
$600,000,000
$500,000,000 Total Capital Requirements for all types of Transportation Infrastructure $400,000,000
$300,000,000
Cumulative Transportation Budget
Infrastructure Gap
$200,000,000
$100,000,000
$0 2010 2015 2020 2025 2030 2035 2040 2045 2050 2055 2060 2065 2070 2075 2080 2085 2090 2095 2100 2105 Note: This chart includes all renewal costs related to Bridges, Roads, Lanes, Cul‐de‐sacs, Sidewalks, Curbs, Traffic signals, Pedestrian signals, Street lights (Ornamental Lamps), Signs, Sign posts, Retaining walls, Dock, Special Cross Walks, Barriers, Roundabouts and Traffic Circles.
Even though it is estimated that the District has sufficient funding until 2020, the District can do things now to reduce the infrastructure gap that is projected beyond 2020. For example, the District can extend the life of its assets by continuing and perhaps enhancing its proactive inspection, maintenance and rehabilitation program and can reduce capital renewal costs by coordinating capital works wherever possible. More specifically, we recommend that the District begin now to take the following actions:
Review its pavement management system to help identify a true localized needs‐based assessment which will be based on the measured/observed results from the road data collection; Consult with its Council and residents to determine acceptable level of service associated with its transportation infrastructure; Fill in data gaps with respect to the inventory and condition of its transportation infrastructure; Develop policy with respect to financing large but infrequent infrastructure projects such as the replacement of a bridge; Review its asset maintenance practices to ensure that its assets are inspected and maintained in order to reduce their life‐cycle costs while providing the necessary levels of service; and Maintain asset information so that it is readily available and facilitates the optimization of West Vancouver’s assets.
iii
AECOM
District of West Vancouver
Transportation Infrastructure Asset Management Plan
Figure ES.4 illustrates the benefit of reducing lifecycle costs by 10% and provides a potential funding strategy that satisfies theoretical asset replacement requirements.
Figure ES.4
Eliminating the Infrastructure Gap through Cost-savings and Future Budget Increases
$600,000,000
$500,000,000
Total Capital Requirements for all types of Transportation Infrastructure Total Capital Requirements if 10% savings in renewal costs are achieved
$400,000,000
Total Budget for Transportation Infrastructure Total budget + 5% increase annually 2022‐2026
$300,000,000
$200,000,000
$100,000,000
$0 2010 2015 2020 2025 2030 2035 2040 2045 2050 2055 2060 2065 2070 2075 2080 2085 2090 2095 2100 2105 Note: This chart includes all renewal costs related to Bridges, Roads, Lanes, Cul‐de‐sac, Sidewalks, Curbs, Traffic signals, Pedestrian signals, Street lights (Ornamental Lamps), Signs, Sign posts, Retaining walls, Dock, Special Cross Walks, Barriers, Roundabouts and Traffic Circles.
The funding requirements outlined above are based on the District’s best available data with respect to the inventory and condition of their assets. District staff will be reviewing and updating both the inventory and the condition assessment of the assets as part of the District’s asset management program. Further updates will be provided which may increase or decrease the funding requirements identified in this plan. The asset renewal requirements outlined in this report are based on the current level of service. By increasing or decreasing the level of service (such as the frequency of paving roads), the District of West Vancouver would increase or decrease the renewal requirements accordingly. Identifying acceptable levels of service would need to be done in consultation with Council and residents.
iv
AECOM
District of West Vancouver
Transportation Infrastructure Asset Management Plan
Table of Contents Executive Summary page
1.
Introduction .....................................................................................................................................1
2.
Asset Inventory: “What do we own?” ...........................................................................................2 2.1 Asset Inventory Summary.................................................................................................................... 2 2.2 Roads, Sidewalks and Curbs .............................................................................................................. 2 2.3 Lanes ................................................................................................................................................... 4 2.4 Bridges ................................................................................................................................................. 4 2.5 Other Assets ........................................................................................................................................ 5
3.
Replacement Costs: “What is it worth?” ......................................................................................6
4.
What is its Condition? ..................................................................................................................11 4.1 Roads................................................................................................................................................. 12 4.2 Bridges ............................................................................................................................................... 15 4.3 Signs and Sign Posts......................................................................................................................... 17 4.4 Other Assets ...................................................................................................................................... 17
5.
What Needs to be Done?..............................................................................................................18
6.
When Do We Need To Do It?........................................................................................................20 6.1 Roads................................................................................................................................................. 21 6.2 Bridges ............................................................................................................................................... 21 6.3 Assets to Be Maintained Only ........................................................................................................... 21
7.
How Much Will It Cost? ................................................................................................................22
8.
Funding Strategies: “How will we pay for it?” ...........................................................................27 8.1 Current Funding Levels ..................................................................................................................... 27 8.2 Future Strategies ............................................................................................................................... 28 8.3 Infrastructure Funding Mechanisms .................................................................................................. 30 8.4 Next Steps ......................................................................................................................................... 30
9.
Adopting Asset Management Practices .....................................................................................31
10.
Recommendations ........................................................................................................................33 10.1 Sustainable Funding .......................................................................................................................... 33 10.2 Improving Asset Information and Optimizing Renewal Budgets ....................................................... 33
Appendices Appendix A.- Transportation Asset Inventory Appendix B – Project Methodology Appendix C – Illustrative Examples of West Vancouver Roadways with Different PQI Appendix D – Bridge Infrastructure Long Term Plan
AECOM
1.
District of West Vancouver
Transportation Infrastructure Asset Management Plan
Introduction
The District of West Vancouver’s Engineering and Transportation Department commissioned this study to develop a long range forecast (100 years) of all of its transportation related infrastructure renewal requirements as a starting point to developing a program to ensure the financial sustainability of its infrastructure in perpetuity. InfraGuide operated from 2001 to 2007 as a partnership between the Federation of Canadian Municipalities, the National Research Council and Infrastructure Canada. InfraGuide’s national network of infrastructure experts produced a collection of case studies, best practice reports and tools for municipalities. To help West Vancouver meet its sustainable infrastructure objectives, AECOM developed this Asset Management Plan using the “Seven Questions of Asset Management” approach that is recommended by InfraGuide’s “Best Practice for Managing Infrastructure Assets”1. The results of each of the seven steps shown in Figure 1.1 are outlined in this report. This project leveraged work recently completed to satisfy the Public Sector Accounting Board’s (PSAB) reporting requirements for Tangible Capital Assets and is being complemented by similar plans for West Vancouver’s water, stormwater and sanitary systems. The results of this plan can be used to assist in developing infrastructure renewal budgets, identifying replacement priorities, determining funding sources and communicating infrastructure needs to stakeholders. This plan covers all components within West Vancouver’s transportation system that are owned and maintained by the Engineering and Transportation Department, namely: 2 million m2 of roadway; 78,000 m2 of lanes; 15 bridges; 3 roundabouts; 5 traffic circles; 30,000 m2 of sidewalk; 300,000 m of curb; 11 traffic signals; 10 pedestrian signals; 2 special crosswalks; 1096 street lights; 2700 m2 of gardens; 7588 signs; 4582 signposts; 57,400 m of ditches; 5,100 m of ditch culverts, 9300 m2 of retaining wall; 1450 m of roadside concrete barrier; and 1 dock. Transportation related assets that are owned and maintained by the Parks Department such as the Esquimalt Pedestrian Bridge over Lawson Creek, have not been included in this Asset Management Plan. The renewal forecast for this study was completed using an MS-Excel based Capital Asset Planning (CAP) model. An electronic version of this model, with instructions for updating it, has been given to West Vancouver. A print out of the transportation system inventory from the model is provided in Appendix A. It is important to note that this model and the findings in this report provide a current “snapshot” of West Vancouver’s transportation infrastructure. If the system changes, for example by the reconstruction of a bridge, then the model needs to be updated accordingly. All cost estimates have been prepared using current (2012) dollars in order to facilitate year-to-year comparisons and to avoid the uncertainty of projecting inflation and discount rates far into the future. The methodology and sources of data used to develop this asset management plan can be found in Appendix B.
Figure 1.1 Seven Questions of Asset Management
1
“Managing Infrastructure Assets” , October 2005, FCM http://fcm.ca/Documents/reports/Infraguide/Managing_Infrastructure_Assets_EN.pdf
1
AECOM
District of West Vancouver
2.
Asset Inventory: “What do we own?”
2.1
Asset Inventory Summary
Transportation Infrastructure Asset Management Plan
This plan covers all transportation related assets that are maintained by the Engineering and Transportation Department, which includes: 2 million m2 (269 km) of roadway; 78,000 m2 of lanes; 15 bridges; 3 roundabouts; 5 traffic circles; 30,000 m2 of sidewalk; 300,000 metres of curb; 11 traffic signals; 10 pedestrian signals; 2 special crosswalks; 1096 street lights; 2700 m2 of gardens; 7588 signs; 4582 signposts; 57,400 metres of ditch; 5,100 m of ditch culverts; 9300 m2 of retaining wall; 1450 metres of roadside concrete barrier; and 1 dock. These assets are also known in West Vancouver as “above ground” engineering assets. The data sources for the various asset types are outlined in Appendix B. In summary the main data sources are listed below. Road Matrix - the District’s pavement management system Various spreadsheets/documents from the District of West Vancouver o DWV-#334767-v1-ASSET_PROJECT_-_ROAD_INVENTORY.XLS o DWV-#192274-v1-MARINE_DRIVE_BARRIER_DATA_SHEET.XLS o DWV-#388560-v1-ASSET_-_ROADS_MODIFIED_2006_TO_2010.XLS o DWV-#389312-v1-Asset_Project_-_Retaining_walls.DOC The District’s GIS Planet GIS – the District’s bridge management system A Bridge Infrastructure Long Term Plan completed by MMM Group in February 2012 Assets that are maintained by the Parks department such as street trees, trails and piers have not been included in this plan. In March 2010, AECOM prepared an “Asset Management Information Strategy Report” for the District of West Vancouver which looked at how the District manages its asset data. Key findings and recommendations from this report are referred to within this plan.
2.2
Roads, Sidewalks and Curbs
An inventory of the District’s roads, sidewalks and curbs can be found within the District’s geographic information system (GIS) as well as their Road Matrix pavement management system. An export of the data from the District’s
2
AECOM
District of West Vancouver
Transportation Infrastructure Asset Management Plan
Road Matrix pavement management system was provided to AECOM. At that time, the data in the Road Matrix program had been last updated in 2006. Any changes to the road inventory since 2006 was determined from the District’s GIS. The data within the Road Matrix program is currently being updated based on recent pavement inspection results and will be available for future analysis. The Road Matrix system does not include any cul-de-sacs less than 100 metres in length. From GIS it was determined that there are approximately six (6) kilometres of cul-de-sacs less than 100 metres in length. These culde-sacs were included in this study. It was assumed the cul-de-sac roadways are, on average, eight (8) metres wide. The District has a total of 2 million m2 of pavement within its roadways which corresponds to 269 km of 2 lane roadway. The District’s roads are classified as local residential, local collector and arterial. As can be seen in Figure 2.1, 64% of the roads (by road surface area) are local, 27% are collectors and 9% are arterials. Figure 2.1
Area of Roadway by Classification
Arterial 165,933 m2 (17.8 km)
Collector 533,991 m2 (65.7 km) Local 1,318,880 m2 (182.5 km)
West Vancouver’s roadways have been constructed gradually over the last 100 years as the municipality has grown. West Vancouver’s Road Matrix program lists the year that each roadway’s base and pavement were installed. However, due to the lack of infrastructure construction records, the data should be considered as a “best estimate”. Within the Road Matrix system West Vancouver has four types of curbs: asphalt curb with sidewalk, rollover curb and gutter with sidewalk, concrete curb with sidewalk, and barrier curb and gutter with sidewalk. Except for the asphalt curb with sidewalk, it has been assumed that all other curb types are constructed with concrete. West Vancouver currently has approximately 30,000 m2 of sidewalk. Each year West Vancouver constructs approximately 2 km (or 3,000 m2) of new sidewalk to improve pedestrian accessibility within West Vancouver.
3
AECOM
2.3
District of West Vancouver
Transportation Infrastructure Asset Management Plan
Lanes
West Vancouver’s GIS has the centre line for the District’s laneways but no additional information such as lane width or material. To complete their Statement of Tangible Capital Assets, West Vancouver staff measured each lane and entered the information into a spreadsheet. This spreadsheet was uploaded to the accounting access data-base. It has not been determined how and when the lane database will be updated. As can be seen in Figure 2.2, 78% of the lanes are paved, 15% have gravel surfaces and 7% have a brick surface. Gravel lanes will remain as gravel unless residents go through the LIP/LAS (local area service lane paving) process, where they will be responsible for the paving costs.
Figure 2.2
Area of Lane by Surface Type
Brick 5,682 m2 (742 m) Gravel 11,622 m2 (3,350 m)
Paved 61,003 m2 (15,025 m)
2.4
Bridges
The District of West Vancouver’s Roads and Transportation Department currently owns and maintains 15 bridges. The District uses a bridge management system titled Planet GIS, which is kept offline and maintained by an external service provider. A summary of the bridge inventory, as of November 2008, was provided by the District. This inventory was updated with bridges recently constructed or currently under construction based on conversations with District staff and the Bridge Infrastructure Long Term Plan developed by MMM Group in February 2012. This report only addresses bridges that are maintained by West Vancouver’s Roads and Transportation Department. Pedestrian bridges that are part of West Vancouver’s trail system are typically maintained by the Parks Department, and as such, their renewal will not be considered as part of this plan. One such bridge is the Lawson Creek Bridge at the 2000 block of Esquimalt. In contrast, the Nelson Creek Bridge is currently only being used by pedestrians/cyclists, but was once a vehicular bridge and is still owned and operated by the Roads and Transportation Department. Therefore, it has been included in this analysis. In the future, the bridge may be officially designated a pedestrian/cyclist bridge and ownership may be passed to the Parks Department.
4
AECOM
2.5
District of West Vancouver
Transportation Infrastructure Asset Management Plan
Other Assets
In 2008, the District compiled an inventory of its traffic signals and street lights. In 2005, the District developed an inventory of its signs and signposts. West Vancouver maintains its inventory of signalisation assets within a custommade database. Since this database does not have the required functions to effectively manage the maintenance of these assets, it is considered a temporary holding place for the asset inventory until a permanent solution is developed. The District of West Vancouver developed an initial inventory of its roadside barriers and retaining walls and provided it to AECOM for this study. This initial inventory includes a total of 1450 metres of roadside barriers and 9300 m2 of retaining wall but the retaining wall inventory does not appear to be extensive enough to contain a true representation of the total inventory. We recommend that the District review their retaining wall inventory as the cost and risk associated with managing its retaining walls could be significant. The District of West Vancouver’s Roads and Transportation Department owns and maintains one dock at Eagle Harbour, as it is considered an extension of the transportation network. The remainder of the docks owned by the District of West Vancouver are maintained by the Parks Department. The Roads and Transportation Group maintains 57,400 metres of open ditch, 5,100 m of ditch culverts and 2700 m2 of garden associated with engineering infrastructure such as traffic circles, medians and bioswales. The length of ditches was determined from the District of West Vancouver’s GIS shapefiles obtained in 2009. A summary of the garden inventory was provided within the spreadsheet titled “DWV-#334767-v1-ASSET_PROJECT__ROAD_INVENTORY.XLS”.
5
AECOM
3.
District of West Vancouver
Transportation Infrastructure Asset Management Plan
Replacement Costs: “What is it worth?”
The replacement value of each asset (in 2012 dollars) can be found in the asset inventory in Appendix A. The unit replacement value for each asset type can be found in Table 3.1 below. The table also shows the unit replacement value that was developed for PSAB Reporting at the end of 2007. Table 3.1
Unit Replacement Costs by Asset Type
Asset Type Roads
Unit Replacement Value $70/m2
Unit Replacement Value (PSAB) $50
Lane - paved Lane – gravel Lane - brick Sidewalk - asphalt
$70/m2 $25/m2 $100/m2 $35/m2
$36 $7 $36 $63
Sidewalk - concrete Curb – asphalt Curb - concrete Traffic signal – flashing beacon Traffic signal – full
$65/m2 $30/m $60/m $40,000/unit $250,000/unit
$63 $26 $67 $40,000 $180,000
Pedestrian signal
$150,000/unit
$50,000
Street lights (ornamental lamps) Gardens Signs Sign post Ditch - culverts Ditch - open Retaining wall – concrete Retaining wall – dry stacked rock Retaining wall – Allan block Dock Special crosswalks Barriers Roundabout Traffic circle
$8,000/unit
$6,688
$150/m2 $65/unit $107/unit $500/m $25/m $600/m2 $200/m2
$142 $25-$85 $107 Not included Not included Not included Not included
$650/m2 $500,000/unit $50,000/unit $110/unit $500,000/unit $250,000/unit
Not included Not included $40,000 Not included Not included Not included
Explanation for New Unit Replacement Value New value considers the cost of the road sub-grade. Recommended by DWV Includes cost for re-grading Considered cheaper material and installation cost of asphalt
Recommended by DWV as PSAB value too low Recommended by DWV as PSAB value too low
Based on AECOM experience Based on AECOM experience Based on AECOM experience Based on AECOM experience Based on AECOM experience Recommended by DWV Recommended by DWV Recommended by DWV Recommended by DWV
The replacement values for the roadways include the pavement surface, the base and the sub-base, but do not include sidewalks or curbs. Curbs and sidewalks have been considered separately as not all roads have curbs and sidewalks. The value of the land that the roadways occupy has not been considered as part of the replacement cost. It should be noted that the unit replacement costs for the different road types in Table 3.1 account for full replacement of each asset type by the exact same asset to give a sense of the “worth” of the District’s transportation
6
AECOM
District of West Vancouver
Transportation Infrastructure Asset Management Plan
infrastructure inventory. In reality, as the District replaces its infrastructure at the end of each asset’s life it may cost more or less than the unit replacement cost in Table 3.1. For instance, when the District repaves a street it may not need to replace the base and sub-base, so the cost of renewing that road will be less than the unit costs presented in Table 3.1. This will be discussed more in Section 7 “How much will it cost?” The estimated replacement costs for each of the District’s bridges are listed below. The values for the Rodgers, Pipe Creek and Almondel bridges were provided by District staff based on recent construction costs and the Bridge Infrastructure Long Term Plan prepared in February 2012 (see Appendix D). The values for the other bridges were based on an appraisal conducted in 2006 and then increased by 13% to account for inflation. Table 3.2
Estimated Replacement Cost for West Vancouver’s Bridges
Bridge Name 400 Block Keith Road - Brothers Creek 500 Block Inglewood - Brothers Creek 3900 Block Marine Drive - Sandy Cove 4300 Block Marine Drive - Cypress Creek Nelson Canyon - Nelson Creek 300 Block Keith Place - Brothers Creek 1100 Block Millstream Rd. - Brothers Creek McCrady - Eagle Lake - Cypress Creek 1800 Block Sinclair Court - Lawson Creek Whitby - Vinson Creek Chippendale/MacDonald Chippendale/Marr Rodgers Creek Pipe Creek Almondel
Estimated Replacement Cost (2012 dollars) $2.6 million $1.3 million $2.1 million $2.9 million $3.9 million $1.7 million $0.5 million $0.5 million $0.7 million $5.0 million $2.2 million $2.8 million $2.4 million $1.4 million $3.1 million
Bridge Type Vehicular Vehicular Vehicular Vehicular Pedestrian/Cyclists only Vehicular Vehicular Vehicular Vehicular Vehicular Vehicular Vehicular Vehicular Vehicular Vehicular
The Lawson Creek Bridge at the 2000 Block Esquimalt has not been included in this analysis as it is a pedestrian bridge associated with the District’s trail system, and as such is owned and operated by the Parks Department. Based on the unit costs shown in Table 3.1 as well as the estimated bridge replacement costs in Table 3.2, the total replacement value for the District’s Transportation related infrastructure is estimated at $222 million. A breakdown of this estimate is shown in Figure 3.1 and Table 3.3. In Figure 3.1 “Other” refers to gardens, ditches, the dock, special crosswalks and concrete barriers. As can be seen in Figure 3.1, more than half (64%) of the District’s transportation infrastructure (by value) is within the pavement of its roadways. If the value of the curbs is included, then approximately 71% of the District’s transportation infrastructure (by value) is within its roads. Fifteen percent (15%) of the District’s transportation infrastructure (by value) is within its bridges, and 4% within its street lights, while the remaining 10% includes other types of infrastructure such as signals, retaining walls, lanes and sidewalks.
7
AECOM
District of West Vancouver
Transportation Infrastructure Asset Management Plan
Figure 3.1 Total Replacement Value by Asset Type in $millions (2012)
Roads $141
Signs and posts $1 Roundabouts and Circles $3
Bridges $33
Sidewalks $2
Curbs $16 Street lights $9
Other* $5
Traffic and Ped Signals $4 Retaining wall $2
Lanes $5
* Other refers to gardens, ditches, the dock, special crosswalks and barriers
8
AECOM
District of West Vancouver
Transportation Infrastructure Asset Management Plan
Table 3.3 Total Replacement Value by Asset Type Asset Type Roads Lanes Sidewalks Curbs Traffic signals Pedestrian signals Street lights Gardens Signs Sign posts Ditch culverts Retaining wall Dock Special Cross Walks Barriers Bridges Roundabout Traffic Circle Total
Quantity 2,018,804 78,307 29,945 278,432 11 10 1,096 2,687 7,588 4,582 5,122
m2 m2 m2 m2 units units units m2 units units m
9,306 1 2 1,450 16 3 5
m2 units units m units m units
Value $141,316,280 $5,012,740 $1,939,435 $16,416,060 $2,540,000 $1,500,000 $8,768,000 $403,050 $493,220 $490,274 $2,561,000 $2,201,750 $500,000 $100,000 $159,500 $33,352,819 $1,500,000 $1,250,000 $220,504,128
As can be seen in Figure 3.2, the majority (60%) of West Vancouver’s roads by replacement value (as well as length) are local residential roads.
Figure 3.2 Replacement Value for Roads- by Road Type
Arterial, $11,615,310 , 11%
Collector, $32,039,460 , 29% Local, $65,944,000 , 60%
9
AECOM
District of West Vancouver
Transportation Infrastructure Asset Management Plan
Figure 3.3 Replacement Value for Lanes by Lane Type
Gravel, $174,330 , 9%
Brick, $227,280 , 12%
Paved, $1,525,075 , 79%
As can be seen in Figure 3.3, the majority (79%) of West Vancouver’s lanes by replacement value (and length) are paved.
10
AECOM
4.
District of West Vancouver
Transportation Infrastructure Asset Management Plan
What is its Condition?
Condition assessments were not conducted as part of this study. We did however draw on condition information that was already available, which is described below. Table 4.1 summarises which type of transportation asset receives condition assessments on a regular basis and which ones are inspected only as issues arise. Bridges, roads, ditches, signals, special crosswalks and the dock are on a regular inspection schedule. The entire inventory of signs and sign posts was inspected in 2005. The condition of the roads and bridges are tracked within the District’s pavement and bridge management systems respectively. Table 4.1
Condition Assessment Program for Transportation Assets
Asset Type
Schedule
Roads Lanes Sidewalks Curbs Traffic signals
All roads every 5 years As issues arise As issues arise As issues arise Annually
Pedestrian signals
Annually
Street lights (Ornamental Lamps) Gardens Signs Sign posts Ditches Retaining wall Dock
As issues arise As issues arise No set schedule No set schedule Annual inspection As issues arise Annual inspection
Special Cross Walks
Annually
Barriers Bridge
As issues arise Annually
Roundabout Traffic Circle
As issues arise As issues arise
Last Inspection 2010
Comment Tracked within Road Matrix system
Inspected/maintained by “Cobra” and a report submitted annually Inspected/maintained by “Cobra” and a report submitted annually
2005 2005
Entire inventory was inspected in 2005 Entire inventory was inspected in 2005 Condition not tracked
2008
Condition and replacement plan in 2008 Balanced Environmental report. Inspected/maintained by “Cobra” and a report submitted annually Alternating between major and minor inspections. Tracked in Bridge Management System
More details about the condition of the transportation assets are provided in Sections 4.1 to 4.3.
11
AECOM
District of West Vancouver
4.1
Transportation Infrastructure Asset Management Plan
Roads
Historically the District inspects the pavement on its roadways every 5 years. The results of these assessments are compiled within the District’s pavement management system called Road Matrix. This system identifies rehabilitation work that should be completed as the road infrastructure deteriorates. At the time that this study was initiated the Road Matrix program contained data from its 2006 inspection. It is this 2006 data which has been used for the analysis associated with this plan. The condition of a pavement is often determined and described used the Pavement Quality Index (PQI) which is a composite index reflecting both pavement smoothness and cracking. Table 4.2 shows the average PQI for each road type in West Vancouver. A PQI of 98 represents a road in like new condition. The lower the PQI the worse the condition of the road is. On average the arterial roads are in better condition than the residential roads. As can be seen in Table 4.2 the roads are, on average, halfway through their estimated service life. It is generally accepted that roads deteriorate non-linearly, with deterioration accelerating over time. However, as a first approximation using linear deterioration we can estimate that on average, District roads are approximately halfway through their estimated service lives (see Table 4.2). Table 4.2
Average Condition of West Vancouver Roadways
ROADS
Area (m2)
Average PQI
Arterial Collector Residential Local Residential TOTAL
181,307 543,714 1,325,543 2,050,564
79.9 75.5 69.5 71.4
Typical PQI when rehab is required 62 56 49
Avg % of service life used
50% 54% 58%
The condition of a specific roadway will depend on a number of factors such as quality of road base, traffic volume, maintenance practices, disturbances such as utility cuts, weather and age. However, the typical deterioration of roadway asphalt based on data from West Vancouver’s Road Matrix system can be estimated as shown in Figure 4.1.
12
AECOM
District of West Vancouver
Figure 4.1
Transportation Infrastructure Asset Management Plan
Typical Asphalt Deterioration for Different Road Types
100 Arterial
Collector
Local
90
PQI
80
70
60
50
Road rehab conducted 40 1
3
5
7
9
11
13
15
17
19
21
23
25 27 Years
29
31
33
35
37
39
41
43
45
47
49
The PQI for the roads in West Vancouver are summarised in Figures 4.2 and 4.3. According to the PQI reported in the Road Matrix program, the majority (81%) of West Vancouver’s roads are showing some signs of deterioration but are still in good or fair condition. Figures 4.2 and 4.3 do not include the District’s 6 km of cul-de-sacs as they are not assessed as part of the District’s road condition assessment program and are therefore not within the District’s Road Matrix program. Although we do not know the condition of these cul-de-sacs, we have made appropriate assumptions later on to include them within this Transportation Asset Management Plan. Appendix C shows pictures of various roadways In West Vancouver with different PQI.
13
AECOM
Figure 4.2
District of West Vancouver
Transportation Infrastructure Asset Management Plan
PQI Range for Each Road Type
1‐20
21‐40
41‐60
61‐80
81‐100
unknown
100% 90% 80% 70% 60% 50% 40% 30% 20% 10% 0% Arterial
Collector Residential
Local Residential
Total
Source data: Pavement Quality Index values extracted from the District of West Vancouver's Pavement Management System in April 2010
14
AECOM
District of West Vancouver
Figure 4.3
Transportation Infrastructure Asset Management Plan
PQI Range for All Road Types
50%
45%
45% 40%
36% 35% 30% 25% 20% 15%
10%
10%
6% 5%
3% 0.13%
0% 1‐20
21‐40
41‐60
61‐80
81‐100
unknown
Source data: Pavement Quality Index values extracted from the District of West Vancouver's Pavement Management System in April 2010
4.2
Bridges
The District of West Vancouver regularly inspects and performs maintenance and rehabilitation work on its bridges. The results of these inspections, the condition of specific bridge components and recommended maintenance and repair work can be found within West Vancouver’s Bridge Management System called Planet GIS. In 2008, all of the District’s bridges were inspected. Table 4.3 shows the age of each bridge and the results from the District’s 2008 Bridge Inspection Report. The District of West Vancouver has been responsive in dealing with issues resulting from the inspection. For instance, as a result of the 2008 inspection, the District replaced the deck of the Keith Place bridge over Brothers Creek.
15
AECOM
Table 4.3
District of West Vancouver
Transportation Infrastructure Asset Management Plan
Age and Condition of West Vancouver’s Bridges from 2008 Bridge Inspection Report
Bridge
Age
Inspection Summary
400 Block Keith Road - Brothers Creek (1)
58
500 Block Inglewood - Brothers Creek (2) 3900 Block Marine Drive - Sandy Cove (3)
24
4300 Block Marine Drive - Cypress Creek (5)
70
Nelson Canyon - Nelson Creek (6)
54
300 Block Keith Place - Brothers Creek (8) 1100 Block Millstream Rd. - Brothers Creek (9) McCrady - Eagle Lake - Cypress Creek (10) 1800 Block Sinclair Court - Lawson Creek (11) Whitby - Vinson Creek (12)
19
Strengthening of the bridge was carried out in 2007. Although the bridge is showing signs of deterioration due to age and usage, it is in good condition overall. Need to relieve pressure of pipes on abutments & reinstate pipe so they rest on pipe hangers. Bridge has been seismically upgraded. Some important rehab work needed (install guardrail; relocate bus stop; repair staircase; repair expansion joint seals.) Overall the bridge is considered to be in fair to good condition. Abutment remediation needed and vegetation needs to be trimmed. This pedestrian bridge is part of the TransCanada Trail network. It also serves to support the watermain suspended beneath. Some immediate rehab work required on this bridge.
46
Some minor rehab work required on this bridge.
26
Some rehab work required on this bridge.
15
Chippendale/MacDonald (14)
3
Biggest concerns are peeling paint, reduced sightlines from overgrown vegetation, trip hazards and downstream erosion. Despite this bridge’s young age it is experiencing cracking and the waterproof membrane needs to be repaired. In as-new condition.
Chippendale/Marr (13)
3
In as-new condition.
Rodgers Creek
0
Not inspected.
Pipe Creek
0
Not inspected.
Almondel (4)
1
Bridge under construction at time of inspection.
71
8
16
AECOM
4.3
District of West Vancouver
Transportation Infrastructure Asset Management Plan
Signs and Sign Posts
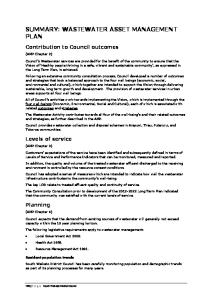
The District’s street signs were inspected in 2005 and given a rating of good, fair or poor. As can be seen in Figure 4.4 approximately half (46%) of the signs are in fair condition, 38% are in good condition and 16% are in poor condition. An inventory of the signposts has been developed to determine exact location and post type, but a condition rating was not determined.
Figure 4.4
Street Sign Condition
Poor 16% Good 38%
Fair 46%
4.4
Other Assets
Specific information on the condition of the traffic signals, pedestrian signals and specialized crosswalks can be found within an annual inspection report produced by the contractor “Cobra”. For the purposes of this study the condition of the traffic signals has been estimated based on their age in comparison to their expected life. The same cannot be done for the street lights as their installation dates are unknown. The District does not have an inspection program for its retaining walls and barriers. As a result, their condition is unknown. For this study, age in comparison to expected life has been used as a proxy for the condition of the retaining walls. The same cannot be done for the concrete barriers as their installation date is unknown. The District’s Road and Transportation staff maintains the dock annually and as issues arise. In 2008 Balanced Environmental prepared a report for the District in which it indicated the condition of the dock and options for its replacement. The ditches in West Vancouver are inspected once per year and maintained as required. Their condition is not recorded or tracked. The gardens are also regularly maintained as required.
17
AECOM
5.
District of West Vancouver
Transportation Infrastructure Asset Management Plan
What Needs to be Done?
To sustain the functionality of West Vancouver’s Transportation infrastructure, numerous preventative and corrective maintenance activities must occur, and assets must be renewed. In general, maintenance practices impact renewal requirements as effective preventative maintenance programs will help to extend the life of a given asset. For instance, District staff has reported that their street lights last longer when they are regularly maintained. The District’s Engineering and Transportation Department currently undertakes substantive inspection, maintenance, and rehabilitation activities for most of its assets and will continue to do so as well as investigate how these activities might be further enhanced. As outlined in Table 4.1, the District regularly inspects most of its transportation assets; namely roads, bridges, ditches, signals and the Eagle Harbour dock. In 2005 the District determined the condition of all its signs and sign posts, but future inspections have not been scheduled at this time. The District conducts preventative maintenance on its roads, lanes, bridges, dock, street lights, traffic signals and problem ditches. Other assets such as street signs, sidewalks, retaining walls and the majority of ditches are maintained in a reactive manner. More details about the maintenance of individual asset types are provided below. Based on regular condition assessments, the District’s pavement management system called Road Matrix identifies rehabilitation work that should be completed to maintain the roads, sidewalks and curbs in good operating condition. Historically, the majority of roads (i.e. approximately 75% ) in West Vancouver have been rehabilitated by pulverizing and repaving. Only a small number of roads (i.e. approximately 5%) have required full reconstruction. The remaining 20% (approximately) have been rehabilitated through mill and overlay. This is in addition to regular maintenance activities such as crack sealing and line painting. The District conducts maintenance on its gravel, brick and asphalt lanes (filling potholes, replacing bricks, patching asphalt etc.). Gravel lanes will not be paved unless residents initiate the LIP/LAS (local area service lane paving) process. Asphalt and brick lanes will need to be renewed at the end of their service life. Traffic signals, pedestrian signals and special crosswalks are inspected and maintained by the contractor “Cobra” and a report submitted annually. We have assumed that a traffic signal or street light will get replaced by a similar type of asset. In reality, the District may wish to install a new type of traffic signal or street light or even install one where there previously wasn’t one. As these additional costs are likely minor with respect to the District’s total infrastructure costs, and unknown at this point in time, they have not been considered in this plan. The District of West Vancouver should continue to inspect and maintain its bridges in a proactive manner. Maintenance, rehabilitation and replacement needs for the District’s bridge network over the next 100 years were identified as part of the “Bridge Infrastructure Long Term Plan” developed by MMM Group in February 2012. The Nelson Creek bridge was formerly a vehicular bridge but is now used only for pedestrians and cyclists as part of West Vancouver’s trail system. The District of West Vancouver now needs to decide whether to rehabilitate this bridge or replace it with a pedestrian bridge. It is likely that the bridge will be taken over by the Parks department as it no longer part of the road network. Currently the District has a variety of retaining walls: concrete retaining walls, dry stacked walls, and Allan Block walls. It was assumed that an existing wall would be replaced by the same type of wall; whereas in reality an existing dry stacked wall that needs to be replaced may be replaced by an Allan Block wall. The retaining walls at the Chippendale and Almondel bridges have been considered as a part of the bridges and have not been considered separately here. The retaining wall inventory that was provided for this study should be considered preliminary. The District is in the process of developing a comprehensive retaining wall inventory to further its transportation asset management practices.
18
AECOM
District of West Vancouver
Transportation Infrastructure Asset Management Plan
Based on conversations with District staff, gardens and open sections of ditches will only be maintained and not replaced as part of the District’s capital renewal program. Therefore there is no renewal cost associated with gardens or open ditches in this asset management plan. Ditch culverts, such as those associated with driveway crossings will need to be renewed at the end of their service life. As this study provides a high level view of asset renewal requirements, the cost of maintenance and rehabilitation activities – such as the replacement of bridge bearings or replacement of lights – has not been identified. In addition, the benefits of rehabilitation activities to extend an asset beyond its normal service life, have not been considered. Instead, all assets are assumed to require total replacement at the end of their predicted service life, which provides a more conservative approach to budgeting than if rehabilitation strategies were also considered. In Section 9, the potential for extending the life of assets through a targeted rehabilitation program is discussed.
19
AECOM
6.
District of West Vancouver
Transportation Infrastructure Asset Management Plan
When Do We Need To Do It?
As outlined in Section 5, assets will need to be regularly inspected and maintained, and then replaced at the end of their service life. The graphs in Section 7 show when assets will need to be renewed and the associated estimated costs. A summary of the service lives by asset type used in this analysis, are presented in Table 6.1 below. Further discussion on each asset type is provided in Sections 6.1-6.4. Table 6.1
Expected Service Lives for Different Asset Types
Asset Type Road – arterial Road – collector Road – local Lane – paved
Average Estimated Service Life (years) 15 20 25-50 50
Lane – gravel Lane – brick Sidewalk – asphalt
Just requires maintenance 40 50
Sidewalk – concrete
50
Curb – asphalt
50
Curb – concrete
50
Traffic signal – flashing beacon Traffic signal – full Pedestrian signal Street light Gardens Signs Sign post Ditch culverts Open ditches Retaining wall – concrete Retaining wall – dry stacked rock Retaining wall – Allan block Retaining wall – New Dock Special crosswalks Barriers Roundabout Traffic circle Bridges
30 30 30 35 Just requires maintenance 10 40 50 Just requires maintenance 75 150 100 100 25 30 50 50 50 Approx 50-100; varies by bridge
Source of Estimated Service Life Based on Road matrix & DWV/AECOM experience Based on DWV/AECOM experience Based on DWV experience and industry norms Based on West Van staff experience Based on AECOM experience Based on Road Matrix data and AECOM experience Based on Road Matrix data and AECOM experience Based on Road Matrix data and AECOM experience Based on Road Matrix data and AECOM experience Based on West Van staff experience Based on West Van staff experience Based on West Van staff experience Based on West Van staff experience Based on West Van staff experience Based on West Van staff experience Based on AECOM experience Based on AECOM experience Based on AECOM experience Based on AECOM experience Based on AECOM experience Based on West Van staff experience Based on West Van staff experience Based on AECOM experience Based on AECOM experience Based on AECOM experience DWV-#334767-v1-ASSET_PROJECT__ROAD_INVENTORY.XLS; MMM Group – “Bridge Infrastructure Long Term Plan”; Life span of new bridges estimated by AECOM bridge staff.
20
AECOM
6.1
District of West Vancouver
Transportation Infrastructure Asset Management Plan
Roads
The District selects roads for repaving based on the road’s condition (i.e. PQI), the road classification, coordination with utilities’ work, and available budgets. This means that some roadways may need to be repaved after only 15 years of service whereas other roadways may last for 50 years before they need to be repaved. From 2006-2009, West Vancouver rehabilitated (milled and overlaid or partially reconstructed) approximately 2% of its roadways each year. The District is reviewing its pavement management system to ensure that its road rehabilitation decisions are based on local road data collected. In the absence of a true needs based assessment from the District’s pavement management system, AECOM and the District have agreed to use age as an indicator of road condition for this study and the following typical service lives for each road type: Arterial – 15 years; Collector residential – 20 years; and Local residential –25-50 years. Based on the agreed upon service lives above, the CAP model states that there is approximately 2.1 km of arterial road and 4.4 km of collector residential road that is already due for replacement. In Section 7 this “backlog” (at an estimated cost of $3 million) has been spread out over the first five years (i.e.2010-2014).
6.2
Bridges
The timing of rehabilitation work over the next 100 years on the District’s bridges such as bridge replacement, deck replacement/overlay, wearing surface and waterproofing membrane replacement and crack sealing of wearing surface was outlined in the Bridge Infrastructure Long Term Plan prepared by the MMM Group for the District dated February 1, 2012. A copy of this plan is provided in Appendix D. The resulting costs were entered into the CAP model.
6.3
Assets to Be Maintained Only
The District of West Vancouver does not “replace” its gardens, gravel lanes and open ditches but rather maintains them regularly. As this work is completed through maintenance budgets, no capital renewal work associated with gardens, gravel lanes and open ditches has been considered within this study. It should be noted that ditch culverts (i.e. where a ditch goes under a driveway crossing) will need to be replaced at the end of its service life. Based on past experience and industry standards, the District and AECOM have agreed to assume that ditch culverts will be replaced on average every 50 years.
21
AECOM
7.
District of West Vancouver
Transportation Infrastructure Asset Management Plan
How Much Will It Cost?
The cost of future renewals has been determined using the unit replacement costs outlined in Table 3.1, except with respect to roads and lanes. Based on historical patterns, it is projected that as roads are renewed in West Vancouver 75% of the time they will be pulverized and paved, 20% of the time they will be milled and overlaid, and 5% of the time they will be fully reconstructed. It is assumed that asphalt lanes will be pulverized and paved every 50 years. The unit costs for each of these types of interventions are outlined in Table 7.1 below. Table 7.1
Road Renewal Costs
Road Type Arterial/Collector
Local/Lane
Renewal Methodology Full reconstruct Pulverize and pave Mill and overlay Full reconstruct Pulverize and pave Mill and overlay
Unit Cost $70 $55 $25 $70 $45 $25
The costs associated with bridge renewal were derived from the Bridge Infrastructure Long Term Plan prepared by the MMM Group dated February 1, 2012. A copy of this plan can be found in Appendix D. This financial forecast only considers the cost to renew assets and not to perform regular maintenance such as crack sealing, painting or cleaning. Since the District of West Vancouver does not plan to renew their ditches, gravel lanes or gardens but only maintain them there are no costs for these assets considered within this financial forecast. Not only will West Vancouver have to renew its existing asset inventory but it will have to renew assets that are added to its inventory in the future. Examples of future assets that the District is anticipating are: Transportation infrastructure associated with future development such as Rodgers Creek; and New sidewalks that are added to facilitate pedestrian mobility. The land north of the Upper Levels Highway West between Cypress Mountain and Horseshoe Bay will continue to develop over the coming years. In September 2008 the District of West Vancouver approved a development plan for the Rodgers Creek area, which encompasses approximately 215 acres between Marr Creek and Cave Creek West above the Upper Levels Highway and below the 1200 foot contour. Although the District of West Vancouver will not need to pay for the initial construction of the infrastructure within the Rodgers Creek development, it will take ownership of these assets and be responsible for their renewal. Therefore the cost of the renewal of the major infrastructure items associated with this development; namely roads and bridges, have been included in our financial forecast. Based on the Rodgers Creek Area Development Plan, the following assumptions about the Rodgers Creek development were made for this financial forecast: Development would be completed by 2020; A total of 215 acres would be developed; 55% of the area would be parkland; 20% of the area would be roadway; The average street width would be 8 metres; and Major bridges such as the Rodgers Creek Bridge have already been included in the asset inventory.
22
AECOM
District of West Vancouver
Transportation Infrastructure Asset Management Plan
Each year West Vancouver constructs new sidewalks to improve accessibility within West Vancouver. The Safe Routes to School Program calls for sidewalks in proximity to schools, and West Vancouver’s Strategic Transportation Plan calls for sidewalks on both sides of arterial roads and on one side of collector and local roads. As part of this financial forecast it has been assumed that the inventory of sidewalks increases by 2 km (or 3000 m2) each year until all arterial roads have sidewalks on both sides and all collector/local roads have sidewalks on one side. The renewal costs for all transportation related infrastructure included in this study are shown in Figure 7.1. The average renewal costs for all of West Vancouver’s Transportation Infrastructure over 100 years is $4.9 million per year. Currently West Vancouver spends approximately $3.5 million per year on the renewal of its entire transportation infrastructure (i.e. roads, bridges and other transportation infrastructure). In Figures 7.1 and 7.3 “roads” includes the roadway pavement, curbs and sidewalks. Figure 7.1
Capital Renewal Forecast for All of West Vancouver’s Transportation Infrastructure
$11,000,000 Bridges $10,000,000
Other Transportation Infrastructure Roads
$9,000,000 $8,000,000
Rodgers Creek Development Budget 100 year average
$7,000,000 $6,000,000 $5,000,000 $4,000,000 $3,000,000 $2,000,000 $1,000,000 $0 2010 2015 2020 2025 2030 2035 2040 2045 2050 2055 2060 2065 2070 2075 2080 2085 2090 2095 2100 2105 Note: Other Transportation Infrastructure includes Traffic signals, Pedestrian signals, Street lights (Ornamental Lamps), Signs, Sign posts, Retaining walls, Dock, Special Cross Walks, Barriers, Roundabouts and Traffic Circles
The renewal costs for West Vancouver’s bridges that are owned and maintained by the Engineering and Transportation Department are shown in Figure 7.2. The costs will vary greatly from year to year, based on the timing of bridge replacements but the average annual renewal cost is estimated at $330,000.
23
AECOM
District of West Vancouver
Figure 7.2
Transportation Infrastructure Asset Management Plan
Capital Renewal Forecast for West Vancouver’s Bridges
$1,800,000
$1,500,000
Bridges 100 Year Average
$1,200,000
$900,000
$600,000
$300,000
$0 2010 2015 2020 2025 2030 2035 2040 2045 2050 2055 2060 2065 2070 2075 2080 2085 2090 2095 2100 2105
The first bridge that requires replacement in the next five years is the Nelson Canyon Bridge. As the Nelson Canyon bridge is no longer part of the road network and is only used for pedestrians and cyclists as part of West Vancouver’s trail system, this bridge may be transferred to the District’s Park Department. The second bridge that will likely need replacement (in approximately ten years time) is the Keith Road Bridge over Brothers Creek due to its age and seismic risk.
24
AECOM
District of West Vancouver
Transportation Infrastructure Asset Management Plan
Figure 7.3 shows the capital renewal costs for West Vancouver’s roads (including curbs and sidewalks). The estimated capital renewal requirements for these assets are on average $3.9 million per year over 100 years.
Figure 7.3
Capital Renewal Forecast for Roads (Bridges and other infrastructure removed)
$10,000,000 Rodgers Creek Development $9,000,000 $8,000,000
Roads 100 Year Average
$7,000,000 $6,000,000 $5,000,000 $4,000,000 $3,000,000 $2,000,000 $1,000,000 $0 2010 2015 2020 2025 2030 2035 2040 2045 2050 2055 2060 2065 2070 2075 2080 2085 2090 2095 2100 2105
25
AECOM
District of West Vancouver
Transportation Infrastructure Asset Management Plan
Figure 7.4 shows the capital renewal requirements for West Vancouver’s road related infrastructure such as traffic signals, pedestrian signals, street lights (Ornamental Lamps), signs, sign posts, retaining walls, dock, special crosswalks, barriers, ditch culverts, roundabouts and traffic circles The estimated capital renewal requirements for these assets are on average $600,000 per year over 100 years. Figure 7.4
Capital Renewal Forecast for Road Related Infrastructure (bridges and roads removed)
$1,400,000
Other Transportation Infrastructure
100 Year Average
$1,200,000
$1,000,000
$800,000
$600,000
$400,000
$200,000
$0 2010 2015 2020 2025 2030 2035 2040 2045 2050 2055 2060 2065 2070 2075 2080 2085 2090 2095 2100 2105
26
AECOM
8.
District of West Vancouver
Transportation Infrastructure Asset Management Plan
Funding Strategies: “How will we pay for it?”
This study has estimated the total reinvestment requirements for West Vancouver’s transportation related infrastructure over the next 100 years. It shows when the District can expect waves of high capital expenditures, thereby helping West Vancouver to better determine revenue needs and to optimise O&M practices to extend the life of existing assets.
8.1
Current Funding Levels
West Vancouver spends on average approximately $3.5 million each year on the renewal of its existing transportation infrastructure as well as the construction of new curbs, sidewalks and traffic calming measures. Figure 8.1 shows how the anticipated renewal requirements compare with the existing renewal budget levels over the next 25 years. The infrastructure gap measures the difference between the required capital renewal budget and the available capital renewal budget. Assuming that the transportation capital renewal budget is only raised to keep up with inflation, the District will not realise an infrastructure gap until 2020. By 2035 (i.e. in 25 years) the infrastructure gap is projected to be $18 million. Figure 8.1
Renewal Requirements vs. Existing Budget Levels – 25 Year View
$120,000,000
$100,000,000 Total Capital Requirements for all types of Transportation Infrastructure $80,000,000
Total Budget for Transportation
Infrastructure Gap $60,000,000
$40,000,000
$20,000,000
$0 2010
2012
2014
2016
2018
2020
2022
2024
2026
2028
2030
2032
2034
Note: This chart includes all renewal costs related to Bridges, Roads, Lanes, Cul‐de‐sacs, Sidewalks, Curbs, Traffic signals, Pedestrian signals, Street lights (Ornamental Lamps), Signs, Sign posts, Retaining walls, Dock, Special Cross Walks, Barriers, Ditch Culverts, Roundabouts and Traffic Circles.
27
AECOM
District of West Vancouver
Transportation Infrastructure Asset Management Plan
Figure 8.2 shows the cumulative infrastructure gap over the next 100 years if the transportation capital renewal budget is only raised to keep up with inflation. By 2109 (i.e. in 100 years) the infrastructure gap is projected to be $135 million.
Figure 8.2
Renewal Requirements vs. Existing Budget Levels – 100 Year View
$600,000,000
$500,000,000 Total Capital Requirements for all types of Transportation Infrastructure $400,000,000
Cumulative Transportation Budget
$300,000,000
Infrastructure Gap
$200,000,000
$100,000,000
$0 2010 2015 2020 2025 2030 2035 2040 2045 2050 2055 2060 2065 2070 2075 2080 2085 2090 2095 2100 2105 Note: This chart includes all renewal costs related to Bridges, Roads, Lanes, Cul‐de‐sacs, Sidewalks, Curbs, Traffic signals, Pedestrian signals, Street lights (Ornamental Lamps), Signs, Sign posts, Retaining walls, Dock, Special Cross Walks, Barriers, Ditch Culverts, Roundabouts and Traffic Circles.
8.2
Future Strategies
It is estimated that the District will have sufficient funding until 2020, however, the District can take measures now to reduce the infrastructure gap that is projected beyond 2020. For example, the District can continue to extend the life of its assets through a proactive inspection, maintenance and rehabilitation program and reduce capital renewal costs by coordinating capital works wherever possible. The District may also choose to work with the electorate to determine an acceptable level of service for pavement condition and other transportation related assets. If West Vancouver was able to reduce its asset renewal costs by 10% (through preventive maintenance and by coordinating capital works) then it would cut its projected infrastructure gap in half. The District could then address the remaining infrastructure gap, as shown in Figure 8.3, by increasing its Transportation Renewal budget by 5% each year for five years between 2022 and 2026.
28
AECOM
District of West Vancouver
Figure 8.3
Transportation Infrastructure Asset Management Plan
Eliminating the Infrastructure Gap through Reduced Costs and Increased Budget
$600,000,000
$500,000,000
Total Capital Requirements for all types of Transportation Infrastructure Total Capital Requirements if 10% savings in renewal costs are achieved
$400,000,000
Total Budget for Transportation Infrastructure Total budget + 5% increase annually 2022‐2026
$300,000,000
$200,000,000
$100,000,000
$0 2010 2015 2020 2025 2030 2035 2040 2045 2050 2055 2060 2065 2070 2075 2080 2085 2090 2095 2100 2105 Note: This chart includes all renewal costs related to Bridges, Roads, Lanes, Cul‐de‐sac, Sidewalks, Curbs, Traffic signals, Pedestrian signals, Street lights (Ornamental Lamps), Signs, Sign posts, Retaining walls, Dock, Special Cross Walks, Barriers, Ditch Culverts, Roundabouts and Traffic Circles.
The scenario shown in Figure 8.3 illustrates the benefit of reducing lifecycle costs and provides a potential funding strategy that satisfies theoretical asset replacement requirements. The replacement scenarios in this study are theoretical; many factors will impact the actual rate of infrastructure renewal. Examples of some of these factors include assessments of risk or criticality, resource levelling, opportunistic cost sharing, short term affordability, and future reserve policies. These factors will be as important in the development of future capital financial planning as the physical replacement requirements identified by this theoretical replacement scenario. Effective communication is critical to educate and engage stakeholders to assist in meeting the upcoming challenges associated with the management of the District’s infrastructure. West Vancouver’s Engineering and Transportation Department recently informed Council and the public on the cost of maintaining the District’s Water, Sanitary and Stormwater infrastructure. The information from this report will help the District continue that education process with respect to its transportation infrastructure. The District should take steps now to improve its database with respect to the inventory and condition of its transportation infrastructure. Areas with the greatest level of uncertainty are the inventory and condition of the District’s retaining walls, transit shelters, bus pads, signs and signposts.
29
AECOM
8.3
District of West Vancouver
Transportation Infrastructure Asset Management Plan
Infrastructure Funding Mechanisms
Effective infrastructure renewal funding:
Allocates costs to those benefiting from the service thus increasing equity in provision of services;
Supports accountability by clear allocation of funds; Incorporates life cycle costs of infrastructure (i.e. depreciation, O&M and renewal); Provides reliable, predictable, dedicated funding to support multi-year infrastructure investment strategies; and Supports demand management efforts.
The funding of bridge replacements is particularly challenging as the costs are large but infrequent. If the District developed a designated infrastructure reserve fund (similar to a capital reserve fund) that collected renewal funding each year then today’s bridge users would contribute to the future renewal of that bridge, rather than encumbering future generations with the entire cost of renewing that asset. A designated infrastructure reserve fund would also provide reliable, predictable and dedicated funding. However, managing a long-term fund over several Council terms can be challenging, as different Councils may make changes to the fund and there may not be the political will to contribute to a project that is 10 to 20 years in the future. In addition, funds may get “lost” in the general municipal funds and not be used for their intended use. It is therefore recommended that the District begin discussions with Engineering staff, financial staff and Council to develop policy with respect to how it wishes to finance large but infrequent infrastructure projects such as the replacement of a bridge. Developing policy around infrastructure financing is a useful tool for institutionalizing asset management within a municipality. Should West Vancouver want to investigate new funding mechanisms we recommend that the District refer to the National Guide to Sustainable Municipal Infrastructure’s best practice titled “Alternative Funding Mechanisms”. The National Guide to Sustainable Municipal Infrastructure: Innovations and Best Practices is a compendium of technical best practices for addressing infrastructure issues. The best practice on alternative funding mechanisms describes eight methods for developing innovative funding sources to meet infrastructure needs, or to align costs with benefits to users. The eight alternative funding mechanisms described are Special Levies, Development Fees, Utility Models, Sponsorships, Innovative Transportation Revenues and Incentives, Government Service Partnerships, Funding Partnerships, and Strategic Funding Allocations.
8.4
Next Steps
Given that West Vancouver’s current budget levels are only sustainable until 2020, we recommend that the District begin now to take the following actions:
Review its pavement management system to help identify a true localized needs‐based assessment which will be based on the measured/observed results from the road data collection; Consult with its Council and residents to determine acceptable level of service associated with its transportation infrastructure; Fill in data gaps with respect to the inventory and condition of its transportation infrastructure; Develop policy with respect to financing large but infrequent infrastructure projects such as the replacement of a bridge; Review its asset maintenance practices to ensure that its assets are inspected and maintained in order to reduce their life‐cycle costs while providing the necessary levels of service; and Maintain asset information so that it is readily available and facilitates the optimization of West Vancouver’s assets.
30
AECOM
9.
District of West Vancouver
Transportation Infrastructure Asset Management Plan
Adopting Asset Management Practices
Good asset management planning seeks to capitalize on two means of cost savings: preventative maintenance and effective asset renewal planning. This will result in the optimization of lifecycle costs for individual assets as depicted in Figure 9.1.
Asset Renewal/Replacement Cost
Figure 9.1
Means of Achieving Savings through Asset Management
Optimized Asset Management Status Quo
Lower the Cost
Extend the Horizon
Time
By continuing with its preventative maintenance program, West Vancouver can attain, and hopefully extend, the expected service life of its infrastructure, and will benefit accordingly. For instance, crack sealing will slow down the deterioration of road pavement and extend its service life. We recommend that West Vancouver periodically review its preventative maintenance program to ensure that it is gaining maximum benefit from it. A risk based approach will allow West Vancouver to determine the most cost-effective strategy for maintaining an asset based on the consequences of failure. By identifying the most cost effective renewal and/or replacement strategy for each asset and by integrating capital works of different utilities (water, sewer, road etc.) whenever possible, the District will optimise its capital renewal budgets. Together this will have the benefit of lowering the actual cost of the renewal program. The efficient integration of capital works of different utilities requires coordinating the capital renewal programs for the water, sanitary, storm and road systems. Accomplishing this requires developing procedures and communication channels, which can be facilitated but not replaced by information management systems. Effectively managing and communicating asset information as outlined in the District of West Vancouver’s Asset Management Information Management Strategy will help West Vancouver optimize transportation asset maintenance and rehabilitation needs.
31
AECOM
District of West Vancouver
Transportation Infrastructure Asset Management Plan
This study has adhered to present day best practices for performing strategic level asset management. A “needsbased” approach has been taken that gives consideration to our current knowledge of asset life spans, and current replacement costs. Consideration has not been given to factors that might either accelerate renewal efforts (e.g. additional financing, resource levelling), or decelerate renewal efforts (e.g. short term affordability). These additional factors will remain for continued public debate, and provide input into the annual rate setting process. Ultimately, a “budget-based” approach to asset management will govern the extent to which West Vancouver will manage assets in a sustainable fashion over the short and long term.
32
AECOM
10.
District of West Vancouver
Transportation Infrastructure Asset Management Plan
Recommendations
This section outlines the six (6) key recommendations that are a result of this study. The recommendations fall under two main categories: Sustainable funding; and Improving asset information and optimizing renewal budgets.
10.1
Sustainable Funding
Without sustainable funding an organisation cannot maintain a given level of service from its assets. Effective communication of this study’s results to Council and the general public is critical to obtaining sustainable infrastructure funding. Recommendation #1 The District is recommended to develop policy with respect to financing large but infrequent infrastructure projects such as the replacement of a bridge. Recommendation #2 The District of West Vancouver should develop a plan to communicate transportation infrastructure renewal needs to the public, and to determine acceptable levels of service and resulting funding requirements. Recommendation #3 West Vancouver should maintain and update the CAP model (or similar tool) to periodically check that its renewal funding is sufficient to meet its capital renewal needs.
10.2
Improving Asset Information and Optimizing Renewal Budgets
By identifying the most cost effective renewal and/or replacement strategy for each asset and by integrating capital works of different utilities (water, sanitary, stormwater, road etc.) whenever possible, the District will optimise its capital renewal budgets. Together this will have the benefit of lowering the actual cost of the renewal program, but can only be accomplished with sufficient information about the assets. Recommendation #4 The District should coordinate its road capital renewal program with other utilities (water, stormwater and sanitary) to ensure that total costs are minimized. Recommendation #5 The District should ensure that asset inventory and condition information is up-to-date, accurate and readily available. In particular the District needs to update its inventory with respect to its retaining walls, transit shelters, bus pads, signs and signposts. Recommendation #6 The District should regularly inspect and track the condition of its assets. This is the best way to ensure that assets can continue to function as intended and to extend the life of these assets. Specifically the District should review its pavement management system to identify a true localized needs based assessment which will be based on the measured and observed results from the road data collected.
33
AECOM
District of West Vancouver
Transportation Infrastructure Asset Management Plan
APPENDIX A – Transportation Asset Inventory
DISTRICT OF WEST VANCOUVER ASSET EVALUATION STUDY - ASSET INVENTORY Asset Group
Category
Asset Type
Asset Name
Location
Quantity (What do we own?)
2010 Unit Replacement value of current asset
Unit Type
2010 Replacement value of current asset (What is it worth?)
2010 Unit replacement value of future asset
Expected Expected 2010 Replacement Replacement Date in Service Service Life Value (How much year (yrs) will it cost?)
Roads
Roads
Arterial
Various
165,933
m2
$
70 $
11,615,310
$
11,615,310
Roads
Roads
Collector
Various
533,991
m2
$
70 $
37,379,370
$
37,379,370
Roads
Roads
Local
Various
1,318,880
m2
$
70 $
92,321,600
$
92,321,600
Lanes
Lanes
Paved
Various
61,003
m2
$
70 $
4,270,210
$
4,270,210
Lanes
Lanes
Gravel
Various
11,622
m2
$
25 $
Lanes
Lanes
Brick
Various
5,682
m2
$
100 $
568,200
40
$
568,200
Sidewalks
Sidewalks
Asphalt
233
m2
$
35 $
8,155
50
$
8,155
Sidewalks
Sidewalks
Concrete
29712
m2
$
65 $
1,931,280
50
$
1,931,280
Curbs
Curbs
Asphalt
9662
m
$
30 $
289,860
50
$
289,860
Curbs
Curbs
Concrete
268770
m
$
60 $
16,126,200
50
$
16,126,200
Traffic signals
Traffic and Ped Signals
Flashing Beacons
1
unit
$
40,000 $
40,000
$
40,000
Traffic signals Pedestrian signals
Traffic and Ped Signals
Full
10
unit
$
250,000 $
2,500,000
$
2,500,000
Traffic and Ped Signals
10
unit
$
150,000 $
1,500,000
$
1,500,000
Street lights
Street lights
1096
unit
$
8,000 $
8,768,000
$
8,768,000
Gardens
Other
2687
m2
$
150 $
Signs
Signs and posts
7588
unit
$
65 $
493,220
10
$
493,220
Sign posts
Signs and posts
4582
unit
$
107 $
490,274
40
$
490,274
Ditches (open)
Other
ditches open
57417
m
$
25 $
1,435,425
Ditch culverts
Other
culverts
5122
m
$
500 $
2,561,000 $
-
50
$
2,561,000
Retaining wall
Retaining wall
Concrete
Keith Rd 800-900 bl.
695
m2
$
600 $
417,000 $
1,200
Retaining wall
Retaining wall
Dry Stacked Rock
Marine Dr - various
6796
m2
$
200 $
Retaining wall
Retaining wall
Dry Stacked Rock
6200 blk Marine Dr.
99
m2
$
Retaining wall
Retaining wall
Dry Stacked Rock
Eagle Harbour Rd @ Eagle Harbour Beach
123
m2
Retaining wall
Retaining wall
Dry Stacked Rock
6200 blk. Wellington
258
Retaining wall
Retaining wall
Allan Block
Marine Dr 11th-13th
Retaining wall
Retaining wall
Allan Block
Retaining wall
Retaining wall
Retaining wall
Retaining wall
Dock Special Cross Walks
Other
290,550 $
403,050 $
50 -
$
35 -
$
-
-
2045
1970
75
$
834,000
1,359,200
2090
1940
150
$
1,359,200
200 $
19,800
2100
1950
150
$
19,800
$
200 $
24,600
2100
1950
150
$
24,600
m2
$
200 $
51,600
2110
1960
150
$
51,600
427
m2
$
650 $
277,550
2109
2009
100
$
277,550
Sinclair Ct. (east side)
80
m2
$
650 $
52,000
2095
1995
100
$
52,000
Allan Block
Chippendale Bridge over Marr Creek
360
m2
$
-
$
-
2104
2004
100
$
-
Reco
Almondel Bridge over Cypress Creek
468
m2
$
-
$
-
2109
2009
100
$
-
1
unit
$
500,000 $
500,000
2010
1985
25
$
500,000
Other
2
unit
$
50,000 $
100,000
25
$
100,000
Barriers
Other
1450
unit
$
110 $
159,500
50
$
159,500
Bridges
Bridges
400 Block Keith Road - Brothers Creek
1
unit
$
2,571,979 $
2,571,979 $
2,571,979
2024
1952
72
$
2,571,979
Bridges
Bridges
500 Block Inglewood - Brothers Creek
1
unit
$
1,294,339 $
1,294,339 $
1,294,339
2094
1986
108
$
1,294,339
Bridges
Bridges
3900 Block Marine Drive - Sandy Cove
1
unit
$
2,141,520 $
2,141,520 $
2,141,520
2034
1939
95
$
2,141,520
Bridges
Bridges
4300 Block Marine Drive - Cypress Creek
1
unit
$
2,908,908 $
2,908,908 $
1,107,000
2039
1940
99
$
1,107,000
1
unit
$
3,863,428 $
3,863,428 $
2,000,000
2014
1956
58
$
2,000,000 12/20/2012
Eagle IslandDock
Bridges Bridges Nelson Canyon - Nelson Creek P:\60149252\02-Design\CALC_2012_09_26 DWV_transportation_inventory
Page 1 of 2
DISTRICT OF WEST VANCOUVER ASSET EVALUATION STUDY - ASSET INVENTORY Bridges
Bridges
2000 Block Esquimalt Ave. - Lawson Creek
1
unit
$
368,299
$
-
2079
1991
88
$
Bridges
Bridges
300 Block Keith Place - Brothers Creek
1
unit
$
Bridges
Bridges
1100 Block Millstream Rd. - Brothers Creek
1
unit
Bridges
Bridges
McCrady - Eagle Lake - Cypress Creek
1
Bridges
Bridges
1800 Block Sinclair Court - Lawson Creek
Bridges
Bridges
Bridges
-
1,652,917 $
1,652,917 $
1,652,917
2089
1991
98
$
1,652,917
$
489,321 $
489,321 $
489,321
2069
1964
105
$
489,321
unit
$
533,889 $
533,889 $
533,889
2054
1984
70
$
533,889
1
unit
$
680,568 $
680,568 $
680,568
2094
1995
99
$
680,568
Whitby - Vinson Creek
1
unit
$
4,974,851 $
4,974,851 $
4,974,851
2104
2002
102
$
4,974,851
Bridges
Chippendale/MacDonald
1
unit
$
2,175,600 $
2,175,600 $
2,175,600
2082
2007
75
$
2,175,600
Bridges
Bridges
Chippendale/Marr
1
unit
$
2,797,200 $
2,797,200 $
2,100,000
2082
2007
75
$
2,100,000
Bridges
Bridges
Rodgers
1
unit
$
2,400,000 $
2,400,000 $
2,400,000
2085
2010
75
$
2,400,000
Bridges
Bridges
Pipe
1
unit
$
1,400,000 $
1,400,000 $
1,400,000
2112
2012
100
$
1,400,000
Bridges
Bridges
Almondel
1
unit
$
3,100,000 $
3,100,000 $
3,100,000
2084
2009
75
$
3,100,000
Roundabout
Roundabouts and Circles
Marine Drive/Nelson/Rosebery
1
unit
$
500,000 $
500,000
2052
2002
50
$
500,000
Roundabout
Roundabouts and Circles
Fulton/21st
1
unit
$
500,000 $
500,000
2058
2008
50
$
500,000
Roundabout
Roundabouts and Circles
Taylor Way/Southborough/Stevens
1
unit
$
500,000 $
500,000
2054
2004
50
$
500,000
Traffic Circle
Roundabouts and Circles
Chelsea Court/Chairlift Road
1
unit
$
250,000 $
250,000
2057
2007
50
$
250,000
Traffic Circle
Roundabouts and Circles
Chairlift Road/Skilift Place/Skilift Road
1
unit
$
250,000 $
250,000
2058
2008
50
$
250,000
Traffic Circle
Roundabouts and Circles
Keith Road/Birchfield lace/Caulfield Drive
1
unit
$
250,000 $
250,000
2057
2007
50
$
250,000
Traffic Circle
Roundabouts and Circles
Westmount Road/Rockview Place
1
unit
$
250,000 $
250,000
2059
2009
50
$
250,000
Traffic Circle
Roundabouts and Circles
Mathers Ave/30th Street
1
unit
$
250,000 $
250,000
2056
2006
50
$
250,000
$
P:\60149252\02-Design\CALC_2012_09_26 DWV_transportation_inventory
Page 2 of 2
-
12/20/2012
AECOM
District of West Vancouver
Transportation Infrastructure Asset Management Plan
APPENDIX B - Project Methodology and Sources of Data
AECOM
District of West Vancouver
Transportation Infrastructure Asset Management Plan
Roads
Lanes
Sidewalks/ Curbs
What do we own? (Sect. 2)
Taken from DWV#334767-v1ASSET_PROJECT__ROAD_INVENTOR Y.XLS and add newly constructed roads
What is it worth? (Sect. 3)
Based on standard unit costs to be agreed upon with DWV.
Taken from DWV-#334767v1ASSET_PROJE CT__ROAD_INVEN TORY.XLS Based on standard unit costs to be agreed upon with DWV.
Taken from DWV-#334767v1ASSET_PROJE CT__ROAD_INVEN TORY.XLS Based on standard unit costs to be agreed upon with DWV.
What is its condition? (Sect. 4)
Based on PQI from pavement management system (PMS) Crack sealing, mill & overlay pulverize and pave, regular inspections and total reconstruction Service Lives: Arterial – 15 years Collector – 20 years Local – 25-50 years
Unknown
Based on PQI from pavement management system (PMS) Inspections + replacement at the end of its service life.
What needs to be done? (Sect. 5) When do we need to do it? (Sect. 6)
How much will it cost? (Sect. 7)
Maintenance, inspections + replacement at the end of its service life. Brick renewed every 40 years. Asphalt renewed every 50 years. Gravel lanes to be maintained as needed.
Traffic Signals/ St. Lights/ Gardens/ Taken from DWV#334767-v1ASSET_PROJEC T__ROAD_INVENT ORY.XLS
Signs
Sign posts
Bridges
Ditches
Taken from DWV#334767-v1ASSET_PROJEC T__ROAD_INVENT ORY.XLS
Can be found within DWV’s BMS (Planet GIS)
Taken from GIS inventory
Based on standard unit costs to be agreed upon with DWV.
Based on standard unit costs to be agreed upon with DWV.
Taken from DWV#334767-v1ASSET_PROJ ECT__ROAD_INVE NTORY.XLS Based on standard unit costs to be agreed upon with DWV.
Age based
Based on staff inspection poor/medium/goo d Regular maintenance + replacement at the end of its service life. Assume average 10 year lifespan so that 10% replaced each year
Take from DWV#334767-v1ASSET_PROJECT_ _ROAD_INVENTOR Y.XLS (add inflation to 2008 estimate) Can be found within DWV’s BMS (Planet GIS) Bridge Infrastructure Long Term Plan by MMM Group dated February 1, 2012.
Regular maintenance + replacement at the end of its service life. Expected Traffic signals service life = 50 replaced after 15 years years and street lights replaced after 35 years. Gardens to be maintained as needed. CAP model output
Unknown – use age as proxy Regular maintenance + replacement at the end of its service life. Assume a 40 year lifespan so that 2.5% of the posts are replaced each year.
Bridge Infrastructure Long Term Plan by MMM Group dated February 1, 2012.
Bridge Infrastructure Long Term Plan
Roundabouts/ Traffic Circles/ Crosswalks From Emails from DWV staff
Dock/Retaining Walls/Barriers
Apply unit construction cost ($50/m – open channel $500/m for culvert) Operable working condition
From Emails from DWV staff
Dock – DWV estimate. AECOM unit cost for walls and barriers
Unknown – use age as proxy
Unknown – use age as proxy
Maintenance only for open ditch + replacement of culvert Culvert replaced every 50 years.
Regular maintenance + replacement at the end of its service life. At end of service life (see Section 6)
Regular maintenance + replacement at the end of its service life.
DWV-#192274-v1MARINE_DRIVE_BARR IER_DATA_SHEET.XL S and DWV-#389312v1-Asset_Project__Retaining_walls.DOC
At end of service life (see Section 6)
CAP model output
AECOM
District of West Vancouver
Transportation Infrastructure Asset Management Plan
APPENDIX C - Illustrative Examples of West Vancouver Roadways with Different PQI
Super ID: SS00003420 Section ID:0870
2100 Block Bellevue
PQI = 73
BELLEVUE AVENUE 21st STREET – 22nd STREET
CRACK SEALANT
Super ID: SS00005050 Section ID:2240
PQI = 70
17th STREET FULTON AVE – GORDON AVE
828 17th Street
RUTTING CRACKING
825 17th Street
RUTTING CRACKING
Super ID: SS00003425 Section ID:0952
1300 Bellevue Ave
PQI = 68
BELLEVUE AVENUE AMBLESIDE LANE – AMBLESIDE LANE
LONGITUDINAL CRACKING
Super ID: SS00000180 Section ID:0590
2100 Block Marine Drive
PQI = 68
MARINE DRIVE 21st STREET – 22nd STREET
PATCHING MANHOLE
Super ID: SS00003425 Section ID:0920
1600 Block Bellevue
PQI = 63
BELLEVUE AVENUE 16th STREET – 17th STREET
CRACK SEALANT
Super ID: SS00006275 Section ID: 8960
433 Eastcot Rd
433 Eastcot Rd
PQI = 61
EASTCOT ROAD HADDEN DR- HADDEN DR
LONGITUDINAL CRACKING
PATCHING RAVELING
Super ID: SS00006275 Section ID: 8960
PQI = 61
EASTCOT ROAD HADDEN DR- HADDEN DR
480 Eastcot Rd
LONGITUDINAL CRACKING
483 Eastcot Rd
ALLIGATOR CRACKING POTHOLE
Super ID: SS00000190 Section ID:0650
PQI = 59
MARINE DRIVE 15th STREET – 16th STREET
1500 Marine Drive
CORRUGATIONS
1505 Marine Drive
PATCHES, CRACKING RUTTING
Super ID: SS00000190 Section ID:0650
PQI = 59
MARINE DRIVE 15th STREET – 16th STREET
1500 Block Marine Drive
MANHOLE
15th Street @ Marine Drive
MANHOLE
Super ID: SS00000200 Section ID:0660
PQI = 57
MARINE DRIVE 14th STREET – 15th STREET
1400 Block Marine Drive
CORRUGATIONS
1400 Block Marine Drive
PITTING IN PARKING LANES
Super ID: SS00000200 Section ID:0660
1425 Marine Drive (Bus Stop)
PQI = 57
MARINE DRIVE 14th STREET – 15th STREET
CORRUGATIONS
Super ID: SS00006270 Section ID: 8970
PQI = 47
EASTCOT ROAD HADDEN DR- BURHILL RD
510 Eastcot Rd
ALLIGATOR CRACKING RUTTING
549 Eastcot Rd
ALLIGATOR CRACKING RUTTING
Super ID: SS00003360 Section ID:0780
2588 Bellevue (South of Railway)
2604 Bellevue (South of Railway)
PQI = 46
BELLEVUE AVENUE 25th STREET – 27th STREET
PATCHING, RAVELLING SPALLING
CRACKING
Super ID: SS00003360 Section ID:0780
2636 Bellevue (South of Railway)
2678 Bellevue (South of Railway)
PQI = 46
BELLEVUE AVENUE 25th STREET – 27th STREET
SPALLING
CRACKING PATCHING
Super ID: SS00003360 Section ID:0780
2690 Bellevue (South of Railway)
PQI = 46
BELLEVUE AVENUE 25th STREET – 27th STREET
CRACKING
Super ID: SS00006270 Section ID:8980
PQI=42
EASTCOT ROAD BURHILL RD - BURHILL RD
537 Eastcot Rd
ALLIGATOR CRACKING RUTTING
550 Eastcot Rd
ALLIGATOR CRACKING RUTTING
Super ID: SS00004090 Section ID:2310
1366 Kings Ave
1366 Kings Ave
PQI = 35
KINGS AVE 13th – 14th STREET
PATCHES, CRACKING RAVELLING
CRACKING RUTTING
Super ID: SS00006270 Section ID:8990
PQI = 34
EASTCOT ROAD BURHILL RD – MATHERS AVE
566 Eastcot Rd
ALLIGATOR CRACKING PATCHING
563 Eastcot Rd
GENERAL ROAD CONDITION BURHILL RD – MATHERS AVE
Super ID: SS00005130 Section ID:4430, 4420
PQI = 27
QUEENS AVE 21ST – 22nd - QUEENS AVE
2170 Queens Ave
PATCHES, RUTTING ALLIGATOR CRACKING
2100 Block Queens Ave
PATCHES, SPALLING ALLIGATOR CRACKING
Super ID: SS00005130 Section ID:4430, 4420
2100 Block Queens Ave
PQI = 27
QUEENS AVE 21ST – 22nd - QUEENS AVE
GENERAL CONDITION
AECOM
District of West Vancouver
Transportation Infrastructure Asset Management Plan
APPENDIX D – Bridge Infrastructure Long Term Plan
February 1st, 2012 File: 50-11015 Mr. John McMahon Manager, Roads and Transportation District of West Vancouver 3755 Cypress Bowl Road West Vancouver, BC V7S 3E7 Subject: Bridge Infrastructure Long Term Plan - FINAL
General: MMM has been retained by the District of West Vancouver to prepare a long term maintenance plan for the District’s bridge network. Please find included with this report a table outlining the expected costs for maintenance, rehabilitation and replacement of the District’s bridges for the upcoming 100 year forecasted maintenance period. It is understood that this information will be used to assist with estimation of future and long-term budgeting requirements for management of the District’s bridge infrastructure. The intent of the plan is to provide a high level estimate of the long term expenditures that can be expected in order to maintain the District’s bridge network. The plan has been prepared based on recently acquired visual inspection data, typical accepted rates for deterioration of common materials and typical life expectancies of bridge elements. Without detailed material testing and assessment, estimating the remaining life of structural components is to be considered an approximation only. Long Term Maintenance Plan: The attached forecast should be considered as representative of estimated costs within the 5 year period following the most recent bridge inspections completed in 2011. The validity of the plan for future years requires that the results therein are verified and updated in accordance with recommendations provided in future bridge inspection assignments. It should be noted that the predictions of bridge condition and deterioration beyond approximately 30 years can only be based on broad assumptions of typical expected component life under regular observed current traffic and cannot be based on any sound engineering or scientific principles.
There are numerous factors affecting the service life of a bridge structure and the expected longevity of a particular component of the bridge. Some of these variables include:
Environmental variables such as climate, relative humidity and water levels, Construction practices, quality of construction and use of inferior or defective materials, Service variables including level of service, traffic volumes, and truck traffic usage, Maintenance issues such as regular upkeep and attention to mitigation of defects affecting bridge service life, Change in network, such as the addition of new bridges.
Maintenance Plan Development: The remaining service life of each bridge has been reviewed based on the date of construction, the anticipated design life and its present condition. Capital Maintenance Items: Unit rates and costs for complete structure replacement as well as component replacement have been estimated for each structure based on present day construction cost estimates. These items have been separated from the routine annual costs for each structure for clarity. Wearing Surface: The most heavily used component of a bridge is normally the wearing surface as it experiences abrasion and wear from each vehicle that passes. The majority of the District’s bridges are asphalt surfaced. Due to the fact that asphalt surfacing is less durable than concrete, asphalt wearing surfaces generally have a shorter replacement return period. As part of the maintenance plan it has been estimated that replacement of asphalted bridge wearing surfaces will be carried out at 20 to 25 year intervals. Resurfacing with asphalt also includes installation of a waterproofing membrane to the underlying concrete deck surface. This practice assists to prolong the service life and serviceable condition of the bridge deck. Waterproofing membranes are typically not applied to timber decks. Bridge Deck: In the absence of a wearing surface, the bridge deck itself receives the traffic wear. It is possible to replace the deck of a bridge in its entirety or in part as part of a capital maintenance item. Concrete bridge decks are assumed to require replacement at 75 year intervals for asphalt-surfaced decks and 50 years for unsurfaced concrete decks. For unsurfaced concrete bridge decks, allowance in costing has been made for performance of partial depth concrete overlay repairs rather than complete deck replacement. The replacement period for a timber deck is more dependent on the traffic usage and environmental conditions at the bridge than that of concrete decks. For the only bridge in the
2
District’s inventory with a timber deck (McCrady Road at Cypress Creek), it is estimated that the bridge deck members, including floor beams, will require replacement at 25 year intervals. Crack Sealing: Crack sealing has been specified for select bridges in order to prolong the service life of the aging unsurfaced bridge decks. The bridges where crack sealing is prescribed are currently in a condition where this type of repair is warranted before the forecasted replacement date of the deck or bridge. Bridge Design Life: The design life for a bridge is 75 years as specified in the Canadian Highway Bridge Design Code. The recommended service life of each bridge has been evaluated and adjusted depending on the current condition of the main structural elements of the structure. Generally, it is not uncommon for newer bridges to exceed 100 years of service with proper maintenance, as such this lifespan has been considered for new structures and bridge replacement cycles in this forecast. The design life for culverts has been estimated to be 50 years. Routine Maintenance Items: We have applied a unit rate per square meter of bridge deck area for estimation of routine maintenance funding requirements. Routine maintenance includes bridge maintenance items such as cleaning of bearing seats, sidewalk clearing, power-washing, graffiti removal, expansion joint maintenance, coating touch-up and other annual costs to ensure the bridges remain in serviceable condition. The BC Ministry of Transportation and Infrastructure’s annual budgeting allocation for structures included in their maintenance regimen is $7.78/m2 of bridge deck area. We have included this maintenance unit rate in this assignment. Nelson Canyon Bridge: The future of the Nelson Canyon Bridge is currently undetermined. The bridge has reached the end of its service life as a vehicle bridge and is now restricted to pedestrian use only. The bridge is part of the Trans-Canada Trail system. A large component of the replacement of this bridge will be involved with dismantling and demolition of the existing structure given the height of the pier towers and the fact that the bridge spans a deep gorge. We have assumed that a replacement structure will most likely be limited to pedestrian service. Under these assumptions the forecasted estimated replacement cost for this bridge is $2 Million. British Properties Development: The British Properties ongoing development will result in further bridges being added to the network. For example, Pipe Creek Bridge currently being designed by MMM for the British Properties is scheduled for construction in 2012, with hand over to the District expected sometime after. Because the general details of this structure are known it has been included in the plan. The
3
District should however be cognisant that further structures will be built in the coming years (which at this time are not clearly defined) which will need to be maintained by the District. Summary: Forecasted costs have been presented in the attached charts. The figures illustrate the total combined routine and capital costs on both 5 and 10 year bases. The third chart indicates the general trend of capital funding requirements over the next 100 years. The routine maintenance costs for the District’s bridge network are approximately $175,000 for each five year period. This is approximately $35,000 per year for the five year period. This estimate is for the carrying out of maintenance activities, and does not include costs associated with annual condition inspections. The District may choose to amend this rate as they see suitable. As bridges age and others are replaced, the District may apportion this routine maintenance budget accordingly depending on the condition and maintenance needs of each individual bridge. There is a notable period with significant increased funding needs near the end of the forecasting period when the numerous recently constructed bridges in the British Properties see the end their respective service lives. Realistically these replacements would likely be staggered based on the deterioration progression of each structure over time. We trust that this report meets your budget estimating and funding forecasting requirements at this time. This report is for long range budget estimation purposes only and contains forward looking information that may change over time. Please do not hesitate to contact us should you have any questions or comments concerning this report or any of the information contained herein. Yours very truly, MMM Group Limited
Brian Counihan, P.Eng. Project Engineer, Bridges MMM Group Ltd.
4
DISTRICT OF WEST VANCOUVER BRIDGE INFRASTRUCTURE LONG TERM PLAN General:
Life (years)
Crack sealing of concrete decks:
Replacement Cost $/m2
25
$100
20-25
$150
Deck replacement (including demolition): 1.) Concrete (unsurfaced) 2.) Concrete (surfaced) 3.) Timber (unsurfaced)
40 75 25
$1,500 $1,500 $500
Bridge Design Life (including demolition): Steel and Concrete Routine Maintenance Unit Costs: $7.78/sq. m
100
$3,000 - $6,500
Deck resurfacing (including waterproofing membrane):
Notes:
1.) Clause 1.4.2.3 of CSA S6-06 defines the design life of new structures to be 75 years. The actual service life of a structure is usually much longer. For the purposes of budgeting, the service life of new structures has been assumed to be 100 years from the date of construction. 2.) The expected life of asphalt surfacing on concrete decks is 20 years. 3.) Rates and expected service life estimates used in this analysis are approximate and only serve to obtain orders of magnitude of future maintenance, rehabilitation and replacement costs. 4.) Items included in "Capital" maintenance budgets are major items such as bridge deck replacement, major rehabilitation works and other items listed under Urgency Ratings 1-4. "Routine" maintenance budget items are minor items that can be undertaken by the Municipality. 5.) Forecasted routine maintenance costs are annual costs for the entire 5 year period and are based on a unit rate amount of $7.78 per square meter of deck area.
Bridge Replacement Deck Replacement / Overlay Wearing Surface and Waterproofing Membrane Replacement Crack Sealing of Wearing Surface
Replacement Costs Structure
Deck Area New Deck Posted Load Route Seismic Risk Importance Limit? (m2) Area (m2)
Built
Bridge ($/m2)
Deck ($/m2)
1
Keith Road over Brothers Creek
Very High
Medium
354
354
YES
1952
$5,000
$2,500
2
Inglewood Road over Brothers Creek
Moderate
Medium
198
198
NO
1986
$4,500
$1,100
3
3900 Block Marine Drive at Sandy Cove
Low
High
375
375
NO
1939
$5,000
$1,800
Almondel Bridge
Low
Low
448
448
NO
2008
$5,000
$1,800
5 4300 Block Marine Drive at Cypress Creek
Low
High
164
246
NO
1940
$4,500
$1,100
6
Nelson Canyon Bridge
High
N/A
656
200
N/A
1956
$10,000
$1,000
7
Esquimalt Pedestrian Bridge over Lawson Creek
Low
N/A
64
64
N/A
1991
$3,000
$1,000
8
Keith Place over Brothers Creek
Low
Low
320
320
NO
1991
$4,500
$1,800
9
Millstream Road over Brothers Creek
Low
Low
64
64
YES
1964
$5,000
$1,100
10
McCrady Road over Cypress Creek
Low
Low
135
135
YES
1984
$4,000
$850
11
Sinclair Court over Lawson Creek
Low
Low
133
133
NO
1995
$4,000
$1,100
12 Chippendale Road over McDonald Creek
Low
Low
871
871
NO
2002
$5,000
$1,800
13
Chippendale Road over Marr Creek
Low
Low
314
314
NO
2004
$5,000
$1,800
14
Chippendale Road over W. McDonald Creek
Low
Low
418
418
NO
2005
$1,300
N/A
15
Chippendale Road over Rodgers Creek
Low
Low
371
371
NO
2010
$5,000
$1,800
16
Pipe Creek Bridge
Low
Low
206
206
NO
2012
$5,000
$1,800
4
Estimated Annual Routine Maintenance Costs Estimated Routine Maintenance Costs per 5 Year Period Estimated Capital Costs per 5 Year Period Estimated Routine Maintenance Costs per 10 Year Period Estimated Capital Costs per 10 Year Period
Forecasted Annual Maintenance Costs, Capital Rehabilitation Costs and Replacement Costs
2011
2016
2021
2026
2031
2036
2041
2046
2051
2056
2061
2066
2071
2076
2081
2086
2091
2096
2101
2106
2015
2020
2025
2030
2035
2040
2045
2050
2055
2060
2065
2070
2075
2080
2085
2090
2095
2100
2105
2110
Budget Capital Routine Capital Routine Capital Routine Capital Routine Capital Routine Capital Routine Capital Routine Capital Routine Capital Routine Capital Routine Capital Routine Capital Routine Capital Routine Capital Routine Capital Routine Capital Routine
$105,500 $2,754 $20,900 $1,540 $242,000 $2,918 $1,951 $3,485 $20,350 $1,276
$1,770,000 $2,754 $2,754 $29,700 $1,540 $1,540 $56,250 $2,918 $2,918 $3,485
$1,276 $2,000,000 $1,556 $1,556 $26,740 $6,400 $498 $498 $11,000 $2,490 $2,490 $29,600 $498 $498 $34,800 $1,050 $1,050 $19,900 $13,300 $1,035 $1,035 $31,535 $6,776 $6,776 $15,200 $2,443 $2,443 $32,300 $3,252 $3,252
$2,754
$2,754
$2,754
$1,540
$1,540
$1,540
$2,918
$2,918
$2,918
$1,540 $56,250 $2,918
$2,754
$2,754
$1,540
$1,540
$1,540
$2,918
$2,918
$3,485
$3,485
$3,485
$1,914
$2,918 $67,200 $3,485 $36,900 $1,914
$1,540 $56,250 $2,918
$3,485 $1,107,000 $1,276 $1,276
$3,485
$3,485
$3,485
$1,914
$1,914
$1,914
$1,914
$1,914
$1,556
$1,556
$1,556
$1,556
$1,556
$1,556
$1,556
$1,556
$498
$498
$498
$498
$498
$498
$2,490
$2,490
$498 $576,000 $2,490
$2,490
$2,490
$498
$498
$498
$498
$1,050
$1,050
$1,050
$1,050
$1,035
$1,035
$6,776
$3,485 $1,276
$1,276
$1,556
$1,556
$498
$498
$1,556 $64,000 $498
$2,490
$2,490 $70,400 $498
$2,490
$498 $48,000 $2,490
$498
$498
$498
$1,050
$1,050 $146,300 $1,035
$1,050
$1,050
$2,490 $320,000 $498 $114,750 $1,050
$1,035
$1,035
$1,035
$6,776
$6,776
$6,776
$6,776
$2,443
$2,443
$2,443
$2,443
$1,035 $130,650 $6,776 $47,100 $2,443
$3,252
$3,252
$3,252
$3,252
$2,886
$2,886
$2,886
$2,443 $543,400 $3,252 $37,100 $2,886
$1,603
$1,603
$1,603
$1,603
$2,886 $30,900 $1,603
$36,060
$36,698
$36,698
$36,698
$36,698
$180,302 $180,302 $180,302 $247,400 $2,050,800 $1,107,000
$183,491 $487,850
$183,491 $177,750
$183,491 $636,750
$183,491 $928,800
$1,035
$2,918
$2,443
$1,035 $130,650 $6,776 $47,100 $2,443
$3,252
$3,252
$6,776
$2,886
$2,886
$2,886
$2,886
$3,252 $37,100 $2,886
$1,603
$1,603
$1,603
$1,603
$1,603
$2,886 $30,900 $1,603
$36,060
$36,060
$36,060
$36,060
$36,060
$36,060
$180,302 $180,302 $180,302 $591,776 $2,105,650 $1,909,350
$180,302 $248,150
$360,603 $2,697,426
$2,754
$3,485 $24,600 $1,276
$1,540
$2,754
$53,100 $2,754
$2,754 $29,700 $1,540 $1,540 $1,875,000 $2,918 $2,918 $67,200 $3,485 $3,485
$498 $114,750 $1,050
$2,754
$53,100 $2,754
$360,603 $2,157,500
$360,603 $2,298,200
$363,793 $1,594,850
$366,983 $814,500
$2,754 $217,800 $1,540
$885,000 $2,754
$2,754 $891,000 $1,540
$2,754
$2,918 $806,400 $3,485 $36,900 $1,914
$2,918
$2,918
$1,540 $56,250 $2,918
$3,485
$3,485
$3,485
$1,914
$1,914
$1,914
$1,556 $192,000 $498
$1,556
$1,556
$1,556
$1,556
$1,556
$1,556
$498
$498
$498
$498
$498
$2,490 $9,600 $498 $114,750 $1,050
$2,490
$2,490
$498 $1,440,000 $2,490 $2,490
$2,490
$2,490
$498
$498
$498
$498
$498
$1,050
$498 $540,000 $1,050
$2,490 $9,600 $498
$1,050
$1,050
$1,050
$1,050
$1,035
$1,035
$1,035
$1,035
$1,035
$6,776
$6,776
$6,776
$2,443
$2,443
$2,443
$6,776 $565,200 $2,443
$1,035 $4,355,000 $6,776 $6,776
$1,035
$6,776
$1,035 $1,567,800 $6,776 $6,776
$1,050 $532,000 $1,035
$2,443
$2,443
$2,443
$2,443
$2,443
$3,252
$3,252
$3,252
$3,252
$3,252
$3,252
$3,252
$3,252
$2,886
$2,886
$2,886
$2,886
$3,252 $667,800 $2,886
$2,886
$2,886
$1,603
$1,603
$1,603
$1,603
$1,603
$2,886 $370,800 $1,603
$1,603
$1,603
$6,776 $1,570,000 $2,443 $543,400 $3,252 $1,855,000 $2,886 $1,030,000 $1,603
$36,698
$36,698
$36,698
$36,698
$36,698
$36,698
$36,698
$36,698
$36,698
$183,491 $183,491 $53,100 $1,692,150 $366,983 $981,900
$1,540
$2,754 $1,540
$2,754 $29,700 $1,540
$2,918
$2,918 $2,240,000 $3,485 $3,485 $36,900 $1,914 $1,914
$183,491 $183,491 $183,491 $183,491 $183,491 $183,491 $183,491 $813,450 $1,383,300 $1,558,800 $1,810,800 $1,482,850 $4,391,900 $7,268,100 $366,983 $2,505,600
$366,983 $2,942,100
$366,983 $3,293,650
$366,983 $11,660,000
Forecasted Capital and Routine Maintenance Costs 5 Year Intervals $8,000,000
$7,000,000
$6,000,000
$5,000,000
$4,000,000
5 Year Capital Costs 5 Year Routine Maintenance Costs
$3,000,000
$2,000,000
$1,000,000
$0
Forecasted Capital and Routine Maintenance Costs 10 Year Intervals $14,000,000
$12,000,000
$10,000,000
$8,000,000 10 Year Capital Costs $6,000,000
$4,000,000
$2,000,000
$0
10 Year Routine Maintenance Costs
Forecasted Capital Costs Trend 5 Year Intervals $8,000,000
$7,000,000
$6,000,000
$5,000,000
5 Year Capital Costs
$4,000,000
Trend Line (Polynomial)
$3,000,000
$2,000,000
$1,000,000
$0 2010
2030
2050
2070
2090
2110
2130
AECOM
District of West Vancouver
Transportation Infrastructure Asset Management Plan
Statement of Qualifications and Limitations The attached Report (the “Report”) has been prepared by AECOM Canada Ltd. (“Consultant”) for the benefit of the client (“Client”) in accordance with the agreement between Consultant and Client, including the scope of work detailed therein (the “Agreement”). The information, data, recommendations and conclusions contained in the Report (collectively, the “Information”):
is subject to the scope, schedule, and other constraints and limitations in the Agreement and the qualifications contained in the Report (the “Limitations”) represents Consultant’s professional judgement in light of the Limitations and industry standards for the preparation of similar reports may be based on information provided to Consultant which has not been independently verified has not been updated since the date of issuance of the Report and its accuracy is limited to the time period and circumstances in which it was collected, processed, made or issued must be read as a whole and sections thereof should not be read out of such context was prepared for the specific purposes described in the Report and the Agreement in the case of subsurface, environmental or geotechnical conditions, may be based on limited testing and on the assumption that such conditions are uniform and not variable either geographically or over time
Consultant shall be entitled to rely upon the accuracy and completeness of information that was provided to it and has no obligation to update such information. Consultant accepts no responsibility for any events or circumstances that may have occurred since the date on which the Report was prepared and, in the case of subsurface, environmental or geotechnical conditions, is not responsible for any variability in such conditions, geographically or over time. Consultant agrees that the Report represents its professional judgement as described above and that the Information has been prepared for the specific purpose and use described in the Report and the Agreement, but Consultant makes no other representations, or any guarantees or warranties whatsoever, whether express or implied, with respect to the Report, the Information or any part thereof. The Report is to be treated as confidential and may not be used or relied upon by third parties, except:
as agreed in writing by Consultant and Client as required by law for use by governmental reviewing agencies
Consultant accepts no responsibility, and denies any liability whatsoever, to parties other than Client who may obtain access to the Report or the Information for any injury, loss or damage suffered by such parties arising from their use of, reliance upon, or decisions or actions based on the Report or any of the Information (“improper use of the Report”), except to the extent those parties have obtained the prior written consent of Consultant to use and rely upon the Report and the Information. Any damages arising from improper use of the Report or parts thereof shall be borne by the party making such use. This Statement of Qualifications and Limitations is attached to and forms part of the Report and any use of the Report is subject to the terms hereof.