VOJNOSANITETSKI PREGLED ORIGINAL ARTICLE
Page 1 UDC: 616-008.9:612.349.8]:616.83 DOI: 10.2298/VSP160218082K
Insulin resistance in drug naive patients with multiple sclerosis Insulinska rezistencija kod nelečenih bolesnika sa multiplom sklerozom Smiljana Kostić*, Ivana Kolić‡, Ranko Raičević*†, Zvezdana Stojanovi憇, Dejan Kostić§, Evica Dinčić*† *Clinic of Neurology, ‡Clinic of Psychiatry, §Institute of Radiology, Military Medical Academy, Belgrade, Serbia; †Faculty of Medicine of the Military Medical Academy, University of Defence, Belgrade, Serbia; ‡Laboratory for Radiobiology and Molecular Genetics, Institute of Nuclear Sciences „Vinča“, Belgrade, Serbia
Abstract Background/Aim. Due to the fact that there is a relatively small number of data related to systemic insulin abnormalities in the multiple sclerosis (MS), the main objective of our study was to determine whether a dysbalance of glucose and insulin metabolism exist in patients with natural course of MS. Our hypothesis was that the metabolic disorder that characterizes state of the insulin resistance (IR) and reduced insulin sensitivity (IS) in untreated patients with MS could play a role in disease progression and degree of functional disability. Methods. The study included 31 patients with relapsing-remitting (RR) MS and 14 healthy controls from the same geographic area matched by age, ethnicity and number of smokers. The glucose tolerance, IS, and IR were examined using an oral glucose tolerance test (OGTT) and using basal plasma glucose and insulin levels. The functional disability and disease progression were evaluated by the Expanded Disability Status Scale (EDSS) and Multiple Sclerosis Severity Score (MSSS). Results. The MS patients tolerated glucose equally well as the healthy controls. Basal concentrations of insulin were significantly higher in the MS group Apstrakt Uvod/Cilj. S obzirom na činjenicu da ima relativno malo podataka koji se odnose na sistemske insulinske poremećaje u multiploj sklerozi (MS), osnovni cilj našeg istraživanja bio je da utvrdimo da li kod obolelih od MS sa prirodnim tokom bolesti postoji disbalans u metabolizmu glukoze i insulina. Naša hipoteza je da metabolički poremećaj koji karakteriše stanje insulinske rezistencije (IR) i snižene insulinske senzitivnosti (IS) kod nelečenih bolesnika sa MS može imati ulogu u progresiji bolesti i stepenu funcionalne onesposobljenosti. Metode. U studiju je bio uključen 31 bolesnik sa dijagnozom relapsno remitentne (RR) MS i 14 zdravih kontrolnih ispitanika sa istog geografskog područja usaglašenih po starosti, etničkoj pripadnosti, i zastupljenosti
(p < 0.05), as well as insulin plasma level 30 min after oral glucose load (p < 0.01). The patients with MS had significantly higher values of homeostasis model assessment indexes of IR (HOMA-IR) (p = 0.027; p = 0.028). The percentage of IS (HOMA2 %S) and whole body IS index (ISI Matsuda) showed significantly lower values in the MS patients than in the controls (p = 0.005; p = 0.001). The insulinogenic index in the first 30 min of OGTT was significantly higher in MS patients (p = 0.005). The measures of functional disability and MS progression did not correlate significantly with the investigated parameters of IR and IS indexes. Conclusion. This study demonstrates for the first time the existence of hyperinsulinemia, reduced insulin sensitivity and normal glucose tolerance that indicate the initial phase of IR in the natural course of MS. Additional research is necessary in order to define the mechanisms of occurrence and the impact of IR on the complex pathophysiological processes in MS. Key words: multiple sclerosis; insulin resistance; glucose tolerance test; questionnaires. pušača. Tolerancija na glukozu, IS i IR procenjivani su na osnovu oralnog testa opretećenja glukozom (OGTT) i bazalnih vrednosti insulina i glukoze u serumu. Za kliničku procenu funkcionalne onesposobljenosti i progresije bolesti korišćeni su Expanded Disability Status Scale (EDSS) i Multiple Sclerosis Severity Score (MSSS) skorovi. Rezultati. Bolesnici sa MS jednako su dobro tolerisali glukozu kao i kontrolna grupa zdravih. U grupi MS bolesnika bazalne koncentracije insulina u plazmi bile su statistički značajno veće (p < 0,05) kao i koncentarcije insulina 30 min nakog opterećenja glukozom (p < 0,01). Značajno veće vrednosti indeksa IR, i Homeostasis Model Assessment (HOMA-IR), imali su bolesnici sa MS nego zdrava kontrola. Pokazane su značajno niže vrednosti procenta IS (HOMA 2%S) i indeksa insulinske senzitivnosti celog tela (ISI Matsuda) kod MS
Correspondence to: Smiljana Kostić, Clinic of Neurology, Military Medical Academy, Crnotravska 17, 11 000 Belgrade, Serbia. Phone: +381 11 266 3470. E-mail:
[email protected]
Page 2
VOJNOSANITETSKI PREGLED
bolesnika nego kod kontrolne grupe (p = 0,005; p = 0,001). Insulinogeni indeks u prvih 30 min OGTT-a bio je značajno veći kod bolesnika sa MS. Ispitivani parametri IR i indeksi IS nisu pokazali značajnu povezanost sa stepenom funkcionalne onesposobljenosti i progresijom MS. Zaključak. U ovoj studiji je po prvi put pokazano prisustvo hiperinsulinemije, smanjene IS uz očuvanu toleranciju na glukozu, što sve zajedno ukazuje na
Introduction Multiple sclerosis (MS) is a disease in which the inflammatory and degenerative processes coexist from the beginning with the different contribution in the pathogenesis, depending on the type and the course of the disease 1. In recent years there have been more and more evidence suggesting the importance of insulin in many physiological and pathophysiological functions in the central nervous system (CNS), exceeding its exclusive role as a peripheral hormone. The presence of the insulin receptor as well as the insulin-sensitive glucose transporter was identified in the brain of humans and animals 2. Insulin reactive areas of the brain are involved in the regulation of peripheral metabolism, food intake, body weight, behavior control and cognition with primary effect on memory 3. Peripheral insulin crosses the blood-brain barrier by insulin-mediated transport mechanism. So far there is not enough evidence which would confirm its local synthesis in the human brain 4, 5. On the other hand metabolic requirements of the brain are obtained by constant influx of glucose from blood. It is considered that the cerebral glucose transport and metabolism are meinly insulin independent and that the role of insulin in brain glucose metabolism is controversial 6. The mechanisms by which insulin achieves its central effects are associated with insulin receptor expression, insulin signaling cascade, the neurotransmitter expression and modulation of several aspects of neuroinflammatory response 7, 8. Transport of insulin in CNS is compromised in conditions that are characterized by a reduced insulin sensitivity (IS) and insulin resistance (IR) in the periphery which is associated with the concept of brain insulin resistance 5, 9. Research in the past decade indicated a high degree of correlation between IR and peripheral hyperinsulinemia with neurodegenerative diseases such as Alzheimer's dementia, Huntington's disease and Parkinson's disease 10−12. A small number of recent studies conducted in different groups of MS patients suggest the presence of abnormalities in glucose and insulin metabolism. People with MS share equal risk of developing diabetes mellitus type 2 compared to the general population, but are more prone to develop other autoimmune diseases, including diabetes mellitus type 1 7. Immunomodulatory therapy with interferon beta (IFNβ) further contributes to the risk of developing glucose dysregulation 13−15. Studies have indicated the prevalence of IR higher than 40% in MS patients compared to the healthy subjects, ie 21% 16.
postojanje inicijalne faze sindroma IR kod bolesnika sa prirodnim tokom MS. Neophodna su dodatna istraživanja za definisanje mehanizama nastanka i uticaja IR na kompleksne patofiziološke procese kod MS. Ključne reči: multipla skleroza; insulin, rezistencija; glukoza, test tolerancije; upitnici.
Reduced IS and postprandial hyperinsulinemia was observed in the group of newly diagnosed MS patients 17. Due to the fact that there is a relatively small number of data related to IR in MS, especially in the group of patients with the natural course of the disease, the aim of this study was to examine glucose tolerance, insulin sensitivity and insulin resistance from an oral glucose tolerance test (OGTT) as well as from basal plasma glucose and insulin levels in the group of untreated patients with MS compared with healthy controls. The aim of this study was also to determine the relation between the level of functional disability expressed as Expanded Disability Status Scale (EDSS) and Multiple Sclerosis Severity Score (MSSS) with IR markers, in patients with MS. Our hypothesis is that the metabolic disorder that characterizes state of IR and reduced IS in patients with the natural course of MS could play a role in disease progression and degree of functional disability. Methods This clinical observational cross sectional study was conducted in the Clinic of Neurology of Military Medical Academy in Belgrade. All procedures were conducted in accordance with regulations of Good Clinical Practice and were approved by the Ethics Committee of the Military Medical Academy in Belgrade. Before enroled in the study the patients had to sign a informed consent for participation in the study. The patients suffering from MS were recruited from the register of patients of the Clinic of Neurology, Military Medical Academy in Belgrade. The study included 31 patients diagnosed with relapsing-remitting MS (RRMS) according to the revised Mac Donald criteria from 2010, who did not receive treatment that modifies the natural course of the disease 18. All the RRMS patients were in a state of clinical remission and did not receive corticosteroid therapy three months before joining the study. The control group consisted of 14 patients selected from a population of healthy veterans from the same geographic area. A control group of healthy subjects and MS patients were matched by age, ethnicity and the number of smokers. The MS patients and healthy controls who had in their medical history any disease or medical condition that might be associated with brain pathology, diabetes mellitus, hepatic, renal insufficiency, severe psychiatric or organic disease were excluded from the study. In addition, the patients, as well as the control group of healthy subjects were not taking
Kostić S, et al. Vojnosanit Pregl 2016; Online First April (00): 82−82.
VOJNOSANITETSKI PREGLED
any anti-inflammatory and hormone therapy or therapy which may affect the metabolic status. The subjects did not abuse alcohol or psychoactive substances nor were on the specific dietary regimen. Upon the arrival all the subjects were interviewed in order to collect demographic data, check inclusion and exclusion criteria and information about the history of MS. Physical examination, as well as anthropometric measurements (body weight, body height), were carried out. Body mass index (BMI) was obtained from the ratio of body weight (kg) and square of height (m2). In the patients with MS EDSS and MSSS were used for clinical evaluation of functional disability and disease progression. Blood samples were collected early in the morning after 12 hours of fasting and venous cannula was placed. First off all, the basal values of glucose and insulin were determined in plasma and after that the subjects were asked to drink a solution containing 75 g of glucose in 250 mL water over 3 minutes. Blood sampling for analysis of glycemia and insulinemia was then carried out 30 min and 120 min after the OGTT test. Plasma glucose concentrations were determined by enzymatic method using autoanalyzer (Dimesion RxL Siemens Health Care Diagnostics, Erlangen, Germany). Plasma insulin concentrations were determined by chemiluminescence immunoassay (Architect, Abbott Diagnostics Dicision, Wiesbaden, Germany). The parameters determined on the levels of fasting insulin and glucose were: homeostasis model assessment (HOMA), a widely accepted, surrogate, instrument for evaluation of IR in clinical and epidemiological studies which correlates well with the glucose clamp, and minimal model as direct and precise methods for the evaluation of IR and IS 19−21; [HOMA-IR index, the value obtained from the product of basal insulin levels (I0, mU/mL) and basal glycemia (G0, mmol/L) divided by the constant 22.5 22. Insulin resistance in the general population determined by the value of HOMA-IR ≥ 2.5]; updated HOMA 2 computer model also used for the assessment of IR (HOMA2-IR) and for determining IS (HOMA2-% S) and beta-cell function (HOMA2 -%β) from basal glucose and insulin values (this model output was calibrated so that normal β-cell function is
Page 3
100%, and normal IR ≤ 1; http://www.dtu7.ox.ac.uk/Homacalculator/download.php) 23. The parameters obtained from the OGTT test were: glucose tolerance, with impaired glucose tolerance (IGT) defined by values G0 (5.6−6.9 mmol/L) and/or glycemia in 2 h test G120 (7.8−11.0 mmol/L) 19; insulinogenic index in the first 30 min of the test (IGI 30'), as a measure of the first phase of insulin response to glucose, is the parameter for estimation of β-cell activity, (the early phase of insulin secretion is calculated as the quotient of the incremental insulin and glucose concentrations in the first 30 minutes 21); indices of insulin sensitivity (Cederholm index (ISICED) is a measure of peripheral insulin sensitivity and Matsuda index (ISIMAT) is the index of insulin sensitivity of the whole body which implies a composite assessment of hepatic and muscle insulin sensitivity 24−26. Statistical analysis Differences in frequencies of categorical variables between the patients and the controls were calculated by χ2. Distribution of continuous variables was tested by Kolmogorov-Smirnov test with Lillieform's correction. The influence of categorical variable on the variability of continuous parameters was analyzed using ANOVA or Kruskal Waliss ANOVA. The correlations were investigated by Spearman's rank correlation test. The results are presented as mean ± standard deviation (SD). Statistical analysis was performed using Statistica Version 8, software package (StatSoft Inc, 2008). In all tests, the differences with two-tailed alpha– probability p < 0.05 were considered significant. Results The main characteristics of the analyzed groups, the patients with MS and the controls, are presented in Table 1. There were no significant difference in age, percentage of smokers, prevalence of glucose intolerance and insulin resistance between the patients and the controls. The patients with MS had significantly lower BMI compared to the control subjects (p = 0.02). Table 1
Main characteristics of controls and patients with multiple sclerosis Patients p n = 31 Age (years) 35.20 ± 9.92 0.52 BMI (kg/m2) 23.70 ± 3.61 0.02 Smoking, n (%) 11 (35.5) 0.36* HOMA-IR1, n (%) 6 (19.35) 0.07* HOMA-IR2, n (%) 12 (38.71) 0.51* Imp gluc tol, n (%) 12 (38.71) 0.85* EDSS 2.56 ± 1.09 N/A MSSS 4.48 ± 2.13 N/A Values are mean ± SD for age, BMI, EDSS, MSSS; One-way ANOVA was used for comparison of continuous variables with normal distribution; *χ2-test was used for categorical variables; p values < 0.05 were considered statistically significant; N/A- not applicable. BMI – body mass index; HOMA-IR – homeostasis model assessment index of insulin resistance; Imp gluc tol – impared glucose tolerance; EDSS – expanded disability status scale; MSSS – multiple sclerosis severity score. Characteristics
Controls n = 14 35.07 ± 6.41 26.33 ± 2.54 7 (50.00) 0 (0.0) 4 (28.57) 5 (35.71)
Kostić S, et al. Vojnosanit Pregl 2016; Online First April (00): 82−82.
Page 4
VOJNOSANITETSKI PREGLED
HOMA, defined by both formulas for HOMA calculation. The percentage of insulin sensitivity, HOMA 2% S, was also significantly different, with lower values detected in the MS patients (Figure 2). The whole body insulin sensitivity index (ISI Matsuda) was significantly lower in the patients than in the controls, while peripheral index of insulin sensitivity (ISI Cederholm) was not. Also, the insulinogenic index in the first 30 min of OGTT (IGI 30′), the parameter that estimates β–cell function, was significantly higher in the patients with MS than in the controls (Figure 3). The insulin area under the curve (AUC) was significantly higher in the patients with MS, while the glucose AUC was comparable in both groups (Table 2). The measures of functional disability and MS progression (EDSS and MSSS) did not correlate significantly with the investigated parameters of insulin resistance (HOMA1IR, HOMA2-IR, INS0, INS30, INS120) as well as insulin sensitivity indexes (ISI MAT and ISI CED) or insulin response to glucose (IGI 30′).
The values of glucose and insulin during 2 h OGTT, measured at the time points of 0, 30 and 120 minutes, are presented in Figure 1. Plasma glucose values changed significantly during OGTT (increased and than decreased) in both, patients and controls (both p < 0.001, effect of test), but there was no difference between the patients and the controls (p > 0.05, effect of disease). On the other hand, the basal concentrations of insulin were significantly higher in the MS patients than in the controls (p < 0.05). Oral administration of glucose induced the significant increase of insulin after 30 minutes (p < 0.05, effect of test) as well as between patients with the MS and controls (p < 0.01, effect of disease) (Figure 1a and b). The parameters of insulin resistance, sensitivity and β cell function derived from fasting and OGTT measurements of glucose and insulin are presented in Table 2. We detected the significant difference in indexes of insulin resistance HOMA1-IR and HOMA2-IR between the patients and controls. The patients with MS had significantly higher values of
Fig. 1 − Glucose and insulin plasma levels during OGTT in the patients with MS and the controls; a) Glucose during 2 h OGTT at the time points 0, 30 and 120 minutes in the controls and the patients with MS; b) Insulin during 2 h OGTT at the time points 0, 30 and 120 minutes in controls and patients with MS; (controls, n = 14; patients, n = 31); All values are expressed as means, with their standard deviations represented by vertical bars; KruskalWallis ANOVA,*p < 0.05, **p < 0.01. OGTT – oral glucose tolerance test.
Table 2 Parameters of insulin metabolism in controls and patients with multiple sclerosis Parameters HOMA-IR1 HOMA-IR2 HOMA2 %β HOMA2 %S ISI MAT ISI CED AUC INS AUC GLUC IGI30′ (mU/mmoL)
Controls n=14 1.27 ± 0.67 0.74 ± 0.39 77.09 ± 31.63 9.26 ± 4.47 166.69 ± 80.40 57.42 ± 22.27 59.5 ± 31.95 15.44 ± 2.83
Patients n=31 1.91 ± 1.27 1.10 ± 0.71 102.65 ± 49.18 5.80 ± 2.22 104.32 ± 40.05 51.12 ± 11.33 80.11 ± 33.81 15.42 ± 3.11
0.027* 0.028* 0.06* 0.005 0.001 0.21 0.023 0.98
6.30 ± 4.09
17.37 ± 22.65
0.005*
p
Values are presented as mean ± SD; One-way ANOVA was used for comparison of continuous variables with normal distribution; *Kruskal-Wallis ANOVA test was used to compare values between controls and patients with MS for continuous variables that had skewed distribution; p values < 0.05 were considered statistically significant. HOMA-IR – homeostasis model assessment index of insulin resistance; ISI MAT – insulin sensitivity index; ISI CED – peripheral insulin sensitivity index; AUC − area under the curve; INS − insulin; GLUC – glucose; IGI30′ − insulin response to glucose. Kostić S, et al. Vojnosanit Pregl 2016; Online First April (00): 82−82.
VOJNOSANITETSKI PREGLED
Page 5
2.0
3.4 3.2
1.8
3.0 2.8
1.6
2.6
1.4
2.4
HOMAIR2
HOMAIR1
2.2 2.0 1.8
1.2 1.0
1.6
0.8
1.4 1.2
0.6
1.0 0.8
0.4
0.6
0.2
0.4 Controls
Controls
Patients
a)
Patients
b)
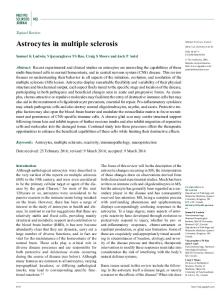
Fig. 2 – HOMA-IR in the patients with multiple sclerosis (MS) and the controls: a) HOMA1-IR in the controls and the patients with MS; b) HOMA2-IR in the controls and the patients with MS; (controls, n = 14, patients, n = 31); All values are expressed as means, with their standard deviations represented by vertical bars; KruskalWallis ANOVA,*p < 0.05. HOMA-IR – Homeostasis model assessment-insulin resistance.
70
60
50
40
IGI 30' mLU/L
30
20
10 Controls
Patients
Mean Mean±SE Mean±1.96*SE
Fig. 3 − Insulinogenic index during the first 30 min of OGTT (IGI 30′) in the controls and the patients with multiple sclerosis (controls, n = 14; patients, n = 31; Kruskal-Wallis ANOVA, **p < 0.01). OG
Discussion Our study indicate the presence of abnormal insulin and glucose metabolism in the patients with MS compared to the healthy control subjects matched in age, ethnicity and percentage of smokers. Insulin resistance means a reduced capacity of endogenous as well as exogenous insulin to stimulate tissue glucose utilization. Decreased tissue reactivity to insulin starts maladaptive mechanisms with the aim to maintain optimal levels of glucose in blood and preserve homeostasis 7, 8. Pancreatic β-cells secrete more insulin and hyperinsulinemia temporarily maintains euglycemia. Investigation of IR progressed from its primary role in the pathogenesis of diabetes and latterly it is the area of interest in a wide range of diseases. IR could represent a kind of common pathway through which negative environmental Kostić S, et al. Vojnosanit Pregl 2016; Online First April (00): 82−82.
factors in interaction with genetic predisposition lead to metabolic, hemodynamic and inflammatory disorders. The main objective of our study was to demonstrate whether a dysbalance in the metabolism of glucose and insulin exist in patients with the natural course of MS, based on the parameters obtained from the OGTT. In the group of the patients with MS the prevalence of IR showed a trend towards significance compared to the healthy control subjects. Population studies in different geographic areas indicated the existence of large variability in cut-off HOMA-IR values that define IR 27, 28. Unfortunately, studies have not been conducted yet in our population, so commonly accepted cut-off value for IR > 2.5 was used 22. Among this study subjects, who shared the same geographical and cultural characteristics and a similar genetic background, comparison of the HOMA-IR index
Page 6
VOJNOSANITETSKI PREGLED
values showed that the patients with MS, as a group, had significantly higher values compared to the healthy controls. Unlike the previous studies that examined the glucose and insulin metabolism in patients with MS, our study selected a group of RR MS patients with natural course of the disease with the average disease duration of 6 years. The study of Penesova et al. 17 included a group of untreated RR MS patients with a short duration of the disease, diagnosed immediately after the first episode of the symptoms, and a lower degree of functional disability where no statistically significant differences in the values of HOMA-IR indexes were found between the group of MS patients and the healthy subjects. Oliveira et al. 16 found a higher prevalence of IR based on HOMA-IR index in the group of MS patients with a similar duration of the disease as in our patients, but they included patients with RR MS and secundary progressive (SP) MS who were receiving immunomodulatory therapy. It has been shown that treatment with interferon induces IR and increases an incidence of diabetes mellitus 14, 29. A recent study has indicated that IFN β leads to IR by activation of signal transducer and activation of the transcription (STAT1)/suppressor of cytokine signaling (SOCS). Increased expression of SOCS in liver and adipose tissue results in suppression of insulin signaling and reduction of glucose uptake and it also leads to suppression of insulininduced phosphorylation of insulin receptor substrate (IRS)-1 protein 14. Significantly higher values of HOMA-IR index in the group of our MS patients are consistent with the results of Oliveira et al. 16 although our patients were younger and were not treated with immunomodulatory therapy. Hence it can be suggested that insulin resistance is associated with MS independently on the therapy and a higher prevalence of IR in MS patients, 41% in their study compared to our group of subjects, 19.3%, could partly be explained by the effect of the therapy and older age. Wanting to explore the mechanism of glucose metabolism disorders in MS better, we opted for the use of OGTT by which we could gain an insight into glucose tolerance, insulin response to glucose stimulation as well as the sensitivity of peripheral tissues to insulin. Our results show that the MS patients tolerated glucose equally well as the healthy controls. There was no difference in individual glycemic time points, the form of curve and the area under the curve. However, the MS patients had significantly higher basal insulin concentrations and a significant increase in insulin after oral administration of glucose. The values of the area under the curve for insulin were significantly higher in MS patients than in the healthy controls. Increased insulin response suggests a reduced IS which confirms a significantly lower IS index, HOMA 2%S, obtained in our work in the group of MS patients based on the calculations from basal levels of insulin and glucose. Moreover, we established a significantly lower insulin sensitivity index of the whole body ISIMAT, obtained on the basis of OGTT. These results are in agreement with the findings of Penesova et al. 17 who pointed out that the reduced IS is a
probable cause for hyperinsulinemia in the newly diagnosed and untreated MS patients. The difference in the value of the peripheral insulin sensitivity index ISICED did not express a statistical significance between our patients and the healthy controls, in contrast to the results of Penesova et al. 17. A possible explanation is that the formula for calculating the ISICED contains value of the body weight included in the calculation of BMI, which was significantly lower in the group of our patients. With the aim to get an indirect insight into the activity of pancreatic β-cells in the group of MS patients, we used a surrogate marker for evaluation of the first-phase insulin response to glucose, IGI30', with a significantly higher value compared to the healthy control group. Low insulinogenic index proved to be a predictor of the development of DM type 2. A decrease in this parameter value accompanies the development of glucose intolerance when an impaired β-cell function does not provide a sufficient increase in insulin secretion in relation to the requirements, which results in inadequate hyperinsulinemia 10. Considering that our patients tolerated glucose as well as the healthy subjects, an increased value of this index would speak in favor of preserved β-cell function compared to the increased demands dictated by reduced IS. Common findings for hyperinsulinemia, reduced IS and normal glucose tolerance could indicate the existence of the initial phase of IR syndrome when there has still not occurred a collapse of glucoregulation and when the pancreatic β-cells respond to IR with a significantly increased insulin secretion in a group of patients suffering from MS with the natural course of the disease and low levels of functional disability. The results of our study do not indicate any association between IR and IS with the level of functional disability and the disease progression. A low average EDSS score in our group of patients does not significantly limit their physical activity which annuls the potential impact of reduced physical activity in IR. On the other hand, given the low EDSS score and a shorter disease duration, 6 years in average, it is possible that it would be necessary to check data on the absence of the connection of IR with the severity of functional disability and the rate of disease progression, obtained in this study, in a group of patients with a longer duration of the disease or in longitudinal studies which track the temporal and causal link. Data from the previous studies indicate that IR accompanies other autoimmune diseases as well 30, 31. In patients with systemic lupus the connection with adipocytokines adiponectin, leptin, and visfatin in pathophysiology of IR and their possible role were indicated, while in rheumatoid arthritis (RA) the connection between seropositivity for rheumatoid factor (RF) and anti-citrullinated antibodies to citrullinated protein antigens (ACPA) with IR was observed 31, 32. In patients with RA an increased production of insulin was detected. The conclusion was that a common trigger of autoimmunity could contribute to the production of antibodies directed to the insulin receptor, leading to IR, rather than the destruction of β cells 31. Kostić S, et al. Vojnosanit Pregl 2016; Online First April (00): 82−82.
VOJNOSANITETSKI PREGLED
Inflammatory cytokines, tumor necrosis factor (TNF)-α, interleukin(IL)-6, IL-17, (IFN)–γ, which are elevated in patients with MS, are implicated in negative interactions at the level of insulin receptors, signaling pathways and regulation of the genes responsible for normal insulin activity, as well as at the level of mechanisms involved in the processes of reaction to insulin and peripheral glucose uptake. On the other hand, insulin abnormalities are associated with increased oxidative stress and inflammatory response 33, 34. The drugs from the thiazolidinedione group, agonists of peroxisome proliferator-activated receptor-γ (PPAR γ), which are widely used in the therapy of diabetes, because they lead to a decrease in the IR, expressed the ability to prevent the occurrence of clinical signs and reduce the severity of the disease in the model of experimental autoimmune encephalomyelitis EAE. PPARγ receptor is expressed in the inflammatory infiltrates of the spinal cord in EAE 35. Considering that the activation of PPARγ has shown beneficial effects in the treatment of inflammatory diseases their potential benefit in the treatment of MS was suggested 36. These data suggest that chronic systemic inflammation and oxidative stress may have a prominent role in the development of IR and thus there is an assumption of a possible connection between IR with chronic inflammation in MS. Moreover, neurodegenerative diseases, particularly Alzheimer's dementia (AD), are associated with the existence of IR 7, 37, 38. A concept was recently introduced that considers AD a metabolic disease with impaired energy metabolism and glucose utilization in the brain, based on the brain resistance to insulin and insulin-like growth factor 39. Cerebral IR is associated with peripheral IR and chronic hyperinsulinemia to which aging, obesity and dyslipidemia contribute. On the other hand, it could be determined as soon as in the fetal period by maternal metabolic disorders which interact with the fetal brain as well as the genetic background 4, 7, 31. The influence of cerebral IR to neurodegeneration is carried out through a variety of mechanisms which include enhanced acti-
Page 7
vation of kinases that pathologically phosphorylate the Tau protein, increase in the expression of amyloid-β precursor protein (AβPP) and the accumulation of amyloid, as well as an increase of oxidative stress, mitochondrial dysfunction and the activation of pro-inflammatory and pro-apoptotic cascades which represent a part of the pathogenetic process in MS 37, 38. A parallel degenerative process which takes place in the natural course of MS suggests a possible analogy in pathophysiological processes with other neurodegenerative diseases of the CNS, especially since MS is largely characterized by the cognitive impairment 39−41. Limitation of the above research, a small number of subjects in the control group, is justified by the relatively difficult and invasive procedure that had to be carried out in the healthy subjects. All control subjects were males. This, however, did not affect the accuracy of the results given the fact that statistical comparative analysis of all relevant parameters of the assessment within the group of patients with MS did not indicate a significance in relation to gender 42. Considering a relatively small number of MS patients in this preliminary study, the results require further confirmation in a study with a larger number of drug naive patients with MS. Conclusion This study demonstrates for the first time the existence of IR in the natural course of RRMS, in patients not treated with any type of therapy that alters the natural course of the disease. Given the previously demonstrated presence of IR in the patients with MS who received immunomodulatory therapy, as well as a reduced insulin sensitivity in the newly diagnosed, untreated patients with MS, our opinion is that there is a dysregulation of glucose and insulin metabolism in MS and that additional research is necessary in order to define the mechanisms of occurrence and the impact on the complex pathophysiological processes in the CNS of the patients with MS.
R E F E R E N C E S 1. Compston A, Coles A, Bujko K, Bujko M. Multiple sclerosis. Lancet 2008; 372(9648): 1502−17. 2. Hill JM, Lesniak MA, Pert CB, Roth J. Autoradiographic localization of insulin receptors in rat brain: Prominence in olfactory and limbic areas. Neuroscience 1986; 17(4): 1127−38. 3. Woods SC, Seeley RJ, Baskin DG, Schwartz MW. Insulin and the blood-brain barrier. Curr Pharm Des 2003; 9(10): 795−800. 4. Heni M, Kullmann S, Preissl H, Fritsche A, Häring HU. Impaired insulin action in the human brain: Causes and metabolic consequences. Nat Rev Endocrinol 2015; 11(12): 701−11. 5. Banks WA, Illes P, Alexandre RJ. The source of cerebral insulin. Eur J Pharmacol 2004; 490(1−3): 5−12. 6. Seaquist ER, Damberg GS, Tkac I, Gruetter R. The effect of insulin on in vivo cerebral glucose concentrations and rates of glucose transport/metabolism in humans. Diabetes 2001; 50(10): 2203−9. 7. Watson GS, Craft S. Insulin resistance, inflammation, and cognition in Alzheimer's Disease: Lessons for multiplesclerosis. J Neurol Sci 2006; 245(1−2): 21−33.
Kostić S, et al. Vojnosanit Pregl 2016; Online First April (00): 82−82.
8. Yanagita T, Nemoto T, Satoh S, Yoshikawa N, Maruta T, Shiraishi S, et al. Neuronal Insulin Receptor Signaling: A Potential Target for the Treatment of Cognitive and Mood Disorders.In: Kocabasoglu N, editor. Mood disorders. Rijeka: InTech; 2013. p. 263−87. 9. Heni M, Schöpfer P, Peter A, Sartorius T, Fritsche A, Synofzik M, et al. Evidence for altered transport of insulin across the bloodbrain barrier in insulin-resistant humans. Acta Diabetol 2014; 51(4): 679−81. 10. Russo CV, Salvatore E, Saccà F, Tucci T, Rinaldi C, Sorrentino P, et al. Insulin sensitivity and early-phase insulin secretion in normoglycemic Huntington's disease patients. J Huntingtons Dis 2013; 2(4): 501−7. 11. Schioth HB, Craft S, Brooks SJ, Frey WH, Benedict C. Brain insulin signaling and Alzheimer'sdisease: Current evidence and future directions. Mol Neurobiol 2012; 46(1): 4−10. 12. Aviles-Olmos I, Limousin P, Lees A, Foltynie T. Parkinson's disease, insulin resistance and novel agents of neuroprotection. Brain 2013; 136(Pt 2): 374−84.
Page 8
VOJNOSANITETSKI PREGLED
13. Edwards LJ, Constantinescu CS. A prospective study of conditions associated with multiple sclerosis in a cohort of 658 consecutive outpatients attending a multiple sclerosis clinic. Mult Scler 2004; 10(5): 575−81. 14. Wada Т, Hoshino М, Kimura Y, Ojima M, Nakano T, Koya D, et al. Both type I and II IFN induce insulin resistance by inducing different isoforms of SOCS expression in 3T3-L1 adipocytes. Am J Physiol Endocrinol Metab 2011; 300(6): 1112−23. 15. Mahler A, Steiniger J, Bock M, Brandt AU, Haas V, Boschmann M, et al. Is metabolic flexibility altered in multiple sclerosis patients. PLoS One 2012; 7(8): e43672. 16. Oliveira SR, Simão AN, Kallaur AP, de Almeida ER, Morimoto HK, Lopes J, et al. Disability in patients with multiple sclerosis: Influence of insulin resistance, adiposity, and oxidative stress. Nutrition 2014; 30(3): 268−73. 17. Penesova A, Vlcek M, Imrich R, Vernerova L, Marko A, Meskova M, et al. Hyperinsulinemia in newly diagnosed patients with multiple sclerosis. Metab Brain Dis 2015; 30(4): 895−901. 18. Polman CH, Reingold SC, Banwell B, Clanet M, Cohen JA, Filippi M, et al. Diagnostic criteria for multiple sclerosis: 2010 revisions to the McDonald criteria. Ann Neurol 2011; 69(2): 292−302. 19. Genuth S, Alberti KG, Bennett P, Buse J, Defronzo R, Kahn R, et al. Expert Committee on the Diagnosis and Classification of Diabetes Mellitus. Follow-up report on the diagnosis of diabetes mellitus. Diabetes Care 2003; 26(11): 3160−7. 20. Gayoso-Diz P, Otero-Gonzalez A, Rodriguez-Alvarez MX, Gude F, Cadarso-Suarez C, García F, et al. Insulin resistance index (HOMA-IR) levels in a general adult population: Curves percentile by gender and age. The EPIRCE study. Diabetes Res Clin Pract 2011; 94(1): 146−55. 21. Singh B, Saxena A. Surrogate markers of insulin resistance: A review. World J Diabetes 2010; 1(2): 36−47. 22. Matthews DR, Hosker JP, Rudenski AS, Naylor BA, Treacher DF, Turner RC. Homeostasis model assessment: insulin resistance and beta-cell function from fasting plasma glucose and insulin concentrations in man. Diabetologia 1985; 28(7): 412−9. 23. Wallace TM, Levy JC, Matthews DR. Use and abuse of HOMA modeling. Diabetes Care 2004; 27(6): 1487−95. 24. Albareda M, Rodríguez-Espinosa J, Murugo M, de Leiva A, Corcoy R. Assessment of insulin sensitivity and beta-cell function from measurements in the fasting state and during an oral glucose tolerance test. Diabetologia 2000; 43(12): 1507−11. 25. Cederholm J, Wibell L. Insulin release and peripheral sensitivity at the oral glucose tolerance test. Diabetes Res Clin Pract 1990; 10(2): 167−75. 26. Matsuda M, DeFronzo RA. Insulin sensitivity indices obtained from oral glucose tolerance testing: Comparison with the euglycemic insulin clamp. Diabetes Care 1999; 22(9): 1462−70. 27. Jensterle M, Weber M, Pfeifer M, Prezelj J, Pfutzner A, Janez A. Assessment of insulin resistance in young women with polycystic ovary syndrome. Int J Gynaecol Obstet 2008; 102(2): 137−40. 28. Gong X, Xie Z, Zuo H. Invivo insulin deficiency as a potential etiology for demyelinating disease. Med Hypotheses 2008; 71(3): 399−403.
29. Koivisto VA, Pelkonen R, Cantell K. Effect of interferon on glucose tolerance and insulin sensitivity. Diabetes 1989; 38(5): 641−7. 30. Lozovoy MA, Simão AN, Hohmann MS, Simão TN, Barbosa DS, Morimoto HK, et al. Inflammatory biomarkers and oxidative stress measurements in patients with systemic lupus erythematosus with or without metabolic syndrome. Lupus 2011; 20(13): 1356−64. 31. Mirjafari H, Farragher TM, Verstappen SM, Yates A, Bunn D, Marshall T, et al. Seropositivity is associated with insulin resistance in patients with early inflammatory polyarthritis: results from the Norfolk Arthritis Register (NOAR): An observational study. Arthritis Res Ther 2011; 13(5): R159. 32. Chung CP, Long AG, Solus JF, Rho YH, Oeser A, Raggi P, et al. Adipocytokines in systemic lupus erythematosus: Relationship to inflammation, insulin resistance and coronary atherosclerosis. Lupus 2009; 18(9): 799−806 33. Krogh-Madsen R, Plomgaard P, Keller P, Keller C, Pedersen BK. Insulin stimulates interleukin-6 and tumor necrosis factor-alpha gene expression in human subcutaneous adipose tissue. Am J Physiol Endocrinol Metab 2004; 286(2): E234−8. 34. Styskal J, Van Remmen H, Richardson A, Salmon A. Oxidative stress and diabetes: What can we learn about insulin resistance from antioxidant mutant mouse models. Free Radic Biol Med 2012; 52(1): 46−58. 35. Feinstein DL, Galea E, Gavrilyuk V, Brosnan CF, Whitacre CC, Dumitrescu-Ozimek L, et al. Peroxisome proliferator-activated receptor-gamma agonists prevent experimental autoimmune encephalomyelitis. Ann Neurol 2002; 51(6): 694−702. 36. Diab A, Deng C, Smith JD, Hussain RZ, Phanavanh B, LovettRacke AE, et al. Peroxisome proliferator-activated receptorgamma agonist 15-deoxy-Delta (12, 14)-prostaglandin J(2) ameliorates experimental autoimmune encephalomyelitis. J Immunol 2002; 168(5): 2508−15. 37. de la Monte SM. Brain insulin resistance and deficiency as therapeutic targets in Alzheimer's disease. Curr Alzheimer Res 2012; 9(1): 35−66. 38. Blázquez E, Velázquez E, Hurtado-Carneiro V, Ruiz-Albusac JM. Insulin in the brain: its pathophysiological implications for States related with central insulin resistance, type 2 diabetes and Alzheimer's disease. Front Endocrinol (Lausanne) 2014; 5: 161 39. de la Monte SM. Intranasal insulin therapy for cognitive impairment and neurodegeneration: Current state of the art. Expert Opin Drug Deliv 2013; 10(12): 1699−709. 40. Kim B, Feldman EL. Insulin resistance as a key link for the increased risk of cognitive impairment in the metabolic syndrome. Exp Mol Med 201; 47(3): e149. 41. Lovera J, Kovner B. Cognitive impairment in multiple sclerosis. Curr Neurol Neurosci Rep 2012; 12(5): 618−27. 42. Olefsky JM, Glass CK. Macrophages, inflammation, and insulin resistance. Annu Rev Physiol 2010; 72: 219−46. Received on February 18, 2016. Revised on March 6, 2016. Accepted on March 22, 2016. Online First April, 2016.
Kostić S, et al. Vojnosanit Pregl 2016; Online First April (00): 82−82.