Business Sector Productivity in Canada: What Do We Know? Paul Boothe and Richard Roy1 Industry Canada ABSTRACT Business sector productivity growth is central to Canadians' future prosperity. This article reviews the performance of the Canadian business sector in improving labour and multifactor productivity and examines possible factors underlying recent developments. The article links weak multifactor productivity growth in the Canadian business sector to the weak innovation performance of Canadian firms. The conclusion to this article describes a research program that Industry Canada, in conjunction with others, is carrying out. The research program seeks to identify the reasons for Canada's poor innovation and productivity performance, in order to shed light on actions that can be undertaken to improve productivity growth. IN THE FUTURE, more than in the past, labour
cially pronounced in Canada. Starting around
productivity growth will be the key determi-
2010, it is expected that declines in the employ-
nant of the rate of improvement in the living
ment/population ratio and in average hours
standards of Canadians. Over past decades,
worked will both exert a negative influence on
increases in the employment/population ratio
the growth in living standards.
have contributed significantly to the growth in
In this context, Canada’s weak productivity
real incomes. In the more recent period, since
performance is especially troubling. If the coun-
2002, Canadian prosperity has been boosted by
try does not improve on its poor performance
stronger commodity prices and a major
since 2000, Canadians are likely to see their eco-
improvement in Canada’s terms of trade — the
nomic well-being decline relative to other major
price of exports relative to imports. Neither of
industrial countries. There is also a risk that in
these factors can be counted on to support the
future years when employment growth has
future growth in Canadian living standards.
slowed and the terms of trade have stabilized,
Over the last few decades, the trend in com-
the country will face considerable difficulty
modity prices has been relatively flat and, prior
finding the resources to finance rising health,
to the recent sharp upswing in price of the
social and environmental costs.
country’s commodity exports, Canada’s terms of
With a view to the central role of productivity
trade were below where it had been in 1980.
growth in Canadians’ future prosperity, this
Demographic changes, which are occurring in
article reviews what we know about business sec-
all developed economies, are likely to be espe-
tor productivity. Business performance in
1
Paul Boothe is Senior Associate Deputy Minister at Industry Canada. Richard Roy is Acting Director General, Micro-Economic Policy Analysis Branch at Industry Canada. This article is based on Paul Boothe’s presentation to the Ottawa Economics Association, December 11, 2007. We would like to thank Daniel Boothby, Jianmin Tang and Marc Duhamel for their inputs. The views expressed are those of the authors only and do not necessarily reflect in any way those of either Industry Canada or the Government of Canada. Emails:
[email protected];
[email protected].
INTERNATIONAL PRODUCTIVITY MONITOR
3
improving labour and multifactor productivity is
Table 1 Sources of Income per Capita Growth in Canada, 1981-2007 (per cent)
examined and possible factors underlying recent developments are examined. The article concludes with an identification of research questions that Industry Canada in conjunction with
Labour Productivity
56.8
others is attempting to answer and that will
Multifactor Productivity
47.8
hopefully shed light on actions that can be taken
Capital Deepening
9.0
Working-Age/Total Population
to bolster Canada’s productivity performance.
11.5
Employment Rate
9.9
Hours Worked per Worker
Labour Productivity Performance
-3.5
Net Foreign Income
3.7
Terms of Trade
21.5
Total
100
The challenge identified in the introduction
Source: Industry Canada computation based on data from Statistics Canada.
can be better understood from Table 1, which examines the sources of real income per capita growth in Canada. The table pertains to gross national income (GNI) per capita, which is a
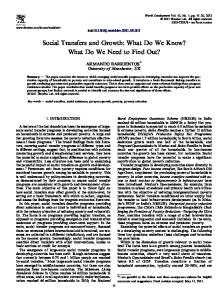
Chart 1 Labour Productivity* Growth in OECD Countries, 1981-2006 (per cent, average annual rate)
measure of the purchasing power of the income earned by Canadians that takes account of changes in the terms of trade and in investment income from foreign assets (net of the payments
Korea
to foreigners who have assets in Canada). Over
Ireland
1981-2007, the standard of living of Canadians,
Finland
as measured by GNI per capita, increased at an
Japan Norway
average annual rate of 2.2 per cent. Growth in
Germany
labour productivity accounted for 57 per cent of
France
per capita income growth, but increases in the
United Kingdom
proportion of the population that is employed
Sweden
and improvements in the terms of trade were
Denmark
both major sources, each contributing over 20
Belgium
per cent to the growth in per capita income.
Netherlands Australia
In the recent period, increases in the extent of
United States
employment and improvements in the terms of
Spain
trade have not only contributed to absolute
New Zealand
income gains, they have also helped Canada
Canada
achieve significant increases in real per capita
Italy Iceland
income relative to the United States. While the
Switzerland
purchasing power of Canadians received a major 0
1
2
3
4
5
6
boost from the post-2002 commodity boom, real incomes in the United States have been
* Real GDP per hour worked. Source: OECD Productivity Database, July 2007.
largely unaffected by trading gains. In addition, since 2000, the labour market has been much more buoyant in Canada than the United States and jobs per capi ta have increased more
4
NUMBER 16, SPRING 2008
strongly. As a result, real GNI per capita has grown much more rapidly in Canada than the United States.
2
Looking to the future, it is relevant to ask how Canadians would have fared if these other
Chart 2 Relative Labour Productivity in Canada, 1991-2007 (U.S.=100) 100
sources were not available and per capita income growth depended solely on increases in labour 90
productivity. The short answer is “not very well”. Over the entire 1981 to 2006 period, labour productivity in Canada, defined as GDP
80
per hour worked, increased at an unimpressive 1.4 per cent per year. This growth rate places
70
Canada 17th among the 20 OECD countries for which productivity data are available, and 6 th among the G7 major industrial countries (see
60 91
Chart 1). Over the 2000-2007 period, labour
93
95
97
99
'01
Business Sector
productivity in Canada has increased at an
'03
'05
Manufacturing
annual average rate slightly below 1.0 per cent. While productivity growth has fallen in Canada, the United States has strengthened its performance since 2000, raising the pace of productivity growth some 24 per cent above its trend rate
*
Labour productivity is defined as GDP per hour worked, PPP-based. The series are extrapolated based on 1999 benchmarking estimates of the Canada-U.S. labour productivity gap, using labour productivity indexes from Statistics Canada and U.S. Bureau of Labor Statistics.
Source: Industry Canada calculation based on data from Statistics Canada and U.S. Bureau of Labor Statistics
(1981-2007) of 2.1 per cent. Given the difficulties in measuring non-commercial outputs, it is most meaningful to focus
Multifactor Productivity Performance
on productivity developments for the 80 per
Labour productivity growth can be decom-
cent of the economy involved in business activ-
posed into the parts coming from increases in
ities. The general story, however, is the same.
capital intensity, improvements in labour qual-
According to Industry Canada calculations, the
ity, and multifactor productivity. Capital inten-
level of business sector labour productivity in
sity is the capital services (based on the stock of
Canada was only about 75 per cent of the level
machines, buildings and engineering structures)
3
in the United States in 2007 (Chart 2). The gap
available per hour worked. The labour quality
has widened markedly since 2000. The decline
component measures improvements in worker
in Canada’s relative performance has been espe-
skills as a result of education and on-the-job
cially pronounced in manufacturing and, in
experience. Multifactor productivity (MFP) is a
2006, the gap between Canadian and U.S. man-
measure of the efficiency with which labour and
ufacturing productivity levels was close to 40
capital are used in production. It is calculated as
per cent.
a residual and captures all other effects after
2
Over the 2002-2006 period, the growth rate of real gross national income per capita was 14.3 per cent in Canada and 8.1 per cent in the United States.
3
Estimates of the Canada-U.S. productivity level gap estimates vary among researchers because of differences in data sources and in the PPP exchange rates used in the calculation. Despite the variations in the point estimates, all researchers concur that the Canada-U.S. labour productivity gap is significant and has widened significantly since 2000.
INTERNATIONAL PRODUCTIVITY MONITOR
5
'07
include the creation of new products and pro-
Chart 3 Sources of Labour Productivity Growth in the Canadian Business Sector
cesses, improvements in technology, economies of scale, organizational changes and new human resource practices.4
3.5
A decomposition of labour productivity growth
3
in the Canadian business sector is shown in Chart
2.5
3. Over the 1996-2006 period, increased capital intensity was the most important factor underly-
2
ing the growth in labour productivity. While
1.5
MFP growth made a significant contribution to
1
labour productivity growth between 1996 and
0.5
2006, the weakness in MFP was the major cause
0
of the slowdown in labour productivity experi-
-0.5
enced over the 2000-2006 period. Labour productivity growth
Contribution of capital deepening
1996-2006
Contribution of labour quality improvements
1996-2000
Multifactor productivity growth
2000-2006
Chart 4, which compares the sources of labour productivity growth in the Canadian and the U.S. business sectors, provides a more telling picture of Canada’s weak MFP performance.
Source: Statistics Canada.
Over 1980-2000, capital intensity, and to a lesser
Chart 4 Canada-U.S. Differences in Sources of Business Sector Productivity Growth
extent, labour quality, were increasing more strongly in Canada than in the United States, but these positive factors were more than offset by the weakness in Canadian multifactor pro-
1
ductivity. Over the 2000-2006 period, Canada’s
0.5
poor MFP performance accounts for almost all 0
of the 2 percentage point difference in labour
-0.5
productivity growth between the Canadian and U.S. business sectors. Chart 5 examines the gap
-1
in productivity levels in a particular year. The
-1.5
chart highlights the extent to which the weak-
-2
ness in multifactor productivity is a cause of Canada’s low labour productivity level relative
-2.5 Labour productivity growth
Contribution of capital deepening
1980-2000
Contribution of labour quality improvements
1996-2000
Multifactor productivity growth
2000-2006
Source: KLEMS Database, Statistics Canada.
to the United States. As discussed above, MFP captures a host of factors that affect the overall efficiency with which inputs are used. Poor MFP growth may reflect weak investment by firms in building
increases in capital intensity and improvements
their “knowledge capital”, a failure to realize
in labour quality have been taken into account.
the opportunities from increased specializa-
The possible contributors to MFP growth
tion, weak governance mechanisms or the use
4
6
MFP growth is often used as an indicator of long term technological progress. While technological change is the most important factor underlying MFP growth in the economy over the longer-term, it may not be the main influence on MFP productivity growth in particular periods and specific sectors.
NUMBER 16, SPRING 2008
of outdated organizational practices. The decline in MFP growth in the Canadian business sector since 2000 is partly due to special factors associated with the pressures to meet strong demand for the extraction of minerals
Chart 5 Contribution to the Canada-U.S. Labour Productivity Gap in the Business Sector, 2004
and oil and gas. 5 A factor contributing to the
90 %
MFP slowdown in manufacturing was the fall off in output growth, which reduced the intensity of use of existing labour and capital inputs. One of the strongest candidates for explaining MFP performance by business, however, is innovation, broadly defined. 6 Econometric studies show that business innovation, as indicated by
10 %
various proxies such as R&D intensity, is a major source of technological improvement and productivity gain. Micro studies that focus on output
Capital intensity gap
MFP gap
relationships by analyzing cross-sectional data at
Source: Industry Canada calculation based on data from Statistics Canada and U.S. Bureau of Economic Analysis.
the firm or industry level and analyses using a cost
attempted to benchmark innovation, using a
function approach both find that investments in
broad indicator that recognizes that the
7
R&D tend to pay big dividends. Macro studies
impact of innovation on productivity comes
using aggregate data similarly find that knowl-
not only from the introduction of new prod-
edge acquired from R&D as well as international
ucts and processes, but also the diffusion of
knowledge spillovers has a significant influence
new technologies throughout the economy. In
8
this composite measure, which combines
on productivity growth.
three measures of innovation activity and
Innovation by Canadian Business
three measures of technology diffusion, 9 Canada ranks 10 th among 27 OECD countries.
On a number of measures of innovation,
Our overall score is below that of many top
Canada lags behind many other major indus-
performers that include Sweden, Switzerland,
trial countries. The OECD (2004) has
Japan, Finland, the United States, Germany
5
There was a dramatic decline in multifactor productivity in the mining and oil and gas extraction sector (about 5 per cent of GDP in 2006) over 2000-2006. As a consequence of strong markets and the pressure to increase output, labour markets tightened and less productive mines and oil wells became a more important source of production. Since mining and oil and gas extraction are highly capital intensive industries, however, their increased importance raised the average level of capital per worker, which resulted in a partially offsetting positive influence on business sector labour productivity.
6
Innovation is defined, according to the OECD-Eurostat Oslo manual, as “the implementation of a new or significantly improved product, or process, a new marketing method, or a new organizational method in business practices, workplace organization or external relations”.
7
See, for example, Griliches and Mairesse (1990), Wang and Tsai (2003), and Nadiri and Purcha (1990).
8
See, for example, Coe and Helpman (1995) and Keller (2004).
9
The indicators of innovation activity relate to: the proportion of firms introducing new or significantly improved products/processes; business assessments of innovation activity; and the number of patented innovations in the United States, EU and Japan. Technology diffusion is based on indicators of: import of foreign technology; business assessments of the application of new technology; and share of firms involved in technology collaboration.
INTERNATIONAL PRODUCTIVITY MONITOR
7
Canada’s poor performance in relation to the
Chart 6 MFP and R&D, M&E, and ICT Intensity in the Canadian Business Sector, 2004 (US=100)
United States, our main trading and investment
70
much less innovative than their U.S. counter-
60
parts. Canadian firms spend much less per
50
worker on R&D, which is a key mechanism for
partner and our major foreign competitor, is of particular concern. As shown in Chart 6, on a number of metrics, Canadian businesses are
the development of new products and processes.
40
They also invest much less than U.S. firms in
30
equipping their workers with machinery and
20
equipment. Since M&E investment is the means
10
of accessing the most advanced technology,
0
Canada’s lower M&E intensity reflects its slower MFP
R&D Intensity M&E Intensity ICT Intensity
dian firms invest less per worker in ICT. Given
MFP: based on output per worker. R&D intensity (2002): R&D stock (assuming a depreciation rate of 0.15) per worker. M&E capital intensity: M&E capital stock per worker. ICT capital intensity (2003): ICT capital stock per worker. Sources: Industry Canada calculations based on data from Statistics Canada, U.S. Bureau of Economic Analysis and OECD.
Chart 7 Percentage of Post-Secondary Graduates in Selected Industries
the role of ICT in facilitating the application of sophisticated production, scheduling, modeling and testing systems, this suggests that Canadian firms have fallen behind in the application of various modern business processes.
Possible Causes of Our Weak Innovation Performance Exhibit 1 outlines a conceptual framework that is useful in understanding the factors influ-
(per cent)
encing business innovation. This suggests that innovation is the result of:
Canada US
80 70 60 50 40 30 20 10 0
pace of technology adoption. In addition, Cana-
•
The strategies that firms develop based on an assessment of the market environment and their competitive situation;
All Agri., Constn. Industry forestry, fishing,
Manu. Wholesale Retail
University
Transp. Fin. and Prof., and ins. sci. and warehsg. tech.
Community college
Source: Canadian Census of Population 2001, U.S. Census of Population 2000.
•
The available supply of inputs that are uti-
•
The extent to which government policies
lized in the innovative process; and create an environment that is conducive to innovation-based firm strategies and support the development of inputs that are important for business innovation.
and the Netherlands. Canada’s performance is
Is Canada’s poor record of innovation mainly
especially poor on the innovation activity sub-
a result of constraints on the supply side, weak-
th
index, where we rank 12 , falling behind the
ness in the demand for innovative inputs or
United States, Japan and most western Euro-
both? There is strong evidence that the problem
pean countries.
is not the supply of innovative inputs. While, for
8
NUMBER 16, SPRING 2008
Exhibit 1 Framework for Analyzing Business Sector Innovation Policy
Market environment
Competitors
Firm strategy
Demand for innovative inputs Level of innovative activity Supply of innovative inputs example, Canadian firms make less use of uni-
States. It is significant that, over the 1990s,
Chart 8 Company Operations and Strategy Index Ranking* (out of 121 countries)
when the real earnings of PhDs increased by 18
Country
per cent in the United States, they rose by only
United States
1
3 per cent in Canada. It does not appear that
Germany
2
PhDs, who are a key input to innovation, are in
Japan
5
short supply in Canada.
United Kingdom
9
versity-educated workers than U.S. firms (Chart 7), the supply of new PhDs graduates has been growing faster in Canada than the United
Ranking
If we look at venture capital, another input to
France
11
business innovation, the story is similar. Venture
Canada
18
capital is important to smaller firms that need
Australia
23
support for commercialization of new technolo-
Italy
32
gies. In response to concerns about the adequacy
*
of the venture funds available in Canada, a number of programs have been put in place to promote the supply of venture capital.10 However, with the exception of the two year period prior
The company operations and strategy index measures the extent to which company strategies and operating practices are oriented toward innovation versus other modes of competing.
Source: World Economic Forum, Global Competitiveness Report, 2006-2007.
to the bursting of the technology bubble in
(BERD), has been higher in Canada than the
2001, venture capital raised, measured as a per-
United States. 11 Since 1996, the cumulative
centage of business expenditures on R&D
amount of venture capital raised in Canada is
10 These include the Technology Partnership Canada (TPC) program, Labour Sponsored Venture Capital Corporations (LSVCC) tax credits and the financing programs of corporations such as Business Development Corporation (BDC) and the Export Development Corporation (EDC). 11 This is based on data from Thompson Financial.
INTERNATIONAL PRODUCTIVITY MONITOR
9
(Chart 8). We placed next to last among the G-7
Chart 9 General Business Strategy in Canada, 1999, 2001 (per cent of establishments)
countries and well behind the United States,
80
suggests Canadian businesses attach greater
which ranked first. These results are broadly consistent with a Statistics Canada survey that importance to reducing costs than to developing new products or new production techniques
60
(Chart 9). These findings are instructive, but they are partial and preliminary. They mainly
40
serve to highlight the need for further research into why Canadian firms adopt strategies which
20
lead them to engage in less innovative activity than firms in the United States. and many other
0 Reducing other Operating costs
Reducing labour costs
1999
Developing new Products / Services
Developing new Production / operating/ techniques
2001
Source: Employer portion of the Workplace and Employee Survey, Statistics Canada.
over twice the amount that has been invested,
advanced economies.
Suggestions for Future Research There are a number of possible explanations for the relatively low investment of Canadian firms in innovative activities. The potentially
resulting in a substantial “overhang” of capital.
influential factors include:
Moreover, the data show that venture capital
•
Firm factors
markets are becoming increasingly integrated
•
Firm size/scale
and that Canadian entrepreneurs can also access
•
Managerial skills and experience
foreign sources of venture capital and related
•
Market factors
expertise. So, here again, the evidence indicates
•
Market size
that it is not limitations on the supply side that
•
Industrial structure/regulations
are responsible for Canada’s comparatively low
•
Competitive pressure/rivalry
level of innovative activity.
•
Property rights protection
The appropriate focus, therefore, is on factors
•
Tax/credit structures
influencing firms’ demand for innovative inputs.
•
Foreign ownership/foreign direct
In particular, there is a need to understand why
investment
Canadian companies are less likely than U.S.
Canadian companies differ significantly from
firms to adopt strategies that involve a signifi-
firms in the United States and elsewhere with
cant commitment of resources to innovative
respect to a number of these firm and market
activities? Available international data does not
characteristics. At present, however, there is
offer much guidance on this issue. The World
only limited evidence on the significance of
Economic Forum (WEF) has developed a “com-
these factors in explaining differences in innova-
pany operations and strategy” index that mea-
tive activity.
sures the extent to which company strategies and
The small size of Canadian firms relative to
operating practices are oriented towards innova-
firms in other countries is often cited as a reason
tion. In the 2006-2007 WEF report, Canada
for our comparatively low business expenditures
th
ranked 18 out of 121 countries on this index
10
on R&D. However, small firms are no more
NUMBER 16, SPRING 2008
prevalent in Canada than the United States. The
size of the biggest firms in the United States.
Chart 10 Average Shipments per Manufacturing Establishment, 2002 (millions of Canadian dollars)
Size matters when it comes to R&D, but is that
18
the only explanation, or do Canadian firms lag
16
behind in other types of innovative activity and
14
do they also perform poorly relative to U.S.
12
firms of comparable size? Is the different distri-
10
main difference between the two countries is in the size of the very largest firms; the biggest public companies in Canada are about half the
bution of large Canadian and U.S. firms across sectors another significant factor underlying the disparity in innovative performance? A potential causal factor that has received
8 6 4
attention in a number of reports, including the
2
Annual Reports of Ontario’s Institute for Com-
0
petitiveness & Prosperity, is the different skill level of Canadian and U.S. managers. It is argued that the lower capabilities of Canadian
Canada
United States
Source: Industry Canada calculation based on Statistics Canada and US census bureau.
managers lead to less innovation-oriented firm
cover the significant fixed costs associated with
strategies and poorer performance. Differences
innovation. In 2001, the vast majority (84.7 per
between Canada and the United States, how-
cent) of Canadian enterprises served the Cana-
ever, may reflect the lower demand for the ser-
dian market rather than larger export markets.
vices of highly educated managers and business
While Canadian manufacturers export a signifi-
professionals in Canada rather than shortages in
cant portion of their shipments, Canadian ship-
supply. This explanation is more consistent with
ments per manufacturing plant are still about 40
the data showing that there is a net out-migra-
per cent smaller than that in the United States.
tion of highly qualified managers from Canada
(Chart 10).12 This suggests that North American
to the United States. The main focus, therefore,
markets are still not completely integrated and
should perhaps be not on promoting increased
Canadian firms are facing difficulties penetrat-
education, but on increasing the demand for
ing the large U.S. market.
highly qualified managers. For researchers, the
The excellent record of Swedish and Finnish
questions that need addressing are: how do man-
firms as innovators suggests that it is not the size
agerial skills affect the adoption of innovation-
of the domestic market that is the crucial factor,
based strategies? And, why do firms in Canada
at least for tradable goods and services, but
hire less-educated, and seemingly less capable,
access to large export markets. The appropriate
managers than firms in the United States?
research focus, therefore, is on the link between
Among the market factors in the above list,
market access and innovative performance.
market size deserves attention, given evidence
More specifically, there is a need to investigate
that there are economies of scale in R&D and
whether market access problems help explain
that firms with greater output are better able to
the size difference between Canadian and U.S.
12 Baldwin, Jarmin and Tang (2004) found that Canada has fewer large manufacturing plants than the United States as a share of both manufacturing output and employment.
INTERNATIONAL PRODUCTIVITY MONITOR
11
and to develop new, higher quality products.
Chart 11 Foreign Direct Investment Restrictions by Industry, Canada and the United States, 2005
Competition is also an important part of the dynamic process through which resources are transferred from poorly performing to more
1
innovative and successful firms. In a recent
0.8
study, Baldwin and Gu (2006), estimate that
0.6
about 70 per cent of overall labour productivity
0.4
growth in Canadian manufacturing is due to output reallocations across firms that result
0.2
from the competitive process.
Canada
Telecommunications
Transport
Electricity
TOTAL
Finance
Business Services
Manufacturing
Hotels & Restaurants
Distribution
Construction
0
United States
These findings point to some additional research questions. Are Canadian firms subject to less competitive pressure than firms in the United States and other advanced economies? Can weaknesses in competition account for the relatively limited innovative activity in some
Note: The scale of the indicator is 0-1 from no to complete restriction.
sectors of the economy? Is there a causal relation
Source: Koyama and Golub (2006).
between the comparatively low level of innovation in a number of Canadian industries and the
manufacturing establishments. If Canadian
restrictions impeding the flow of foreign direct
firms do face significant barriers in export mar-
investment into these sectors?
kets, we must attempt to understand the nature of these barriers and how can they be addressed.
Conclusion
Another issue that merits examination is the
Productivity growth holds the key to our
extent to which Canada realizes the potential
future economic prosperity and innovation is
gains from foreign direct investment. There is
crucial to productivity growth. Evidence also
considerable evidence showing that multina-
indicates that there is considerable scope for
tional enterprises are important vehicles for the
Canadian firms to upgrade their performance
diffusion of knowledge and skills across national
through the implementation of strategies that
boundaries. Studies have documented the
are more on par with the innovation-oriented
favourable innovative performance of MNE
approach of companies in the United States and
affiliates in Canada and the contribution for-
other G-7 countries.
eign-controlled firms make to increasing inno-
However, there remain important gaps in our
vation and improving productivity within
understanding of the determinants of productiv-
Canada. At the same time, however, OECD data
ity growth. Further research is needed to iden-
indicate that Canada has restrictions on inward
tify the firm and environmental factors that have
foreign direct investment in many sectors that
the most significant influence on business inno-
are high by international standards and well
vation and to determine what actions govern-
above those in the United States (Chart 11).
ments could take to encourage increased
A related question pertains to the strength of
investment in innovative activities.
competition within Canada. In markets that are
Industry Canada is attempting to address
highly competitive, firms are under pressure to
these knowledge gaps in its research program on
adopt more efficient practices and technologies
the “demand for innovation in the business sec-
12
NUMBER 16, SPRING 2008
tor”. In collaboration with other research organizations inside and outside government, the department seeks to achieve a better understanding of how business innovation is conditioned by factors such as: •
The size of markets and the size of firms;
•
The intensity of competition in specific industries;
•
The regulations that affect the price of inputs and outputs (e.g. electricity prices);
•
The way business ownership and industry structures are organized and the technical skills of management. In coming years, as a result of this and other
research initiatives, we will hopefully arrive at an improved understanding of the main factors underlying the poor performance of Canadian firms relative to their U.S. counterparts and of the policy actions that could be taken to help Canadian business become more innovative and productive.
References Baldwin, J., R. Jarmin and J. Tang (2004) “Small North American Producers Give Ground in the 1990s,” Small Business Economics, Vol. 23, pp. 349–361.
INTERNATIONAL PRODUCTIVITY MONITOR
Baldwin, J. and W. Gu (2006) “Competition, Firm Turnover and Productivity Growth,” 11F0027MIE No. 42, Statistics Canada. Coe, D. and E. Helpman (1995) “International R&D Spillovers,” European Economic Review, May, Vol. 39, No. 5, pp. 859-887. Griliches, Z. and J. Mairesse (1990) “R&D and Productivity Growth: Comparing Japanese and US Manufacturing Firms,” in Charles Hulten (ed.), Productivity Growth in Japan and the United States (Chicago: University of Chicago Press.) Keller, W. (2004) “International Technology Diffusion,” Journal of Economic Literature, September, Vol. 42, No. 3, pp. 752-782. Koyama, T. and S. Golub (2006) “OECD’s FDI Regulatory Restrictiveness Index: Revision and Extension to More Economies,” OECD Economics Department Working Paper No. 525. Nadiri, I. and I. Prucha (1990) “Comparison and Analysis of Productivity Growth and R&D Investment in the Electrical Machinery Industries in the United States and Japan,” in Charles Hulten (ed.) Productivity Growth in Japan and the United States (Chicago: University of Chicago Press). OECD (2003) Sources of Economic Growth in the OECD Countries. OECD (2004) “Benchmarking Innovation Performance and Framework Conditions: Contribution from Denmark and Norway,” DSTI/ IND(2004)6, Paris.. Wang, J-C. and K-H Tsai (2003) “Productivity Growth and R&D Expenditure in Taiwan’s Manufacturing Firms,” NBER Working Paper No. 9724, May.
13