Agence Française de Développement
Working Paper October 2006
31
The Brain Drain: What Do We Know?* Frédéric Docquier, FNRS and IRES, Université Catholique de Louvain (Belgium) and World Bank (USA),
[email protected] Khalid Sekkat, DULBEA, Université Libre de Bruxelles (Belgium),
[email protected]
* The authors thank Valérie Reboud for very constructive comments on a previous version of this report.
Département de la Recherche Agence Française de Développement 5, rue Roland Barthes 75012 Paris < France Direction de la Stratégie www.afd.fr •
[email protected] Département de la Recherche
Contents
Abstract/Résumé
4
1.
Introduction
5
2.
How important is the brain drain?
7
2.1.
The determinants of the brain drain
7
2.2.
Measuring the brain drain: methodology issues
9
2.3.
How big is the brain drain?
10
2.4.
Emigration by occupation - medical brain drain
15
3.
Should we eliminate the brain drain?
16
3.1.
Brain drain, human capital and growth
16
3.2.
Ex-ante human capital formation
18
3.3.
Remittances
20
3.4.
Return migration
21
3.5.
Diaspora externalities
23
3.6.
Governance and corruption
24
3.7.
Summary
25
4.
Policy discussion
26
4.1.
Immigration policy
26
4.2.
Education policy
28
4.3.
At the agenda
29
References
30
© AFD Working Paper No 31 • The Brain Drain: What Do We Know?
2
List of figures 1.
Contribution of the EU15 in the international brain drain
12
2.
Long-run trends in skilled emigration
12
3.
Rate of medical brain drain - 25 most affected countries in 1990 and 2000
15
4.
Medical and general brain drain
15
5.
Simulated contribution of skilled migrants rate (X axis) to human capital (Y axis)
27
List of tables 1.
Elasticity of the emigration rate (at the mean values) Dependent variable = emigration rate (in percentage); Tobit regressions
8
2.
Data by country group in 2000
11
3.
Top-30 most affected countries
14
4.
Brain drain and human capital in developing countries Counterfactual experiment: skilled emigration rate = unskilled emigration rate
19
© AFD Working Paper No 31 • The Brain Drain: What Do We Know?
3
Abstract / Résumé
Is the brain drain a curse or a boon for developing countries?
La fuite des cerveaux est-elle un fléau ou un avantage pour
In the face of it, what are the policy options open to
les pays en développement ? Quels sont les outils politiques
international organizations and home country governments?
à la disposition des organisations internationales et des
This paper reviews what is known to date about the
gouvernements des pays d’émigration ? Le papier présente
magnitude of the brain drain from developing to developed
les connaissances disponibles à ce jour sur l’ampleur des flux
countries and the way such skilled migration affects the
migratoires de travailleurs qualifiés et sur leurs conséquences
source countries. In a first, descriptive section, we
pour les pays d’émigration. Une première partie descriptive
characterize the determinants, evolution and spatial
dépeint les déterminants, évolutions et distribution spatiale
distribution of the brain drain. We distinguish several
de la fuite des cerveaux. Différentes mesures fondées sur le
measures based on education attainment, age of entry and
niveau atteint d’éducation, l’âge d’arrivée sur le territoire et
occupation. We then review the traditional literature and
l’emploi occupé sont distinguées. Une revue de littérature
explain why the brain drain is a major issue of concern for
explique ensuite pourquoi la fuite des cerveaux est un enjeu
origin countries. Section 3 provides a theoretical and
crucial pour les pays d’émigration. Cette section 3 éclaire les
empirical discussion of the various channels through which
débats théorique et empirique sur les différents canaux par
the brain drain positively impacts on sending countries.
lesquels la fuite des cerveaux a des retombées positives
Finally, we discuss the implications for migration, education,
sur le pays d’origine. Enfin, nous abordons les implications
and taxation policies.
pour les politiques de migration, d’éducation et de fiscalité.
© AFD Working Paper No 31 • The Brain Drain: What Do We Know?
4
1. Introduction
For the last decades, the pace of international migration
selected immigrants; for example, in 1997, 50,000
has accelerated. The number of international migrants
professional specialists and entrepreneurs immigrated to
increased from 154 to 175 million between 1990 and 2000
Canada with 75,000 additional family members, representing
and is nearing 200 million in the recent years. The
58% of total immigration. In the US, since the Immigration
consequences for countries of origin and destination have
Act of 1990 - followed by the American Competitiveness
attracted the increased attention of policymakers, scientists
and Work Force Improvement Act of 1998 - emphasis has
and international agencies. In particular, the migration of
been put on the selection of highly skilled workers, through
skilled workers (the so-called brain drain) is a major piece of
a system of quotas favoring candidates with academic
the migration debate. The transfer of human resources has
degrees and/or specific professional skills. For the latter
undergone extensive scrutiny in developing countries, but
category, the annual number of visas issued for highly skilled
also in industrialized countries such as Canada, the United
professionals (H-1B visas) increased from 110,200 in 1992
Kingdom and Germany, where an important fraction of
to 355,600 in 2000, the totality of this increase due to
talented natives are working abroad. As part of globalization
immigration from developing countries. About half of these
process and given the orientation of immigration policies in
workers now come from India.
some receiving countries, the brain drain issue becomes more and more important.
In European Union (EU) countries, immigration policies are less clear and still oriented toward traditional targets such as
There is a fair amount of evidence suggesting that the
asylum seekers and applicants requesting family reunion.
number of skilled migrants is now much more extensive
However, there is some evidence suggesting that European
than it was two or three decades ago. For example, Haque
countries are also leaning toward becoming quality-selective.
and Jahangir (1999) indicate that the number of highly skilled
As reported in Lowell (2002b), “European Commission
emigrants from Africa increased from 1,800 a year on average
President Prodi has called for up to 1.7 million immigrants
during the period 1960-75 to 4,400 during 1975-84 and
to fill EU-wide labor shortage through a system similar to the
23,000 during 1984-87. These trends were confirmed in the
US green cards for qualified immigrants”. A growing number
1990s in the face of the increasingly “quality-selective”
of EU countries (including France, Ireland and the UK) have
immigration policies introduced in many OECD countries.
recently introduced programs aiming at attracting a qualified
Since 1984, Australia’s immigration policy has officially
labor force (especially in the field of information,
privileged skilled workers, with the candidates being selected
communication and technology - ICT) through the creation
according to their prospective “contribution to the Australian
of labor-shortage occupation lists (see Lowell, 2002a). In
economy”. In November 1991, the New Zealand immigration
Germany in February 2000, Chancelor Schröder announced
policy shifted from a traditional “source country preference”
plans to recruit additional specialists in the field of information
towards a “points-system” selection, similar to that in
technology. Green cards came into force in August 2001,
Australia (Statistics New Zealand, 2004). The Canadian
giving German ICT-firms the opportunity to hire up to 20,000
immigration policy follows similar lines, resulting in an
non-EU ICT-specialists for a maximum of five years. More
increased share of highly-educated people among the
recently, the German Sübmuth Commission recommended
© AFD Working Paper No 31 • The Brain Drain: What Do We Know?
5
1. Introduction
the introduction of a coherent flexible migration policy that
and exhaustive data sets on migration stocks and rates by
allows for both temporary and permanent labor migrants
educational attainment. These data sets enable primary
(see Bauer and Kunze, 2004). In 2002, the French Ministry
assessments of the theoretical mechanisms developed in the
of Labor established a system to induce highly skilled
literature. The purpose of our paper is to offer a
workers from outside the EU to live and work in France. The
comprehensive and accurate picture of the brain drain and
current French government is taking decisions in favor of an
to provide an updated survey of existing empirical and
”immigration choisie” instead of ”immigration subie”. The
theoretical studies.
purpose is to reorient the structure of immigrants towards more skilled people. Given the apparent demographic
In Section 2, we characterize the determinants, evolution
problems and aging populations, the intensity of the brain
and spatial distribution of the brain drain. Our analysis relies
drain could increase further during the next decades.
on Docquier and Marfouk (2006) who provide a comprehensive data set on international skilled emigration
Many economists studied the possible impact of the brain
for 1990 and 2000. They count as skilled migrants all foreign-
drain on origin countries and inequality across nations. The
born individuals with tertiary education living in an OECD
early literature dates back to the 1960s and 1970s and
country. We also discuss alternative measures, which control
supports the view that skilled migration is unambiguously
for the age of entry (i.e. excluding the skilled foreign-born
detrimental for those left behind. The main argument is that
arrived before age 12, 18 or 22).1 Finally, by comparing
migrants’ contribution to the social return of their country of
emigration rates of the tertiary skilled to medical brain drain
origin was greater than their private return. Such a negative
rates, we show that these average skilled emigration rates
effect has been reformulated in an endogenous growth
may hide important shortages in developing countries.
framework. More recently, some channels through which the brain drain may positively affect the sending economy
In Section 3, we draw on theoretical and empirical studies
have also been presented in the literature. These include a
to explain why the brain drain is a major issue of concern to
range of “feedback effects” such as remittances, return
origin countries. We first discuss the role of human capital
migration after additional knowledge and skills have been
in the new growth theory and survey the traditional literature
acquired abroad, the creation of business and trade
on the negative effects of skilled emigration. The subsequent
networks, and the effect on migration prospects on the
sub-sections provide discussions of the various channels
expected return to education. The debates essentially
through which the brain drain may positively impact on
remained theoretical. The reason is that, until recently and
sending countries. These include remittances; return
despite some anecdotal evidence, there were no reliable
migration; skilled migrants’ participation to business and
databases documenting the brain drain for a large set of
scientific networks2 ; ex-ante human capital investments
countries and for different years.
and improved governance.
Understanding and measuring all the mechanisms at work
In the last Section, we put forward the need for additional
requires reliable data and empirical analysis. Fortunately, it
macro and micro studies. In the light of the theoretical and
is today possible to have a more accurate vision of the size
empirical results above, we discuss the implications for
and intensity of the brain drain thank to new harmonized
migration, education, and taxation policies.
1. Immigrants who arrived before age 12, 18 or 22 are partly or totally educated in the host country. 2. This favors exchanges of goods, capital inflows (FDI) and knowledge spillovers between the migrants’ home and host countries.
© AFD Working Paper No 31 • The Brain Drain: What Do We Know?
6
2. How important is the brain drain?
Many authors underlined the lack of harmonized and
distinguish between the different categories of emigration;
consistent data on international immigration stock in receiving
in particular by skill levels. This may pose problems to the
countries. Recently, the IOM (2005, p. 141) notes “that the
understanding of the brain drain phenomena if emigrants'
exact number of migrant living in Europe is still unknown. This
behavior differs according to the skill levels. This issue is
is partly due to the fact that, in contrast to Australia, Canada,
examined in Section 2.1 which focuses on the determinants
New Zealand and the US, many European countries, use
of immigration. It shows that immigration behavior indeed
nationality, not the place or country of birth, as the standard
differs according to skill levels. To understand the brain drain
criterion in their demographic, economic and social
phenomena, one should, therefore, collect immigration data
statistics". In such context, it is not possible to differentiate
according to skill levels. This induces methodological issues
between a person who is born in a foreign country and came
that are discussed in Section 2.2. Taking account of such
to the host one afterward and another who is born in the host
issues, leads to accurate estimates of brain drain that are
country but does not have the citizenship. The distinction is
examined in Section 2.3. Finally, skilled workers' immigration
important when dealing with the brain drain because the
may harm the origin country not only because of the loss of
education of the former was paid by the origin country while
return to education but also because it worsens the shortage
the education of the latter was paid by the host country.
of some profession in that country. This is illustrated with the
Similarly, the official statistics in countries of origin do not
medical brain drain in Section 2.4.
2.1. The determinants of the brain drain
The intensity of the brain drain can be explained by many
Based on the Docquier-Marfouk data set (see Sections 2.2
push/pull factors and by geographical, historical and linguistic
and 2.3), Marfouk (2006) recently used bilateral emigration
distances between countries. A large empirical literature has
data from 153 developing countries to 30 receiving countries
examined the determinants of international migration flows
in 2000 to estimate the determinants of bilateral emigration
in aggregated models disregarding the education level of
stocks. Many bilateral data are equal to zero. To account for
migrants. For instance, Hatton and Williamson, (2002) pointed
this problem, the Tobit model is used3.
to the following factors as determinants of migration: • The difference in income across countries.
Table 1 gives the elasticity of bilateral emigration rates to all
• The share of population between 15 and 39 years old
explanatory variables, distinguishing low-skill, high-skill and
in the origin and host countries.
all migrants. The main results are the following:
• The stock of immigrants • The extent of poverty in the country of origin.
• High-skill workers are more affected by differences in terms of living standards. A ten percent increase in the
3. Some variables (e.g. consumption spending or number of immigrants) take only positive values. The methodology used to forecast their evolution should take account of this characteristic. Otherwise, one may obtain forecasted values that are negative. The Tobit method addresses this problem.
© AFD Working Paper No 31 • The Brain Drain: What Do We Know?
7
2. How important is the brain drain?
income per capita gap between receiving and sending
skilled migration is more affected by job opportunities
countries results in an increase of high-skill emigration
at destination than low-skilled migration.
rate by 7.9%, to be compared with 4.5% for low-skill
• The population in the receiving country is a proxy of the
workers and with 6.5% for the average migrants.
immigration capacity and of economic opportunity at
• The effect of distance is negative for both skilled and
destination. Related to the income effect, skilled
unskilled workers, and the effect of distance squared
workers are more sensitive to economic opportunities.
is positive, i.e. the marginal effect of distance is
• Social welfare programs affect positively both skilled
decreasing.
and unskilled migration.
• Past colonial links are important. The impact of this
• The size of young cohorts in the country of origin is an
variable is more pronounced for unskilled workers.
important factor that drives South-North migration.
• Skilled and unskilled emigration rate are inversely
• Importantly, more deaths in civil wars induce more
related to unemployment rate at destination. High-
emigration for both skilled and unskilled.
Table 1. Elasticity of the emigration rate (at the mean values) Dependent variable = emigration rate (in percentage); Tobit regressions Low-skilleds
High-skilled
Total
GNI, PPP adjusted, per capita "destination/origin" ratio
0.4490**
0.7876**
0.6476**
-2.94
-5.29
-4.41
GNI, PPP adjusted (origin), 1000
0.9182**
1.1537**
1.1049**
-4.49
-5.78
-5.61
GNI, PPP adjusted, (origin), 1000, squared
-0.2571**
-0.3267**
-0.3090**
-3.66
-4.77
-4.56
Geographic distance (origin-destination), 1000 kms
-1.4607**
-1.2108**
-1.4648**
-8.12
-6.85
-8.43
Geographic distance (origin-destination), 1000 kms squ.
0.4487**
0.1818
0.3987**
-4.42
-1.81
-4.08
Former colonial ties
0.0631**
0.0404**
0.0316**
-13.75
-9.19
-7.2
Linguistic proximity
-0.0016
0.0838**
0.0458**
-0.14
-7.79
-4.28
Population (destination), in log
3.6510**
5.4343**
4.5875**
-10.49
-15.56
-13.42
Unemployment rate (destination), in percent
-0.2697**
-0.3287**
-0.2574**
-4.5
-5.6
-4.49
Level of diversity (destination)
0.1956**
0.1900**
0.2087**
-3.87
-3.85
-4.27
Public social expenditures, (destination), in percent of GDP
1.3086**
1.1997**
1.0912**
-10.03
-9.33
-8.65
Immigration policy (EU15)
-0.1515**
-0.2157**
-0.1846**
-3.99
-5.74
-5
Immigration policy (CAN, AUS, NEZ, USA)
0.1082**
0.1753**
0.1287**
Religious fractionalization (origin)
-6.8
-11.21
-8.4
0.0712
0.1328**
0.1094*
-1.42
-2.7
-2.25
Population 15-29 (origin), in percent of the total population
1.4877**
1.5974**
2.3277**
-6.12
-6.68
-9.97
Civil wars (origin) - battle deaths
0.0167**
0.0149**
0.1324*
-2.55
-2.32
-2.08
Numbers between brackets are the absolute values of the t-ratios; ** significant at 1%; *significant at 5%. Source: Marfouk (2006)
© AFD Working Paper No 31 • The Brain Drain: What Do We Know?
8
2. How important is the brain drain?
• Linguistic proximity is significant only for high-skill
These regressions show that the determinants of migration
migrants. The explication is that the skills acquired
vary across education group. A global regression without
prior to migration are more transferable to the
education distinction then hides a very strong heterogeneity.
destination countries sharing the same language.
All these results have important policy implications. Host
• Finally, the EU immigration policy discourages both
countries' policy affects, in general, only the immigrant
high-skill and low-skill emigration. The elasticity is
destination choice but not the willingness to immigrate
particularly negative for the skilled. In contrast, the
according to the skill level. The resulting change in the skill
four traditional immigration nations (Australia, Canada,
composition of immigration is likely to be smaller than
New Zealand, and the United States) favor all types of
expected.
immigration but mainly skilled immigration.
2.2. Measuring the brain drain: methodology issues
Controlling for the education level
migration was not taken into account which may overestimate migration from South to North.
The first and obvious methodology issue that one should deal with is the distinguish migrants according to the education
Generalizing their work, Docquier and Marfouk (2006) provide
level. The first serious effort to put together an harmonized
a comprehensive dataset on international skilled emigration.
international dataset on migration rates by education level is
The construction of the database relies on two steps: i)
due to Carrington and Detragiache (1998, 1999) from the
collection of Census and register information on the structure
International Monetary Fund, who used US 1990 Census
of immigration in all OECD countries (this solves the
data and other OECD statistics on international migration to
transposition and under reporting problems noted for
construct estimates of emigration rates at three education
Carrington Detragiache); summing up over source countries
levels (primary, secondary and tertiary schooling) for about
allows for evaluating the stock of immigrants from any given
60 developing countries.
sending country to the OECD area by education level, and
4
ii) the educational structure of emigration is then compared Although Carrington and Detragiache’s (1998) study clearly
to that of the population remaining at home, which allows for
initiated new debates on skilled migration, their estimates
computing emigration rates by educational attainment in
suffer from a number of limitations. In particular: i) they
1990 and 2000. A similar work can be found in Dumont and
transposed the education structure of the US immigration to
Lemaître (2005).
the immigration to the other OECD countries (transposition problem); ii) immigration to EU countries was estimated
Controlling for the age of entry
based on statistics reporting the number of immigrants for the major emigration countries only, which led to
Counting all foreign born individuals as immigrants
underestimate immigration from small countries (under
independently of their age at arrival, both Carrington-
reporting problem); iii) no distinction was made between
Detragiache and Docquier-Marfouk data sets do not distinguish
immigrants arriving as children and immigrants arriving as
between ’family’ and ’personal’ migration. Some of the skilled
young adults or older with source country education
foreign-born obviously migrated at very young age and had their
background, and, iv) due to lack of data, South-South
education in the receiving country. As illustrated by Rosenzweig
4. The emigration rate by skill levels from country (
) to natives, i.e. residents (
at time
) and emigrants
is defined as the ratio of emigrants , where
© AFD Working Paper No 31 • The Brain Drain: What Do We Know?
stands for the skill level (e.g. high or low).
9
2. How important is the brain drain?
(2005) using US data, children migration represents an
those arrived in the receiving country after age 12, 18 or 22.
important fraction of migrants for a couple of countries. Should
They use data on age of entry collected in a sample of OECD
those who came at young age be considered as skilled
countries and then econometrically estimate the age-of-
migrants? Where should we put the frontier?
entry structure in the remaining host countries. The countries where such information is available represent 77 percent of
Beine, Docquier and Rapoport (2006) provide alternative
total skilled immigration to the OECD area.
measures of the brain drain by defining skilled immigrants as
2.3. How big is the brain drain?
Controlling for the education level
drain, the most affected regions are the Caribbean and the Pacific, which consist of relatively small islands, and Sub
Table 2 summarizes the data from Docquier and Marfouk
Saharan and Central American countries. The difference
(2006) for different country groups in 2000. Countries are
between skilled and total emigration rates is especially strong
grouped according to demographic size, average income
in Africa.
(using the World Bank classification), and region. As expected, we obtain a decreasing relationship between
Docquier, Lohest and Marfouk (2005) analyze the impact of
emigration rates and country size, with average emigration
the EU15 (European Union with 15 members) on the
rates about 7 times higher for small countries (with population
international mobility of skilled workers. Compared to other
lower than 2.5 million) than for large countries (with population
OECD countries, the average skills of EU15 immigrants are
higher than 25 million). From the last two columns, we can
low. However, by attracting an important proportion of African
see that these differences cannot be attributed to the
migrants, the EU15 plays an important role in the brain drain
educational structure of the home country population or to
debate. The EU15 is an important source of brain drain for
a higher ’selection bias’ (ratio of skilled to total emigration
countries which are strongly concerned by human capital
rates) in small countries. Small countries simply tend to be
shortages. Regarding exchanges of skilled workers with the
more open to migration.
other traditional immigration countries, the EU15 experiences a large deficit. This deficit is compensated by importing
Regarding income groups, the highest emigration rates are
human capital from developing countries. Figure 1 illustrates
observed in middle income countries where people have
this impact of the EU immigration on the losses of human
both the incentives and means to emigrate. High income
capital in developing countries by comparing country-specific
countries (low incentives) and low income countries (where
skilled emigration rates (X-axis) and the European
liquidity constraints are likely to be more binding) exhibit
contribution in these losses, measured as the share of the
the lowest rates. The global picture is therefore that of an
EU15 in the brain drain (Y-axis). We consider that the EU15
inverted U-shaped relationship between income levels and
contribution is high (respectively very high) when the share
(skilled) migration.
of skilled emigrants living in the EU15 exceeds the share of
5
the EU15 (respectively twice the share of the EU15) in the Such an assertion should be econometrically tested as it is
total OECD population. Similarly, we consider that countries
strongly dependent on the group composition in terms of
suffering from the brain drain are those experiencing a loss
country size. Regarding the regional distribution of the brain
higher than 30 percent; that is countries on the right of the
5. In this context, liquidity constraints play a role similar to the one in the Life-Cycle/Permanent-Income literature. In the absence of liquidity constraints (which is a form of capital market imperfections), a person whose return to education is higher than the cost of education can educate itself even if it lacks the financial resources to do so. It can borrow on the capital market to finance its education and reimburse once it gets the return. If capital market is imperfect, the person can not borrow and, hence, can not educate itself because of liquidity constraints.
© AFD Working Paper No 31 • The Brain Drain: What Do We Know?
10
2. How important is the brain drain?
Table 2. Data by country group in 2000 % of world pop.
By country size
% of OECD immigration stock
Share of skilled workers
Rate of emigration
in %
Total
Skilled
Total
Skilled
Selection bias
Large countries (Pop>25 million)
84.2%
60.6%
63.9%
1.3%
4.1%
3.144
In residents In migrants 11.3%
Upper-Middle (25>Pop>10)
10.0%
15.8%
15.2%
3.1%
8.8%
2.839
11.0%
33.2%
Lower-Middle (10>Pop>2.5)
5.2%
16.4%
15.7%
5.8%
13.5%
2.338
13.0%
33.1%
Small countries (Pop 4 Million)
2. How important is the brain drain?
14
2. How important is the brain drain?
2.4. Emigration by occupation - medical brain drain General emigration rates may hide important shortages in
with efficient education systems (Ireland, Luxemburg). Among
some occupations. In many poor countries, shortages are
the 25 most affected countries, we have 11 African countries
particularly severe in the medical sector where the number
(Cape Verde, Sao Tome and Principe, Liberia, Ethiopia,
of physicians per 1000 inhabitants is far below the acceptable
Somalia, Ghana, Uganda, Malawi, Zimbabwe, Gambia,
threshold of 2 defined by the World Health Organization.
South-Africa) where the health care staff is lacking.
The brain drain of physicians and nurses to countries such as the US, Australia, Canada and the UK is one of the multiple
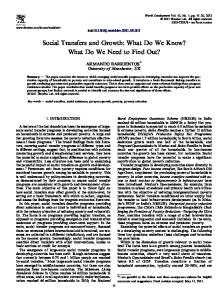
Figure 4 presents the relationship between medical and
causes of shortage. For instance, Faini (2006) reported that
general brain drain. We see that the correlation coefficient
Jamaica had to train five doctors to retain just one, Grenada
between the medical brain drain and the general brain drain
22. To illustrate this phenomenon, we have collected data on
is about 41 percent.6 Moreover, the elasticity of medical
doctors with foreign qualification working in the 17 main
brain drain to general brain drain amounts to 46 percent. This
OECD countries. Aggregating these data and comparing
means that when the general brain drain increases by 100%
them to the total number of doctors who qualified in their
the medical brain drain increases by 46%. However, many
country, we have computed medical emigration rates for all
observations are far from the general trend. Despite moderate
the world countries. Figure 3 gives the rate observed in the
general rate of skilled migration, some countries suffer from
25 most affected countries. It shows that small countries are
a strong medical brain drain.
strongly affected, including some industrialized countries
Figure 3. Rate of medical brain drain - 25 most affected countries in 1990 and 2000
Figure 4. Medical and general brain drain 5
1 0.9
4 Medical brain drain (Physicians)x 100 (in logs)
0.8 0.7
1990
0.6
2000
0.5 0.4 0.3 0.2 0.1
y = 0.46x + 1.45 2 R = 0.41
3
2
1
0 -4
-3
-2
-1
0
1
2
3
4
5
-1
ia
ica
mb
a Tim or
Afr uth
So
Ga
Eas t
we
aic
bab
ep
General Brain drain 22+ x 100 (in logs)
Jam
Zim
nR
law i
ica
Ma
and a Lan ka
Ug
Sri
Do
min
ana Gh
-2
Ha iti Lux em bou rg
Lib eria N.G uin ea Ice lan d So ma lia Eth iop ia Irela nd St Kit tsNe vis pua
Pa
é&P
Fiji rinc ipe
ia
e
Luc
Verd pe
Ca
Sã oTo m
int
Sa
Gre
Do
nad a min ica
0
6. The correlation coefficient gives the percentage of the evolution of a given variable (in our case this is the medical brain drain) that is associated with the evolution of another variable (in our case this the general brain drain). A coefficient equal to 0 implies no association while a coefficient of 1 implies a complete association. The reported coefficient implies that 41% of the medical brain drain is associated with the general brain drain phenomena.
© AFD Working Paper No 31 • The Brain Drain: What Do We Know?
15
3. Should we eliminate the brain drain?
As described in Section 1, early research supported the
examines separately each of the main mechanisms at play.
view that skilled migration is unambiguously detrimental for
These include the impact on human capital formation
those left behind. In contrast, more recent research argues
(Section 3.2), the role of remittances (Section 3.3), the impact
that the brain drain may positively affect the sending
of return migration (Section 3.4), the effects of diaspora
economy. This section offers a non technical discussion of
externalities (Section 3.5) and the impact on governance
the debate and summarizes the existing empirical evidence.
and corruption (Section 3.6). The latter constitutes a very
It starts with a discussion (Section 3.1) of the relationship
recent development in the literature and examines whether
between the brain drain, human capital and growth which
brain drain incites the country of origin to improve its
provides a general framework for the debate. It then
institutional framework and governance.
3.1 Brain drain, human capital and growth
As generations of economists and other social scientists
views. During the 1970s, a series of models (for example,
have argued, the emigration of the most talented workers is
Bhagwati and Hamada 1974, McCullock and Yellen 1975,
likely to reduce the average level of human capital of the labor
1977) based on more realistic institutional settings (domestic
force. All other things equal, such a decrease in human
labor markets rigidities, imperfect information, technological
capital has a direct negative impact on output per capita. By
complementarities between skilled and unskilled labor, etc.)
increasing the marginal productivity of human capital, it also
were then developed to emphasize instead the negative
induces redistributive effects from the low-skill to the high-
consequences of highly skilled emigration for developing
skill workers. In the medium and long-run, a decrease in
countries. They supported that the brain drain is a negative
human capital seriously affects the country capacity to
externality imposed on those left behind and that the game
innovate and adopt modern technologies. Hence, the brain
is of a zero sum type; with the rich countries getting richer and
drain impacts negatively on growth.
the poor countries getting poorer. From a policy perspective, they ask the international community to implement a
Interestingly, in the 1960s the economic literature (for example,
mechanism whereby international transfers could compensate
Grubel and Scott 1966, Johnson 1967) had a tendency to
the origin countries for the losses incurred. This may take the
downplay the negative externalities imposed on those left
form of an income ’tax on brains’ (known as ’Bhagwati Tax’)
behind (Grubel and Scott even termed them ’negligible’) and
to be redistributed internationally.
insisted on the role of remittances and other potential positive feedbacks. With standard trade theoretic frameworks in mind,
Bhagwati and Hamada (1974) developed an interesting model
this literature generally emphasized the welfare gains from free
in which the increasing international integration of the market
migration at a global level and rejected concerns about
for skilled workers induces a loss for the poor countries.
negative static and dynamic effects of the brain drain on the
They did not use the externality argument presented in the
ground that they were inspired by ’nationalistic’ and ’outdated’
previous section but assumed that educated elites bargain for
© AFD Working Paper No 31 • The Brain Drain: What Do We Know?
16
3. Should we eliminate the brain drain?
high wages. A higher integration of the skilled labor market
where
makes international skilled wages observable and induces the
specialization
is a parameter denoting the importance of skillin the aggregate stock of human capital;
educated elite to bargain for higher wages. Unskilled workers
is the proportion of worker with skill
adjust their wage requirements on skilled wages. Hence, the
aggregated stock of ”efficient” human capital.
;
is the
higher integration of the skilled labor market generates some leapfrogging effects on low wages. In conclusion, although
If one component
skilled emigration reduces unemployment of the educated and
tends to zero. In other words, sector's shortages cause a
stimulates education, it also yields two detrimental responses:
substantial reduction of efficient level of human capital and
higher public education expenditures and taxes; higher wages
in output per capita. This effect can be reinforced by the fact
and unemployment of the uneducated. On the whole,
that individual governments have less incentive to provide
Bhagwati and Hamada derive the conditions under which
internationally applicable education when graduates leave
integration induces a decrease in per capita income in poor
their country. Poutvaara (2004) addresses this important
countries.
issue in a theoretical model where the possibility of a brain
falls to zero, the aggregate stock also
drain distorts the provision of public education away from Modern theories of endogenous growth have considerably
internationally applicable education towards country-specific
renewed the analysis of the relationships between education,
skills. Country-specific skills may include both tertiary
migration and growth. Unsurprisingly, the first models to
education with national emphasis, like degrees in law and
address the issue of the brain drain in an endogenous growth
certain humanities, and also secondary education which is
framework also emphasized its negative effects (e.g.,
less mobile. Correspondingly, internationally applicable
Miyagiwa, 1991, Haque and Kim, 1995). Some of the models
education may include, in addition to science-based,
emphasized shortages in specific knowledge field that can
commercial and other internationally applicable degrees in
be strongly harmful for developing countries. Lucas (2004),
tertiary education, those held in secondary education (like
focusing on the choice of major field of study (medicine,
nurses) which are internationally mobile. In order to avoid the
nursing, maritime training) among Filipino students, reported
loss of a part of its investment in human capital, the
that their choice responds more to shifts in international
government has the incentive to offer more education which
demand than to national needs. When foreign and national
is national specific (e.g. law) than education that can be
countries have different needs, the perspective of migration
valued abroad (e.g. science or commercial). At the end, this
can lead to important shortages in some sectors.
means educating too few engineers, economists and nurses and doctors, and too many lawyers. Poutvaara shows that
Specific shortages can be strongly harmful for developing
such an outcome could be avoided by introducing graduate
countries. Remind that the space shuttle Challenger
taxes or income-contingent loans, collected also from
exploded because of malfunctioning of small components
migrants. By giving the providers of internationally applicable
called O-rings. This illustrates the strong complementarity of
education a stake also in efficiency gains earned elsewhere,
different components and inputs of a production process.
graduate taxes would encourage sending countries to invest
Kremer (1993) proposed such an ”O-ring theory” of economic
more in internationally applicable education.
development in which the production process consists of a series of tasks. Deficiencies in any of those tasks can lead
The negative impact of the brain drain on the country of origin
to substantial reduction in the value of output. In an attempt
reported in the above studies is closely linked to specific
to transpose this O-ring theory to the brain drain issue,
assumptions that are “(i) Migrants self-selected themselves
suppose that human capital
out of the general population, (ii) There is free international
consists of a series of
necessary and heterogeneous skills nurses, teachers, economists, etc.)
(engineers, doctors,
mobility of skilled labor and, hence, no uncertainty regarding future migration opportunities for the educated and, (iii) There is a complete disconnection between emigrants and their country of origin once they have left. Is such conditions, clearly,
© AFD Working Paper No 31 • The Brain Drain: What Do We Know?
17
3. Should we eliminate the brain drain?
skilled emigration can only affect negatively the proportion of
assumptions may mitigate the negative impact or even reveal
educated in the remaining population.” (Docquier and Rapoport,
a positive impact of the brain drain on the country of origin.
2004; p. 9). The following sections examine how relaxing such
3.2. Ex-ante human capital formation
Before 1965, the US immigration policy was based on
migration prospects can raise the expected return to human
country-specific quotas. This quota system is now abolished
capital and induce more people to invest in education at
but various types of requirements and restrictions imposed
home. Note that Bhagwati and Hamada (1974), as well as
by the US and other country’s immigration authorities render
McCulloch and Yellen (1977), take into account the incentive
the migration decision very uncertain. Implicit or explicit
effects of the brain drain on education decisions, with the
size-quotas are effectively in place, and receiving an
increase in the expected-wage for skilled workers stimulating
immigration visa, whether temporary or permanent, requires
human capital investments. In a context of probabilistic
being in a close relationship either with relatives or employers
migration, it is possible under certain conditions detailed in
who must then demonstrate that the migrant’s skills can
these models that the incentive (or brain gain) effect
hardly be found among native workers. Moreover, in some
dominates that of actual emigration, which creates the
countries, point-systems are used to evaluate the potential
possibility of a net gain for the source country .7 The crucial
contribution of immigrants to the host economy. This means
assumption is that skilled workers have a much higher
that at all stages of the immigration process, there is a
probability to emigrate than unskilled workers. This
probability that the migration project will have to be
hypothesis is strongly supported by Docquier and Marfouk’s
postponed or abandoned. Individuals engaging in education
(2006) data which reveal that emigration propensities are
investments with the prospect of migration must therefore
five to ten times higher for workers with more than twelve
factor in this uncertainty, creating the possibility of a net
years of education than for workers with less than twelve
gain for the source country.
years of education.
Theoretical foundations
Empirical evidence
The conditions required for this possibility to materialize
What is the empirical evidence on this ”prospect” channel?
have been the subject of a number of theoretical
The first study to attempt at estimating the growth effects of
contributions (Mountford, 1997, Stark et al., 1998, Vidal,
the brain drain using cross-country comparisons is that of
1998, Beine et al., 2001). These papers all develop
Beine, Docquier and Rapoport (2001); in a cross-section of
probabilistic migration models in which the probability of
37 developing countries, and after controlling for remittances,
migration depends solely on the achievement of a given
they found that migration prospects have a positive and
educational requirement, which is observable, and not on
significant impact on human capital formation at origin,
individuals’ ability, which is not perfectly observable (i.e.,
especially for countries with low initial GDP per capita levels.
migrants are assumed to be randomly selected among those
This was a first but imperfect try since they used gross
who satisfy some kind of prerequisite with informational
migration rates as a proxy measure for the brain drain due
content regarding their ability - in our case, education). They
to the lack of comparative data on international migration by
all suggest that since the return to education is higher abroad,
education levels.
7. Using a slightly different perspective, Stark et al. (1997) elaborate on the possibility of a brain gain associated with a brain drain in a context of imperfect information with return migration. McCormick and Wahba (2000) also obtain the result that more highly-skilled migration may benefit those left behind, but in a trade-theoretic model where migration, remittances and domestic labor-market outcomes are jointly determined and multiple equilibria arise, with the high-migration equilibrium Pareto-dominating the low-migration equilibrium.
© AFD Working Paper No 31 • The Brain Drain: What Do We Know?
18
3. Should we eliminate the brain drain?
In a subsequent study, Beine et al. (2003) then used the
human capital formation, this time in a cross-section of 50
Carrington-Detragiache estimates of emigration rates for
developing countries.8 By contrast, Faini (2003) finds a
the highest (tertiary) education as their measure of brain
depressing but not significant effect of tertiary emigration on
drain; after instrumenting, they again found a positive and
domestic enrollment in higher education, a finding he
highly significant effect of migration prospects on gross
attributes to the choice by would-be migrants to pursue
Table 4. Brain drain and human capital in developing countries Counterfactual experiment: skilled emigration rate = unskilled emigration rate
Labor Force (LFx1000)
Nb of skilled workers (Yx1000)
In % of the labor force (y=Y/LF)
Labor Force (LF'x1000)
N. of skilled workers (Y'x1000)
In % of the labor force (y'=Y'/LF')
Change in the nb. of skilled (Y-Y')
Change in % of (Y')
Change in the % of skilled (y-y')
Large (>25 million)
2001110
97370
4.9%
2006533
93081
4.6%
4288
4.6%
0.2%
Large (>25 million)
2001110
97370
4.9%
2006533
93081
4.6%
4288
4.6%
0.2%
Upper-Middle (from 10 to 25)
181152
11968
6.6%
182472
12066
6.6%
-97
-0.8%
0.0%
Lower-Middle (from 2.5 to 10)
80638
6525
8.1%
81752
7104
8.7%
-578
-8.1%
-0.6%
Small (