23 Sediment Transport and Deposition in Mountain Rivers J I M BOGEN Norwegian Water Resources and Energy Administration, Oslo, Norway
INTRODUCTION: THE JOSTEDQLA MOUNTAIN RIVER BASIN In many ways, sediment transport dynamics in mountain environments differ from those of the lowlands. The high relief and the steep slopes are an obvious feature of mountain areas. The cold climate is another factor controlling runoff and erosional processes, and the distribution of vegetation is also controlled by the prevailing climate. Above the tree line, processes of erosion are more intense than those operating below. However, mountain areas are of varying character and the conditions differ greatly from one region to another and from low to high latitudes. One of the main difficulties when attempting to generalise with respect to processes of erosion and sediment transport in mountain areas is the dominating influence of bedrock geology and the thickness and nature of the overburden. The Scandinavian mountains differ in this respect from the European Alpine region: the rocks are less erodible and lakes are more frequent. Sediment sources are also unevenly distributed across drainage basins, so that only parts of the river course may be alluvial and, as a result, water discharge and sediment transport can be extremely variable. A typical mountain river basin in Scandinavia may thus be composed of a number of local erosion and sedimentation subsystems, and it may not be possible to characterise the entire system from records collected at downstream stations. One way to deal with such problems is to recognise the various types of subsystem and to take the effect of each of them into account when river basins of various regions are compared. The Josted~laRiver basin has been selected as an example of a mountain river in western Norway (Figure 23.1). Unlike the European Alps, the relief is more subdued, with an extensive plateau at 1200-1500 m above sea level (a.s.1.). A glacial valley, Jostedal, is deeply incised into this surface. Sediment in the Josted~labasin is essentially supplied from two types of sources: subglacial erosion, and erosion of moraines and glaciofluvial deposits. This is material deposited by Pleistocene glaciers and by the glacial advance during the Little Ice Age. The transport system is the watercourse of the gravel-bed River Jostedola. In some reaches it is subject to extensive braiding, and several lakes constitute local sedimentation basins. The river basin (with a catchment area to the fjord of 860 krn2; about 27% of which is glacier-covered) is situated on the northern side of the Sedi~nentand Water Quality it1 River Catchments. Edited by I.D.L. Foster, A.M. Gumell and B.W. Webb. O 1995 John Wiley &Sons Ltd.
J. BOGEN
a
Sediment transport monitoring station Glacierzovered area
0Nowglaciated area River plain
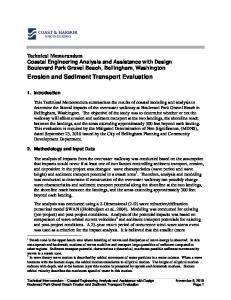
Figure 23.1 The Jostedmla River basin, showing sediment transport monitoring stations active at present: (A) Haukssgjelet, (B) Jostedal power station (diverted water), (C) Nigardsbreen glacier, (D) Fibergstmlen sandur. Numbering along the main flow axis indicates distance from river mouth. P1-P4 are the sediment transport stations referred to in Figure 23.6
439
SEDIMENT IN MOUNTAIN RIVERS
Sognefjord. Specific runoff within the river basin varies from 25 1s - ' km-' at the fjord to nearly 100 1s -' km-' at the summit of the ice-cap. This chapter reviews data from two decades of sediment transport studies. The monitoring stations are shown in Figure 23.1. Sediment transport sampling methods from before 1980 are described by Nilsson (1972), Nordseth (1974) and 0strem (1975). After 1980 automatic samplers were brought into use (Bogen 1986a, 1988, 1992). Some data have also been collected at stations outside the Jostedal area.
GLACIAL SEDIMENT PRODUCTION Glaciers are the most important sediment source in the Norwegian mountains, and the sediment transport in glacier meltwater rivers has been studied for many years. The sediment concentration in glacier meltwater streams is often subject to large fluctuations within short time intervals. There is some dependence on discharge but no obvious direct correlation. The relationship between water discharge and sediment transport is subject to continuous change through the season and from year to year (Figure 23.2; Gstrem, 1975; Bogen, 1980; Raubakken, 1982). This complex pattern may be explained by the seasonal development of the subglacial drainage system. When the water pressure increases during a melt period, sediments are supplied to the drainage system by expansion of subglacial cavities and Suspended load kgls
0
0
1
0
I
1
1
1
1
1
1 1
1
2 5 10 15 Water discharge m3/s
Figure 23.2 Water discharge plotted against suspended sediment transport in the meltwater river from Erdalsbreen glacier in 1969: (1) 12 Jun-23 Jun, (2) 24 Jun-3 Aug, (3) 4 May-28 Aug
440
J. BOGEN
tunnels. Sediments may be entrained from the glacier bed or released by the melting of ice that is loaded with debris (Figure 23.3). When glacial melting slows down in response to a drop in air temperature, subglacial tunnels are deformed by glacier movement and the weight of the overlying ice, so that after a time they may actually close. During a subsequent period of higher melt, a regeneration and possibly a new expansion of the drainage system may take place. A flood occumng later in the melt season has to exceed the magnitude of preceding floods if it is to transport a higher sediment load. The reason for this is presumably that the tunnels and cavities have to expand to allow more debris to melt out of the ice or to be washed out from the bed. During individual flood events, or parts of the melt season, correlations between sediment transport and water discharge may exist. Correlations are sometimes stronger during falling than during rising discharges. Bogen (1980) suggests that, whereas the amount of sediment remaining in transport during the falling stage of floods is determined by hydraulic variables, erosion of spatially variable sediment sources during the rising discharge stage may lead to fluctuations in sediment concentration and, hence, exhibit a lower correlation with discharge. A sediment transport monitoring programme for the meltwater river from Nigardsbreen has been in continuous operation since 1968. The transport of suspended load and bedload is subject to large variations from year to year (Figure 23.4). The mean annual transport of suspended sediment and bedload is 10.908 x lo6 kg and 8.956 x 10Qg respectively. Annual suspended load seems to be dependent on the number of flash floods rather than on the total annual discharge, so that the highest rates
Figure 23.3 Symbolic diagram indicating the way a cavity or an ice tunnel melts out sediments incorporated in the ice. (A, B ) Water pressure is rising and the subglacial tunnel or cavity is expanding. (C) Water pressure is falling and the tunnel or cavity is deformed. The continuous opening and closing of channel networks and changes in the position of a channel system may be the reason for the complicated hysteresis effects of sediment transport in glacier meltwater rivers
44 1
SEDIMENT IN MOUNTAIN RIVERS
Water discharge I06 m3/s
Sediment load 103 kg
a
w m W
a
w -4 O
a
w -4 N
a
w ~
-
w
.
-
w
EZBB Suspended sediment
*
4
a
w O
w ~
a
a
w w w w N P m
0 Bed load
-+-Water
a
a
a
w c n w w C O O
*
w w N
w
w
discharge
Figure 23.4 Annual totals of bedload and suspended load during the years 1968-92 in the
meltwater river from the Nigardsbreen glacier
occur during years with several flash flood events. This pattern corresponds very well to the model of the subglacial drainage system described above. The number of closures is important in controlling the way that new sediments are melted out of the ice. If the discharge is less variable, the same tunnel may be kept open and so, after some time, it may be cleaned of sediments. Estimates of bedload have been obtained by annual measurements of deltaic growth in the Lake Nigardsvatn downstream from the Nigardsbreen glacier. During years with large volumes of runoff, the magnitude of the bedload transport is high. The largest recorded bedload transport rates occurred during the years 1970, 1972, 1973 and 1975. These years differ from others in the record in that the discharge exceeded 1.8 x lo6m 3 d - ' for more than 30 days of the melt season. The year 1969 was exceptional in that the bedload transport rate was relatively low despite a long-lasting high discharge. This indicates that the availability of sediments is an important factor controlling the transport rate.
AREAS WITHOUT GLACIERS The igneous and metamorphic bedrocks in the Jostedal area are not very susceptible to weathering and erosion. Thus, the sediment supplied from areas that are not covered by present-day glaciers is, to a large extent, derived from the loose material of the overburden. This cover is discontinuous and consists of moraines and glaciofluvial deposits from the meltdown of the Pleistocene ice sheet and glacial deposits from the Little Ice Age. The streams draining these areas often have an amour layer of
442
J. BOGEN
immobile material preventing further erosion. The streams, therefore, have to change their position to contact erodible material. Water samples from tributaries with low glacier cover on the western side of Josted~lararely have suspended sediment concentrations exceeding 5 m g l - ' during normal runoff situations, and so the water remains clear most of the time. However, during large-magnitude floods, conditions may change. Extensive erosion took place during a flood in August 1979. Large amounts of sediment came down the steep mountain sides, and agricultural land on the river fans was strewn with boulders and, in some locations, covered by a thick layer of overbank sediments. An examination of sediment sources revealed that some of the rivers had undergone removal of their armour layer. The abrupt lowering of the river bed of R~ykjedalselviinduced mass movement on slopes adjacent to the river channel. A number of other types of sediment source were also active during the flood. The heavy rain triggered a large number of slides and river channel changes, including the formation of new channels. In some areas the bedrock was stripped entirely of overburden and increased areas of bare rock surface were revealed. Inside the neoglacial moraines, the loose material deposited is less consolidated than the older sediments and is more susceptible to erosion. Several erosion scars were observed inside the neoglacial moraines after the flood. Gullying is rare in this area, probably as a result of the patchy overburden. In other parts of Scandinavia, gullies have been seen to develop during major floods (Rapp and Str~mquist, 1976; Bogen, 1986b). The relatively resistant rocks also make the conditions in Josted~lavery different from the torrents of the Alps. Torrent erosion results from rock failure, often caused by inherent instability of geological formations (Heede, 1980). As systematic measurements are lacking in the non-glacial area of JostedOla, details of the transport dynamics cannot be given. However, data from a mountain stream, the Suspended sediment concentration mgll
Water discharge m31s
r 25
Figure 23.5 Suspended sediment concentrations (dotted curve) in the River Atna in the Rondane Mountains measured at Lia bridge. Discharge is shown as the full curve
SEDIMENT IN MOUNTAIN RIVERS
443
River Atna, in the Rondane area, provides some information about how the sediment transport dynamics relate to the process of mass movement in high-mountain areas (Bogen, 1989a, b). This river is situated almost entirely above the treeline (about 900 m a.s.1.) and the catchment area is 132 km2. A major part of the transported sediment is derived from mass movement and channel erosion downstream from the major sediment sources (Bogen, 1983a b). Suspended sediment concentrations are poorly correlated with water discharge and vary in an apparently unpredictable manner. Figure 23.5 illustrates that the highest suspended sediment concentrations occurred during snowmelt in May and decrease later on even when the water discharge increases. In late July and August, a similar pattern is repeated. At this time the high concentrations most probably occur as a result of slumping, which introduces large amounts of sediment into the channel. As this source is exhausted, the suspended sediment concentration decreases. The second rise may be due to another slide of a ~mallervolume. The effect of this slide was of shorter duration and suspended sediment concentrations fell to a low level after some days.
THE SANDURS Sandurs are braided river systems formed at the front of glaciers. Krigstr@m (1962) made a distinction between sandurs, where the channel system expands freely, and valley sandurs, where the development of the channel network is confined by valley walls. Almost all sandurs developed in front of Norwegian glaciers are valley sandurs, whereas the free type is most common on the coastal plains in Iceland. Characteristic features of the braided river systems are broad and shallow channels with a relatively steep mean gradient. The ca~ryingcapacity and competence of glacial ice and the subglacial tunnels are larger than the receiving meltwater streams. Some of the boulders that are supplied by the ice may thus be immobile in a proglacial fluvial environment and are deposited in the upper part of the sandurs. In the glacier-fed rivers in the Norwegian mountains, the same zones as found by Church (1972) for sandurs in the Canadian Arctic may be recognised. There is an upper steep part composed of coarse-grained fractions where channel bifurcation takes place. Lateral channel shifting is frequent in this part and there is no vegetation on the river banks. This zone grades into the second zone, where the number of channels is at a maximum. The grain fractions in river banks and bars are smaller and some vegetation is present. In the third zone, vegetation is more abundant and a layer of overbank sediments is deposited on the river plain. Whereas the transport and deposition of bedload in braided river reaches have been subject to extensive studies, the fate of suspended sediments has not been given similar attention. Obviously, the presence of overbank sediments in the third zone indicates deposition and a downstream decrease in the sediment load of the river when water discharges exceed bankful. A large sandur system is composed of a network of channels of variable size. During low discharge the current velocity may be low in some channels. Thus, the system may act as a sediment trap at low discharges and as a sediment source when discharge rises. When the water discharge increases, the suspended sediment concentration is dependent not only on the amount of sediment supplied from
J. BOGEN
WATER DISCHARGE Q m3/s Figure 23.6 Sediment rating curves showing the changes in suspended sediment load when the river passes through a sandur, a lake and a reach downstream from the lake where sediments are eroded. Station P1 and P2: the upper and lower curves are upstream and downstream of the sandur. Station P3 is at the lake outlet and P4 is 2 km downstream from the lake. See Figure 23.1 for location
445
SEDIMENT IN MOUNTAIN RTVERS
upstream, but also on the amount of sediment deposited in, or eroded from, the braided river system. The actual concentration reached during the passage of a flood may be expressed as the sum of the input concentration ( C , ) and the amount of sediment ( M ) added to the water volume ( Q + AQ)At passing through a cross-section during the time interval t:
where C , is the output concentration of suspended sediment, Q is the water discharge in the river and AQ the discharge increment. It can be seen from this equation that the output concentration (C,), during a sequence of water discharge increments, is dependent upon the length of time necessary to accomplish the increase. During a rapid increase the sediments are added to a smaller volume of water than during a slow increase. Thus, the highest concentrations are reached during a rapid increase in water discharge. Apart from the discharge increase, the suspended sediment concentration is also dependent on the amount of sediment available for erosion ( M ) . This amount is dependent on the deposition in the channel during the preceding time interval. Calculations carried out by Bogen (1980) showed that the added loads are at their highest when the discharge during the preceding period is of intermediate size. During high flow, the current velocity is high, which does not permit sedimentation. During low flow the supply of sediment is too small. It is therefore evident that a sandur system may influence the sediment transport dynamics in a liver over a short time and on a seasonal basis. On a year-to-year basis, data from the Tunsbergdal sandur shows that little permanent deposition takes place. The sediment rating curves from an upstream and a downstream station are almost coincident, except for some deposition at high discharges (Figure 23.6). During major changes in the channel network, large amounts of overbank sediments may be exposed to erosion. In 1987 the channel system of the Fiibergstoen sandur moved from a position on the eastern side to the western side of the valley. This incident was associated with an increase in suspended load from between 30 000 and Suspended load l o 3 tonnes
EZGl
lr
major channel change
Figure 23.7 Annual suspended sediment loads at the monitoring station downstream from Fdbergstalen sandur. A major change in the channel network caused extremely high sediment transport in 1989
446
J. BOGEN
60 000 tyr-' during 1987 and 1988 to 210 000 t in 1989. During the following years the sediment load fell to the same level as that before the channel changes took place (Figure 23.7). The shift in the channel network was caused by a permanent change in the position of the main channel at the upstream end of the sandur. At the same time, tapping of water for the Styggevatn hydro-power reservoir influenced the lower past of the sandur (Bogen, 1993). The role of water abstraction in the channel change is not clear. However, the channel shift did initiate severe bank erosion and removal of overbank sediments. When the new channel was established and swept free of suspended sediment, this source apparently became exhausted.
THE LAKES Lakes form sediment traps where a part of the sediment load is deposited. The sediment rating curves in Figure 23.6 illustrate the impact of the passage of water through a lake. When the water masses flow through a lake, suspended sediment concentrations are reduced by the settlement of particles. As grain size normally increases with discharge, the relative rate of deposition is greater at high than at low discharge. Thus, the slope of the sediment rating curve at the lake outlet is less than that at the inlet. As the grain size of the sediment load may be subject to seasonal changes, the rating curve is not well correlated with discharge. Much fine mateiial in the suspended load at the inlet may create relatively high concentrations at the outlet even at moderate discharges. Another sampling station was established about 2 km downstream from the lake. Owing to erosion on the intervening reach, the sediment rating cui-ve increases its slope between the lake outlet and this downstream site. Varves that reflect annual sedimentation have often been reported in proglacial lakes. In Lake Tunsbergdalsvatn very distinct varves have been found (Bogen, 1976). The varves reflect annual changes in grain size and mineralogy. The layers deposited duiing late autumn and winter conditions contained more fine grain sizes and more biotite than the summer layers. Inside some of the varves some thinner layers were present, socalled pseudovarves. These layers were found to be related to discharge variations during the summer season. As the biotite layers were much thinner duiing summer deposition, it was relatively easy to identify the winter layer. Similar conditions have been described by Gilbert (1973), 0strem (1975) and 0strem and Olsen (1987). Bogen (1976, 1979) presented a method for estimating the sediment load from vai-ve thickness to obtain suspended sediment load estimates in years when no sampling has been canied out. Obviously, the sediment rating curve may be used to obtain a rough estimate of sediment load during the years when water discharge was recorded. However, this curve is only valid for parts of the season. During the first part of the melt season in particular there is no simple correlation with discharge. The varve thickness of the individual years may be used to correct for this deficiency. A sediment core taken 1400 m from the river mouth was used for this purpose. In this core the varve thicknesses in 1965 and 1972 (when direct measurements of sediment transpoit were made) were identified. Sediment transpoit measurements from 1965 were obtained from Hatling (1967). The results of the calculations and interpretation of the sediment core are given in Figure 23.8. The cossections to the sediment rating curve
-
SEDIMENT IN MOUNTAIN RIVERS
VARVE THICKNESS mm
YEAR
SUSPENDED SEDIMENT TRANSPORT IN LAKE INFLOW (RIVER) tonneslyear
IN LAKE FLOW-
5.0 5.0 5.0
34200 34200
Figure 23.8 Suspended sediment transport estimated from varves in the bed sediments of Lake Tunsbergdalsvatn
estimates based on bed sediments led to an increase in estimated load in some years and a decrease in others. For the two years 1970 and 197 1, large corrections were found to be necessary. In 1970 a large flood event occurred early in the melt season, and it is very likely that large amounts of sediment were flushed out during this flood. In 1971 the sedimentation in the lake was less than that computed from the sediment rating curve. The reason for this is most probably that the large flood event in that year, which occurred in November, did not transport much sediment because at this time of the year the subglacial channel system may be closed so that sediment from this source is not available. From Hatling's (1967) descriptions it appeared that a change in the flow field of the lake took place in 1967. Prior to that year the main flow followed the western side of the lake and its velocity was retarded more than in the subsequent years. Thus, less sediment was carried in suspension to be deposited at the location of the sediment core, and the valves were correspondingly thinner. The application of two years of calibration were used to compensate for this effect of unequal deposition. Estimation of sediment load in the years before the discharge record commenced may be possible, but may involve the collection of a large number of sediment cores to compensate for the influence of channel changes on sedimentation rates.
JOSTEDDLA: A CONIPOSITE RIVER BASIN The runoff in the River Jostedela is subject to considerable variations throughout the melt season. About 90% of the iunoff is concentrated in the months May to September. The largest discharge events are most often rain-induced floods or a combination of
448
J. BOGEN
glacier melting and rain (Harsten, 1979; Gjessing and Wold, 1980). The sediment monitoring station at Haukisgjelet records the transport in the main stem of River Jostedola (location A, Figure 23.1). A number of different sources contribute to the sediment transport at this station. The main contributors are the Fibergstolbreen and the glaciers upstream of the Fibergstolen sandur. On average less than 20% of the sediments supplied from Nigardsbreen pass Lake Nigardsvatn and are canied into the main river. On the basis of seasonal variations in air temperature (Figure 23.9) three periods may be recognised: the snowmelt period in May, the glacier melt from June to early September, and the period of autumn rain. The suspended sediment concentrations (Figure 23.9) vary in a complicated manner throughout the season. During snowmelt conditions in May, concentrations are low (less than 40 mgl-I) in comparison to the later period of glacier melting, when the daily mean is most often in the range of 50-100 mgl-I. The highest concentrations exceed 500 mgl-' and occur during episodes associated with floods generated by a combination of both rain and glacier melting. During rain floods in the late season,
deg. C 28 24 20 16 12 8 4 0
Prec. mm 50 40 30 20 10
may
may
jun
jun
jul
jul
aug
aug
sep
sep
oct
0
Cs mgll 1 600 1 400 1 200 800 600 400 200 0
oct
Figure 23.9 (a) Mean daily air temperature (full curve) and daily precipitation (bars) at the meteorological station Bjarkehaug in Jostedalen, 30 April to 18 October 1990. (b) Water discharge (upper full curve) and sediment concentration (full squares) at Haukssgjelet in the River Jostedala in the same period
449
SEDIMENT IN MOLTNTAIN RIVERS
glacier melting is reduced and the subglacial drainage system may be closed, so that the availability of sediment is low. Whereas the suspended sediment moves through the river basin in less than a day, the bedload may take several decades to travel the whole length of the river basin. The glacial valley shape is of great importance to the movement of the bedload. A distinct feature within glacial valleys is the steps and overdeepened basins of the longitudinal profile (Figure 23.10). Some basins form lakes where the sediment load is deposited. Others have been infilled with sediments and form alluvial reaches with floodplains. In between the alluvial plains are steep reaches where channels are shaped in bedrock or
A
I
1
GLACIER AFTER SURGE
RIVER
RIVER
1
-zzw-
1 I Figure 23.10 Longitudinal profile of the Josted@laRiver and its tributaries. The location of major sediment sources is indicated. It is suggested that the fluctuation of the glaciers influenced the sediment delivery ratio
450
J. BOGEN
immobile moraine mateiial. Some of the tributaries are rather steep, while others occur in wide glacial hanging valleys. The position where the glaciers introduce their sediments into the main course of the river is of importance to the further movement of the sediment and the stability of liver channels. At present, a large pait of the coarse fraction is deposited in front of the glaciers and often far away from the main river stem. In the more advanced glacier stages, sediments were more easily transferred into the main stem of the proglacial river system. One example is the glacier Nigardsbreen, which reached its greatest advance around 1750. The subsequent retreat of the glacier uncovered lake Nigardsvatn during the years 1937-67. On average 1500 t or 75% of the total load of the glacier Nigardsbreen is at present deposited in the lake. The glacier volumes in the Jostedal area have been subject to large variations in postglacial time (e.g. Bogen et al., 1988). Long-term changes in sediment transport dynamics of the river have certainly been the result.
REFERENCES Bogen, J. (1976) Sedimentasjonsprosessens dynamikk i et delta-system (The dynamics of deltaic depositional processes) Unpublished thesis, University of Oslo, 103 pp. (in Norwegian). Bogen, J. (1979) Sedimentasjon av partikulsert materiale i innsj0er (The sedimentation of particulate matter in lakes). In: Hansen, E. (ed.), Iizlzsj@ersDyrzarnikk (The Dyrzainics of Lakes), Norsk Hydrologisk Komite Internal Report no. 79/02, pp. 459-478 (in Norwegian). Bogen, J. (1980) The hysteresis effect of sediment transport systems. Norsk Geogr. Tidsskrq. 34, 45-54. Bogen, J. (1983a) Morphology and sedimentology of deltas in fjord and fjord valley lakes. Sediinerzt. Geol. 36, 245-262. Bogen, J. (1983b) Atizas Delta i
[email protected] Fluvialgeornorfologisk Urzders@kelse(The Atiza Delta). Kontaktutvalget for Vassdragsreguleringer, University of Oslo Report no. 83-70, 44 pp. (in Norwegian). Bogen, J. (1986a) Transport of suspended sediments in streams. In: Hasholt, B. (ed.), Partikulmt Buizdet Stofftraizsport i Vaiziz og .rorderosjoiz, NHP Report no. 14, KOHYNO, pp. 9-21. Bogen, J. (1986b) Erosjoizsprosesser og Sediineizttraizsport i Norske Vassdrag. Utrediziizg av Forvaltiziizgsaizsvar, Faglig Status og Forskizii~gsbehov (Erosiorz arid Sediiiieilt Traizsport iil Nonvegiail Rivers. River Maizageineilt, Respoizsibilities, Status aild Research Requirerizeizts), NHK Report no. 20, 109 pp. (in Norwegian with extended abstract in English). Bogen, J. (1988) A monitoring programme of sediment transport in Norwegian rivers. In: Bordas, M.P. and Walling, D.E. (eds), Sediineilt Budgets, IAHS Publication no. 174, pp. 149-159. Bogen, J. (1989a) Glacial sediment production and development of hydroelectric power in glacierized areas. Ailiz. Glaciol. 13, 6-11. Bogen, J. (1989b) Trarzsport av Suspeizdert Materiale og Substratforhold i Atilavassdraget. Forskiziizgs og Referaizsevassdrag-Atiza (Sediineizt Traizsport aizd Substrates iiz the Research aizd Reference River Basiiz Atiza), Miljevirkninger av Vassdragsutbygging, MVU Report B52, Oslo, 27 pp. (in Norwegian with abstract in English). Bogen, J. (1992) Monitoring grain size of suspended sediments in rivers. In: Bogen, J., Walling, D.E. and Day, T. (eds), Erosioil aizd Sedirnerzt Trarzsport Prograiilines irz River Basirzs, IAHS Publication no. 210, pp. 183- 190. Bogen, J. (1993) Fluviale prosesser og inngrep i vassdrag. Konsekvenser og tiltak-en kunnskapsoppsummering (Fluvial processes and man made effects-the state of knowledge).
SEDIMENT IN MOUNTAIN RIVERS
45 1
In: Faugli, P.E., Erlandsen, A.H. and Eikenes, 0. (eds), Inngrep i Vassdrag: Konsekvenser og tiltak - En Kunnskapsoppsummering. (Human interference with rivers - assessments of impacts and remedial measures. The state of knowledge) NVE Publication no. 13/93, (pp. 96-124. (in Norwegian). Bogen, J., Wold, B. and astrem, G. (1988) Historic glacier variations in Scandinavia. In: Oerleman, J. (ed.), Glacier Fluctuatior~arzd Clirnatic Charzge, Kluwer Academic, Dordrecht, pp. 109-128. Church, M. (1972) Bafin Islarzd Sarzdurs. A Study of Arctic Fluvial Processes, Geological Survey of Canada Bulletin no. 216, 208 pp. Gilbert, R. (1973) Processes of underflow and sediment transport in a British Columbia mountain lake. Natl. Res. Courzcil of Carlada, Assoc. Cornrn. Geodesy arzd Geophysics, Subcornm. Hydrology,, Proc. Hydr. Syrnp. pp. 493-507. Gjessing, Y. and Wold, B. (1980) Flommen i Jostedalen 14-15 August 1979 (The flood in river Jostedola 14-15 August 1979). Vreret 1, 29-34 (in Norwegian). Harsten, S. (1979) Fluvialgeornorfologiske Prosesser i Jostedalsvassdraget (Fluvial Processes irz River Josted@la).Kontaktutvalget for Vassdragsreguleringer, University of Oslo Report no. 09/79, 114 pp. (in Norwegian). Hatling, J. (1967) Slamtransport og geomorfologi i Leird~lasnedb~rfelt(Suspended sediment transport and geomorphology in the Leirdola river basin). Unpublished thesis, University of Oslo, 106 pp. (in Norwegian). Heede, B.H. (1980) Gully erosion-a soil failure: possibilities and limits of control. lrzterpraevent 1980 (Proceedings of the Interrzatiorzal Syrnposiurn in Bad Ischl) vol. 1, FGVH, Klagenfurt, pp. 317-330. KrigstrOm, A. (1962) Geomorphological studies of sandur plains and their braided rivers in Iceland. Geogr. Arzn. 44, pp. 328-346. Nilsson, B. (1972) Sedirnenttrarzsport i Sverzska Vatterzdrag. Et IHD Projekt. Del 1 , Metodik. Naturgeogr. Inst. University of Uppsala Report no. 2, 18 pp. Nordseth, K. (1974) Sedirnenttrarzsport i Norske Vassdrag (Sedirnerzt Trailsport irl Norwegian Rivers), Department of Geography, University of Oslo, 175 pp. (in Norwegian). a s h e m , G. (1975) Sediment transport in glacier meltwater streams. In: Jopling, A.V. and McDonald, B.C. (eds), Glacio~uvialarzd Glaciolacustrirre Sedirnerztatiorl, Special Publ. Soc. Econ. Pal. Min. Tulsa, no. 23, pp. 101-122. astrem, G. and Olsen, H.C. (1987) Sedimentation in a glacier lake. Geogr. Arzrz. 68A(1), 125-137. Rapp, A. and Str@mquist,L. (1976) Slope erosion due to extreme rainfall in the Scandinavian mountains. Geogr. Arzn, 58A(3), 193-200. Raubakken. V. (1982) Suspensjonstransport og sedimentasjon i Erdalsvassdraget, Stryn. Suspended sediment transport and sedimentation in the Erdal rlver (Stryn). Unpublished thesis, University of Oslo, 106 pp. (in Norwegian).