Master Project
TVVR 09/5005
Sediment Transport Studies in Punatsangchu River, Bhutan
___________________________________________________________________
Sonam Choden
Water Resources Engineering Department of Building and Environmental Technology Lund University
Water Resources Engineering Department of Building and Environmental Technology ISRN LUTVDG/TVVR-09/5005 ISSN-1101-9824
Sediment Transport Studies in Punatsangchu River, Bhutan
Lund 2009 Sonam Choden
Copyright © Division of Water Resources Engineering Department of Building and Environmental Technology Lund University P.O.Box 118, SE-221 00 Lund http://www.tvrl.lth.se/
ISRN LUTVDG/TVVR-09/5005 ISSN-1101-9824
Printed in Sweden
Acknowledgement Firstly I would like to thank my supervisor Professor Rolf Larsson for his kind guidance throughout my thesis work. Secondly, I would like to thank all the Water Resources Management Program teachers for their very interesting lectures and knowledge given to us during the two year program. My sincere thanks also go to Professor Magnus Larson for his time and advice on topics related to sediment transport. I would like to thank Sonam Wangdi and Pratigaya Pradhan of NTNU, Norway for sharing information about the Punatsangchu River Basin with me. My thanks also go to Tashi Dorji and Wangmo of Department of Energy, Bhutan for sharing some information about this river. I would also like to thank all my classmates of water resource management (2007-2009) and my corridor mates for making my entire stay in Sweden very pleasant. Lastly I would like to thank Mr. Jan Froborg and Ms Solveig for being a family to me here in Sweden for the last two years.
i
Abstract Sediment transport pattern in the Himalayan River is complex and sediment sampling in these rivers are often difficult. Sediment load in the river varies largely from year to year. Major part of the sediment load is transported in the monsoon months. Reliable and consistent sediment rating equation is not found for the Himalayan Rivers. The change in the flow rate and suspended sediment concentration is very rapid and unpredictable. In Bhutan, there are no published records on sediment transport studies. There are four sediment sampling stations in the whole country. Bhutan being a mountainous country has a huge potential for hydropower development. The most common problem related to hydropower projects is the reservoir sedimentation. In this report, the sediment concentration and river flow data from one gauging station along Punatsangchu River is presented to increase the understanding of sediment transport pattern in this river. Sediment transport in the Himalayan Rivers with regard to factors affecting sediment transport is addressed and some comparison is made with the Punatsangchu River. The factors affecting sediment transport are hydrology and climate, geology, land use and topography. The correlation between sediment concentration and river discharge for the year 2007 for Punatsangchhu River was found to be very good with an R2 value of 0.8. The correlation of average discharge and concentration over the record period of 1993 and 1996 to 2008 was found to be 0.53. For some years the correlation was very poor with an R2 value of 0.13. This shows that river discharge is not a reliable variable to predict the sediment concentration in Punatsangchu River. Most of the sediments are transported during the monsoon months which account for about 90% of the total load transported in a year. The bed load and suspended load are calculated using the formulae developed for alluvial rivers and the results were similar to the estimated load from the gauging station.
ii
List of Figures Figure 1.1: Asia map showing location of Bhutan (Google map, 2009) ........................................ 2 Figure 1.2: River system of Bhutan. (Survey of Bhutan, 2007) ...................................................... 4 Figure 4.1: Punatsangchhu River Basin. (Department of Energy, Bhutan, 2003)......................... 17 Figure 4.2: Monthly average rainfall (1993 to 2006) at the Wangdi Rapids gauging station ....... 19 Figure 4.3: Map of Bhutan showing the principal (in main rivers) and secondary (in the tributaries) river gauging stations and sediment sampling stations operational in 2002 (DoE, 2003).............................................................................................................................................. 20 Figure 5.1: Cableway system installed at Punatsangchhu River. (Department of Energy, 2009) . 21 Figure 5.2: Sediment sampling in Sand bed Rivers showing the unmeasured load (Bishwakarma, M, B., 2008) .................................................................................................................................. 23 Figure 5.3: Average annual variation of sediment concentration and flow for Punatsangchhu River .............................................................................................................................................. 24 Figure 5.4: Average annual non-dimensional river flow and sediment concentration variation in time for Punatsangchu River. (Non-dimensional values are obtained by dividing with the average) ....................................................................................................................................................... 25 Figure 5.5: Normalized flow (QT-2) and concentration for Punatsangchhu River ......................... 26 Figure 5.6: Monthly variations of sediment concentration and discharge of Punatsangchhu River for 1993 and 1996 to 2008 ............................................................................................................ 27 Figure 5.7: Plot of sediment concentration and flow with regression analysis fit and R2 value for Punatsangchhu River; Average monthly values 1996-2008 and 1993 .......................................... 28 Figure 5.8: Normalized monthly flow and concentration of Punatsangchhu River ...................... 28 Figure 5.9: Normalized flow and concentration for 1999 and 2003 of Punatsangchhu River ...... 29 Figure 5.10: Sediment concentration at Garhwal Himalayas and Punatsangchhu River in the monsoon period ............................................................................................................................. 29 Figure 5.11: Sediment concentration and river discharge in November 1999 and July 2001 at Punatsangchhu River ..................................................................................................................... 30 Figure 5.12: Daily values of sediment concentration and flow for the record period for Punatsangchhu River ..................................................................................................................... 31 Figure 5.13: Average monthly sediment concentration and discharge of Punatsangchhu River showing different trend line........................................................................................................... 32 Figure 5.14: Daily discharge for the record period for Punatsangchhu River ............................... 32 Figure 5.15: Calculated bedload using different formula and bedload (30% of measured suspended load) for Punatsangchhu River..................................................................................... 34 Figure 5.16: Relation between bedload and total load. (Laursen, 1958) ....................................... 35 Figure 5.17: Punatsangchhu River cross section at Wangdi Rapids Gauging station. (DoE, 2009) ....................................................................................................................................................... 36 Figure 5.18: Assumed particle size distribution used for Punatsangchu River (Dorji, 2003) ....... 36 Figure 5.19: Calculated suspended sediment load and estimated suspended sediment load from measurements ................................................................................................................................ 37 Figure 6.1: Monthly Sediment concentration and discharge for the year 2007 for Punatsangchhu River. ............................................................................................................................................. 39 Figure 6.2: Sediment concentration and discharge for the year 1999 for Punatsangchhu River. .. 40 Figure 6.3: Monthly average of all years with possible trends of Punatsangchhu River. ............. 40 Figure 6.4: Punatsangchhu River near Wangdi Rapids gauging station. (Photo from Sonam Wangdi) ......................................................................................................................................... 42
I
List of Tables Table 1.1: Rainfall (snowfall not recorded) and temperature variation with altitude in Bhutan (Pradhan, 2008) ............................................................................................................................... 3 Table 2.1: Classification of river reaches (Lysne et.al, 2003) ......................................................... 6 Table 2.2: Water and Sediment discharge in some large rivers of the world (McLennan, 1993) ... 7 Table 3.1: Suspended sediment discharge and distribution per region (UNEP, 2003). ................ 11 Table 3.2: Sedimentation rate (mm/y) [DoE, 2007] ...................................................................... 13 Table 4.1: Key facts about Punatsangchhu River (DoE, 2003) ..................................................... 16 Table 4.2: Some of the hydropower projects along Punatsangchu River (DoE,2003) .................. 16 Table 5.1: Sample of summary of sediment data from SEDAT (the years marked with * is not used in the present study) .............................................................................................................. 22 Table 6.1: Linear Regression Analysis Result (daily values) for Punatsangchhu River ............... 38
Abbreviations m.a.s.l: Meters above sea level m: Meter(s) m3/s: cubic meter per second. t/day: tonnes per day mg/l: milligram per liter km: Kilometer km2: Square kilometer mm: Millimeters MW: Mega Watt ppm: Parts per million
Acronyms GDP: Gross Domestic Product GLOF: Glacier Lake Outburst Flood CAPSD: Curriculum and Professional Support Division WRMP: Water Resources Management Plan WAPCOS: Water and Power Consultancy Services PSMP: Power System Master Plan IRI: The International Research Institute for Climate and Society DoP: Department of Power DoE: Department of Energy BPC: Bhutan Power Corporation
II
Table of Content Acknowledgement ............................................................................................................................ i Abstract ........................................................................................................................................... ii List of Figures .................................................................................................................................. I List of Tables ................................................................................................................................... II Abbreviations .................................................................................................................................. II Acronyms ........................................................................................................................................ II Table of Content ............................................................................................................................ III 1 Introduction ............................................................................................................................. 1 1.1 Brief Background to the Project ...................................................................................... 1 1.2 General background on Bhutan ....................................................................................... 2 1.3 Climate of Bhutan............................................................................................................ 2 1.4 River system in Bhutan ................................................................................................... 4 1.5 Hydropower Development in Bhutan .............................................................................. 4 1.6 Sediment Transport and Related Problems ..................................................................... 5 1.7 Objectives and Methodology ........................................................................................... 5 1.8 Limitations....................................................................................................................... 5 2 Factors affecting sediment transport ....................................................................................... 6 2.1 Overview ......................................................................................................................... 6 2.2 Hydrology and Climate ................................................................................................... 7 2.3 Topography ..................................................................................................................... 8 2.4 Land use .......................................................................................................................... 9 2.5 Geology ........................................................................................................................... 9 3 Sediment transport in the Himalayas ..................................................................................... 11 3.1 Overview ....................................................................................................................... 11 3.2 Sediment transport studies in Bhutan ............................................................................ 12 3.3 Sediment transport studies in other parts of the Himalayan Region.............................. 13 4 Punatsangchu River Basin ..................................................................................................... 16 4.1 Overview ....................................................................................................................... 16 4.2 Climate of Punatsangchhu River Basin ......................................................................... 18 4.3 Geology of Punatsangchhu River Basin ........................................................................ 18 4.4 Hydrology ...................................................................................................................... 18 4.5 Measurement Stations ................................................................................................... 19 5 Results: Sediment transport pattern in Punatsangchhu.......................................................... 21 5.1 Measurements ................................................................................................................ 21 5.2 Annual Variations.......................................................................................................... 24 5.3 Monthly Variations ........................................................................................................ 26 5.4 Daily Variations............................................................................................................. 30 5.5 Sediment load calculation.............................................................................................. 33 6 Analysis and Discussion ........................................................................................................ 38 7 Conclusions ........................................................................................................................... 44 8 References ............................................................................................................................. 45
III
1 Introduction 1.1
Brief Background to the Project
The sediment supply and transport in the Himalayas is quite significant and is considered to be highest in the world. The Himalayas are characterized by a steep and rugged terrain in terms of topography which plays a significant role in the spatial distribution of rainfall, snow and snowmelt. A heavy rain in the catchment area results in an unusual stream flow event creating widespread slope instabilities, sediment transport and flooding. Rivers in Bhutan have a high development potential for harnessing hydropower because of the mountainous terrain, climatic and other favorable (political, social, economic) conditions (Tamang, 2004). Bhutan has an estimated hydropower potential of 30 000 MW out of which 23 760 MW has been identified and assessed to be technically feasible. At present only 1.6% of the potential is harnessed (Tamang and Tshering, 2004). Punatsangchhu river basin is one of the three major river basins in Bhutan. Previous studies in this river basin focused on hydropower development and hydrological studies. Despite a program to determine sediment data for Bhutan’s rivers no information on sediment transport appears to have been published (DoE, 2003). Therefore, understanding the spatial and temporal patterns of the sediment transport and sediment yield in this basin is important for effective water resource development in Bhutan. The main concern with hydropower projects is their limited lifetime when the reservoir or head-pond becomes inoperative due to trapped sediments. Another problem associated with sediments in the hydropower plants is the wear of the turbines. This is caused by suspended sediments. It is therefore of interest to study the reservoir sedimentation and turbine wear for the new hydropower projects proposed in this basin. But these topics are not covered in this project because of lack of time and information. It might also be interesting to study the transport rates so that the bridge designs can be carried out safely. In a nearby industrial town of Pasakha in south of Bhutan, a flooding event in 2001 along Amochhu River caused havoc in this area where the entire residential colony has been abandoned and the riverbeds and banks are completely covered by sediments. This event has led to the riverbeds being covered with sediments. If such flooding events become a frequent happening, the bridge will soon become un-functional. A good study on the sediment transport pattern could be useful for bridge design in such area in the future. In this report, the sediment and discharge data from Wangdi rapids gauging station is presented and this data is used to increase the understanding of sediment transport in Punatsangchhu River. Sediment transport studies in the Himalayan region are presented to make a comparison with the results from Punatsangchu River. The factors affecting sediment transport in general are addressed in this report but not quantified. The bedload and suspended load are calculated and compared to the load from the gauging station.
1
1.2
General background on Bhutan
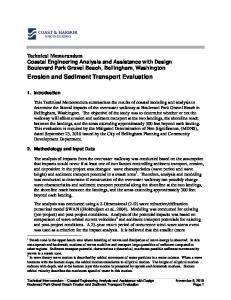
Bhutan is a small land locked country in the eastern Himalaya, bordering China in the north and India in south, east and west as shown in Figure 1.1. It covers an area of 38 394 km2 between the latitudes 26° 45’ N and 28° 10’ N and longitudes 88° 45’ E and 92°10’E (National Portal of Bhutan). Although the latitudes fall within the Northern hemisphere and between the equator and Tropic of Cancer, Bhutan does not have a typical tropical climate. The population of Bhutan is about 647 000 (2006). Developmental activities in Bhutan are guided by the philosophy of Gross National Happiness. The economy of Bhutan is one of the world's smallest and least developed with a GDP (current price) per capita of 1414.3 USD (2006) (NSB, 2007). The land-use in Bhutan is dominated by forest cover of 72.5% while agricultural land makes up only 7.7% (NSB, 2007). The altitudes within this very small country vary largely from 97 meters above sea level (m.a.s.l.) in the southern sub-tropical region to 7553 m.a.s.l. in the Northern alpine region (Central Intelligence Agency).
Bhutan
Figure 1.1: Asia map showing location of Bhutan (Google map, 2009)
1.3
Climate of Bhutan
The climate in Bhutan is governed by altitude, orientation of mountain ranges, vegetation and the monsoons that bring between 60 and 90 percent of the region's rainfall. The climate is humid and subtropical in the southern plains and foothills, temperate in the inner Himalayan valleys of the 2
southern and central regions, and sub-alpine to alpine in the north, with year-round snow on the main Himalayan summits. Temperatures vary according to elevation. The subtropical climate in the southern part of Bhutan has a mean monthly temperature of 15 degree Celsius in the winter and 30 degree Celsius in the summer. In the temperate region, the average daily temperature varies from 5-15 degree Celsius in the winters and 15-30 degree Celsius in the summer. The alpine region is the coldest part in Bhutan with a mean annual temperature of 8 degree Celsius (CAPSD, 1994). Annual precipitation ranges widely in various parts of the country. Bhutan receives fair amount of annual rainfall varying from 500 mm in the North to above 2000 mm in the South. (CAPSD, 1994) Table 1.1 gives the rainfall and temperature variation with altitude. Table 1.1: Rainfall (snowfall not recorded) and temperature variation with altitude in Bhutan (Pradhan, 2008)
Zone
Altitude(m)
Average Temperature 0C Max
Min
Mean
Rainfall mm
Wet Sub-Tropical
150-600
35
12
24
2500-5500
Humid Sub-tropical
600-1200
33
5
20
1200-1500
Dry Sub-tropical
1200-1800
29
3
17
850-1200
Warm Temperate
1800-2500
26
1
13
650-850
Cool temperate
2500-3500
22
1
10
650-850
Alpine
>3500
12
-1
5.5
sediment supply Transport capacity = sediment supply Transport capacity < sediment supply Transport capacity