Sediment transport Introduction Sediment transport (ST) is an important geological factor, which is related to the mechanisms of sediment load production, transport, and deposition. It is often related to the effects of a moving fluid (air or water) on cohesive or noncohesive sediments and to resulting fluxes from sources of particles to sinks. As sediments cover most of the earth’s surface and as their long-term movement influence landscapes [1, 2], they represent an important interface between mankind and the environment (see Hydrology, environmental). Fundamental and applied issues concerning ST are of interest for human welfare. ST has been widely studied by Earth scientists. Historically, the estimate of mountain erosion through joint studies of chemical and particulate transport in rivers as well as long-term morphodynamics processes controlling the planform and sedimentology of the river and its floodplain were carried out. More recently, process sedimentologists and physicians focused on the mechanisms of ST, their influence on bed forms, and the feedback of these forms on hydrodynamics occurring in modern environments [3]. Engineers are interested in ST because of the interest in solving problems such as siltation of reservoirs and the erosion of coastlines (see Coastal processes) where commerce could be affected as the movement and deposition of sediment in harbors and waterways change the depth and course of navigable channels and thus restrict the passage of ships. In rivers, human activities such as sediment mining has triggered bed erosion [4], destabilization of dykes and bridges, rapid colonization of river bed by woody vegetation, decrease in habitat diversity and increase of flooding risk. At the catchment scale, land use changes (deforestation, cropping, overgrazing, urbanization, etc.), lead to an increase of sediment fluxes to rivers and sedimentary basins. Sediment pollution from urban, industrial, mining, and agricultural activities Based in part on the article “Sediment transport” by Alec E. James, which appeared in the Encyclopedia of Environmetrics.
is also an important issue [5]. Therefore, interactions between climate change (see Global warming), hydrology, sedimentation regimes, and demographic development should be considered [2]. The chemical alteration of fine sediments occurs because they carry the least soluble contaminants as heavy metals and persistent organic pollutants (e.g., polychlorinated biphenyls (PCBs), Polycyclic aromatic hydrocarbons (PAHs)). ST occurs when the flow is rapid enough to erode and move surficial sediments. In practice, the process is extremely complex and once movement is initiated the properties of the fluid are modified by the presence of the irregularly shaped solid particles from which the bedform is comprised [6]. When the range of particle size is large, this leads to various ways of characterizing ST phenomena. There are two fundamental modes of transport, the bedload in which particles roll or slide along the bed of a river or the sea (which remains difficult to quantify), and the second in which the particles are entrained by the flow and move in suspension with the water mass. Estimation of suspended sediments concentration is usually performed using rating curves based on empirical relations between sediment concentrations and discharge [7] or nonlinear approach as artificial neural networks [8]. The transported fluxes will depend on factors such as particle size, shape, and density and will vary significantly over time and space. The role of rare or extreme floods on sediment long-term fluxes has been highlighted by several authors [9, 10]. These observations are the basis of a magnitude/frequency concept [11, 12]. This contribution details the key parameters and basic processes involved in ST in rivers and coastal environments. First, considering the sediment production processes, this article focuses on parameters governing sediment erosion, transport, and deposition. The influences on grain size and shape and on the mechanics of flow are presented. For cohesionless sediments, the critical threshold for particle motion and the morphodynamics of common bed forms are explained as well as some methods and tools for quantification of transport rates. For cohesive sediments, the processes of sediment suspension are presented. For further details on erosion and modeling of cohesive sediments, see James [13].
Encyclopedia of Environmetrics, Online © 2006 John Wiley & Sons, Ltd. This article is © 2013 John Wiley & Sons, Ltd. This article was published in Encyclopedia of Environmetrics Second Edition in 2012 by John Wiley & Sons, Ltd. DOI: 10.1002/9780470057339.vas010.pub2
2
Sediment transport
Sources and Sediment Features Sediment Production Most of the sediments that comprise rivers and seabeds are made of grains of material that are the outcome of weathering and erosion of the rocks that make up the continental landmasses. Either physical or chemical weathering of the source rock produces these terriginous detrital fragments [3]. Physical weathering is a mechanical process characterized by two main types of rock fragmentation, namely frost weathering and salt weathering. The first one corresponds to the fragmentation of rocks resulting of the increase in volume of infiltrated water as it is changed in ice. The second is the result of the expansion of salt which is attributed to hydration, heating, and crystal growth. Although physical weathering is important, it should be noted that most sediment grains are likely to be the outcome of chemical weathering, which is simply the result of the decomposition of rocks through the reactions of surface water and groundwater with rock-forming minerals. Some weathering is also due to biological processes that may be chemical or physical, such as microorganisms that can attack rocks or the growth of plant roots that can fracture rocks. The final composition of the sediment is a complex function of geological and geochemical processes that are dependent on climate, vegetation, and other factors. There is a great variety in the types of sediments produced as a result of chemical and physical weathering; indeed the sediment particles can be physically altered and chemically changed during transport and after deposition (diagenesis). The dominant minerals in sediments are chemically those that are most stable at the earth’s surface and physically those most resistant to erosion. In general, sediments are made up of a mixture of materials, the main components being quartz and various clays (chlorite, kaolinite, montmorillonite, and illite) arising from the chemical weathering of feldspars and ferromagnesian minerals.
Sediment Grain Size and Shape The most important factors influencing the transport of sediments are the size, density, sorting, and the mechanical properties (cohesive or noncohesive) of particles. When the particle size is in the submicrometer range, cohesive interparticle colloidal forces
that are effective over the same length scales as the particle dimensions become important and so these sediment beds are resistant to erosion [14]. For noncohesive sediments, the resistance to transport is a function of the particles’ weight, shape, and arrangement. For sediment particles ranging from less than 10−1 μm to greater than 0.1 m, particle size is an important transport parameter and it is worthwhile having a suitable scale for classifying this size range. For noncohesive sediments, sizing particles is based on the minimum width of sieve aperture through which sediment could pass or on laser diffraction or pebble counting. For small particles, grain size analysis can be based on settling velocity of the particle and laser diffraction. Once the method of sizing has been chosen, the type of particle can be classified by its size. Table 1 shows the size classification of sedimentary particles based on the Wentworth scale, where size grades are scaled to a reference grain diameter of 1 mm. The Wentworth scale is a geometric series, which allows for an equal width class division on the logarithmic scale. Because the class limits are not integers when log10 is used, Krumblien [15] proposed the φ logarithmic scale where log2 is used, that is, φ = − log2
d d0
(1)
where d is the grain diameter and d0 is the standard 1 mm grain diameter (to make the equation consistent) [15]. Table 1 Size classification of sedimentary particles based on the Wentworth scale. Size range (μm)
Range of φ
Wentworth class
>256 × 10 64 × 103 –256 × 103 4 000–64 × 103 2000–4 000 1 000–2000 500–1 000 250.0–500.0 125.0–250.0 62.50–125.0 31.50–62.50 15.75–31.50 7.875–15.75 3.938–7.875 5δ, the bed is hydrodynamically rough. Ks corresponds to the Nikuradse sand roughness parameter (related to sediment grain size). A further consequence of the presence of the viscous sublayer lies in its ability to protect sediments from erosion. Particles will only remain in suspension if the upward velocities arising from turbulence are equal to or exceed the settling velocity of the particles.
Role of the Viscous Sublayer on ST
Critical Threshold for Particle Motion in Noncohesive Sediments. For a sediment particle to move along the bed of a river, it must be subjected to a sufficient force from the movement of water to overcome all the forces that resist motion. On a smooth level surface, a noncohesive, perfectly spherical particle will move easily and the force that produces motion can be readily identified as the hydrodynamic drag force on the sphere resulting from the water movements. Initial resistance to movement and subsequent rolling resistance depend on the density of the sphere. There will be no motion unless the drag force on the sphere is sufficient to overcome the friction. This phenomenon becomes more complex in natural sediments, which are irregularly shaped and arranged and which have nonuniform grain sizes. However, when water flows over a bed made up of noncohesive sand grains nothing happens until the flow rate is increased to the point where individual grains start to move. If the size distribution is not too great, a small increase in this flow rate produces enough force on the grains to initiate the motion of the entire bed, which will be transported as bedload. If the flow rate is further increased, some of the finer particles will be entrained and move as suspended load. Historically, much attention has been focused on the critical threshold for grain motion as this is of importance for engineering work. It is now worth considering in more detail the forces acting on a sediment bed and in particular those acting on a single grain. In contrast to the notion of a spherical particle on a smooth surface, it is unlikely that all grains of sediment protrude above a smooth surface. It is more appropriate to consider a single particle that is part of the bed (see Figure 1). In the absence of fluid flow, the only forces acting on the particle are the gravitational force arising from the particle’s mass acting in the downward vertical direction and the buoyancy force arising from the water displaced by the particle acting upward. When
In the viscous sublayer, flow is fairly smooth and may be considered to be quasi-laminar as viscous forces will be dominant. The viscous sublayer does not extend very far into the fluid. The viscous sublayer thins as velocity, or more particularly shear velocity, increases. The thickness, δ, of the viscous sublayer can be estimated as: v δ = 11.6 (7) u∗ where v is the kinematic viscosity and u* is the shear velocity. The shear velocity, u∗ , can be interpreted as a measure of velocity very close to the bed and can be used as a parameter characterizing the bed stress. It can be defined as: � τb ∗ (8) u = ρw One significant consequence for ST arising from the inverse relationship between the viscous sublayer thickness and the shear velocity is that at low current speeds, grains can be completely enclosed by the viscous sublayer, whereas they may extend through the layer as it thins at higher current speeds. This observation leads to the concepts of hydrodynamically smooth and rough beds together with flows that can be characterized by the grain Reynolds number: Reg = ρw u∗
d μ
(9)
This number corresponds to a roughness estimation combining the shear velocity u* and sediment diameter. This number is proportional to the ratio grain diameter/thickness of the viscous sublayer. The thickness of the viscous sublayer is often referred as δ. Namely, if Ks < δ, the bed is hydrodynamically
Encyclopedia of Environmetrics, Online © 2006 John Wiley & Sons, Ltd. This article is © 2013 John Wiley & Sons, Ltd. This article was published in Encyclopedia of Environmetrics Second Edition in 2012 by John Wiley & Sons, Ltd. DOI: 10.1002/9780470057339.vas010.pub2
Sediment transport
5
Lift component FL
,F
id
ea
Flu
F
Dir e sie ction st mo of ve me
ce
for
nt
Forces acting on a grain
Drag component, F D
C. G. a
Bed surface
~ Horizontal
Pivot
Gravity force FG
Figure 1 Forces acting on a noncohesive particle that is part of the bed. (Source: Reproduced with permission from Ref. 6. © SEPM (Society for Sedimentary Geology), 1984.)
there is fluid motion, the hydrodynamic shear on the grain’s surface gives rise to an additional force that can conveniently be decomposed into a lift force that acts in the vertical direction and a drag force that is in the direction of the fluid flow. In general, the drag force will be equivalent to the shear stress acting on the bed, τb , while the lift force arises from the flow of fluid around the particle and can be attributed to the Bernoulli effect where in order to conserve energy the pressure around the particle must change as the kinetic energy of the fluid changes with velocity [6]. The lift force is comparable to the drag force when the particle is on the bed and dies away rapidly as the grain moves away from the bed as the drag force increases with corresponding rapidity. The combined fluid forces seeking to move the grain are opposed by the gravity force and aided by the buoyancy force. The forces that act on the single particle are also acting on all the other particles on the surface of the bed, so that once the hydrodynamic stresses have passed the critical value for one particle, they will have been exceeded for all similar particles. However, because sediment beds are complex structures consisting of extremely large numbers of particles of varying size, and because environmental fluid flows are themselves complicated, in spite of many attempts, it has not yet been possible to make a priori theoretical predictions of the critical stress
that moves sediment grains. Instead, the common practice is to take experimental measurements to determine the critical hydrodynamic bed stress for the erosion of noncohesive particles. The results are often presented in terms of various nondimensional numbers. For example, Shields [16] has shown that the critical shear stress, τcr , is a function of the particle size, the excess density between grain and water, gravity, and the kinematic viscosity of water, v , that is, τcr = f [d, g, (ρg − ρw ), v ]. This can be rearranged into an appropriate nondimensional parameter θ θ=
τcr =f gd(ρg − ρw )
�
u∗ · d v
� (10)
Shields produced a diagram where the entrainment function is presented as a function of the grain or particle Reynolds number Reg ((10) and Figure 2). The nondimensional term on the left-hand side of (10) is known variously as the nondimensional bed shear stress, the entrainment function, or the Shields parameter θ . The area of the diagram located above the curve corresponds to grains in movement (Figure 2). Figure 2 shows that at low Reg , the Shields parameter is high. This can be explained by the fact
Encyclopedia of Environmetrics, Online © 2006 John Wiley & Sons, Ltd. This article is © 2013 John Wiley & Sons, Ltd. This article was published in Encyclopedia of Environmetrics Second Edition in 2012 by John Wiley & Sons, Ltd. DOI: 10.1002/9780470057339.vas010.pub2
6
Sediment transport 100 Threshold of sediment motion after shields (1936) Solid line from Vanani (1964)
q
Amber Lignite Graphite Barite
Sand (Casey) Sand (Kramer) Sand (USWES) Sand (Gilbert)
10−1
10−2 100
101
102
103
Re g
Figure 2 Typical Shields diagram showing θ as a function of Reg . (Source: Reproduced with permission from Ref. 17. © International Association of Sedimentologists, 1977. Published by John Wiley and Sons.)
that grains of the bed are fully submerged by the viscous sublayer and are protected from turbulent flows. In contrast, when the bed is hydrodynamically rough, once Reg exceeds about 200, the entrainment factor is approximately constant (θ ≈ 0.047). This part of the diagram is assumed to be applicable to natural river flows. From 10, one can calculate the critical threshold of shear stress that allows the motion of a particle of a grain size by giving a finite value to θ (usually ranging from 0.03 to 0.06 and often taken as 0.047): τcr = 0.047(ρg − ρw )gd
(11)
It should be noted that there are other ways of expressing threshold relationships; for a typical example, see Miller et al. [17] who use a number of these relations to describe the threshold of sediment motion under unidirectional currents. Using a nondimensional particle size parameter, Dp , (Dp = d[g(s − 1)/v 2 ]1/3 , where s is the specific gravity of the particle, i.e., ρg /ρw ), the Shields threshold line has been expressed explicitly [18] as DP < 4,
θ = 0.24/DP
4 < DP < 10,
θ = 0.14/DP0.64
10 < DP < 20,
θ = 0.04/DP0.1
20 < DP < 150, DP < 150,
θ = 0.013/DP0.29 θ = 0.056
(12)
During his experiments, Shields was not able to get data for 2 < Reg < 600. The limits of the works of Shields are clearly stated in Middleton and Southard [6]. If the critical threshold is reached, then the grains will roll over their stationary neighbors and ST is initiated. The more grains that are moved, the more complex the pattern of forces that are operating on the bed (as moving particles are likely to collide with each other and also with stationary particles). Granular movement is not restricted to the surface layer of grains and, as hydrodynamic stresses increase, motion is initiated in the subsurface grains.
Influence of Colloidal Forces on Erosion of Cohesive Sediments Cohesive sediments comprise significant quantities of particles in the colloidal size range and the simple force balance used to relate hydrodynamic drag to the motion of a single particle has to be extended considerably. Typically, in the absence of biological material, cohesive sediment beds consisting of clays are subject to additional interparticle attractive and repulsive colloidal forces. The attractive forces arise mainly from van der Waals attractions, and the repulsive forces arise from electrical double-layer interactions and also lubrication forces [19]. There are significant factors that must be considered when making force balances on clay or mud particles in a
Encyclopedia of Environmetrics, Online © 2006 John Wiley & Sons, Ltd. This article is © 2013 John Wiley & Sons, Ltd. This article was published in Encyclopedia of Environmetrics Second Edition in 2012 by John Wiley & Sons, Ltd. DOI: 10.1002/9780470057339.vas010.pub2
Sediment transport sediment bed as single particles interact with other particles in the bed and the amount of interaction is affected by the sizes, shapes, and separations of the particles together with the ionic strength of the interstitial water. Although the mechanics of colloidal interactions between pairs of particles are well understood, the successful quantitative extension of colloid theory to cohesive sediments has not been made to date. In some instances, colloidal theory through the notion of a mechanically weak structure held together by interparticle forces provides an adequate qualitative description of the response of cohesive sediments to hydrodynamic shear, but the presence of biological materials provides additional complications. For example, in some cases resistance to erosion might not be attributed to a network of simple interparticle forces but to a surface coating of biological material. In addition, while noncohesive particles respond individually to hydrodynamic shear, it is more likely that flocs or clusters of primary particles or even aggregates consisting of particles and flocs are eroded from cohesive beds. Following erosion, the size of the flocs and aggregates that are transported will depend on the intensity of turbulence. Increased shear ruptures aggregates, causing the size of an aggregate or floc to be reduced as particles are removed. In contrast, decreased shear increases the chances of flocs colliding, thereby providing the opportunity for floc growth. This implies that there may be an equilibrium size of flocs in a particular shear field. Although cohesive forces increase the resistance to erosion in the bed of mud, it might be expected that once particles are removed from the bed they will be more easy to transport because they have low settling velocities and consequently need little turbulence to keep them in suspension. This is only partly true because a reduction in turbulence can lead to increased aggregate size and although the bulk density of the new aggregate is likely to be reduced this is usually outweighed by the increase in size that produces reduced drag per unit area of the floc, allowing it to settle more rapidly. In the absence of more rigorous theory, the erosion and transport of cohesive sediments is characterized in terms of the response to bed stress, the threshold of erosion, the settling behavior, and strength of the flocs. Some scientists have directly measured the shear strength of sediments in rheological experiments [20, 21], while others observe the increase in
7
turbidity above a bed linking an increase in turbidity to erosion at the appropriate hydrodynamic shear [22, 23].
Sediment Suspension Sediments are denser than water and hence in the absence of fluid motion will settle through the water column. The settling behavior of an individual sediment particle can be explained in terms of the balance of forces acting on the particle. These are the weight of the particle, the drag force on the particle, and the buoyant upthrust on the particle due to displaced fluid. If the particle starts moving from rest in a stationary fluid, the initial imbalance in these forces causes the particle to accelerate to its terminal velocity, by which time the drag force will have grown and balances the other forces. Using the quadratic drag law, the force on the particle is Fp =
1 CD Ap ρw ut 2 2
(13)
where Ap is the area of the particle perpendicular to the direction of motion and ut is the terminal settling velocity of the particle. If Vp is the volume of the particle, then the masses of the particle and the water it displaces are respectively ρg Vp and ρw Vp , so that the force balance on the particle is expressed as: (ρg − ρw )Vp g −
1 CD Ap ρw u2t = 0 2
Equation (14) is easily rearranged as � � 2(ρg − ρw )Vp g 2 ut = CD Ap ρw
(14)
(15)
The drag coefficient, CD , is a function of the Reynolds number in the laminar, transitional, and turbulent flow regimes but has to be determined experimentally outside the laminar region. For a spherical particle of diameter d, in laminar flow CD =
24 Reg
(16)
where Reg is the particle Reynolds number. As Reg = ρw ut d/μ, the settling velocity of a spherical particle is (ρg − ρw )gd 2 (17) ut = 18μ
Encyclopedia of Environmetrics, Online © 2006 John Wiley & Sons, Ltd. This article is © 2013 John Wiley & Sons, Ltd. This article was published in Encyclopedia of Environmetrics Second Edition in 2012 by John Wiley & Sons, Ltd. DOI: 10.1002/9780470057339.vas010.pub2
8
Sediment transport
An important feature of (17), which is known as Stokes’ law , is that the settling velocity is proportional to the square of the diameter of the spherical particle. Stokes’ law is obeyed when the particle Reynolds number, Reg , is less than 0.5. In the general case when the particle is neither smooth nor spherical it is usual to introduce some factor that accounts for the irregular shape of the particle. This factor necessarily has to be found from experimental measurements. In general, approximately spherical grains of sand and silt can be expected to have terminal settling velocities similar to those of spheres having an equivalent diameter. In contrast, plate-like particles such as shell-derived sands do not settle like a sphere, but travel downwards with complex pendulum-like side-to-side translational motion (like a falling leaf). The settling behavior of such particles has to be determined experimentally. Apart from extreme cases such as plate-like particles, Stokes’ law applies to an individual particle settling in the absence of other particles and without interference from a nearby boundary. In general, Stokes’ law provides a good basis for describing the settling behavior of groups of particles in which the individual motions of one particle do not interfere with the other particles, that is, discrete settling behavior. As the concentration of particles increases, the motion of a single particle is not independent of the remaining particles. At higher concentrations there is increased drag and mutual interference in the motion of particles, so the settling rate is reduced. The settling velocity of a concentrated suspension of grains, uct , has been found to be related to the volumetric concentration of the particles μct = μt (1 − ϕ)nr
particle must be balanced by upward directed hydrodynamic shear. This can be seen to arise from the vertical component of the velocity vector. In a quiescent fluid, the grain will settle and the drag comes from the downward motion of the particle. If the forces are in balance, the settling velocity is constant and is known as the terminal settling velocity of the particle; see (14). Thus, if the upward component of fluid velocity is equal to the terminal settling velocity, then the grain will be stationary; if it is larger the grain will rise and if smaller the grain will settle. Note that this simple analysis assumes that the drag coefficient CD is independent of the velocity; as this is only true for laminar conditions, it again illustrates the difficulties encountered even in an apparently simple situation. However, returning to the simple model, it is evident that one of the main requirements for ST is a velocity field that not only has a horizontal component of motion, but also vertical components. It is therefore no surprise that ST is usually associated with turbulent fluid motion. Once it is recognized that in many instances the concentration of suspended solids decreases with increased height above sediment beds, as does the velocity, then by considering a mass balance over a slice of fluid of unit area in the x –y plane moving in the x-direction at a velocity u¯ (see Figure 3), and assuming that there are no horizontal concentration gradients, a transport equation can be obtained [25]. It is further assumed that the average relative velocity between the particle and the fluid is the terminal settling velocity, ut . If C is the concentration at some height z, above the bed, then, to
(18)
where ϕ is the volume concentration of the sphere and nr is the Richardson–Zaki parameter that can take values between 2.3 and 4.65. The correlation suggested by (18) was first reported following experiments with suspensions of monodisperse spheres for which nr = 2.65 [24]. It is now worth considering the mechanics of particle suspension, as these are important in determining the transport of sediment. For a single particle to be stationary and suspended in a fluid, the sum of the forces acting on it must be zero. In practice, most sediment grains are denser than water so the downward force resulting from the immersed weight of the
Current Downward particle flux
dz
Decreasing concentration Upward particle flux
H
z
Sediment bed
Figure 3 Downstream, upward and downward sediment suspension fluxes. (Source: Reproduced from Ref. 13. © John Wiley and Sons, Ltd., 2002.)
Encyclopedia of Environmetrics, Online © 2006 John Wiley & Sons, Ltd. This article is © 2013 John Wiley & Sons, Ltd. This article was published in Encyclopedia of Environmetrics Second Edition in 2012 by John Wiley & Sons, Ltd. DOI: 10.1002/9780470057339.vas010.pub2
Sediment transport first order in δz, the upward transport rate is +(w� − ut )[C − δz(dC/dz)] and the downward transport rate of sediment particles is −(w� + ut )[C + δz(dC/dz)], where w� is the fluctuating component of the vertical velocity. At equilibrium, the sum of the upward and downward fluxes of particles must be zero so the transport rate can be written as w� δz
dC + ut C = 0 dz
(19)
The required solution (19) follows if the Prandtl mixing length model for flow near a solid boundary is used. It is necessary to identify δz with the mixing length l and then recall that experimental observations suggest that u� is of the same order of magnitude as w� in the constant-stress layer. This allows one to replace w� δz by u� l. Additional relationships that are needed are u� = l(du/dz) ¯ and τ = 2 ¯ , l = Kz, where K is the von Karman ρw l 2 (du/dz) constant and du/dz ¯ = u∗ /Kz, which is the differential form of the logarithmic velocity profile: � � dC ut H z(H − z) + C=0 (20) dz u∗ K Equation (20) is readily integrated to � � � � ut zr (H − z) C = ln ln Cr K u∗ z(H − zr )
(21)
where Cr is a reference concentration at some height zr (see Refs 18, 25). Equation (21) provides a description of the vertical concentration gradient but contains constants that need to be determined experimentally. The value of the von Karman constant, K, is usually taken as 0.4 for a fluid in which there are no particles present. In fact, K is a function of the suspended sediment concentration. Since, apart from the case of fine silts, suspended load transport rarely occurs on its own, most sediment movements occur either as bedload transport or a combination of bedload and suspended transport. Thus, most effort has been made to predict the total load transported using tractive force methods.
Bed Forms in Cohesionless Sediments Once particle motion has been initiated the morphological configuration of the bed will change. In both
9
cohesionless and cohesive sediments, the arrangement of grains can define bed forms, which can be considered as geometric units characterized by a specific internal arrangement of sediments (sedimentary structures) which traduces prevailing hydrodynamics and sedimentary conditions [26]. In noncohesive sediments, bedforms can be considered as part of a continuum governed by flow conditions and sediment features (size, sorting, etc.). River and coastal bed forms were heavily studied in the past [27, 28] in terms of genesis, influence on flows, ST rates, and geological preservation potential. Bedforms are strongly affected by flow regimes (i.e., subcritical and supercritical regimes). For subcritical flows (i.e., Fr < 1), various bedforms can occur on a bed made of noncohesive sediments. At stresses slightly greater than the critical value of motion and for relatively coarse sediments, lower stage plane beds (i.e., bedload sheets, pebble clusters) results from the disruption of the viscous sublayer by coarse grains. For relatively fine sandy sediments, ripple marks can be observed. They correspond to bed oscillations of a few centimeters high, moving downstream and characterized by a planar or curved cross bedding associated to the form of their crest [27]. This type of internal structure is linked to the movement of the bedform made possible because of the presence of a stoss side (gentle slope, located upstream) where grains are eroded, a lee side (higher slope, located downstream) where grains are deposited by avalanching or by settling due to a separation of flow just downstream the bedform. The initiation of ripples is correlated with the streaky aspect of the viscous sublayer. The presence of low-speed streaks flowing longitudinally and the ejection of low-momentum fluid from the viscous layer as hairpin vortices (which burst in the buffer layer) are the cause of local bed defect several grains high on which flow separation can occur. Further downstream, increased turbulences will cause another bed defect. These defects will grow and migrate downstream (Figure 4) until the bed is covered with ripples [29, 30]. When flow velocity and grain size increase, dunes can appear. As for ripples, dunes can be characterized by their geometric features such as height hh and wavelength, λ which are log-linearly related [31]. hh = 0.0677λ0.8098
Encyclopedia of Environmetrics, Online © 2006 John Wiley & Sons, Ltd. This article is © 2013 John Wiley & Sons, Ltd. This article was published in Encyclopedia of Environmetrics Second Edition in 2012 by John Wiley & Sons, Ltd. DOI: 10.1002/9780470057339.vas010.pub2
(22)
10
Sediment transport
Flow
z+~ 100
Primay hairpin vortex and low speed streaks
(a)
Formation of subsidiary and secondary vortices (b)
Multiple streaks and sweeps form flow parallel sediment ridges (c)
(d)
Longitudinal ridges concentrate position of subsequent sweeps, generation of formative bed defect
Sweeps amplify bed defect height. Flow separation generates downstream erosion and ripple propagation (e)
Figure 4 Formation of bed defects according to Best, 1992. (Source: Reproduced with permission from Ref. 29. © International Association of Sedimentologists, 1992. Published by John Wiley and Sons.)
Dunes can exert a strong feedback on bed roughness, flow velocity, and ST rates. For the latter point, several studies pointed out their control on hysteresis of ST rates during flood events in sandy-graveled
rivers [32]. As shown by Refs 33 and 34 among others, hh and λ adapt to unsteady flow conditions with a time lag. The dunes themselves will become washed out (humpback dunes) as the fluid flow
Encyclopedia of Environmetrics, Online © 2006 John Wiley & Sons, Ltd. This article is © 2013 John Wiley & Sons, Ltd. This article was published in Encyclopedia of Environmetrics Second Edition in 2012 by John Wiley & Sons, Ltd. DOI: 10.1002/9780470057339.vas010.pub2
Sediment transport
+ ++ ++ + ++ Upper plane
+ + + +
Fr = 1.0
+
+ ++ ++ +
Fr = 0.84
+ Gra
dua
+ + +
Antidunes + + +
l
1.0 0.8
Abru
pt
Dunes
l ua ad Gr dual a Gr
0.6 Ab
r we
pt
ru
Mean flow velocity, m/s (standardized to 10 °C water temperature)
2.0
11
0.4 Ripples
× ×
ne
pla
Lo
No movement
×
Mean flow depth 0.25 – 0.40 m
0.2
1.0 Median sediment size, mm (standardized to 10 °C water temperature)
0.1
Figure 5 Stability fields of bed phases in sandy sediments according to Ashley, 1990. (Source: Reproduced with permission from Ref. 31. © SEPM (Society for Sedimentary Geology), 1990.)
velocity increases and upper stage plane beds can appear. For supercritical flows (Fr > 1), sinusoidal forms parallel to the water surface called antidunes can form. Owing to the flow regime, these bed forms can migrate upwards eroding their upstream face. Figure 5 shows that, for sandy particles, the abovementioned bed forms are part of a continuum depending on sedimentary (here median grain size) and flow (here flow velocity) conditions. Obstacles present on the bed of river channels, specifically vegetation, can also generate obstacle marks [35, 36] which are often involved in island edification and morphological evolution of rivers [37–39]. Alluvial macroforms correspond to forms of the bed which are scaled to the channel width (bars, riffle/pool sequences). Owing to their condition of formation, bars are recognized to be free or forced. Free bars are generated by the instability of turbulent flows over an erodible bed [40, 41]. Their formation depends principally on the aspect ratio
β = W/H of river channels (where W is channel width). Forced bars are due to a change in channel geometry (sinuosity, widening). Alternate bars (which can be free or forced, migrating or steady) are sediment waves consisting of consecutive diagonal fronts with low slope riffles located upstream. Their wavelength ranges usually between 5 and 12 channel widths. The formation of alternate bars have been extensively studied by mathematical or experimental investigations [42] as well as their role on channel pattern [43–45] since they are suspected to be at the origin of braiding or meandering of rivers. Their wavelength, can be predicted by various mathematical expressions according to Froude number (Fr), channel width (W ), flow depth (H ), and roughness length (zb ) [46]: Froude number < 0.8 λ=5
WH Cf
Encyclopedia of Environmetrics, Online © 2006 John Wiley & Sons, Ltd. This article is © 2013 John Wiley & Sons, Ltd. This article was published in Encyclopedia of Environmetrics Second Edition in 2012 by John Wiley & Sons, Ltd. DOI: 10.1002/9780470057339.vas010.pub2
(23)
12
Sediment transport Froude number ≥ 0.8 � λ = 181 B Cf
WH Cf
� (24)
1
With Cf , a roughness number related to the Chezy coefficient, determined using the following relation reported in Ref. 47 (in gravel bed rivers): �� � � H −2 Cf = 2.5 ln 11 zb
(25)
The role played by bars in alluvial architecture has been documented by facies models developed for various river types [48, 49]. The facies models highlighted the limits of reconstituting the processes involved in the formation of alluvial sequences.
Quantification of Bedload Transport Rates Empirical Equations Since the seminal works of Du Boys [50], a large number of equations (theoretical or empirical) have been developed to predict bedload transport rates (qb ) for a large range of particle grain sizes and hydraulic conditions [51]. Most of these equations are based on the concept of excess shear stress developed by Du Boys [50] qb = f (X − Xc ) where X is a quantity associated to the flow (velocity, shear stress, etc.) and Xc a threshold value of the same quantity. The Meyer-Peter M¨uller [52] equation is one of the most popular. The bedload transport rate qs (kg s−1 m−1 ) is given by: ⎞3 ⎛ � � �3 2
n 2 qb = 8ρg g(s − 1)d50 3 ⎝ θ − 0.047⎠ n (26) where s is the sediment density ratio; d50 is the median grain size; n� is the particle roughness; n is the total roughness; and θ is the Shields number. The particle roughness (n� ) is equal to: �
n =
1 d90 2
�
26
where d90 corresponds to the coarser fraction of sediment (90% of the sample are lower in weight). The total roughness (n) is calculated as follows:
(27)
2
Jw2 H 3 n= u¯
(28)
where Jw is the water surface slope (m m−1 ); H is the water depth (m); and u¯ is the depth-averaged flow velocity (m s−1 ). The ratio n� /n normally ranges between 0.5 and 1. The absence of a relative depth H /d50 (in 26) shows that this equation is only applicable to rolling and sliding modes of transport and not to suspended material load which varies with flow depth [53]. Although application of 26 is normally restricted to 0.4–28.6 mm uniform sediments or mixtures in steep rivers with high rates of bedload transport [51], the Meyer Peter M¨uller formulae is commonly used to assess bedload transport in a wide range of systems. The semi empirical formula of Van Rijn [18] computes bedload transport from the product of separated functions that assess the thickness of the bedload layer, the sediment concentration within this layer, and particle velocity. This formula was defined for sandy particle sizes ranging between 0.2 and 2 mm. The bedload transport estimated from the Van Rijn formula, qb (kg s−1 m−1 ) is equal to: qs = ρg 0.1
T 1.5 Dp 0.3
1.5 [(s − 1)g]0.5 d50
(29)
where s is the sediment density ratio; g is the acceleration due to gravity; d50 is the median grain size of sediment; T is the transport stage, and Dp is a scaled particle parameter expressed as follows: � Dp = d50
�1 (s − 1)g 3 v2
(30)
where v is the kinematic viscosity. The transport stage parameter T , or excess shear parameter, is calculated using the following equation: T =
(u�∗ )2 − (u∗cr )2 (u∗cr )2
(31)
where u�∗ is the bed shear velocity related to grains and u∗cr is the critical bed shear velocity according to
Encyclopedia of Environmetrics, Online © 2006 John Wiley & Sons, Ltd. This article is © 2013 John Wiley & Sons, Ltd. This article was published in Encyclopedia of Environmetrics Second Edition in 2012 by John Wiley & Sons, Ltd. DOI: 10.1002/9780470057339.vas010.pub2
Sediment transport Shields. The bed shear velocity related to grains (u�∗ ) is expressed as follows: u�∗ =
u¯ � � 12 H 5.75 log 3 d90
(32)
where u¯ is the depth-averaged flow velocity; H is the water depth; and d90 represents the grain size of sediment for which 90% of the particles are lower in weight. For sandy rivers, the critical bed shear velocity u�∗ is defined from the Shields curve [18] as follows: u∗cr = [0.013DP0.29 (s − 1)gd50 ]0.5 with 20 < Dp < 150
(33)
Other types of bedload rate predictors were developed by Bagnold [54] and more recently by Wilcock et al. [55] and Recking[56] are not based on the concept of excess shear stress. Bagnold based his empirical formulae on the concept of power performed by a river to transport sediments: � e � b (34) qb = ω tan α where qs is the rate of ST by immersed weight, eb is a bedload transport efficiency factor, ω is the stream power equal to ρw gH Je u = τb u (ρw , is the fluid density, g, the acceleration of gravity, H , the flow depth, Je the slope of the energy line, u the mean flow velocity), and α is a friction coefficient for bed material. Garcia [57] details the doubts related to the hypothesis of Bagnold, while Gomez and Church [58] showed that Bagnold’s formulation was accurate in perennial gravel-bed streams.
Direct Measurements of Bedload Transport Rates Beldoad can also be assessed from direct measurements carried out using isokinetic (or not) sediment samplers directly deposed on the bed (e.g., Helley–Smith, bedload transport meter Arnhem (BTMA), Karolyi sampler, etc.). The type of sediment sampler [59] is mainly conditioned by the size and nature of sediments of the environment under consideration. These bedload samplers, as well as bedload monitoring stations equipped with box samplers, pressure-pillow samplers [60], have
13
been extensively used in small gravel- and sandbed rivers [51, 61]. In large sand- and gravel-bed rivers [32, 62], sediment gauging is technically difficult, time-consuming, and expensive. The reliabilities of the samplers used to measure bedload transport, in spite of its high temporal and spatial variability, have been analyzed in several studies [63, 64].
Indirect Estimates of Bedload Transport Rates In order to face the technical difficulties of direct bedload gauging, alternative methods were developed [65]. For gravel bed rivers, tracers such as particles with luminescent dyes, magnetic bars, and acoustics markers are usually used. One of the most common techniques consists in the use of passive integrated transponders (PIT) tags inserted in cobbles which are radiotracked. Acoustic devices can also be used. In sandy fluvial and coastal environments, radioactive tracers were also used as well as other indirect methods. For instance, the dune tracking method, based on the product of dunes size with their migration rate, can provide accurate predictions of bedload discharges [32, 66]. This method differs from the models mentioned above as it is based on surveys of the morphological evolution of the river bed qb = βhh εc ρg
(35)
where qs is the bedload transport rate, β the bedload discharge coefficient, hh is the bedform height, ε is the sediment concentration in the bedform (1porosity), and c is the celerity of bed forms determined from bathymetrical surveys. The β coefficient is equal to 0.5, if the dunes are triangular when they are considered along a plan parallel to the downstream direction. In general, the β coefficient varies between 0.49 and 0.60 [67, 68].
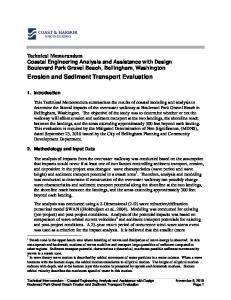
Comparison of Bedload ST Models The results obtained with various bedload transport equations have been compared to estimates of bedload transport rates [51, 58] obtained using other methods such as sediment gauging (Figure 6) even if this method is known to be relatively inaccurate. For instance, [58] have shown over-prediction associated with the use of the Meyer Peter Muller formulae
Encyclopedia of Environmetrics, Online © 2006 John Wiley & Sons, Ltd. This article is © 2013 John Wiley & Sons, Ltd. This article was published in Encyclopedia of Environmetrics Second Edition in 2012 by John Wiley & Sons, Ltd. DOI: 10.1002/9780470057339.vas010.pub2
14
Sediment transport
Total bedload discharge (m3 d−1)
5500 QsGauging QsVR
4500
QsDT QsMPM
3500
2500
1500
500 800
1000
1200
1400
1600
1800
2000
Water discharge (m3 s−1)
Figure 6 Comparison of the total bedload of the Loire River measured with a BTMA and estimated by the Van Rijn, Meyer-Peter and M¨uller formulas, and the dune tracking method). Uncertainty for the total bedload measured with the BTMA corresponds to the standard deviation divided by the square root of the number of measurements. The arrow indicates the temporal evolution of water discharges. (Source: Reproduced from Ref. 32. © Elsevier.)
for the Elbow River (Canada). Claude et al. [32] compared Meyer-Peter M¨uller, Van Rijn, dune tracking, and direct sediment gauging in the Loire River (France). In Figure 6, the bedload measured with the BTMA are characterized by a clockwise hysteresis during the 1-in-2 year flood. This means that at equivalent water discharges, the bedload transport is higher before the flood peak than after. In sand-gravel bed rivers, the hysteresis of bedload transport can be partly explained by the lag time associated with the adaptation of dunes morphology to changing flow conditions [34]. For example, dunes are larger after the peak of the flood, which means that dune-related roughnesses and turbulences are also higher and less energy is available for bedload transport during the falling limb of the flood [18]. Figure 6 shows that indirect methods used for bedload discharge estimation (namely Meyer-Peter M¨uller, Van Rijn, and dune tracking) predict this hysteresis but underestimate its magnitude.
References [1]
[2]
Miall, A.D. (1996). The Geology of Fluvial Deposits: Sedimentary Facies, Basin Analysis, and Petroleum Geology, Springer, Berlin, 582 pp. Perry, C. & Taylor, K. (2007). Environmental Sedimentology, Blackwell Publishing, p. 441.
[3]
Bridge, J.S. (2003). Rivers and Floodplains: Forms, Processes, and Sedimentary Record , Blackwell, Oxford, 491 pp. [4] Detriche, S., Rodrigues, S., Macaire, J.-J., Bonte, P., Breheret, J.-G., Bakyono, J.-P. & Juge, P. (2010). Caesium-137 in sandy sediments of the River Loire (France): assessment of an alluvial island evolving over the last fifty years, Geomorphology 115, 11–22. [5] St-Hilaire, A., Courtenay, S.C., Diaz-Delgado, C., Pavey, B., Ouarda, T.B.M.J., Boghen, A., & Bob´ee, B. (2006). Suspended sediment concentrations downstream of a harvested peat bog: analysis and preliminary modelling of exceedances using logistic regression, Canadian Water Resources Journal 31(3), 139–156. [6] Middleton, G.V. & Southard, J.B. (1984). Mechanics of sediment movement: society of economic paleontologists and mineralogists, Short Course 3, 401. [7] Meybeck, M. & Moatar, F. (2012). Daily variability of river concentrations and fluxes: indicators based on the segmentation of the rating curve, Hydrological Processes 26, 1188–1207. [8] Higgins, H., St-Hilaire, A., Courtenay, S.C., & Haralampides, K.A. (2011). Suspended sediment dynamics in a tributary of the Saint John River, New Brunswick, Canadian Journal of Civil Engineering 38(2), 221–232. [9] Meybeck, M., Laroche, L., Durr, H.H., & Syvistski, J.P.M. (2003). Global variability of daily total suspended solids and their fluxes in rivers, Global and Planetary Change 39, 65–93. [10] Tramblay, Y., Saint-Hilaire, A., Ouarda, T.B.M.J., Moatar, F., & Hecht, B. (2010). Estimation of local
Encyclopedia of Environmetrics, Online © 2006 John Wiley & Sons, Ltd. This article is © 2013 John Wiley & Sons, Ltd. This article was published in Encyclopedia of Environmetrics Second Edition in 2012 by John Wiley & Sons, Ltd. DOI: 10.1002/9780470057339.vas010.pub2
Sediment transport
[11]
[12]
[13] [14]
[15] [16]
[17]
[18]
[19]
[20]
[21]
[22]
[23]
[24]
[25] [26]
extreme suspended sediment concentrations in California rivers, Science of the Total Environment 408(19), 4221–4229. Nash, D.B. (1994). Effective sediment-transporting discharge from magnitude-frequency analysis, Journal of Geology 102(1), 79–95. Simon, A., Dickerson, W., & Heins, A. (2004). Suspended-sediment transport rates at the 1.5-year recurrence interval for ecoregions of the United States: transport conditions at the bankfull and effective discharge, Geomorphology 58(1–4), 243–262. Allec, J. (2002) Sediment transport. Encyclopedia of Environmetrics, 20 pp. DOI: 10.1002/97804470057339. Postma, H. (1967). Sediment transport and sedimentation in the estuarine environment, Estuaries, American Association for the Advancement of Science 83, 158–179. Krumblien, W.C. (1934). Size frequency distribution of sediments, Journal of Sediment Petrology 4, 65–77. Shields, A. (1936). Anwendung der Ahnlichkeitsmechanik und der Turbulenzforschung auf die Geschiebebewegegung, Heft 26, Preuss. Vers. fur Wasserbau und Schiffbau, Berlin. Miller, M.C., McCave, I.N., & Komar, P.D. (1977). Threshold of sediment motion under unidirectional currents, Sedimentology 24, 507–528. Van Rijn, L. (1993). Principles of Sediment Transport in Rivers, Estuaries and Coastal Seas, Aqua Publications, Amsterdam, 700p. Probstein, R.F. (1990). Physical Chemical Hydrodynamics: An Introduction, 2nd Edition, John Wiley & Sons, New York. James, A.E., Williams, D.J.A., & Williams, P.R. (1987). Direct measurement of the static yield properties of cohesive suspensions, Rheologica Acta 26, 437–446. James, A.E., Williams, D.J.A., & Williams, P.R. (1989). Small strain low shear rate rheometry of cohesive sediments, in Physical Processes in Estuaries, J. Dronkers & W.V. van Leussen, eds, Springer-Verlag, Heidelberg, pp. 488–500. Furukawa, K., Wolanski, E., & Mueller, H. (1997). Currents and sediment transport in mangrove forests, Estuarine, Coastal and Continental Shelf Science 44, 301–310. Houwig, E.J. (1997). Determination of the critical erosion threshold of cohesive sediments on intertidal mudflats along the Dutch Wadden Sea coast, Estuarine, Coastal and Shelf Science 19, 545–555. Richardson, J.F. & Zaki, W.N. (1958). Sedimentation and fluidisation, Transactions of the Institute of Chemical Engineers 32, 35–53. Dyer, K.R. (1986). Coastal and Estuarine Sediment Dynamics, John Wiley & Sons, New York. Leclair, S.F. & Bridge, J.S. (2001). Quantitative interpretation of sedimentary structures formed by river dunes, Journal of Sedimentary Research 71, 713–716.
15
[27] Allen, J.R.L. (1984). Sedimentary Structures: Their Character and Physical Basis, Developments in Sedimentology, Elsevier, Amsterdam. [28] Reineck, H.E. & Singh, I.B. (1980). Depositional Sedimentary Environments, Springer-Verlag, Berlin. [29] Best, J.L. (1992). On the entrainment of sediment and initiation of bed defects: insights from recent developments within turbulent boundary layer research, Sedimentology 39, 797–811. [30] Best, J.L. (1996). The fluid dynamics of small scale alluvial bedforms, in Advances in Fluvial Dynamics and Stratigraphy, P.A. Carling & M.R. Dawson, eds, John Wiley & Sons, Ltd, Chichester, pp. 67–125. [31] Ashley, G.M. (1990). Classification of large-scale subaqueous bedforms: a new look at an old problem, Journal of Sedimentary Petrology 60, 160–172. [32] Claude, N., Rodrigues, S., Bustillo, V., Br´eh´eret, J.G., Jug´e, P., & Macaire, J.J. Estimating unit and total bedload discharges in large sand-gravel bed rivers: comparing sediment sampling to dune tracking and bedload equations. Geomorphology, submitted. [33] Peters, J.J. (1978). Discharge and sand transport in the braided zone of the Zaire estuary, Netherlands Journal of Sea Research 12, 273–292. [34] Wilbers, A.W.E. & Ten Brinke, W.B.M. (2003). The response of subaqueous dunes to floods in sand and gravel bed reaches of the Dutch Rhine, Sedimentology 50, 1013–1034. [35] Euler, T. & Herget, J. (2012). Controls on local scour and deposition induced by obstacles in fluvial environments, Catena 91, 35–46. [36] Nakayama, K., Fielding, C.R., & Alexander, J. (2002). Variations in character and preservation potential of vegetation-induced obstacle marks in the variable discharge Burdekin River of north Queensland, Australia:Sedimentary Geology 149, 199–218. [37] Gibling, M.R. & Davies, N.S. (2012). Palaeozoic landscapes shaped by plant evolution, Nature Geosciences 5, 99–105. [38] Rodrigues, S., Breheret, J.G., Macaire, J.J., Moatar, F., Nistoran, D., & Juge, P. (2006). Flow and sediment dynamics in the vegetated secondary channels of an anabranching river: the Loire River (France), Sedimentary Geology 186, 89–109. [39] Rodrigues, S., Breheret, J.G., Macaire, J.J., Greulich, S., & Villar, M. (2007). In channel woody vegetation controls on sedimentary processes and the sedimentary record within alluvial environments: a modern example of an anabranch of the River Loire, France, Sedimentology 54(1), 223–242. [40] Callander, R.A. (1969). Instability and river channels, Journal of Fluid Mechanics 36, 465–480. [41] Colombini, M., Seminara, G., & Tubino, M. (1987). Finite amplitude alternate bars, Journal of Fluid Mechanics 181, 213–232. [42] Tubino, M. (1991). Growth of alternate bars in unsteady flows, Water Resource Research 27, 37–52.
Encyclopedia of Environmetrics, Online © 2006 John Wiley & Sons, Ltd. This article is © 2013 John Wiley & Sons, Ltd. This article was published in Encyclopedia of Environmetrics Second Edition in 2012 by John Wiley & Sons, Ltd. DOI: 10.1002/9780470057339.vas010.pub2
16
Sediment transport
[43] Fredsoe, J. (1978). Meandering and braiding of rivers, Journal of Fluid Mechanics 84, 609–624. [44] Kleinhans, M.G. & van den Berg, J.H. (2010). River channel and bar patterns explained and predicted by an empirical and a physics-based method, Earth Surface Processes and Landforms 35, 1–18. [45] Rodrigues, S., Claude, N., Juge, P., & Breheret, J.G. (2012). An opportunity to connect the morphodynamics of alternate bars with their sedimentary products, Earth surface processes and Landforms 37(2), 240–248. [46] Ikeda, S. (1984). Prediction of alternate bar wavelength and height, Journal of Hydraulic Engineering 110, 317–386. [47] Parker, G. & Peterson, A.W. (1980). Bar resistance of gravel-bed streams, Journal of Hydraulic Engineering 106(10), 1559–1575. [48] Best, J.L., Ashworth, P.J., Bristow, C.S., & Roden, J. (2003). Three-dimensional sedimentary architecture of a large, mid-channel sand braid bar, Jamuna River, Bangladesh, Journal of Sedimentary Research 73, 516–530. [49] Lunt, I.A., Bridge, J.S., & Tye, R.S. (2004). A quantitative, three-dimensional model of gravelly braided rivers, Sedimentology 51, 377–414. [50] Du Boys, P.F.D. (1879). Etude du r´egime et de l’action exerc´ee par les eaux sur un lit a` fond de graviers ind´efiniment affouillable, Annales des Ponts et Chauss´ees S´eries 5 18, 141–195. [51] Batalla, R.J. (1997). Evaluating bed material transport equations using field measurements in a sandy gravel bed stream, Arb´ucies River, NE Spain, Earth Surface Processes and Landforms 22(2), 121–130. [52] Meyer-Peter, E. & Muller, R. (1948). Formulae for bedload transport, Proceedings of the Second Conference of the International Association of Hydraulic Research, Stockholm, Vol. 2, pp. 39–54. [53] Richards, K. (1982). Rivers, form and processes in alluvial channels. 361 p. [54] Bagnold, R.A. (1977). Bedload transport by natural rivers, Water Resources Research 13, 303–312. [55] Wilcock, P.R., Kenworthy, S.T., & Crowe, J.C. (2001). Experimental study of the transport of mixed sand and gravel, Water Resources Research 37, 3349. [56] Recking, A. (2010). A comparison between flume and field bed load transport data and consequences for surface-based bed load transport prediction, Water Resources Research 46, W03518, 16 pp. [57] Garcia, M. (2008). Sedimentation engineering – processes, measurements, modeling and practice, ASCE Manuals and Reports on Engineering Practice n° 110 , M.H. Garcia, eds, American Association of Civil Engineers, 1132 p. [58] Gomez, B. & Church, M. (1989). An assessment of bed load sediment transport formulae for gravel bed rivers, Water Resources Research 25(6), 1161. [59] Hubbell, D.W. (1964). Apparatus and techniques for measuring bedload, Geological Survey Water-Supply Paper 1748, 74 pp.
[60] Reid, I., Bathurst, J.C., Carling, P.A., Walling, D.E., & Webb, B.W. 1997. Sediment erosion, transport and deposition, in Applied Fluvial Geomorphology for River Engineering and Management, C.R. Thorne, R.D. Hey, & M.D. Newson, eds, John Wiley & Sons, Ltd, Chichester, pp. 95–135. [61] Andrews, E.D. (1981). Measurement and computation of bed-material discharge in a shallow sandbed stream, Muddy Creek, Wyoming Water Resources Research 17(1), 131–141. [62] Peters, J.J. (1971). La dynamique de la s´edimentation de la r´egion divagante du bief maritime du fleuve Congo, Acad´emie Royale des Sciences d’Outre-Mer, Rapport Mateba7, Laboratoire de Recherches Hydrauliques, Minist`ere des Travaux Publics, pp. 1–120. [63] Hubbell, D.W., Stevens, H.H., Skinner, J.V., & Beverage, J.P. Jr (1985). New approach to calibrating bed load samplers, Journal of Hydraulic Engineering 111, 677. [64] Kleinhans, M.G. & Ten Brinke, W.B.M. (2001). Accuracy of cross-channel sampled sediment transport in large Sand-Gravel-Bed Rivers, Journal of Hydraulic Engineering 127(4), 258. [65] Ergenzinger, P. & De Jong, C. (2003). Perspectives on bed load measurement, in Erosion and Sediment Transport Measurement in Rivers, J. Bogen, T. Fergus, & D.E. Walling, IAHS, 238 p. [66] Simons, D.B., Richardson, E.V., & Nordin, C.F. (1965). Bedload equation for ripples and dunes, US Geological Survey Professional Paper 462-H. [67] Van den Berg, J.H. (1987). Bedform migration and bedload transport in some rivers and tidal environments, Sedimentology 34(4), 681. [68] Villard, P.V. & Church, M. (2003). Dunes and associated sand transport in a tidally influenced sand-bed channel: Fraser River, British Columbia, Canadian Journal of Earth Sciences 40(1), 115–130.
Further Reading Boiten, W. (2003). Measurement of Sediment Transport, Hydrometry, A.A. Balkema publishers, Tokyo, pp. 155–182. Gaeuman, D. & Jacobson, R.B. (2007). Field assessment of alternative bed-load transport estimators, Journal of Hydraulic Engineering 133, 1319. Krone, R.B. (1963). A Study of Rheological Properties of Estuarine Sediments, Technical Bulletin No. 7, Committee of Tidal Hydraulics, US Army Corps of Engineers, WES, Vicksburg.
(See also Hydrology, environmental; Catchment hydrology; Floods and changing climate: seasonal forecasts and reconstruction; Global warming; Coastal processes) ´ RODRIGUES, FLORENTINA MOATAR, STEPHANE & NICOLAS CLAUDE
Encyclopedia of Environmetrics, Online © 2006 John Wiley & Sons, Ltd. This article is © 2013 John Wiley & Sons, Ltd. This article was published in Encyclopedia of Environmetrics Second Edition in 2012 by John Wiley & Sons, Ltd. DOI: 10.1002/9780470057339.vas010.pub2