The situation of water and sanitation services in Portugal
José M. P. Vieira University of Minho workshop public policy in water supply and sanitation
Oxford, 5 May 2006
Outline ● Introduction ● Institutional framework for water management ● Water supply and sanitation statistical data ● Water and sanitation strategic planning
José M. P. Vieira
2
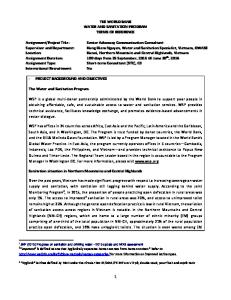
Introduction Climatic factors – Orientation NW-SE of the most important mountainous system – Temporal variability in annual precipitation distribution – Dependence of flows from Spain in international river basins (five of the larger Portuguese rivers) – Meteorological events (prolonged drought periods) can increase seasonal asymmetry of water availability
José M. P. Vieira
3
Introduction Climatic factors
altitude (m)
p (mm/year) 0-500
0-300
500-1000
300-600
1000-1500
600-900
1500-2000
900-1200
2000-2500
1200-1500
2500-3000
>1500
temp (ºC/year) 0-9 9-11 11-13 13-15 15-17 >17
>3000
rainfall
José M. P. Vieira
hypsometry
average annual temperature
4
Introduction Portuguese international river basins
Territory
José M. P. Vieira
Water availability
km2
%
hm3
%
International river basins
56.930
64
24.500
67
Portugal
88.900
100
36.570
100
5
Introduction Climate change scenarios
• increase seasonal asymmetry of water availability • Continuous reduction of agricultural and forest areas • Water demand pressure, with decrease of aquifer natural recharge
José M. P. Vieira
6
Introduction Water uses Domestic 6,4%
Industry Tourism 4,4% 0,2%
Energy 14,1%
Agriculture 74,8%
José M. P. Vieira
7
Introduction Drinking water sources
Population served
Water consumption Groundwater 37%
Surface water 63%
José M. P. Vieira
Groundwater 40%
Surface water 60%
8
Introduction Territorial planning
Metropolitan areas Littoral urbanization zones Urban corridor in zones of urban desertification zones of urban desertification
urban spaces
José M. P. Vieira
urban net of communications
9
Institutional framework Integrated urban water cycle management
Water source
Surface water Groundwater
Water intake
Wells Reservoirs
Final disposal Recycle use
José M. P. Vieira
Water treatment
Distribution system Transport Storage
Treatment Plant
Wastewater treatment Wastewater collection system
Soil, Rivers, Lakes, Oceans
Treatment Plant
10
Institutional framework Water and sanitation management model(s) � Drinking water supply, wastewater collection and treatment, and stormwater are constitutional attributions of the Portuguese local Municipalities � Subsystems of urban water cycle not directly in contact with consumers:
• Plurimunicipal systems • Municipal systems � Subsystems of urban water cycle directly in contact with consumers:
• Municipal systems • Independent public micro-systems José M. P. Vieira
11
Institutional framework Water and sanitation management model(s) � Plurimunicipal systems:
• Multimunicipal systems (public companies with capital shared by the State and the Municipalities)
• Integrated municipal systems (public companies with exclusive participation of Municipalities)
� Municipal systems:
• Municipal Technical Services • Autonomous Technical Services • Municipally-owned companies • Private companies concession José M. P. Vieira
12
Institutional framework Systems territorial integration
multi-municipal systems
multi-municipal systems
integrated municipal systems
integrated municipal systems
non-integrated municipal systems
non-integrated municipal systems
Water supply systems
José M. P. Vieira
Wastewater systems
13
Institutional framework Systems territorial integration Water supply Water treatment and storage systems
Municipalities
Population
Number
%
103 inh.
%
Multi-municipal
180
65
7.025
72
Integrated municipal
50
18
1.033
11
Municipal
48
17
1.058
17
Mainland Portugal
278
100
9.700
100
Municipalities Distribution systems Number
%
243
87
Municipally-owned companies
9
3
Private concessions
26
10
Mainland Portugal
278
100
Municipal authorities
José M. P. Vieira
14
Institutional framework Systems territorial integration Sanitation Wastewater treatment systems
Municipalities
Population
Number
%
103 inh.
%
Multi-municipal
178
64
6.372
66
Integrated municipal
37
13
552
6
Municipal
63
23
1.058
28
Mainland Portugal
278
100
9.700
100
Municipalities Collection systems Number
%
255
92
Municipally-owned companies
9
3
Private concessions
14
5
Mainland Portugal
278
100
Municipal authorities
José M. P. Vieira
15
Statistical data Size of water supply systems Population supplied (106 inh.)
Water supply systems (nº) 2.500
5,0 2245
2.000
4,0
1.500
3,0
1.000
2,0 837
500
1,0 202 74
0 0 – 500
501 – 5.000
5.001 – 20.000
20.001 – 100.000
13
0,0
≥ 100.000
Population (inh.) Number of water supply systems
José M. P. Vieira
Number of inhabitants served
16
Statistical data Population served (2002) Water supply Population served (%) 100 90 80 70 60 50 40 30 20 10 0 North
Centre
Lisbon & Tagus Basin
Alentejo
Algarve
Madeira
Azores
Average (in 2006) ― José M. P. Vieira
93% 17
Statistical data Wastewater produced
Wastewater volumes produced (106 m3) 600.000 500.000
400.000 domestic
300.000 industrial
200.000 100.000 0 1995
José M. P. Vieira
1996
1997
1998
1999
2000
2001
2002
18
Statistical data Population served (2002) Sanitation Population served (%) 100 90 80 70 60 collection system
50
treatment plants
40 30 20 10 0 North
Centre
Lisbon & Tagus Basin
Alentejo
Algarve
Madeira
Azores
Average (in 2006) ― José M. P. Vieira
80% 19
Statistical data Wastewater treatment technologies (2002) Preliminary 5% Untreated 27%
Tertiary 13%
José M. P. Vieira
Primary 11%
Secondary 44%
20
Statistical data Tariff systems average values Average tariff (Euro/m3) Asset management model Water supply
Sanitation
Total
Municipal Technical Services
0,65
0,24
0,89
Autonomous Technical Services
0,92
0,33
1,25
Municipally-owned companies
0,75
0,36
1,11
Private companies concession
0,78
0,32
1,10
0,77
0,29
1,06
Average
José M. P. Vieira
21
Statistical data Tariff systems discrepancies Tariff
José M. P. Vieira
(Euro/m3)
Number of Municipalities Water supply
Sanitation
> 1,00
23
2
0,71 – 0,99
65
4
0,41 – 0,70
146
26
0,21 – 0,40
42
74
0,01 – 0,20
2
109
0
–
63
Total
278
278
22
Strategic planning PEAASAR 2007-2013
Strategic Objectives: ● Universality, continuity and quality of service ● Sustainability of assets ● Environmental values protection
José M. P. Vieira
23
Strategic planning PEAASAR 2007-2013 Operational Objectives: ● Universality, continuity and quality of service
― Drinking water public services: 95% of total inhabitants ― Wastewater collection and treatment public services: 95% of total inhabitants
― Adequate quality level of services ― Tariff systems considering the population economic capacity
José M. P. Vieira
24
Strategic planning PEAASAR 2007-2013 Operational Objectives: ● Sustainability of assets
― Guarantee, in a reasonable time, the recovery of the total service costs ― Optimize the operational management and eliminate inefficiency costs
― Contribute for sustainable employment promotion by means of national and regional enterprises dynamics environment
José M. P. Vieira
25
Strategic planning PEAASAR 2007-2013 Operational Objectives: ● Environmental values protection
― Comply with Portuguese and European environmental legislation ― Guarantee an integrated approach for pollution prevention and control
― Increase the productivity and competitiveness in water supply and sanitation promoting eco-efficient solutions
José M. P. Vieira
26
Strategic planning PEAASAR 2007-2013 Investment plan: Integrated systems Investment (M€) Asset management model Water supply
Sanitation
Total
Multimunicipal – Works conclusion
50
60
110
Multimunicipal – Expansion to new Municipalities
130
265
395
Integrated Municipal – Systems conclusion
40
85
125
Complementary investments
100
70
170
320
480
800
Total
José M. P. Vieira
27
Strategic planning PEAASAR 2007-2013 Investment plan: Municipal systems Investment (M€) Region Water supply
Sanitation
Total
North
384
654
1.039
Centre
131
317
447
Lisbon and Tagus River Basin
92
347
439
Alentejo
105
114
219
Algarve
31
45
75
741
1.478
2.218
Total
José M. P. Vieira
28