No 240 – August 2016
The Impact of the Real Exchange Rate Changes on Export Performance in Tanzania and Ethiopia
Kifle Wondemu and David Potts
Editorial Committee Shimeles, Abebe (Chair) Anyanwu, John C. Faye, Issa Ngaruko, Floribert Simpasa, Anthony Salami, Adeleke O. Verdier-Chouchane, Audrey
Coordinator Salami, Adeleke O.
Copyright © 2016 African Development Bank Headquarter Building Rue Joseph Anoma 01 BP 1387, Abidjan 01 Côte d'Ivoire E-mail:
[email protected]
Rights and Permissions All rights reserved. The text and data in this publication may be reproduced as long as the source is cited. Reproduction for commercial purposes is forbidden. The Working Paper Series (WPS) is produced by the Development Research Department of the African Development Bank. The WPS disseminates the findings of work in progress, preliminary research results, and development experience and lessons, to encourage the exchange of ideas and innovative thinking among researchers, development practitioners, policy makers, and donors. The findings, interpretations, and conclusions expressed in the Bank’s WPS are entirely those of the author(s) and do not necessarily represent the view of the African Development Bank, its Board of Directors, or the countries they represent.
Working Papers are available online at http:/www.afdb.org/
Correct citation: Wondemu, Kifle and Potts, David, (2016), The Impact of the real exchange rate changes /on export performance in Tanzania and Ethiopia, Working Paper Series N° 240, African Development Bank, Abidjan, Côte d’Ivoire.
AFRICAN DEVELOPMENT BANK GROUP
The Impact of the Real Exchange Rate Changes on Export Performance in Tanzania and Ethiopia
Kifle Wondemu and David Pottsa
Working Paper No. 240 August 2016
Office of the Chief Economist
a
University of Bradford
Abstract The importance of trade as an engine of growth is well established. Empirical literature shows that the growth impact of exports is much stronger when the export basket is vertically and horizontally diversified. This paper aims to assess the role of the real exchange rate in enhancing export supply and promoting export diversification in Ethiopia and Tanzania. The empirical results suggest that, while overvaluation is harmful to exports, undervaluation of the real exchange rate boosts export supply as well as export diversification. A high rate of growth in exports is associated with periods of undervalued Key words: Real exchange rate, undervaluation, export, diversification, Ethiopia, Tanzania JEL Classification: F41, F13, F31
currencies. A major share of the difference in export performance between the two countries can be explained by differences in real exchange rate policy. Tanzania has maintained an undervalued real exchange rate for a long time and as a result, performs better in terms of export supply and diversification. However, export expansion achieved through undervaluation raises the rate of inflation for Tanzania. Tanzania managed to maintain an undervalued real exchange rate through the accumulation of reserves and a high rate of inflation.
1. Introduction
This paper investigates the impact of real exchange rate changes on the export performances of Ethiopia and Tanzania. Both countries have gone through a process of liberalisation including significant changes in both the nominal and real exchange rate. In the case of Tanzania, the exchange rate liberalisation process started in 1982 with a 10% currency devaluation followed by further devaluations by 20% and 26% in 1983 and 1984 respectively1. These devaluations were regarded by aid donors to be insufficient to deal with the problem of overvaluation and resulted in a stand-off period before Tanzania finally agreed to IMF conditions for a substantial real devaluation in 1986 followed by an ongoing process of exchange rate depreciation. Ethiopia maintained a fixed exchange rate until 1992 when a substantial devaluation took place followed by ongoing depreciation (Taye 1999).
Both countries have also experienced rapid growth in GDP and exports.
Exports as a
2
percentage of GDP have increased in both countries , both economies have become more open, and average tariff rates have been significantly reduced3. In both cases, the nominal exchange rate has depreciated steadily over the period covered in this paper. Overall the process of liberalisation has been slower in Ethiopia, and the Ethiopian economy remains less open and more protected than that of Tanzania. The proportion of import costs covered by export revenue has declined in Ethiopia but increased in Tanzania (Table1).
In both cases exports have grown faster than GDP, suggesting that it is exports that lead to growth rather than the other way round. The importance of trade as an engine of growth is well established. Trade boosts growth by enlarging market opportunities, permitting specialization according to comparative advantage and facilitating access to new technologies. Although the debate as to the direction of causation between exports and growth is contested, there is a consensus that exports are critical for growth, particularly for developing countries. However, the impact of exports on growth is not only influenced by the volume exported but also more importantly by its composition. A horizontally diversified
1
The policy reform process in Tanzania including exchange rate liberalisation is described in Potts (2008). Other sources on policy reform in this period include Coulson (2013), Lofchie (2014) and Edwards (2014). 2 Exports as a percentage of GDP in Tanzania increased from 12.6% in 1990 to 19.8% in 2014. Exports as a percentage of GDP in Ethiopia increased from 3.2% in 1992 to 11.7% in 2014 (WDI 2015). 3 The simple average tariff rate in Ethiopia declined from 29.41% in 1995 to 18.15% in 2012. In Tanzania, it declined from 15.54% in 1993 to 12.98% in 2014 (WDI 2016).
5
export basket generates faster and more sustainable growth than concentration on one or a few export products (Elbadawi, 1998). In particular, reliance on the export of primary commodities may be hostile to growth if it results in short-run export revenue volatility and has detrimental effects on domestic investment (Dawe 1996). For a number of reasons, a vertically diversified export base may be more desirable for growth. First, exports of manufactured products are likely to grow faster when the global economy is expanding because of the higher income elasticity of demand for manufactures (Nouira, et al. 2010). Second, due to the higher price elasticity of demand and supply for such products, export earnings are less susceptible to price variability. Third, dynamic productivity gains are much higher in manufacturing than non-manufacturing production (UNIDO 2013: 8). Therefore, on grounds of dynamic efficiency, a conscious effort by governments to alter the incentive structure to promote a shift towards non-traditional exports may be desirable.
Previous empirical studies have reported a significant relationship between export diversification and exchange rate changes (Nouira, et al. 2010). Exchange rate adjustment partially compensates for the financial loss caused by the protection of traded inputs (1978). Balassa (1982; 1990) also argued that devaluation of the domestic currency is equivalent to a parallel imposition of import tariffs and export subsidies at equal rates4. A move to freer trade and devaluation can then be seen as replacing existing protective measures with a uniform rate of tariff and subsidy that will maintain the balance of trade unchanged. However, such a policy stance is based on the assumptions that there are no market distortions or, even if there are distortions, all sectors are equally affected. Rodrik (1998, 2009), however, argues that the tradable sector suffers more from domestic institutional weaknesses and market failure than the non-tradable sector. Under such a situation, deliberate undervaluation of the real exchange rate could be justifiable as a “second-best” solution to partially alleviate the bias. Such a policy measure promotes structural change, enhances exports and improves economic growth by shifting the internal terms of trade in favour of the tradable sector (Rodrik 2009; Sachs and Warner, 1995; Freund and Pierola, 2008).
Acknowledging the role of maintaining a competitive real exchange rate (RER) to improve export performance and diversify their export base, Ethiopia and Tanzania devalued their currencies substantially in 1992 and 1986 respectively. This paper aims to contribute to the 4
A move to free trade and devaluation is argued to be equivalent to replacing the existing protective measures with a uniform rate of tariff and subsidy that will maintain the balance of trade unchanged.
6
existing literature by investigating whether undervaluation has any significant impact on the exports of Tanzania and Ethiopia, both through increasing the supply of traditional exports as well as promoting non-traditional exports. Although some studies were undertaken to assess the effect of real exchange rate movement on export, very few studies, have been undertaken in the African context to establish whether undervaluation helps to boost exports (Edwards, 1986; Brixiová and Ncube, 2014). Accordingly, this paper is organized as follows: First, to show the theoretical link between the exchange rate and export diversification, we briefly present a modified Ricardian trade model with a continuum of goods as our theoretical framework (Razmi 2010). Next, we discuss the empirical model for the RER and derive a proxy for the degree of misalignment in the RER. Following that, we develop aggregate and product level export supply and export diversification models to investigate the extent to which the level and degree of misalignment in the RER have influenced the supply of traditional and non-traditional exports of these countries. Finally, after discussing the results, a brief conclusion will consider the policy implications.
2. Theoretical framework Traditional comparative advantage models suggest that differences in resource endowment and technology are key factors in determining comparative advantage and the trade pattern of a country. These models are based on perfectly competitive market assumptions, and they underestimate the role of policy in redefining comparative advantage and reshaping the trade pattern of a country. In fact, they predict that any policy-induced trade pattern is sub-optimal. However, as many of the perfectly competitive assumptions that these models assume are not met, the policy conclusions drawn from these models are not necessarily the best for a country, particularly in the long-run. Therefore, in situations where there are market failures, government policy interventions are justifiable on efficiency grounds to achieve a socially efficient production and trade pattern. A proactive real exchange rate policy is an important macroeconomic policy instrument that governments can use to influence the specialization pattern of a country. By manipulating the RER, the government can alter the overall incentive structure of the economy and subsequently the trajectory of the country’s production or specialization pattern. Such a policy can be implemented both to increase the supply of traditional exports as well as to diversify production and exports into new areas.
7
Since the effects of the RER and specialization can be linked easily in the traditional Ricardian model with a continuum of goods developed by Ramzi (2010), we will use this model as our theoretical framework. In this model, the technology of each country is described by the units of labour required to produce a given good. However, although technology is important, ultimately goods are produced where they are cheapest to produce (Ibid). The wage rate prevailing in each respective country is, therefore, the key variable that determines the goods the country will export/import. To determine which country will produce which good, we need to introduce the wage rate prevailing in the respective countries. Let the wage rate in the home and foreign country respectively be represented by and
and let a and a*be the units of labour required to produce good z. It is cheaper to
produce good z at home if and only if
. By re-arranging and manipulating
the terms, it can be re-written as:
(1)
Assuming that the technological intensity of the goods can be ranked in the order from 0 to 1, both countries are equally efficient in the production of say product
where
.
Further, assuming that the home country is endowed with less advanced technology, for a given wage ratio (
, the home country tends to produce the range of goods where
but foreign countries produce the range of goods where
.
For a given wage ratio, an improvement in the technology at home will shift, the cut-off point, and production at home will be more diversified as will exports. Similarly, the change in the wage ratio between the two countries will have a similar impact on the specialization pattern. If we assume that goods and labour markets are competitive, one policy instrument that the government can use to alter wage ratios between the two countries is the real exchange rate (RER). If we introduce it into the model, say it is represented by e, which is the domestic currency per units of foreign currency, equation (1), can be re-written as:
(2)
8
From equation (2), it is clear that devaluation of the RER not only increases the profitability of the goods for which the country has a traditional comparative advantage, but it can also shift the cut-off point for the range of goods that can be profitably produced in the home economy5 This implies that even in situations where the opportunities for significant technological advances are limited, the RER could be manipulated to re-shape the trajectory of the country’s comparative advantage (Elbadawi and Helleiner 2004). This means that, by manipulating the nominal exchange rate, under some conditions, permanent changes in economic structure can be achieved. Although devaluation results in an increase in the profitability of the tradable sector and thus, investment, employment, and diversification into new lines of tradable products, it will also lead to an increase in the real wage rate in response to higher employment in the tradable sector. The latter effect would counteract the expansion effect of devaluation on the tradable sector. However, if a devaluation induced increase in profits in the tradable sector is translated into higher accumulation of capital and learning, the resulting technological progress may dominate the contractionary effect of an increase in real wage rate and thus could accommodate higher steady state real wages without the loss of competitiveness of the tradable sector (Ramzi, 2010). Thus, the effect of devaluation on the expansion of the tradable sector and export diversification ultimately depends on the balance between these opposing effects (Ibid).
From equation (2), not only the level of the exchange rate (e), but also its deviation from its equilibrium level, may have a significant impact on the range of goods produced by a country through its influence on the cut-off point at which new goods can be produced profitably. Therefore, we expect that both the volume and the share of non-traditional export products are positively related to devaluation and persistent undervaluation of the exchange rate.
No clear consensus has yet emerged concer toning the effectiveness of manipulating the RER to reshape the comparative advantage of a country. Although there is a clear consensus that avoiding RER overvaluation is necessary to maintain external competitiveness, there is no clear consensus on whether maintaining an undervalued currency is beneficial or not (Elbadawi and Helleiner, 2004). According to the Washington Consensus, any real exchange 5
In other words as devaluation reduces the wage ratio in the two countries, it increases the demand for home labour and hence the range of goods produced at home. This occurs for two reasons (Krugman). First, as domestic labour becomes cheap relative to foreign labour, goods produced at home become cheaper and more goods can be produced at home and can be exported. Second, as wage costs fall in foreign currency terms, more goods are produced at home, and this replaces imports or expands import substitute production.
9
rate misalignment implies a sort of disequilibrium that could hamper growth (Haddad, and Pancaro, 2010). According to this view, although overvaluation creates more harm to growth, undervaluation would produce unnecessary inflationary pressures and limit the resources available for domestic investment, hence curbing the growth of supply-side potential (ibid). On the other hand, Rodrik (2009) advances a dramatically different argument both about the reason why exchange rate misalignment matters for growth and also about the mechanisms by which this relationship works. He argues that, while overvaluation is inimical to growth, real undervaluation expands exports and growth by reducing the foreign currency value of the additional transactions costs that the tradable sectors incur disproportionately as a result of domestic institutional weaknesses and market failures. He claims that maintaining an undervalued RER must be a proactive strategy and serves as a second-best policy instrument to compensate for the disproportionate adverse effect these distortions impose on the tradable sectors. Servén (2010) also claims that undervaluation raises growth by generating learningby-doing externalities in the tradables sector, which are sub-optimally produced in the absence of such policy intervention. Levy-Yeyati and Sturzenegger (2007) also argue that undervaluation is desirable for growth, but they claim that it works through increasing savings and capital accumulation of the economy.
Thus, although the empirical evidence on the effect of misalignment due to overvaluation on growth/exports is conclusive, the evidence regarding the effect of undervaluation of the exchange rate on economic growth is mixed (Magud and Sosa, 2010). This paper aims to contribute to the debate by investigating empirically the extent to which manipulating the real exchange rate in Ethiopia and Tanzania was effective in increasing the supply of traditional exports and promoting the export of non-traditional commodities. To determine whether the actual RER is in line with its underlying equilibrium level, we estimate an equation for the equilibrium RER. The next section will focus on that and derive the degree of misalignment as the difference between the actual and the equilibrium RER, which is the level that is consistent with the medium-term fundamentals6.
6
The equilibrium exchange rate is assumed to be the predicted value of the RER model.
10
3. Data Source and the Empirical models 3.1 Data The data for the analysis came from different sources. The data for traditional export volumes and values are obtained from FAOSTAT, World Bank, and UNCTAD data set. The price and volume of coffee, cashew nut, cotton and tea export is obtained from International Coffee Organization, UNCTAD, and World Bank. Some data on production are also drawn from various annual reports of the two countries. The data on various components of the balance of payment come from IMF, World Bank, and UNCTAD. The quantity and value of manufactured exports are obtained from UNCTAD. The real exchange rate data are obtained from the Bruegel data set. The total factor productivity of the two countries as well as for the USA is obtained from UNIDO data set. 3.2 Modeling the RER7 To postulate the RER model and assess whether its actual level is in line with the equilibrium level, "equilibrium RER", "macroeconomic balance" (MB), and "external sustainability" (ES) approaches are used (Hobdari, 2008). The three approaches provide complementary perspectives on the movement of the equilibrium real exchange rate. We will not dwell much on the pros and cons of each approach, and interested readers can refer to the relevant literature. For our purpose, we use the first approach to postulate the model. From the literature, the terms of trade of the country, government expenditure, trade restrictions, the level of capital flows and technological progress are key fundamentals that determine the equilibrium RER (Chowdhury, 2004). Following previous studies, the RER we estimate empirically will be as follows:
(3)
7
As defined in Edwards (1991), the equilibrium REER is considered to be the “relative price of tradable to nontradable that, for given sustainable values of relevant variables—such as taxes, international prices, and technology—results in simultaneous attainment of internal and external equilibrium. Internal equilibrium means that the nontradable goods market clears in the current period and is expected to be in equilibrium in future periods. External equilibrium means that the current account balances (current and future) are compatible with long-run sustainable capital flows."
11
The RER is measured in terms of the amount of foreign currency per unit of domestic currency necessary to buy a basket of goods in the country. In other words, it is equivalent to the nominal exchange rate times the relative prices of a basket of goods in the two countries. Openness is defined as the sum of exports and imports as a share of GDP. A low level of openness or protection of the domestic market by restricting cross-border trade (e.g. import tariffs and non-tariff barriers) leads to higher domestic prices and thus leads to an appreciation of the RER. Removing the existing restrictions will depreciate the exchange rate because it reduces the price of non-tradables. Improved openness will also increase competition and bring prices more into line with world prices and tends to depreciate the RER. But policies that promote exports could appreciate the RER if they improve the trade balance and if the resulting income effect dominates the price effect and increases the demand for and the price of non-tradables relative to tradables (Chowdhury, 2004). An improvement in the external terms of trade (TOT) will shift the aggregate supply of foreign exchange and, for a given level of demand, it will lead to an appreciation of the RER. The sign of the coefficient, however, depends on whether the substitution or the income effect dominates. If the income effect dominates, the coefficient will have a positive sign, but a negative sign may arise if the substitution effect dominates. TFP represents the ratio of total factor productivity of the country relative to the USA8. Increased productivity increases the efficiency of the tradable sector, reduces the cost of tradables, increases the competitiveness of exports and tends to depreciate the RER. However, if the productivity induced income increase leads to an increase in the demand and prices for non-tradables, there will be a real appreciation. Therefore, the coefficient sign depends on whether the demand or supply side effect dominates. Countries with higher productivity growth in the tradables sector (where such growth tends to concentrate) can sustain an RER appreciation without losing competitiveness.
GOVCON2GDP represents the ratio of government consumption to GDP. An increase in government consumption biased toward non-tradables creates higher demand for nontradables (relative to the tradable sector). The boost in demand will increase the relative prices of nontradable goods, causing the equilibrium real exchange rate to appreciate. However, if the increase in overall government consumption is biased toward the tradable
8
The USA is used to represent the highest technology potential trade partner.
12
sector, an increase in spending will cause the RER to depreciate. This variable could also measure the effect of domestic tax financing of government consumption on tradables. An increase in domestic taxes on exports will shift the supply of exports to the left and tend to appreciate the RER.
RESERVE2GDP is the ratio of reserves to GDP and it is assumed to capture all the other variables that potentially increase or reduce the reserve level, such as aid and net income from foreign assets, except movement in the terms of trade. It is expected to carry a negative sign because it suggests that any increase in net-inflow requires depreciation for the economy to be on its sustainable equilibrium level9.
Once Equation (3) is estimated, the equilibrium real exchange rate (ERER) is obtained by inserting the three-year moving average of the explanatory variables (Vollrath, 1994; Elbadawi, 1999)
10
. The derived RER was also normalized (through the country-specific
intercept) so that the long-run misalignment for each country is set equal to zero (ibid).
3.3 RER and Export Diversification In the light of equation (2), we postulate the degree of export diversification of the country as a function of the level of the RER, the extent of RER misalignment and the relative technological capability of the economy. We proxy relative technological capability (i.e.,
in terms of the ratio of factor productivity for each country relative to that of the
USA11. In addition to technological capacity, the skill base of the economy is also an important variable that influences the dynamic comparative advantage of a country (Cimoli, et al., 2011). We use the ratio of students enrolled in tertiary education as a proxy to measure the skill base of the economy. A high rate of tertiary enrollment improves the human capital base, narrows down the productivity gap and prompts diversification into new areas (ibid). We also include the lagged ratio of domestic investment to GDP as an additional variable 9
Since the model is a reduced form specification of the determinants of the real exchange rate, it is not always possible to be unequivocally certain about the anticipated signs of the independent variables because uncertainty exists whether supply effects outweigh demand effects, income effects outweigh substitution effects, or transitory effects outweigh permanent effects. 10 Both Pick and Vollrath (1994) and Elbadawi (1999) used the three-years moving average of the explanatory variables as their equilibrium and sustainable levels. 11 The data for total factor productivity are drawn from the UNIDO data base. The data on RER, the investment to GDP ratio and the share of students enrolled in territory education are obtained from UNCTAD and the World Bank African Economic Indicators data base.
13
(Alemu, 2008). Finally, as the level of diversification is characterized by a high degree of path-dependence, we include the lagged value of the dependent variable as one explanatory variable (Cimoli, et al., 2011). Accordingly, we will estimate the following model to capture the impact of the RER and its misalignment on export diversification.
(4)
Where, Xit is the diversification index of country i at time t, lnRER is the log of the real exchange rate index, RERmis is the misalignment dummy of the RER (where 0 is for overvaluation and 1 is for undervaluation), TFP is the relative factor productivity ratio of the country vis-à-vis the USA, lntertiaryenrol is the log share of students enrolled in tertiary education and lnINV2GDP is the log ratio of investment to GDP. The Herfindahl-Hirschman diversification12 The index is generated using FAOSTAT data covering the period from 1980-2011. As the inclusion of the lagged variable violates some of the classical assumptions (orthogonality and exogeneity), we follow the procedure suggested by Arellano and Bond (1991) for a dynamic panel data model to address these problems.
3.4 RER, RER misalignment and Export Supply
As noted above, we are also interested to ascertain the impact of the RER and its degree of misalignment on export supply. We use conventional trade theories as our theoretical framework to identify the explanatory variables of the export supply function. Accordingly, in addition to the RER and its degree of misalignment and using small country assumptions, we include the log terms of trade of the country, the lagged log share of investment to GDP and log factor productivity of the country relative to the USA. To capture the adverse impact of domestic absorption on export, the log share of government consumption to GDP will also be included. Accordingly, on the basis of actual export volume data and covering the period from 1980 to 2011, the following aggregate export supply will be estimated.
12
It is estimated as the squared sum of the export value share of each product from the total export earnings.
14
(5)
where V represents the volume of export in kgs of product j of country i and at time t; TOT is the log of the terms of trade index, TFP is the relative factor productivity, GOVCON is the log of government consumption to GDP, INV is the lag log share of investment to GDP, is country-specific factor, and
is the random error term.
To control for difference in country size, we also postulate a similar aggregate export supply model using the log ratio of exports to GDP (
as the dependent variable.
(6)
To further see if the result is sensitive to aggregation, using more disaggregated data, we will also estimate product level export supply functions. One export supply function will be estimated for manufactured goods exports; a similar function for coffee exports. By focusing only on Tanzania and pooling the production and export data for tobacco, cashew nuts, tea and cotton lint, another export function will be estimated. Accordingly, the following product level disaggregated export supply models will be estimated.
(7)
(8) (9)
Regarding the sign, there is a consensus that an overvalued currency will always harm exports. The sign for undervaluation dummy is expected to be positive. The production variable is expected to carry a positive sign.
15
3.5 Econometric and Estimation Issues The first step in the panel data analysis is to conduct unit root tests and determine the order of integration. The unit root test on each variable is conducted following the approach suggested by Im-Pesaran-Shin (2003). Instead of applying the test on a country-by-country basis, we follow their approach for the joint null hypothesis that every time series in the panel is nonstationary. The test is conducted on 20 variables; and from these, only in the case of 6 variables is the null hypothesis rejected at 1% and for two variables at 5%, but for the remaining variables the null hypothesis cannot be rejected at conventional significance levels. However, all the variables are found to be first difference stationary or integrated of order 1.
We also conducted different cointegration tests. The first one is the test suggested by Kao (1999), which runs a static fixed effects model and applies a pooled ADF regression (analogous to the Engle-Granger procedure in time-series). We conducted the test for each country individually and by pooling the residuals as well as by considering the presence and absence of a lag structure. In any of the cases, the null hypothesis of no cointegration is rejected at less than 1%. The Dickey-Fuller test statistics for the residuals of the models that include and exclude a lag for Ethiopian data were -7.3 and -6.35 while the critical value at 1% is -3.716; and for Tanzania the statistics for models with lag and with no-lag respectively were -7.4 and -8.87 while the critical value is -3.716. The estimate of
for pooled residuals
test with a lag is -0.65 with a t-value of -5.34 and with no-lag, it is -0.55 with a t-statistics of 4.82. We again conducted a cointegration test based on the Error Correction test with global stochastic trends suggested by Gengenbach, et al. (2009).
For m=5 (five explanatory
variables) and 60 observations and on the basis of specifications with unrestricted constant and trend, the calculated t-bar is -6.285 and it is above the critical value of -4.148 at 1% level of significance13.
Endogeneity could be another potential econometric problem that needs to be addressed. Some of the variables might be endogenous. For instance, causality may run in both directions – there may be an association between levels of productivity, TOT, reserve level, and the RER. In addition, since some of the models include the lagged value of the dependent variables, so the orthogonality assumptions could also be violated. To address both problems, 13
We, however, conducted the error correction test for the RER model due to the labour intensive nature of the test.
16
we use GMM. In addition to the efficiency consideration, lack of an appropriate instrument makes GMM more attractive than IV. GMM can also address the autocorrelation problem. But in large-T panels, a shock to the country’s fixed effect, which shows in the error term, will decline with time. Similarly, the correlation of the lagged dependent variable with the error term will be insignificant when the panel is large, i.e. large T and small N, which is the case (Roodman, 2006). In such cases, one does not necessarily have to use GMM and a dynamic fixed effect model will be sufficient. However, since the lagged dependent variable still correlates with the lagged error term, within groups transformation or fixed effect will not eliminate the dynamic panel bias. For those models where a lag of the dependent variable is included, we estimate the model on the basis of the standard GMM estimation method suggested by Arellano and Bond (1991). For those models that do not include lagged value, we estimate a fixed effect model.
4. Regression Results and Main Findings
4.1 The Equilibrium RER
The estimation result for equation (3) is reported in Table (2). In most cases, the generated signs are consistent with our prior expectations. As an additional check for robustness, we also re-estimated the model by including a trends term. The coefficient estimates of the fundamentals variables in terms of sign and magnitude are almost the same. As the coefficient of the trend term is insignificant, we report the results of the model that does not include the trend term. As expected, an increase in the level of factor productivity has a significant impact on the evolution of the real exchange rate. Consistent with theory, high productivity, by increasing competitiveness and shifting the overall supply of the economy, saves or generates additional foreign exchange and subsequently tends to appreciate the real exchange rate. The terms of trade and the level of openness, the level of government consumption and reserve level are also significant explanatory variables. The result suggests that 1% improvement in the terms of trade appreciates the RER by 0.13%, suggesting that the income effect dominates the substitution effect. The result may also suggest that the economy is supply constrained 14. The
14
An increase in TOT will have income and price effects. In the case of income effect, the induced income increase from improved TOT will induce an increase in the demand for tradable (domestic as well as
17
coefficient of a degree of openness is negative and significant. It suggests that when the economy becomes more open, in order to maintain long-term competitiveness and sustain the liberalization effort, it requires a more depreciated equilibrium RER. Similarly, it could also reflect the counteracting effect of increased export earnings, which lead to a fall in the real exchange rate, and an import expansion, which normally leads to a rise in the real exchange rate.
The share of government consumption to GDP is significant and also has a negative sign. The result suggests that for the trade balance to be sustainable, an increase in government consumption will always lead to or require real currency depreciation. It may also imply that government consumption is dominated by expenditure on tradables.
The coefficient for the ratio of reserves to GNP variable is significant and carries a negative sign, suggesting that any factors that increase the level of reserves, such as an increase in net capital and aid inflows, would require the economy to undertake real currency depreciation. Since the terms of trade are included in the model, the coefficient is expected to capture the impact of net capital in-flows on the real exchange rate (RER) (Chudik and Mongardini 2007). There is a growing body of empirical research that reported an inverse link between importables) and non-tradable goods and thereby appreciate the RER. The price effect works by discouraging consumption of tradables and increasing the demand for non-tradables.
18
aid flows and the RER, namely the RER depreciates following an increase in aid inflows. A number of explanations have been provided for such an unusual finding (Li and Rowe, 2007). Most of them are attributed to the supply-side impacts of aid inflows. They suggest that aid inflows may induce a rapid supply-side response, which is by more than the level that is necessary to offset the demand responses. Others argue that aid may be targeted at easing supply bottlenecks that could potentially offset the price increase of non-tradable due to aid inflows (Hjertholm, Laursen and White 1999). Adam and Bevan (2003) on the other hand argued that if aid-financed public infrastructure investment spending induces a productivity gain in the non-tradable sectors, aid will depreciate the RER. It can also be argued that if the donors provide aid that allows the recipient to import from those donors, and the value of the imports is greater than the original aid inflow, then the real exchange rate could depreciate. Donors may also provide aid to support a change in an exchange rate regime, which could mean a strong devaluation of the nominal exchange rate. In general, it is likely that a number of these factors are working together to produce the observed inverse relationship.
The coefficient of the lagged RER is positive and significant, signaling the importance of inertia in RER evolution overtime. Almost 50% of the present movement of the RER is influenced by its past level. On the basis of the so-called "Fundamental Equilibrium Exchange Rate (ERER) concept, we also estimated the equilibrium real exchange rate (ERER) and its degree of misalignment. The estimation is undertaken by including the three years moving average of the fundamental variables in the model. Each coefficient is deflated by
assuming that, in steady state equilibrium, the level of lagged RER is equal to
the current RER. In addition, the constant term of the model is adjusted for each country by taking into account the country fixed effect.
From the predicted value of the model, which reflects the equilibrium real exchange rate, (ERER), it appears that, although the observed RER showed some fluctuation over the periods covered, both countries were able to maintain a RER that is close to its equilibrium level (ERER). They seem to be successful in managing the adverse impact of capital flows and terms of trade movements on the long-term competitiveness of their economies. If the RER policy is also supported by another effective export-promoting policies, an RER level that is close to the equilibrium level is expected to be a key factor for the observed remarkable export growth. We also estimated the magnitude of misalignment as the difference between the observed and estimated equilibrium RER. Since the real exchange rate 19
is measured in terms of the amount of foreign currency per unit of domestic currency, the misalignment is an overvaluation if the observed RER is above the ERER and undervaluation if the observed RER is below the ERER.
Over the study period (1980-2012), although the RER in both countries exhibited both over and undervaluation, the RER of Tanzania was undervalued on average by 2.6%, while the RER of Ethiopia was on average 15% overvalued. The level of overvaluation in Ethiopia during the post-reform period (post-1992) however was lower (7%). Similarly, when only the post-reform period is considered (post-1986), the RER in Tanzania was undervalued by an average of 4.3%. Our finding is consistent with previous empirical studies. For instance, Hobdari (2008) reported that in most recent years the REER of Tanzania has been undervalued by a significant margin, which reached as high as about 30 percent. Tanzania, however, was able to maintain an undervalued currency for a long time by building up the reserve level. The reserve level showed a continuous increase throughout the reform period and reached as high as 18% of GDP. Although the undervalued currency is expected to expand the tradable sector, it comes at the price of a higher level of inflation due to the impact of devaluation on the price of tradables. In contrast, Ethiopia seems to have contained inflation (pre-2008) by maintaining real overvaluation and building large current account deficits.
We also regressed the first difference of misalignment on the fundamental variables. We estimated the model for each country separately and by pooling the data. Among the variables, only relative total factor productivity, openness and reserves to GDP ratio are variables that significantly explain misalignment in Ethiopia. In Ethiopia, 77% of the movement in the level of misalignment is attributed to factors that affect import demand and export supply; close to 13% by movement in the terms of trade, 10% by changes in government consumption and the balance by changes in relative factor productivity and the level of reserves. In the Tanzanian case, 69% of the degree of misalignment in RER is associated with movement in the terms of trade, followed by openness (25%), government consumption (6%) and the balance by the remaining variables. In the Ethiopian case, the variable included in the model only accounts for 36% of the movement in ERER but 67% in
20
the case of Tanzania15. This suggests that in the case of Ethiopia, domestic supply and demand related factors are important determinants of the ERER and its level of misalignment. For Tanzania, although domestic supply and demand factors are important, a substantial share of the movement in RER and its degree of misalignment is accounted for by changes in world market conditions. When pooled data are used to estimate the same model, TOT, and relative factor productivity reduce misalignment, but reserves increase it.
World Bank and IMF-supported adjustment programs put heavy emphasis on real exchange rate depreciation as a way to restore external balance and elicit a significant supply response. In this paper, we specifically aim to evaluate to what extent the devaluation of the RER has been effective in generating the expected supply response and a shift in the composition of exports. In both countries, the RER depreciated continuously after the reform program except in some years where the trend is reversed. The amount of the real devaluation is also less than the nominal devaluation in the case of Ethiopia, but it is more in Tanzania. We aim to assess to what extent export supply is sensitive to movements in the RER and also whether a policy of deliberate undervaluation is desirable to promote vertical and horizontal export diversification.
4.2 Regression results for Real Exchange Rate and Export Diversification
We estimated the link between the RER and export diversification by classifying diversification into vertical and horizontal diversification. Following Mengistu and Yokoyama (2009), Elbadawi, 1999; and; Munemo, 2007), we measure vertical diversification in terms of the ratio of manufactured exports to total export. The Hirschman diversification index derived from the data is used to measure horizontal diversification (ibid). To check the sensitivity of the result to measurement bias, the number of products exported is also used as an alternative measure of horizontal diversification (Herzer and Nowak-Lehmann 2006). The information for the number of products exported by each country is drawn from the UNCTAD data base16.
15
When we regress inflation on TOT, there is a significant and negative relationship between the two in the case of Tanzania, but insignificant in the case of Ethiopia. 16 Over the period 1995-2012, Tanzania exported an average of 160 items, and the number ranges from 81 to 224 items. During a similar period, the average number of exported items in Ethiopia was 62, and it ranges from 25 to 149 items.
21
4.3 Horizontal Diversification
The estimation result of equation (4) is reported in Table (3). The autocorrelation test showed that there was no significant autocorrelation for a 2-period lag. The null hypothesis of the Sargan test of over identifying restrictions cannot be rejected, suggesting that the instruments are valid.
The coefficient of the lagged diversification variable is positive and significant, suggesting that the pattern of diversification is path dependent. The result also shows that export diversification responds both to the level and the direction of the misalignment of the RER. The negative coefficient of the log RER variable implies that an appreciation of the RER tends to concentrate exports on a few products. The dummy for undervaluation, which is one if the observed RER is below its equilibrium or 0 otherwise, is positive and significant. It suggests that, although overvaluation undermines export diversification, undervaluation promotes it. This finding is consistent with previous studies (Elbadawi, 1998; Rodrik, 2008). Both studies reported that an undervalued RER improves profitability by nullifying the adverse effect of institutional weakness and market distortions on the tradable sector. The
22
result, however, differs slightly from the finding reported by Elbadawi (1998), in which he claims that the level of RER is less relevant. The difference may arise because he estimated the model on the basis of a fixed effect method and also used the share of non-traditional exports as a measure of diversification.
The variable that represents skill base (i.e., ratio of students enrolled in tertiary education) is positive and highly significant. It suggests that diversification is strongly associated with the level of human capital stock and corroborates the claim that improving human capital narrows down the productivity gap and promotes diversification (Cimoli, et al., 2011). However, the ratio of factor productivity, which serves as a proxy for technological capabilities, carries the expected sign but is not significant. The coefficient of lagged investment is not significant and also does not carry the expected sign, which begs further scrutiny. Although the constant term is not significant, the country-specific factor generated from the fixed effect model shows that, the country-specific factor for Tanzania is positive while it is negative for Ethiopia. This suggests that in Tanzania there are relatively more favourable conditions for diversified exports than in Ethiopia. Moreover, there has been a significant horizontal export diversification towards other products and more sectors.
The result of the diversification model that is estimated using the log number of goods exported is also reported in Table 3 (Model I). We first estimated the model by leaving the total factor productivity and ratio of students enrolled in tertiary education. But none of the variables included are significant. When we replaced the two variables by the average percapita income in USD, the fit of the model improved. Therefore, we estimate the model using the per-capita income in USD as the additional explanatory variable. The result again confirms that the level and undervaluation of the real exchange rate significantly affects the number of export items the country export. The number of items the country exports is also significantly associated with average per-capita income of the country and the variable also carries the expected sign. Although still insignificant, the lag of the log share of investment to GDP is negative. Considering that the presence of multicollinearity might be one reason for the unexpected sign, we conducted the multicollinearity test using the VIF method. But the test shows that there is no serious multicollinearity problem.
In conclusion, the result suggests that the real exchange rate is a key policy variable that significantly influences the pace of horizontal diversification of the economy. The results 23
suggest that, while the currency should not be overvalued, real currency depreciation relative to its equilibrium (undervaluation) will enhance horizontal export diversification. RER policy-induced horizontal diversification is expected to boost growth by generating significant knowledge spillover and a multiplier impact on the economy, even if most of the items are raw and semi-processed natural resource based goods. Due to contacts established with foreign firms and exposure to international competition, diversification into a completely new export sector would generate positive externalities to the economy (Herzer and Nowak-Lehnmann 2006). In addition, it also contributes to growth by reducing the likelihood of extreme price and volume fluctuations on domestic investment and growth (Herzer and Nowak-Lehnmann 2006).
4.3 RER and Vertical Diversification
The result of the model for vertical diversification, which is measured in terms of the ratio of manufactured exports to total export, is presented in Table 3 (under Model II). In addition to the RER and the undervaluation dummy, we introduced the GDP share of manufacturing value added as a proxy to capture the supply side. Again the result shows that supply factors, as well as the level of incentive, are significant determinants of manufactured exports. As expected, elimination of currency overvaluation significantly increases the
share of
manufactured goods export by making domestic sales less attractive. The undervaluation dummy is also significant and carries the expected sign. Although one cannot tell whether depreciation of the RER promotes the production of manufactured goods from the result, it confirms that, while overvaluation of the RER is harmful to industrial exports, undervaluation increases the share of manufactured exports.
Therefore, although the result clearly shows that maintaining a RER that is close to its equilibrium as well as an undervalued currency will increase the share of manufacturing production exported, the overall impact of an undervalued RER on manufacturing sector production will be ambiguous. This is because the manufacturing sector imports a larger share of its inputs, in which case, undervaluation will increase costs and thus reduce the competitiveness of domestic production unless it is accompanied by other offsetting measures. Although most of the manufactured export products are resource based with low technological content, we believe that RER induced diversification of manufactured exports will generate strong spillovers onto the economy. 24
4.4 Real Exchange Rate and Export Supply As mentioned before, we also estimated aggregate export supply models using the actual export volume covering the period from 1980 to 2011; using the export to GDP ratio (19802011) and the volume index of manufactured exports (UNCTAD, 1995-2012). The estimation results of these models are presented in Table (4).
Under Model I, where the actual export volume of the major export items is the dependent variable, all the variables are significant and have the expected sign. Real currency devaluation significantly increases exports. Again, in contrast to conventional wisdom, a deliberate policy of maintaining an undervalued real exchange rate boosts export supply. In addition to the level of incentives, the result shows that supply side factors, which are represented by relative factor productivity and lagged ratio of investment to GDP, are significant determinants of the supply of exports. In particular, the volume of exports seems to be highly elastic to changes in factor productivity. Macroeconomic policy conditions (represented by the level of government consumption), have a significant adverse effect on exports. Similar conclusions also emerge when export supply is measured in terms of the share of exports to GDP (model II). Appreciation of the RER reduces the share of exports to GDP, but undervaluation of the currency increases its share. The variables that capture supply side factors as well as the macro policy environment are also significant and have the same sign. When we consider the volume of manufactured goods export, supply side, and 25
profitability still matters but the RER is only significant at the conventional significance level, although it carries the expected sign. To isolate which factors are more important for the observed performance, we have also estimated the model in the first difference form for each country separately. In Ethiopia, an increase in export share is significantly associated with improved supply capability, undervaluation, and depreciation of the RER. In Tanzania however, real exchange rate depreciation is the most significant factor for strong export performance.
To see if the result is sensitive to the level of aggregation, we also estimated product level export supply models. Considering that coffee is the major export item for both countries, we estimated the coffee supply model by pooling the data of the two countries. We also estimated another export supply model based on Tanzania data only but by combining cotton lint, raw tobacco, tea and cashew nut export items. The results are reported in Table (5). The results suggest that a substantial share of export supply is determined by factors that affect the level of production. Again in all product cases, an appreciation in the RER has a significant adverse impact on export supply. Among the three export items in Model I, although not reported here, appreciation of the RER has a stronger adverse impact on cashew nuts and unprocessed tobacco exports than on cotton. Although not reported here, we modeled the ratio of export to the production of the three crops on RER and undervaluation. The real exchange rate coefficient is significant for raw tobacco and cashew nuts, but not for cotton. Their elasticities are 0.36 and 0.31 respectively.
26
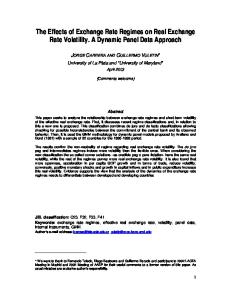
For coffee export supply, appreciation of the real exchange rate significantly reduces export volume. Similarly, although the undervaluation dummy has the expected sign, it is not significant. The estimated elasticity of supply to the exchange rate is also consistent with the findings of previous empirical studies. Balassa (1990) for instance reported the elasticity of export supply to the real exchange rate in the range between 0.78 and 1.01. The result refutes the notion that changes in the real exchange rate would have less effect on the exports of tree crops. To identify in which of the two countries the adverse effect of RER appreciation is stronger, we re-estimated the model by including an additional variable by interacting RER and the country dummy. Although not reported here, the interaction term is significant and suggests that appreciation of the RER has a more adverse impact on Ethiopia than on Tanzania. Compared to the other products, the elasticity of coffee export to production (0.51) is significantly less than 1 and the 95% confidence interval of the estimates falls in the range of 0.23 to 0.78. This suggests that a significant share of domestic production of coffee is consumed domestically. The share of export to production in Tanzania is high and also showed consistency over the years (See figure 1). Relatively low domestic consumption coupled with an undervalued real exchange seems to be a key factor for Tanzania to maintain its export share. Although it may require further scrutiny, real exchange undervaluation seems to have played a role at least in counteracting the substitution effect of food price increase on the production and export of export products. Does the stagnation of coffee production in Tanzania suggest that the country has lost its comparative advantage in coffee production? Addressing this question may be a fruitful area of future research.
27
We also regressed the log volume indices of manufactured goods export on the real exchange rate, human capital base and relative factor productivity, share of investment and government consumption to GDP. The result is reported in Table (III). The result similarly shows that incentives matter and appreciation of the RER discourages manufactured exports, but real undervaluation makes export sales more attractive. Again based on the estimated countryspecific effect, in Tanzania, there are more favorable conditions for manufactured export than in Ethiopia. Relatively significant undervaluation could be one factor. When the undervaluation dummy is interacted with the country dummy and included as an additional variable in the model, the interaction term is highly significant. It implies that, ceteris paribus, undervaluing the real currency in Ethiopia would have a significant impact on increasing manufactured export. The significance of the interaction dummy may also suggest that there are relatively severe institutional weakness and market failures in Ethiopia. Controlling for incentive and supply, country-specific factors explain 20% more manufactured exports from Tanzania than Ethiopia.
The variable that represents the GDP share of government consumption is also significant and suggests that high government consumption/expansionary macro policies have an adverse impact on the volume of manufactured goods export. This may be working through inflating the price of non-tradable goods or by increasing the cost to exporters, particularly if such consumption is financed by distortionary domestic tax.
However, spending on
investment, which expands productive capacity, is a significant determinant of manufactured goods export.
5. Conclusion The paper has assessed the influence of reform measures on external competitiveness and export performance of Tanzania and Ethiopia.
The analysis shows that both countries
attempted to maintain a real exchange rate, which measures external competitiveness, close to its equilibrium level.
From the empirical results, clear pictures seem to emerge. Exports in both countries are highly responsive to changes in the real exchange rate. Appreciation or overvaluation of the exchange rate is inimical to export performance. Maintaining a RER that is close to its equilibrium is necessary, but maintaining an undervalued currency is also more desirable 28
from the point of view of export performance. A major contributor to differences in export performance between the two countries is explained by their differences in real exchange rate policy. Tanzania has deliberately maintained an undervalued real exchange rate for a long time.
A high rate of growth in exports is associated with periods of undervalued currencies. Although the conclusion of our result is in contrast to the Washington Consensus view, which argues that any real exchange rate misalignment (either above or below its long-run value) is undesirable, it corroborates the recent view, that claims that undervaluation is a desirable policy and serves as a second-best policy to nullify the disproportional additional transaction costs the tradable sector suffers due to institutional weaknesses and market imperfections. The result consistently confirms that a deliberate policy of maintaining an undervalued real exchange rate is justifiable even on dynamic efficiency grounds since market imperfections, which generate much more cost on the tradable than the non-tradable sector, are pervasive in developing countries. Under such situations, maintaining an equilibrium real exchange rate will not be sufficient to nullify the bias against the tradable sector.
The export expansion achieved through undervaluation, however, comes at a heavy price for Tanzania. Tanzania managed to maintain an undervalued real exchange rate through the accumulation of reserves and a relatively high rate of inflation. The rate of inflation was significantly higher for a long time in Tanzania than in Ethiopia, except in recent years. The net welfare effects of maintaining an undervalued real exchange rate through reserve accumulation therefore depend on the balance between the welfare losses that arises due to higher inflation and lower tradable absorption (because undervaluation removes tradable goods from the economy) versus the dynamic gains from higher growth that comes due to positive externalities generated by expansion of the tradable sector. Moreover, although undervaluation may serve as a second-best instrument to internalize the positive externalities the tradable sector generates, the materialization of such an effect will depend on the responsiveness of private investment to the improved incentive structure, the capital-intensity of the tradable sector as well as on the willingness of consumers to substitute consumption inter-temporally. Similarly, if the import intensity of the tradable sector is very high, an undervalued real exchange rate could undermine growth through inflating the cost of imported inputs and reducing the profitability of production. A reduction in domestic saving and investment due to undervaluation induced inflation could be the other channel by which 29
undervaluation may undermine growth. Therefore, assessing the net welfare effect of RER undervaluation focusing particularly on its distributional impact could be a very fruitful area of research.
Moreover, as the result suggests, macroeconomic stability also matters for export. High levels of unproductive government expenditure create an adverse impact on exports. Identifying the channels, by which such adverse effects are felt, such as whether it is through distortionary taxation or its impact on the prices of non-tradables or a combination of them, will provide important policy inputs. The competitiveness of the domestic market structure, as well as the supply and quality of infrastructural facilities and skill base of the economy, are also important constraints that must be addressed to achieve a shift in export diversification.
30
References
Adam, C. and Bevan, D. (2003). Aid and the Supply Side: Public Investment, Export Performance, and Dutch Decease in Low-Income Countries. World Bank Economic Review, 20 (2).
Alemu, M. (2008). Determinants of Vertical and Horizontal Export Diversification: Evidences From Sub-Saharan Africa And East Asia. Ethiopian Journal of Economics, 17 (2).
Balassa, B. (1982). Development Strategies in Semi-industrial Economies. Baltimore: Johns Hopkins University Press.
Balassa, B. (1990). Incentive Policies and Export Performance in Sub-Saharan Africa. World Development, 18 (3).
Brixiová, Z. and Ncube, M. (2014), The Real Exchange Rate and Growth in Zimbabwe: Does the Currency Regime Matter? , African Development Bank, Working Paper series no. 210, October.
Chowdhury, M. (2004). Resources Boom and Macroeconomic Adjustment in Developing Countries. Aldershot: Ashgate.
Chudik, A. and Mongardini J. (2007). In Search of Equilibrium: Estimating Equilibrium Real Exchange Rates in Sub-Saharan African Countries. IMF Working Paper WP/07/90.
Cimoli, M., Fleitas, S. and Porcile, G. (2011 ). Real Exchange Rate and the Structure of Exports. MPRA Paper No. 37846.
Coulson, A. (2013). Tanzania:
A Political Economy, Oxford University Press, Second
edition, with a new Introduction (first edition 1982)
Edwards, S. (1988). Exchange Rate Misalignment in Developing Countries, Baltimore: Johns Hopkins University Press.
31
Edwards, S. (1989). Real Exchange Rates, Devaluation, and Adjustment: Exchange Rate Policy in Developing Countries. MA: MIT Press.
Edwards, S. (1994). Real and Monetary Determinants of Real Exchange Rate Behavior: Theory and Evidence from Developing Countries. in Williamson J. (ed.). Estimating Equilibrium Exchange Rates. Washington, D.C.: Institute for International Economics.
Edwards, S. (1998). The Mexican Peso Crisis: How Much Did We Know? When Did We Know It?. NBER WP 6334.
Edwards, S. (2014) Toxic Aid: Economic Collapse and Recovery in Tanzania, Oxford University Press
Eichengreen, B. (2008). The Real Exchange Rate and Growth. Working Paper no. 4. World Bank: Commission on Growth and Development.
Elbadawi, I. (1999), Can Africa Export Manufactures: The Role of Endowment, Exchange Rates, and Transaction Costs, World Bank: Policy Research Working Paper, No. 2120.
Faini, R. and de Melo, J. (1990). Adjustment, Investment and the Real Exchange Rate in Developing Countries, World Bank Policy Research Working Paper No. 473..
Freund, C. and Pierola, M. (2008). Export Surges: The Power of a Competitive Currency. World Bank: Policy Research Working Paper, No. 4750.
Freund, C. and Pierola, M. (2010) Export Entrepreneurs: Evidence from Peru. World Bank: Policy Research Working Paper, No. 5407.
Gengenbach, C., Urbain, J.-P., and Westerlund, J. (2009). Error Correction Testing in Panels with Global Stochastic Trends, December, Maastricht University: METEOR.
Haddad, M. and Pancaro, C. (2010). Can Real Exchange Rate Undervaluation Boost Exports and Growth in Developing Countries? Yes, But Not for Long. World Bank: Economic Premise, , No. 20. 32
Herzer, D. and Nowak-Lehmann, D. (2006). What Does Export Diversification Do for Growth? An Econometric Analysis, Applied Economics, 38 (15)
Hjertholm, P., Laursen, J. and White, H. (2000). Macroeconomic Issues in Foreign Aid. Department of Economics, University of Copenhagen: Discussion Paper No. 5. Hobdari, N. (2008). Tanzania’s Equilibrium Real Exchange Rate., IMF Working Paper WP/08/138.
Krueger, A. (1978). Foreign Trade Regimes and Economic Development: Liberalization Attempts and Consequences. Cambridge, Mass : Ballinger.
Li, Y. and Rowe, F. (2007). Aid Inflows and the Real Effective Exchange Rate in Tanzania, Policy Research Working Paper no. 4456.
Lofchie, M. (2014) The Political Economy of Tanzania: Decline and Recovery, University of Pennsylvania Press
Magud, N. and Sosa, S. (2010) When and Why Worry About Real Exchange Rate Appreciation? The Missing Link between Dutch Disease and Growth, IMF Working Paper, WP/10/271.
Mengistu, A. and Yokoyama, K. (2009). The Impacts of Vertical and Horizontal Export Diversification on Growth: An Empirical Study on Factors Explaining the Gap between SubSaharan Africa and East Asia’s Performances. Ritsumeikan International Affairs, 7: 49-90.
Munemo, J. et al. (2007). Foreign Aid and Export Performance: A Panel Data Analysis of Developing Countries. Working Paper 2007-023A, St. Louis: Federal Reserve Bank of St. Louis.
Nicolás Magud and Sebastián Sosa (2013). When and Why Worry About Real Exchange Rate Appreciation? The Missing Link between Dutch Disease and Growth, IMF working Paper 10/271. 33
Nouira, R., Plane, P. and Sekkat, K. (2010). Exchange Rate Undervaluation to Foster Manufactured Exports: A Deliberate Strategy? CERDI Working Papers no. 1148.
Pick, D. and Vollrath, T. (1994), Real Exchange Rate Misalignment and Agricultural Export Performance in Developing Countries, Economic Development and Cultural Change, 42(3).
Potts, D. (2008), Policy Reform and the Economic Development of Tanzania. BCID Research
Paper
No.14,
University
of
Bradford,
available
at
https://bradscholars.brad.ac.uk/bitstream/handle/10454/3031/Researchpaper14Potts.pdf?sequ ence=1
Ramzi, A. (2010) The exchange rate, diversification, and distribution in a modified Ricardian model with a continuum of goods, Economics Department Working Paper Series no. 2010‐06 , University of Massachusetts – Amherst.
Rodrik, D. (1986). Disequilibrium Exchange Rates as Industrialization Policy. Journal of Development Economics 23(1)
Rodrik, D. (2008). The Real Exchange Rate and Economic Growth. Brookings Papers on Economic Activity 39(2). Rodrik, D. (2009). Industrial Policy: Don’t Ask Why, Ask How. Middle East Development Journal 1(1) Roodman, D. (2006). How to do xtabond2: an introduction to “Difference” and “System” GMM in Stata. Center for Global Development Working Paper Number 103.
Sachs, J. and A. Warner (1995). Economic Reform and the Process of Global Integration, The World Bank, Policy Research Working Paper 4750, October.
Taye, H. (1999) The Impact of Devaluation on Macroeconomic Performance: The Case of Ethiopia. Journal of Policy Modeling 21(4)
34
UNIDO (2013). Industrial Development Report 2013: Sustaining Employment Growth: The Role of Manufacturing and Structural Change. UNIDO, Vienna
35
Table 1: Descriptive Statistics of the Main Variables Variable Mean Std. Dev. Min Tanzania Terms of Trade Index (year 2000=100)* 122 76 Government consumption to GDP(%) 24.4 10.6 Openness [(X+M)/GDP] (%) 41.9 16.6 Export Diversification Index 0.78 0.03 Tertiary Enrollment (%) 0.9 0.9 Reserve to GDP(%) 7.6 6.3 Investment to GDP (%) 24.2 5.7 Export Volume Index (year 2000=100) 124 66 Number of Export Products 160 48 Export to GDP (%) 14.8 7.1 Relative Factor Productivity TFP** 0.07 0.01 Real Effective Exchange Rate (year 2000=100) 124 63 Under Valuation Dummy 0.69 0.47 Manufacturing Value Added to GDP (%) 8.7 1.0 Share of Manufactured Export to GDP (%) 12 4 Ethiopia Terms of Trade Index (year 2000=100)* 118 14 Government consumption to GDP(%) 12.6 3.6 Openness [(X+M)/GDP] (%) 32.4 14.6 Export Diversification Index 0.68 0.10 Tertiary Enrollment (%) 2.0 2.2 Reserve to GDP(%) 5.4 3.9 Investment to GDP (%) 18.7 4.6 Export Volume Index (year 2000=100) 103 59 Number of Export Products 62 41 Export to GDP (%) 10.6 4.1 Relative Factor Productivity TFP** 0.14 0.01 Real Effective Exchange Rate (year 2000=100) 161 54 Under Valuation Dummy 0.86 0.35 Manufacturing Value Added to GDP 4.7 0.7 Share of Manufactured Export to GDP 0.10 0.04 *Based on UNCTAD Data **Based on UNIDO data and relative to USA Country Ethiopia Period
1988
2012
Max 36 11.6 15.1 0.73 0.2 0.1 14.7 45 81 4.8 0.05 64 0.00 6.9 7
335 42.8 79.8 0.85 3.9 17.5 36.1 261 224 30.6 0.08 331 1.00 10.6 20
92 7.4 9.0 0.55 0.5 0.2 10.7 29 25 3.3 0.11 85 0.00 2.8 0.05
151 19.2 57.7 0.80 8.0 14.9 26.5 256 149 19.2 0.18 293 1.00 5.7 0.26
Tanzania 1988
2012
Annual Average Growth in Real GDP
5.4%
5.2%
Annual Average Growth in Real Exports
8.0%
10.9%
Exports (% of GDP)
4.0%
36
7.2%
5.4%
19.5%
Exports (% of imports)
38.0%
25.0%
33.4%
49.5%
Openness (Trade as % of GDP)
14.4%
36.1%
21.5%
58.8%
2.07
17.70
99.3
1583.0
Nominal Exchange Rate (LCU:$US)
Source: Derived from World Development Indicators 2014
Figure 1
1 .5
Share
1.5
Cofee Export: The Ratio of Export to Exportable Production
1990
1995
2000
2005
2010
Year Ethiopia
37
Tanzania
2015
Recent Publications in the Series
nº
Year
Author(s)
Title
239
2016
Audrey Verdier-Chouchane and Charlotte Karagueuzian Sebastien Desbureaux, Eric Nazindigouba Kere, and Pascale Combes Motel
Concept and measure of inclusive health across countries Impact evaluation in the landscape: Protected natural forests, anthropized forested lands and deforestation leakages in Madagascar’s rainforests Decomposing sources of productivity change in small scale farming in Ethiopia
238
2016
237
2016
Kifle A. Wondemu
236
2016
Jennifer Denno Cissé and Christopher B. Barrett
Estimating Development Resilience: A Conditional Moments-Based Approach
235
2016
Daniel Ayalew Mekonnen, Nicolas Gerber and Julia Anna Matz
Social networks, agricultural innovations, and farm productivity in Ethiopia
234
2016
Megan Sheahan, Christopher B. Barrett and Casey Goldvale
The unintended consequences of agricultural input intensification: Human health implications of agrochemical use in Sub-Saharan Africa
233
2016
Adamon N. Mukasa
Technology Adoption and Risk Exposure among Smallholder Farmers: Panel Data Evidence from Tanzania and Uganda
232
2015
Linguère Mously Mbaye
Remittances and Access to Rural Credit Markets: Evidence from Senegal
231
2015
Adamon N. Mukasa and Adeleke O. Salami
Gender productivity differentials among smallholder farmers in Africa: A cross-country comparison
230
2015
Valérie Bérenger and Audrey Verdier-Chouchane
Child Labour and Schooling in South Sudan and Sudan: Is There a Gender Preference?