Proceedings of the Twenty-Third International Joint Conference on Artificial Intelligence
Optimizing Cepstral Features for Audio Classification ∗ Zhouyu Fu1 Guojun Lu2 Kai Ming Ting2 Dengsheng Zhang2 1. School of Computing, Engineering & Mathematics, University of Western Sydney, Australia 2. Gippsland School of Information Technology, Monash University, Australia
Abstract
to the loss of important features that discriminate between different classes. In this paper, we address the problem of optimal cepstral feature learning in a discriminative framework for improving over existing hand-crafted cepstral features. The proposed system consists two components. The front end is the feature extractor based on a multi-layer feedforward neural network which explicitly models the cepstral feature extraction process. The weights of the network provides a natural parametrization for the feature variables and can be modified to represent various types of cepstral features. A classifier model is then trained which takes the feature vectors aggregated from the output of the neural network in front. We take an embedded approach to tackle the problems of feature learning and classifier design simultaneously. To this end, a single optimization problem is formulated which involves optimizing two separate sets of variables, namely the feature variables represented by the neural network weights for feature generation, and the classifier variables for classification. With the use of a linear Support Vector Machine (SVM) classifier [Cortes and Vapnik, 1995], an efficient approach can be developed to solve the formulated problem and refine the feature variables iteratively for SVM classification. The main contributions of the paper are as follows.
Cepstral features have been widely used in audio applications. Domain knowledge has played an important role in designing different types of cepstral features proposed in the literature. In this paper, we present a novel approach for learning optimized cepstral features directly from audio data to better discriminate between different categories of signals in classification tasks. We employ multi-layer feedforward neural networks to model the cepstral feature extraction process. The network weights are initialized to replicate a reference cepstral feature like the mel frequency cepstral coefficient. We then propose a embedded approach that integrates feature learning with the training of a support vector machine (SVM) classifier. A single optimization problem is formulated where the feature and classifier variables are optimized simultaneously so as to refine the initial features and minimize the classification risk. Experimental results have demonstrated the effectiveness of the proposed feature learning approach, outperforming competing methods by a large margin on benchmark data.
1
• Interpretation of the cepstral feature extraction process from the novel perspective of feedforward neural networks. Different cepstral features can be generated from the neural network model with different weights. In Section 2, we show how network weights can be initialized to generate the standard mel frequency cepstral coefficient (MFCC) [Rabiner and Juang, 1993] features.
Introduction
Cepstral features have been widely used for audio modeling and analysis. A number of cepstral features have been proposed in the literature and used in different applications [Rabiner and Juang, 1993; Kim et al., 2004; Li and Ogihara, 2005; Lu et al., 2006]. Despite that, the major steps taken for cepstral feature extraction and representation are quite similar, apart from differences in implementation details. Implementation of cepstral features is largely based on domain knowledge and understanding of human perception of sound. Although most cepstral features are carefully designed with finely tuned parameters for generic audio applications, they usually do not take into any class label information into consideration in the design process. This may potentially lead
• Presentation of a new architecture with neural network feature extractors (NNFE) in front for feature generation, succeeded by a linear SVM classifier model trained using features produced by NNFE, which enables us to exploit the strength of neural networks for feature representation while enjoying the great generalization performance of SVM for classification at the same time. • Proposal of an embedded approach for joint feature learning and classifier training within a single problem formulation. We can avoid poor local solutions to the optimization problem with proper initialization by calibrating NNFE with a reference feature type like MFCC. The proposed algorithm is guaranteed to produce opti-
∗ The work was supported by Australian Research Council under the Discovery Project (DP0986052) “Automatic music feature extraction, classification and annotation” (Lu, Ting and Zhang), and University Western Sydney early career research grant scheme (Fu).
1330
the ith node in the output layer; ψ2 is the activation function for the output layer. Computing the cepstral feature vector for each frame is equivalent to passing the input spectrum into a predefined neural network. In this sense, the neural networks used here can be viewed as feature extractors (NNFE) whose characteristics are fully controlled by the weights α, β and activation functions ψ1 , ψ2 . We can modify these parameters to replicate different types of cepstral features using NNFE. Next we take MFCC, a widely used cepstral features in audio modeling, as an example to show this point. The intermediate feature vector ht is obtained by grouping the spectral bands based on the mel scale and converting them to dB values. This can be explicitly modeled by setting the weight α and activation function ψ1 in the hidden layer � � ( 1 mel jfLs ∈ ((i − 1)∆M , i∆M ) αi,j = (3) 0 otherwise x mel(x) =2595 log10 (1 + ) 700 ψ1 (x) = max (10 log10 (x), 0)
mized features that significantly improve over the initial reference features.
2
Cepstral Feature Representation
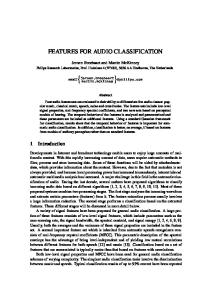
In this section, we first describe the process of cepstral feature extraction from audio signals. We then present a novel interpretation of the feature extraction process by viewing it from the perspective of a multi-layer feedforward neural network. This enables us to model varieties of cepstral features using neural networks with different weights and utilize them to generate novel features for classification. Cepstral Feature Extraction Process The process consists of a few standard steps as shown in Figure 1(a). Firstly, the input signal is converted into a spectrogram. The spectrogram models the distribution of spectral components over time and is created by splitting the audio signal into small frames and applying spectral transformations such as shorttime Fourier transform (STFT) and wavelet transform to framed signals. Secondly, different channels in the spectrogram are regrouped. This is normally done by mapping the frequency components based on certain scales such as the mel scale or logarithmic scale. After that, a nonlinear transformation is then applied to the mapped values for the purpose of converting power to decibels (dB). Then, an orthonormal transform such as the discrete cosine transform (DCT) is performed on the mapped spectrogram to decorrelate values from different channels. This leads to a feature vector representation for each frame, as shown in Figure 1(a). Finally, a single feature vector can be computed for the whole signal by aggregating the feature vectors across different frames. This is done by taking the order statistics such as mean and standard deviation of frame features. Neural Network Representation We focus on the three middle steps for cepstral feature extraction, as highlighted by the box in Figure 1(a). In the following we show that threelayer neural networks can be used to model these steps. As illustrated in Figure 1(b), the neural networks receive spectrogram values at input, map them to intermediate values in the hidden layer and produce cepstral features at the output. To elaborate on this, let S = {s1 , . . . , sT } denote the input spectrogram, which consists of spectral vectors st ∈ RnI from T frames. Each input st is mapped to ht ∈ RnM in the hidden layer by �XnI � ht [i] =ψ1 αi,j st [j] ∀i = 1, . . . , nM (1)
where mel(x) is the conversion from frequency in Hz to mel scale; ψ1 (x) maps energy to dB while bounding low energy values to 0; fs , fL , fH denote respectively the sampling frequency, the lowest and highest frequency values considered, (fL ) and ∆M = mel (fHn)−mel represents a linear step in the M mel scale. Intuitively, αi,j is set to 1 if and only if the jth frequency band maps to the ith mel band. Hence the output ht [i] accumulates spectral values in dB from all frequency bands falling in the ith mel band. In the decorrelation step, DCT is applied to each ht to obtain the MFCC feature vector xt for frame t. This forms a linear transformation with identity activation function at the output � � � � 1 π i (4) j+ βi,j = cos nM 2 ψ2 (x) =x Feature Aggregation The NNFE generates T cepstral feature vectors x1 , . . . , xT for an audio segment with T frames. The T vectors need to be aggregated to produce a single feature vector at segment level. Different aggregation schemes have been proposed in the literature for audio classification applications [Fu et al., 2011b]. A good aggregation scheme should capture the overall distributions as well as fluctuations of cepstral features across all frames. In this paper, we utilize a second-order aggregation scheme which takes the mean and standard deviation over each element of T output vectors
j=1
where notation v[i] denotes the ith element of vector v; nI and nM represent the number of nodes in the input and hidden layer, which equal to the length of vectors st and ht ; αi,j specifies the weight between the jth node in the input layer and the ith node in the hidden layer; ψ1 is the activation function for nodes in the hidden layer. This is followed by a similar operation that maps each ht to the cepstral feature vector xt ∈ RnO in the output layer, �XnM � xt [i] =ψ2 βi,j ht [j] ∀i = 1, . . . , nO (2)
T 1X xt [k] ∀k = 1, . . . , nO (5) T t=1 v u T X 1 u 2 ϕ[k + nO ] = √ t (xt [k] − ϕi [k]) ∀k = 1, . . . , nO T t=1
ϕ[k] =
j=1
The choice of feature aggregation scheme is not critical here though, as the algorithm discussed next section is quite general and able to incorporate different aggregation schemes.
where nO denotes the number of output features; βi,j specifies the weight between the jth node in the hidden layer and
1331
Input Signal
Spectrogram
Mapped Spectra
s1
Cepstrum
h1
x1
α β
...
Feature Aggregation
{
ϕ[nO + 1]
β
...
{
To classifier
xT
ϕ[2nO ]
... ...
{
hT
... Frame T
...
sT
α
...
...
... ϕ[nO ]
...
Decorrelate
ϕ[1]
...
Grouping
...
Spectral Transform
ϕ
... ...
Frame 1
Feature Vector
... ψ1
(a) Cepstral feature extraction
ψ2
(b) Neural network representation
Figure 1: The process for cepstral feature extraction and representation.
3 3.1
Discriminative Cepstral Feature Learning
function defined here degenerates to the standard linear SVM problem if feature vectors ϕn ’s are fixed. However, ϕn ’s are controlled by variables α and β, which is the main challenge of the optimization problem formulated here. α and β need to be optimized jointly with the classifier variable w to minimize the regularized risk of classification.
Model Formulation
In this section, we present our discriminative framework for optimal feature learning. A wrapper approach is adopted here which puts feature learning in the perspective of the classifier employed for classification. In this paper, we focus on the linear SVM classifier, a state-of-the-art tool for linear classification. The main purpose is to maximize the performance of linear SVM using the optimized features as input. Performance is dominated by two sets of variables interacting with each other - the feature variables given by the weights of the preceding NNFE that generate features for each frame; the SVM classifier variables applied to the feature vectors aggregated from the output of NNFE across all frames in each segment. To achieve optimal predictive performance, both variables need to be optimized in a joint fashion. Hence we formulate one optimization problem below to tackle feature learning and classifier training simultaneously N X 1 Q(w; α, β) = kwk2 + C `(yn , fn ) 2 n=1
fn =wT ϕn (α, β) `(yn , fn ) = max (0, 1 − yn fn )
3.2
Equation (6) defines an optimization problem with two groups of variables: the classifier variable w and feature variables α and β. To simplify and efficiently tackle the problem, we reformulate it as an alternative optimization problem below that depends on the feature variables only min g(α, β) α,β
with g(α, β) = min Q(w; α, β) w
(9)
The new objective function g(α, β) defined here is special because the value of g itself depends on the solution of another optimization problem. This makes it quite difficult to optimize g in general. However, according to Theorem 4.1 of [Bonnans and Shapiro, 1998], an optimal value function like g(α, β) is differentiable if Q(w; α, β) is differentiable in w and has unique optimal solution for w at each (α, β). Differentiability of Q with respect to w is guaranteed by the use of squared Hinge loss in Q (6). Note this is not true for the Hinge loss used in standard SVMs, as it is non-differentiable at yn fn = 1. The uniqueness condition is true due to the convexity of Q in w with an identity Hessian matrix. Convexity implies a unique optimal solution exists for each α and β. Thus function g in (9) proves to be differentiable. We can then employ a standard gradient descent based technique to solve the reformulated problem in (9). Similar strategies have been proposed in the literature to tackle optimization problems in learning kernel classifiers [Wu et al., 2006; Fu et al., 2011a]. To evaluate g(α, β), we need to first solve w that minimizes Q(w; α, β) given α and β. This is equivalent to training a standard linear SVM with input feature vectors computed from a neural network with weights α and β. Let w denote the SVM solution, according to [Bonnans and Shapiro, 1998], the gradient of g at α and β can be computed by substituting w into (6) and taking the derivative of
(6) (7)
2
Reformulation and Solution
(8)
where w is the weight vector for the linear classifier, and ϕn (α, β) represents the feature vector for the nth audio segment implicitly driven by variables α and β. Components of ϕn are defined in (5) by aggregating the output codes xn,t over T frames. Each xn,t can be computed via (1) and (2) by passing the corresponding input spectral vectors sn,t into NNFE. α = [αi,j ]nM ×nI and β = [βi,j ]nO ×nM are matrix forms of NNFE weights defined in (1) and (2). yn and fn are the class label and prediction value for input segment n, whereas `(yn , fn ) is the squared Hinge loss term penalizing inconsistency between label and prediction. We will see shortly that the use of squared Hinge loss is crucial here, as it leads to a continuously differentiable objective function making the reformulation in the next section sensible. Parameter C in (6) controls the trade-off between regularization and classification losses, as expressed by the first and second terms on the right-hand-side of the equation. The cost
1332
Algorithm 1 Iterative Optimal Cepstral Feature Learning Input: labeled data {Sn , yn }N i=1 and parameter rmax Output: feature variables α and β.
Algorithm 2 Feature Parameter Optimization Input: labeled data {Sn , yn }N i=1 , initial feature variables α and β (0) , and other parameters λβ , ςmax and τmax Output: feature and classifier variables β and w
Set r = 0 and initialize α(0) , β (0) via (3) and (4) for r = 1 to rmax do Solve β (r) = minβ g(α(r−1) , β (r−1) ) with Algorithm 2 Solve α(r) = minα g(α(r−1) , β (r) ) with Algorithm 2 end for
Solve w(0) = arg minw Q(w; α, β (0) ) Set g(α, β (0) ) = Q(w(0) ; α, β (0) ) repeat for ς = 1 to ςmax do ∂g(α, β) 0 Set β = β (τ ) − λ ∂β 0 0 Solve w = arg minw Q(w; α, β ) 0 0 0 Set g(α, β ) = Q(w ; α, β ) 0 if g(α, β ) < g(α, β (τ ) ) then 0 0 Set (w(τ +1) , β (τ +1) ) = (w , β ) and break end if Set λ = λ/2 end for Set λ = 2λ if ς = 1, and set τ = τ + 1 until (τ ≥ τmax or ς > ςmax )
g(α, β) = Q(w; α, β) w.r.t. α and β as if g does not depend on w. This can be done by applying the chain rule. To simplify gradient calculation, we first define the local gradients in the following 0 2 (2) δn,t,i = (fn − yn )ψ2 (βiT hn,t ) (10) T � � xn,t [i] − ϕn [i] w[i] + w[i + nO ] ϕn [i + nO ] nO X 0 (2) (1) δn,t,j βj,i ψ1 (αiT sn,t ) δn,t,i = j=1
3.4
where αi and βi are column vectors taken from the ith row of the weight matrix α and β, representing respectively weights from input layer nodes to node i in the hidden layer and weights from hidden layer nodes to node i in the output layer. The partial derivatives can then be computed from the local gradients as below T X X ∂g (2) = δn,t,i hn,t ∂βi t=1
(11)
T X X ∂g (1) = δn,t,i sn,t ∂αi t=1
(12)
To take the local gradients in (10), the activation functions ψ1 and ψ2 need to be differentiable. This is not the case for ψ1 in (3), which maps power to dB and ignores small values. Hence, we used the following piecewise nonlinear function instead which is continuously differentiable everywhere x < 1 − ∆1 0 ψˆ1 (x) = a(x − 1 + ∆1 )2 1 − ∆1 ≤ x ≤ 1 + ∆2 (13) 10 log10 (x) x > 1 + ∆2
n∈SV
with ∆2 = 0.1, ∆1 = 0.1097 and a = 9.4146. Although the identity map ψ2 in (4) is differentiable, it is not desirable for the purpose of feature optimization. This is because increasing the magnitude of xn,t would naturally reduce the objective function value of Q without improving classification performance. Due to practical concerns, we need to constrain the output values of NNFE to a bounded domain. Hence, we adopted the asymmetric logistic function below as the surrogate activation function for the output layer 1 2 − (14) ψˆ2 (x) = 2 1 + e−2(x−1/2) ψˆ2 (x) roughly maintains an identity map for values in the range of (0, 1) while monotonically mapping values on the real line to (−0.5, 1.5). This would effectively suppress the scaling artifact for feature and classifier training. For the optimization algorithm, we empirically set λβ = 1e − 3 and λα = λ2β . The initial step sizes are adjusted over the iterations. As can be seen in Algorithm 2, a simplified line search strategy is employed by shrinking the step size until line search is successful and expanding step size if line search is successful the first time in each iteration. We also noted that only a couple of outer iterations is needed for alternating optimization in Algorithm 1, whereas significantly more inner iterations are needed for the loop in Algorithm 2. For this reason, we empirically set rmax = 3 and τmax = 10.
n∈SV
where SV = {n|yn fn < 1} denotes the index set of support vectors defined by feature vectors with non-zero loss.
3.3
Implementation issues
Feature Learning Algorithm
There are two strategies for optimizing function g(α, β) in (9) using gradient descent. We can treat α and β as a single variable and apply the descent steps altogether. The main problem with this strategy is the selection of step sizes. As the gradient with α is usually much larger in magnitude than the gradient with β, different step sizes need to be chosen for different parameters. This makes the second strategy a natural choice, which is based on alternating optimization as shown in Algorithm 1. Basically, it iterates through steps of fixing one feature parameter and solving the other. The steps for optimizing β with gradient descent given α are listed in Algorithm 2. The existence of gradient is guaranteed as discussed earlier. The other case of optimizing α given β follows exactly the same steps by swapping α and β in Algorithm 2 and is omitted here for conciseness. Note that the classifier weight vector w is implicitly updated every time β or α is updated. This joint optimization of classifier and feature variables produces the features optimized for the classifier being used.
1333
4
Related Work
and Cook, 2002]. The data set contains 1000 music tracks equally distributed in 10 common music genres. The two data sets are downloaded from http://marsyasweb.appspot.com/download/data sets/. Tracks in both data sets are approximately 30 seconds long and sampled at 22050Hz. Unlike the standard setting in audio classification where full-length audio segments are used for feature extraction [Tzanetakis and Cook, 2002; Fu et al., 2011b], we explore a very different setting by using much shorter segments of 1 second length. Empirical studies have shown that humans can correctly identify the types of audio from samples less than 1 second [Gjerdingen and Perrott, 2008]. However, this would create a major obstacle for reliable feature extraction due to the length of the audio. Hence, it introduces an appropriate setting for feature comparison. In our experiments, we have examined the following features combined with the aggregation scheme in (5) and the SVM classifiers • SPEC - use of all features in the raw spectrogram • PCA - principal component analysis applied to SPEC • LMNN - a state-of-the-art technique for metric learning [Weinberger and Saul, 2009]. • MFCC - baseline cepstral features • SAE - autoencoder features as discussed in Section 4 • RAND - random initial weights α and β for NNFE MFCC, SAE and RAND features are computed from the same NNFE as shown in 1(b) with different initial weights for α and β. Standard sigmoid is adopted as activation functions for SAE and RAND to ensure numerical stability. In comparison, we applied the proposed optimal cepstral feature (OCF) learning algorithm to improve the above three reference features. The corresponding optimized features are dubbed OCFm , OCFs and OCFr respectively. Notice that OCFm is the same method described in Section 3, while OCFs and OCFr are based on the same idea but different initialization of feature variables. For each data set, we randomly selected 50% of data for training and the rest for testing. Both linear and Gaussian kernel SVMs were tested on the extracted/learned features. LibSVM [Chang and Lin, 2011] and LibLinear [Fan et al., 2008] were used to train kernel and linear SVMs respectively. Three-fold cross validation were performed on the training data set to select the best parameter C for both SVMs and the scale parameter for the Gaussian kernel. The process was repeated 10 times with different random partitions of training and testing sets. The average accuracy rates and standard deviations for each feature are reported in Table 1. Several interesting findings are revealed by Table 1. Firstly, the OCF algorithm is effective in producing discriminative features for classification. This can be clearly observed from the performance gap in accuracy rates between optimized features and reference features in the table. For both data sets and classifiers tested, the optimized features (OCFm /s /r ) outperform their corresponding reference features (MFCC/SAE/RAND) by a large margin. On the other hand, standard unsupervised and supervised linear feature extraction methods like PCA and LMNN do not perform as well as the proposed feature optimization method on audio
Different cepstral features have been proposed in the literature for audio modeling, including MFCC [Rabiner and Juang, 1993], NASE [Kim et al., 2004], OSC [Lu et al., 2006], DWCH [Li and Ogihara, 2005], etc. The core idea underlying cepstral feature extraction is quite similar by taking the spectral transform of the spectrogram of the signal so as to capture the statistics of the spectrogram. Various cepstral features differ in implementation details only, such as the choice of spectral transform used to compute the spectrogram and the final cepstral features, the criteria used for grouping different bands in the spectrogram, etc. The use of cepstrum is inspired by understanding of the human auditory system. Hence, the implementation and choice of parameters depend heavily on domain knowledge. Recently, there has been growing interest mainly in the machine learning community for modeling audio spectrogram directly using deep nets [Hinton and Salakhutdinov, 2006; Bengio et al., 2007; Lee et al., 2009] - neural networks with large number of hidden layers. A deep net consists an encoding network at the front that maps input data to the code vectors, succeeded by a decoding network which mirrors the encoding network and reconstructs the input data from the code vectors at the output layer. Such “autoencoder” networks can be trained in a greedy layer-wise fashion [Hinton and Salakhutdinov, 2006; Bengio et al., 2007]. Starting from a minimal network with single hidden layer, where the encoder is represented by mappings from input to the hidden layer and the decoder is represented by mappings from hidden to the output layer, one can stack additional layers on top of existing encoding and decoding networks, which can be trained using the previous output of the decoder as input and previous input to the encoder as target output. This leads to a stacked autoencoder (SAE) with deep architecture that captures the latent structure of the data. As an unsupervised method for learning feature representation, SAE is usually combined with a feedforward network and supervised finetuning of weights to handle classification tasks [Hinton and Salakhutdinov, 2006]. There has not been much work on feature extraction for spectrograms in audio applications. Despite that, feature extraction in general is well-studied in machine learning, especially methods based on learning a transformation to reduce the dimension of the input vectors such as principal component analysis and linear discriminant analysis [Bishop, 2004]. Specifically, the idea of metric learning [Davis et al., 2007; Weinberger and Saul, 2009] has recently attracted much attention in the research community, which aims at learning an optimal metric for distance computation that maximizes the discriminative power.
5
Experimental Results
In this section, we applied the proposed feature learning technique for two audio classification tasks and compared it with a number of competing approaches. The first task is the discrimination of music and speech signals. The data set contains 64 speech and 64 music signals respectively. The second task is music genre classification [Tzanetakis
1334
Spec PCA LMNN MFCC OCFm SAE OCFs RAND OCFr
Speech LSVM KSVM 85.7 ± 3.5% 85.0 ± 3.6% 80.4 ± 3.6% 85.6 ± 2.8% 81.4 ± 3.5% 87.2 ± 3.2% 91.9 ± 1.5% 94.6 ± 1.6% 95.0 ± 1.0% 97.0 ± 0.8% 79.9 ± 2.2% 82.9 ± 3.2% 92.6 ± 1.7% 96.0 ± 0.9% 68.4 ± 4.4% 80.9 ± 3.4% 82.1 ± 4.5% 85.3 ± 1.9%
Genre LSVM KSVM 44.2 ± 2.1% 52.3 ± 0.8% 34.6 ± 0.9% 45.4 ± 1.1% 40.2 ± 1.2% 52.0 ± 0.9% 54.5 ± 0.9% 61.9 ± 1.1% 65.0 ± 0.9% 73.6 ± 1.3% 48.5 ± 1.4% 56.0 ± 1.6% 59.7 ± 1.6% 68.7 ± 1.3% 32.1 ± 1.8% 36.9 ± 2.7% 40.9 ± 2.1% 51.0 ± 1.6%
mization algorithm, we performed optimization stepwise and recorded the cost function values at each step for three OCF features with different initialization. The linear classifier obtained at each step was used to perform prediction on the separate testing set and the accuracy rates for different methods were also recorded. This stepwise test was repeated 5 times and the average values are taken for each feature type. Figure 2 shows the results for each data set. We have plotted the change of cost function values and accuracy rates against iteration numbers in separate plots. Curves for different features are shown with different markers. It can be seen clearly that the cost function values are monotonically decreasing over the iterations for each data set and feature compared. The test accuracies are closely correlated with cost function values, and lower values usually lead to higher test accuracies. The decrease of function values and improvement of test accuracies are especially obvious for the initial 10 − 20 iterations. We can also clearly spot the edge of OCFm over the other two OCFs with OCFm curves sitting on top of the other two curves in accuracy-vs-iteration plots, and lower than the other two in cost-vs-iteration plots. These results have clearly demonstrated the effectiveness of the optimization approach to feature learning.
Table 1: Performances of different features for audio classification. (LSVM: linear SVM; KSVM: kernel SVM) classification tasks. They do not improve over the performance of SPEC which uses the raw spectrogram without any feature extraction, while nonlinear feature extractors like MFCC/OCFm and SAE/OCFs achieve much higher accuracies than SPEC. Another important message from the results in Table 1 is the crucial role that proper initialization plays for the OCF algorithm. There is absolutely no performance guarantee with random initialization of weights, which is clearly indicated by the poor performance of RAND and OCFr as compared to the other two initialization schemes (MFCC and OCFm , SAE and OCFs ). Nevertheless, this is not a major issue as we can usually capitalize on domain knowledge to adjust the NNFE weights so as to replicate an existing high-achieving feature like the MFCC. The optimization process ensures that the updated features would outperform initial features. As can be seen in Table 1, OCFm performs best among all features under comparison. It still manages to achieve significantly higher accuracy rates than the already strongly performing MFCC. It is also quite interesting that MFCC/OCFm outperforms SAE/OCFs , even though SAE provides an effective means for unsupervised feature representation. A possible reason is that SAE usually requires stacking up more layers to take full advantage of a deep architecture. The more layers, the better representation, albeit at the cost of increased computational complexity. A three-layer neural network is sufficient to model cepstral features like MFCC as we have already showed in Section 2, but may still be inadequate for SAE. However, the proposed optimization approach is quite general and can easily be adapted to accommodate for preprocessing NNFEs with more than three layers. Moreover, SAE is more general than MFCC and can be used in scenarios with limited domain knowledge. Finally, we noticed from Table 1 that although features are optimized for linear SVM, they also perform consistently for kernel SVM, although the performance improvement of kernel SVM over the linear version is not as much as the improvement of OCF over unoptimized features. It can be seen from the table that in all cases, OCF with linear SVM achieves higher accuracies than the corresponding reference feature with kernel SVM. This is quite a desirable outcome as linear SVM training is much more efficient than kernel SVM. Thus the proposed OCF approach, which involves repeated training of linear SVMs only, is likely to scale up to largescale data where kernel SVM training becomes impractical. To further demonstrate the effectiveness of the feature opti-
(a) Speech
(b) Genre
Figure 2: Stepwise demonstration of feature optimization algorithms with different initialization. Plots on the left track cost function values over the iterations, and plots on the right show the variation of accuracy rates.
6
Concluding Remarks
We presented an effective approach to learning optimal cepstral features for audio classification. By modeling cepstral feature representation with a feedforward neural network, we can parametrize features with weights of the network. This enables us to develop an optimization framework that optimizes the classifier and the feature weights jointly to minimize classification loss. Although we only discussed and tested standard MFCC in this paper, the proposed approach is quite general and can be employed to optimize different types of audio features.
1335
References
[Tzanetakis and Cook, 2002] G. Tzanetakis and P. Cook. Musical genre classification of audio signals. IEEE Trans. Speech and Audio Processing, 10(5):293–302, 2002. [Weinberger and Saul, 2009] K. Weinberger and L. K. Saul. Distance metric learning for large margin nearest neighbour classification. Journal of Machine Learning Research, 10:207–244, 2009. [Wu et al., 2006] M. Wu, B. Scholkopf, and G. Bakir. A direct method for building sparse kernel learning algorithms. Journal of Machine Learning Research, 7:603–624, 2006.
[Bengio et al., 2007] Y. Bengio, P. Lamblin, D. Popovici, and H. Larochelle. Greedy layer-wise training of deep networks. In Advances in Neural Info. Proc. Systems, pages 153–160, 2007. [Bishop, 2004] C. M. Bishop. Pattern Recognition and Machine Learning. Springer, 2004. [Bonnans and Shapiro, 1998] J. F. Bonnans and A. Shapiro. Optimization problems with pertubation: A guided tour. SIAM Review, 40(2):202–227, 1998. [Chang and Lin, 2011] C-C. Chang and C-J. Lin. LIBSVM: A library for support vector machines. ACM Transactions Intelligent Systems and Technology, 2:27:1–27:27, 2011. [Cortes and Vapnik, 1995] C. Cortes and V. Vapnik. Support-vector networks. Machine Learning, 20(3):273– 297, 1995. [Davis et al., 2007] J. Davis, B. Kulis, P. Jain, S. Sra, and I. Dhillon. Information-theoretic metric learning. In Intl. Conf. Machine Learning, 2007. [Fan et al., 2008] R.-E. Fan, K.-W. Chang, C.-J. Hsieh, X.R. Wang, and C.-J. Lin. Liblinear: A library for large linear classification. Journal of Machine Learning Research, 9:1871–1874, 2008. [Fu et al., 2011a] Z. Fu, G. Lu, K-M. Ting, and D. Zhang. Building sparse support vector machines for multiinstance classification. In Euro. Conf. Machine Learning, pages 471–486, 2011. [Fu et al., 2011b] Z. Fu, G. Lu, K-M. Ting, and D. Zhang. A survey of audio-based music classification and annotation. IEEE Trans. Multimedia, 32(14):1768–1777, 2011. [Gjerdingen and Perrott, 2008] R. Gjerdingen and D. Perrott. Scanning the dial: The rapid recognition of music genres. Journal of New Music Research, 37(2):93–100, 2008. [Hinton and Salakhutdinov, 2006] G. E. Hinton and R. Salakhutdinov. Reducing the dimensionality of data with neural networks. Science, 313:504–507, 2006. [Kim et al., 2004] H. G. Kim, N. Moreau, and T. Sikora. Audio classification based on mpeg-7 spectral basis representation. IEEE Trans. Circuits and Systems for Video Technology, 14(5):716–725, 2004. [Lee et al., 2009] H. Lee, R. Grosse, R. Ranganath, and A. Y. Ng. Convolutional deep belief networks for scalable unsupervised learning of hierarchical representations. In Intl. Conf. Machine Learning, 2009. [Li and Ogihara, 2005] T. Li and M. Ogihara. Towards intelligent music information retrieval. IEEE Trans. Multimedia, 8(3):564–574, 2005. [Lu et al., 2006] L. Lu, D. Liu, and H-J. Zhang. Automatic mood detection and tracking of music audio signals. IEEE Trans. Speech and Audio Processing, 14(1):5–18, 2006. [Rabiner and Juang, 1993] L. Rabiner and B. Juang. Fundamentals of Speech Recognition. Prentice-Hall, 1993.
1336