12th International Society for Music Information Retrieval Conference (ISMIR 2011)
MUSICAL GENRE CLASSIFICATION BY ENSEMBLES OF AUDIO AND LYRICS FEATURES Rudolf Mayer and Andreas Rauber Institute of Software Technology and Interactive Systems Vienna University of Technology, Austria
ABSTRACT
heavily influenced by their style: ‘Punk Rock’ variations are recorded as well as ‘Hip-Hop’ or ‘Rap’ versions.
Algorithms that can understand and interpret characteristics of music, and organise them for and recommend them to their users can be of great assistance in handling the ever growing size of both private and commercial collections. Music is an inherently multi-modal type of data, and the lyrics associated with the music are as essential to the reception and the message of a song as is the audio. In this paper, we present advanced methods on how the lyrics domain of music can be combined with the acoustic domain. We evaluate our approach by means of a common task in music information retrieval, musical genre classification. Advancing over previous work that showed improvements with simple feature fusion, we apply the more sophisticated approach of result (or late) fusion. We achieve results superior to the best choice of a single algorithm on a single feature set.
These examples show that there is a whole level of semantics inherent in song lyrics that can not be detected solely by audio based techniques. We thus assume that a song’s text content can help in better understanding its perception, and evaluate a new approach for combining descriptors extracted from the audio domain of music with descriptors derived from the textual content of lyrics. Our approach is based on the assumption that a diversity of music descriptors and a diversity of machine learning algorithms are able to make further improvements. Music information retrieval (MIR) is concerned with adequately accessing (digital) audio. Important research directions include similarity retrieval, musical genre classification, or music analysis and knowledge representation. A comprehensive overviews of the research field is given in [11]. The prevalent technique of music for MIR purposes is to analyse the audio signal. Popular feature sets include MFCCs, Chroma, or the MPEG-7 audio descriptors.
1. INTRODUCTION AND RELATED WORK Music incorporates multiple types of content: the audio itself, song lyrics, album covers, social and cultural data, and music videos. All those modalities contribute to the perception of a song, and an artist in general. However, often a strong focus is put on the audio content only, disregarding many other opportunities and exploitable modalities. Even though music perception itself is based on sonic characteristics to a large extent, and acoustic content makes it possible to differentiate between acoustic styles, a great share of the overall perception of a song can be only explained when considering other modalities. Often, consumers relate to a song for the topic of its lyrics. Some categories of songs, such as ‘love songs’ or ‘Christmas’ songs, are almost exclusively defined by their textual domain; many traditional ‘Christmas’ songs were interpreted by modern artists and
Previous studies reported about a glass ceiling being reached using timbral audio features for music classification [1]. Weveral research teams have been working on analysing textual information, predominantly in the form of song lyrics and an abstract vector representation of the term information contained in other text documents. A semantic and structural analysis of song lyrics is conducted in [8]. An evaluation of artist similarity via song lyrics is given in [7], suggesting a combination of approaches might lead to better results. In this paper, we employ feature sets derived from the lyrics content, capturing rhyme structures, part-of-speech of the employed words, and style, such as diversification of the words used, sentence complexity, and punctuation. These feature sets were introduced in [10], and applied to genre classification. This approach has further been extended to a bigger test collection and a combination of lyrics and audio features in [9], reporting results superior to single feature sets. The combination based on simple feature fusion (early fusion), i.e. concatenating all feature subspaces is however simplistic. Here, we rather apply late fusion, combining classifier outcomes rather than features. We create a two-
Permission to make digital or hard copies of all or part of this work for personal or classroom use is granted without fee provided that copies are not made or distributed for profit or commercial advantage and that copies bear this notice and the full citation on the first page. c 2011 International Society for Music Information Retrieval.
675
Poster Session 6
bles [4]. The system employs a strategy for selecting the best set of models, based on finding the Pareto-optimal set of models by rating them in pairs, according to two measures. The first one is the inter-rater agreement diversity measure κ, defined on the coincidence matrix M of the two models. The entry mr,s is the proportion of the dataset that model hi labels as Lr and model hj labels as Ls . The second measure is the pair average error, computed by
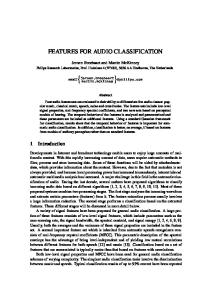
Figure 1. Overview of the Cartesian Ensemble System, combining feature sets with a set of classification schemes
eij = 1 −
αi + αj 2
(1)
where αi and αj are the estimated accuracy of the two models. The Pareto-optimal set contains all non-dominated pairs, i.e. pairs for which there is no other pair that is better than on both criteria. For more details, pleas see [4].
dimensional ensemble system, a Cartesian classifier, combining different feature subspaces from different domains, and different classification algorithms. This paper is structured as follows. We describe the ensemble approach in Section 2. We then evaluate and analyse its results on two corpora in Section 3. Finally, we conclude, and give a short outlook on future research in Section 4.
Vote Combination Rules: The system provides weighted and unweighted vote combination rules. The unweighted rules employed are described e.g. in [2]. They comprise simple majority voting (MAJ), which favours the class predicted by most votes, and rules that combine the individual results by the average (AVG), median (MED) or maximum (MAX) of the posterior probability P (Lk |xi ) of instance x to belong to category Lk , as provided by model hi . The weighted rules multiply model decisions by weights and select the label Lk that gets the maximum score. Model weights are based on the estimated accuracy αi of the trained models. The authority ai of each model hi is established as a function of αi , normalized, and used as its weight ωi . The Simple Weighted Vote (SWV) computes weights as a simple weighted vote. The more complicated weight functions for the Rescaled Simple Weighted Vote (RSWV), BestWorst Weighted Vote (BWWV) and Quadratic Best-Worst Weighted Vote (QBWWV) are depicted in Figure 2. There, eB is the lowest estimated number of errors made by any model in the ensemble on a given validation dataset, and eW is the highest estimated number of errors made by any of those classifiers. Weighted Majority Vote (WMV) is a theoretically optimal weighted vote rule described in [4], where model weights are set proportionally to log(αi /(1 − αi )).
2. CARTESIAN ENSEMBLE A schematic overview of the ensemble system, building on a system introduced in [5], is given in Figure 1. The system is called Cartesian ensemble, as the set of models it uses as base classifiers is composed as the Cartesian product of D feature subspaces/sets by C classification schemes. A model is built for each combination of a training classification scheme ci on a feature subspace dj , yielding a total of D×C base models as the ensemble. A classification scheme is a specific classification algorithm and parameters used. The goal of the ensemble approach is two-fold. First, it is aimed at obtaining a sufficiently diverse ensemble of models, which will guarantee, up to a certain degree, an improvement of the ensemble accuracy over the best single model trained. Choosing this best single model a priori is a difficult task, and previous results have shown that there is no combination of algorithm (and parameters) and features which would yield the best result for each dataset and task. Thus, the second goal of the approach is to abstract from the selection of a such a particular classifier and feature set to use for a particular problem. When a previously unknown piece of music is presented to the ensemble system, the selected models each produce a prediction for a specific category. To obtain a final result, these individual predictions are then combined to produce a single category prediction outcome. For this step, a number of different decision combination (or label fusion) rules, can be used. The Cartesian ensemble system is built on the open-source WEKA toolkit, and uses classification algorithms available therein.
Inner/Outer Cross Validation: To estimate how the results from a classifier will generalize on independent data, the classification model is tested on labelled data which was not used for training the model, and measures such as accuracy are recorded. To reduce the variability, often a technique called cross-validation is employed: n multiple rounds of partitioning the data in a training and test set are performed, and the recorded measures are averaged over all the rounds. For weighted combination rules, we need to estimate the accuracy of individual ensemble models (αi ) to obtain their authorities (ai ). To avoid using test data of the ensemble for single model accuracy estimation, an in-
Pareto-optimal Classifier Selection: Model diversity is a key design factor for building effective classifier ensem-
676
12th International Society for Music Information Retrieval Conference (ISMIR 2011)
ak
ak
ak
1
1
1
normalised by the number of words or lines of the lyrics document. 3.2.1 Topic Features
0 0
N(1−1/M) e k
eB
eW
ek
eB
eW
ek
For analysing the topical content of the lyrics, we rely on classical bag-of-words indexing, which uses a set of words to represent each document. Let the number of documents in a collection be denoted by N , each single document by d, and a term or token by t. Accordingly, the term frequency tf (t, d) is the number of occurrences of term t in document d and the document frequency df (t) the number of documents term t appears in. We then apply weights to the terms, according to their importance or significance for the document, using the popular model of term frequency times inverse document frequency.This results in vectors of weight values for each document d in the collection, i.e. each lyrics document. We do not perform stemming in this setup, earlier experiments showed only negligible differences for stemmed and non-stemmed features (the rationale behind using nonstemmed terms is the occurrence of slang language in some genres).
Figure 2. Model weight computation ner cross-validation relying on ensemble training data only is performed. The predicted accuracy of this inner crossvalidation is then taken as the authority of the model. 3. EVALUATION In this section, we first present the feature subspaces and datasets employed in our evaluation, followed by a detailed analysis of the classification results. 3.1 Audio Feature Subspaces The audio descriptors are extracted from a spectral representation of an audio signal, partitioned into segments of 6 sec. Features are extracted segment-wise, and then aggregated for a piece of music computing the median (RP, RH) or mean (SSD) from features of multiple segments. For details on the computation, please refer to the literature for details [6]. The feature extraction for a Rhythm Pattern is composed of two stages. First, the specific loudness sensation on 24 critical frequency bands is computed through a Short Time FFT, grouping the resulting frequency bands to the Bark scale, and successive transformation into the Decibel, Phon and Sone scales. This results in a psychoacoustically modified Sonogram representation that reflects human loudness sensation. Then, a discrete Fourier transform is applied, resulting in a spectrum of loudness amplitude modulation per modulation frequency for each critical band. A Rhythm Histogram (RH) aggregates the modulation amplitude values of the critical bands computed in a Rhythm Pattern and is a descriptor for general rhythmic characteristics in a piece of audio [6]. The first part of the algorithm for computation of a Statistical Spectrum Descriptor (SSD), the computation of specific loudness sensation, is equal to the Rhythm Pattern algorithm. Subsequently at set of statistical valuesare calculated for each individual critical band. SSDs describe fluctuations on the critical bands and capture additional timbral information very well [6].
3.2.2 Rhyme and Style Features Rhyme denotes the consonance or similar sound of two or more syllables or whole words. The motivation for this set of features was that different genres of music should exhibit different styles of lyrics and rhymes. ‘Hip-Hop’ or ‘Rap’ music, for instance, makes heavy use of rhymes, which (along with a dominant bass) leads to their characteristic sound. To identify such patterns we extract several descriptors from the phoneme transcription of the song lyrics. We then distinguish two elements of subsequent lines in a song text: AA and AB. The former represents two rhyming lines, while the latter denotes non-rhyming. Based on these, we extract a set of rhyme patterns, such as a sequence of two (or more) rhyming lines (‘Couplet’), alternating rhymes, or sequences of rhymes with a nested sequence (‘Enclosing rhyme’), and count their frequency. Subsequently, we compute the percentage of rhyming blocks, and define the unique rhyme words as the fraction of unique terms used to build rhymes, describing whether rhymes are frequently formed using the same word pairs. Part-of-speech (POS) tagging is a lexical categorisation or grammatical tagging of words. Different POS categories are e.g. nouns, verbs, articles or adjectives. We presume that different genres will differ also in the category of words they are using; thus, we extract several POS descriptors from the lyrics. We count the numbers of: nouns, verbs, pronouns, relational pronouns (such as ‘that’ or ‘which’), prepositions, adverbs, articles, modals, and adjectives. Text documents can also be described by simple statistical style measures based on word or character frequencies. Measures such as the average length of words or the ratio
3.2 Lyrics Feature Subspace The following feature subspaces are all based on song lyrics, and analyse the content, and rhyme and style of them. For more details on features please refer to [10] [9]. To account for different document lengths, where applicable, values are
677
Poster Session 6
of unique words in the vocabulary might give an indication of the complexity of the texts, and are expected to vary over different genres. Further, the usage of punctuation marks such as exclamation or question marks may be specific for some genres, and some genres might make increased use of apostrophes when omitting the correct spelling of word endings. Other features describe the words per line and the unique number of words per line, the ratio of the number of unique words and the total number of words, and the average number of characters per word. A particular feature is words-per-minute, which is computed analogously to the well-known beats-per-minute (BPM) value.
Table 1. Composition of the test collections; the left and right columns show the number of artists, albums and songs for the small and large collection, respectively Genre Country Folk Grunge Hip-Hop Metal Pop Punk Rock R&B Reggae Slow Rock Total
3.3 Datasets Music information retrieval research in general suffers from a lack of standardised benchmark collections – being mainly attributable to copyright issues. Nonetheless, some collections have been used frequently in the literature, such as the two collections provided for the ‘rhythm’ and ‘genre’ retrieval tasks held in conjunction with the ISMIR conference 2004, or the collection presented in [12]. However, for the first two collections, hardly any lyrics are available as they are either instrumental songs or free music for which lyrics were not published. For the latter, no meta-data such as song titles is available, making automatic fetching of lyrics impossible. The collection used in [3] consists of only 260 pieces and was not initially used for genre classification. Further, it was compiled from only about 20 different artists – we specifically wanted to avoid unintentionally classifying artists rather than genres. Therefore, we constructed two different test collections of differing size as a random sample from a private collection [9]. The first database consists of 600 songs, aimed at having a high number of different artists, with songs from different albums to prevent biased results by too many songs from the same artist/album. It thus comprises songs from 159 different artists and 241 different albums. They are organised in ten genres of 60 songs each (cf. left part of Table 1). To confirm the findings from the smaller test collection, we created a larger, more diversified database of medium- to large-scale, consisting of 3,010 songs.The numbers of songs per genre range from 179 in ‘Folk’ to 381 in ‘Hip-Hop’. Detailed figures about this collection can be taken from the right part of Table 1. To be able to better relate and match the results obtained for the smaller collection, we only selected songs belonging to the same ten genres. We then automatically fetched lyrics from popular lyrics portals on the Internet. In case the primary portal didn’t provide any lyrics, the other portals were used until all lyrics were available. No checking of the quality of the texts with respect to content or structure was performed; thus, the lyrics can be considered a representative data source a simple automated system could retrieve.
Artists 6 9 5 11 8 9 15 21 22 25 24 26 32 30 14 18 12 16 21 23 159 188
Albums 13 23 7 16 14 17 18 34 37 46 37 53 38 68 19 31 24 36 35 47 241 370
Songs 60 227 60 179 60 181 60 381 60 371 60 371 60 374 60 373 60 181 60 372 600 3010
3.4 Genre Classification Results The following tables give the classification accuracies in per cent. For statistical significant testing, we used a paired ttest (α=0.05, micro-averaged accuracy); in the tables, improvement or degradation over datasets (column-wise) is indicated by (+) or (−), respectively. Table 2 shows the classification results of the single classifiers on single feature sets on the small dataset. It can be noted that the SSD features are the best performing single feature set, and the SVM the best classifier; here, the linear kernel performed better than the quadratic. This combination of feature set and classification scheme thus serves as the primary base-line to compare the Cartesian ensemble results to. The results of the SSD features clearly outperform the other audio feature sets (RH omitted, cf. [9]), by 10% points and more. k-NN is the second-best classification algorithm, achieving 52.17% accuracy with a k of 1 on SSD features, outperforming both Random Forests and Na¨ıve Bayes. Regarding the lyrics features, the text statistics features perform best from the rhyme and style features, achieving 30% accuracy. The text statistics features are slightly outperformed by the bag-of-words features when using the linear SVM, and significantly on Na¨ıve Bayes, while they perform significantly worse on k-NN, Random Forests and the quadratic SVM. Further, Table 2 also gives the set of best-performing combinations of concatenating the single feature sets (early fusion). They are assumed as a secondary baseline for the ensemble. Compared to the single feature sets, when combining SSD and lyrics style statistics features, we could significantly improve the result, by almost 7% points. We can also observe that the improvement is not of statistical significance for the other classification schemes. It is also interesting to note that combining with the bag-of-words features does improve the results over the SSD baseline when using the SVM with the linear kernel, but not to the extent as when combining with the rhyme and style features, even though
678
12th International Society for Music Information Retrieval Conference (ISMIR 2011)
Table 2. Results of the single classification on the small datasets Feature set Rhyme POS TextStat BOW243 BOW725 BOW1302 BOW4695 RP SSD (audio baseline) SSD/Stat (comb. baseline) SSD/Stat/Rhyme SSD/Stat/POS SSD/Stat/POS/Rhyme BOW893 /SSD BOW893 /SSD/POS/Rhyme/TextStat
NB 15.67 19.67 21.50 23.67 27.67 30.00 31.17 38.67 45.50 47.17 47.33 46.67 47.17 35.67 39.33 -
1-NN 12.83 14.50 20.50 17.67 12.67 13.83 10.33 33.17 52.17 55.33 54.17 51.50 52.17 41.50 45.83
Rule RSWV BWWV QBWWV
10-NN 14.17 18.50 24.33 19.83 12.17 12.83 10.50 29.83 51.50 52.33 54.00 52.67 53.50 34.83 36.33 -
SVMLin 13.17 20.33 30.00 28.33 31.00 32.17 31.17 49.17 59.00 65.83 + 63.50 64.00 + 64.00 + 62.17 64.00
SVMPol 11.17 20.17 28.17 27.33 26.33 23.17 12.83 46.33 58.67 61.33 62.17 60.50 60.33 60.83 63.83
RF 15.67 17.83 25.50 21.67 22.67 23.50 23.33 32.67 48.67 45.00 48.67 50.67 48.00 41.33 44.83
We can further note that text statistics are again the best feature of the rhyme and style features, reaching almost 30% points with SVMs. The bag-of-words features, however, yield much better results than that, with 42.47% when using the linear SVM kernel and 8270 content terms. We can achieve almost 40% accuracy also with the Na¨ıve Bayes algorithm, while Random Forests and k-NN predict much less correctly classified instances.
Table 3. Ensemble classification results Small Database All subspaces SSD-only 63.67 + 59.00 63.67 + 59.33 63.17 60.17
5-NN 13.33 18.00 22.00 21.33 14.67 11.67 10.67 32.67 50.17 53.00 52.67 50.33 50.67 44.33 46.67
Large Database All subspaces SSD-only 73.65 + 69.33 74.08 + 69.69 73.94 + 70.62
the bag-of-words features alone performed better. There is no increase on performance on any of the other classification schemes; in contrary, on Na¨ıve Bayes and k-NN, the results are statistically significant worse. The rhyme and style features may thus be seen as more complimentary to the audio features. Table 3 finally presents the results of a number of selected combination rules. These rules have been selected, as they showed to be the most performing rules over a series of experiments. We can see from that results that we are able to improve on the SSD audio baseline by up to 4.5% point. The rules RSWV, BWWV, and QBWWV thereby show almost the same accuracy. While the Cartesian ensemble approach failed to beat the best result of feature fusion, namely the linear SVM classifier on combined SSD and text statistics features, we obtained a better result than this very same concatenation approach achieved when using the SVM with a quadratic kernel. It has to be noted that finding this best feature fusion result requires testing a number of different feature combinations, as well as testing a lot of different algorithms. This is a time-consuming and labour-intensive task, as well as it is computationally expensive. The results on the large dataset given in Table 4, including bag-of-words feature sets with different number of features selected by simple document frequency thresholding. SSD was again clearly the best audio feature set, clearly outperforming the RP features by more than 14% on the best SSD classifier than on the best RP classifier (SVM quadratic and SVM linear, respectively). However, it is worth to note that on this dataset, the quadratic SVM kernel on SSD performed with 69.43% significantly better than the linear one with 66.37%, which was the best kernel on the small database.
Regarding the results with early fusion, while we could significantly improve the linear Kernel on SSD features by concatenating them with the lyrics features, the improvements for the quadratic kernel are a bit less. It is also interesting to note that the better combination is with the rhyme and style features yields better results than adding the bagof-words, even though the bag-of-words alone had more than 12% points better accuracy results. When using our novel result (late) fusion approach, results for which are shown in Table 3, we can achieve classification accuracies which are in absolute numbers up to 5% points better than with the best concatenation approach, which is statistically significantly better. In numbers, the improvement is from 69.43% as the best result with SSD features to 74.08% as the best ensemble result. It can be noted that the best combination rules RSWV, BWWV, and QBWWV all show almost the same accuracy, thus relying on any of those seems feasible. As a further baseline to the ensembles of multiple features, an ensemble of the above mentioned classification schemes on SSD features only is given in Table 3. This baseline is to test whether the improvements reported above are achieved due to the use of different schemes, or only when also using different feature sets. As the ensemble on SSDonly features improves just 0.5% point over the best single results, while the performance is 3 to 4% point better than that baseline when using all feature sets, it can be concluded that the gain in accuracy is largely due to the Cartesian ensemble of both feature subspaces and algorithms.
679
Poster Session 6
Table 4. Results of the single classification on the large datasets Feature set Rhyme POS TextStat BOW248 BOW1456 BOW4262 BOW8270 RP SSD (audio baseline) SSD/Stat (comb. baseline) SSD/Stat/POS SSD/Stat/POS/Rhyme SSD/BOW4262 SSD/POS/Rhyme/BOW4262
NB 16.62 23.53 17.91 28.71 37.19 38.65 39.38 34.73 42.11 43.87 44.50 + 44.80 + 42.24 41.54
1-NN 16.92 20.94 23.40 21.34 15.89 15.32 15.25 41.57 62.58 63.88 62.51 62.74 31.67 − 50.22 −
5-NN 16.58 21.64 25.09 15.85 12.53 12.30 12.40 40.68 62.21 63.01 63.18 62.41 31.18 − 55.67 −
4. CONCLUSIONS
RF 19.91 24.59 34.30 31.24 29.98 28.98 30.34 37.35 55.07 57.06 55.90 57.63 + 47.02 − 53.24 −
[7] Beth Logan, Andrew Kositsky, and Pedro Moreno. Semantic analysis of song lyrics. In Proceedings of the IEEE International Conference on Multimedia and Expo, Taipei, Taiwan, 2004. ´ [8] Jose P. G. Mahedero, Alvaro Mart´ınez, Pedro Cano, Markus Koppenberger, and Fabien Gouyon. Natural language processing of lyrics. In Proceedings of the ACM Multimedia, Singapore, 2005. [9] Rudolf Mayer, Robert Neumayer, and Andreas Rauber. Combination of audio and lyrics features for genre classification in digital audio collections. In Proceedings of the ACM Multimedia. ACM New York, NY, USA, October 27-31 2008.
[1] Jean-Julien Aucouturier and Francois Pache. Improving timbre similarity: How high is the sky? Journal of Negative Results in Speech and Audio Sciences, 1(1), 2004.
[4] Ludmila I. Kuncheva. Combining Pattern Classifiers: Methods and Algorithms. Wiley-Interscience, 2004.
SVMPol 15.65 24.53 25.49 36.36 39.12 34.16 29.38 51.11 69.43 69.99 69.46 69.69 66.57 − 68.50
[6] Thomas Lidy and Andreas Rauber. Evaluation of feature extractors and psycho-acoustic transformations for music genre classification. In Proceedings of the 6th International Conference on Music Information Retrieval, London, UK, 2005.
5. REFERENCES
[3] Peter Knees, Markus Schedl, and Gerhard Widmer. Multiple lyrics alignment: Automatic retrieval of song lyrics. In Proceedings of the 6th International Conference on Music Information Retrieval, London, UK, 2005.
SVMLin 16.08 23.66 28.38 36.52 40.18 41.08 42.47 55.90 66.37 68.60 + 68.86 + 67.83 66.97 67.46
[5] Thomas Lidy, Rudolf Mayer, Andreas Rauber, Pedro J. Ponce de Le´on, Antonio Pertusa, and Jose M. I˜nesta. A cartesian ensemble of feature subspace classifiers for music categorization. In Proceedings of the 11th International Conference on Music Information Retrieval, Utrecht, The Netherlands, August 9–13 2010.
We presented an approach for multi-modal classification of music. Contrary to earlier work on fusion of feature subspaces, the approach is built on classifier ensemble techniques, i.e. fusion of the labels assigned by each single classifier. We evaluated the method by musical genre classification on two different datasets. We achieved better results than when using the single feature sets alone, and for the larger dataset also better results than with the best concatenation approach. These improvements are up to 6% points above the baseline, and statistically significant. We observed that the combination of the best performing feature set and classification algorithm can vary on different datasets; even the choice of a different kernel for the SVM classifier yielded very different results on the small and large dataset. Using the ensemble approach, we can release the user from having to make this choice explicitly, or from using computationally expensive approaches like model selection. We have concluded from our experiments that a number of combination rules is promising, and the QBWWV method seems to show the overall best results.
[2] Josef Kittler, Mohamad Hatef, Robert P.W. Duin, and Jiri Matas. On combining classifiers. IEEE Transactions on Pattern Analysis and Machine Intelligence, 20(3):226–239, 1998.
10-NN 18.11 22.60 25.86 13.53 15.42 13.03 13.06 40.88 62.78 62.12 62.48 61.78 30.94 − 58.63 −
[10] Rudolf Mayer, Robert Neumayer, and Andreas Rauber. Rhyme and style features for musical genre classification by song lyrics. In Proceedings of the 9th International Conference on Music Information Retrieval, Philadelphia, PA, USA, September 14-18 2008. [11] Nicola Orio. Music retrieval: A tutorial and review. Foundations and Trends in Information Retrieval, 1(1):1–90, 2006. [12] George Tzanetakis and Perry Cook. Marsyas: A framework for audio analysis. Organized Sound, 4(30):169– 175, 2000.
680