SUBMITTED TO IEEE TRANSACTIONS ON MULTIMEDIA
1
Sound-Event Classification Using Robust Texture Features for Robot Hearing Jianfeng Ren, Member, IEEE, Xudong Jiang, Senior Member, IEEE, Junsong Yuan, Senior Member, IEEE, and Nadia Magnenat-Thalmann
Abstract—Sound-event classification often utilizes timefrequency analysis, which produces an image-like spectrogram. Recent approaches such as spectrogram image features and subband-power-distribution image features extract the image local statistics such as mean and variance from the spectrogram. They have demonstrated good performance. However, we argue that such simple image statistics cannot well capture the complex texture details of the spectrogram. Thus, we propose to extract the local binary pattern (LBP) from the logarithm of the Gammatone-like spectrogram. However, the LBP feature is sensitive to noise. After analyzing the spectrograms of sound events and the audio noise, we find that the magnitude of pixel differences, which is discarded by the LBP feature, carries important information for sound-event classification. We thus propose a multi-channel LBP feature via pixel difference quantization to improve the robustness to the audio noise. In view of the differences between spectrograms and natural images, and the reliability issues of LBP features, we propose two projectionbased LBP features to better capture the texture information of the spectrogram. To validate the proposed multi-channel projection-based LBP features for robot hearing, we have built a new sound-event classification database, the NTU-SEC database, in the context of social interaction between human and robot. It is publicly available to promote research on sound-event classification in a social context. The proposed approaches are compared with the state of the art on the RWCP database and the NTU-SEC database. They consistently demonstrate superior performance under various noise conditions. Index Terms—Sound-Event Classification, Multi-Channel Local Binary Pattern, Band-Dependent Local Binary Pattern, BandIndependent Local Binary Pattern, Robot Hearing
I. I NTRODUCTION OUND-event classification has recently gained the interest of the research community. Different from speech recognition, which focuses on the segmentation and recognition of the speech signal, sound-event classification mainly focuses on classifying environmental sounds into one of a set of known classes [1], [2]. It has many applications, such as acoustic surveillance [3], animal sound classification [4], environmental sound classification [5]–[7], and machine hearing [8], [9]. In this paper, we address the challenges of sound-event classification for robot hearing in a noisy environment. More precisely,
S
Copyright (c) 2013 IEEE. Personal use of this material is permitted. However, permission to use this material for any other purposes must be obtained from the IEEE by sending a request to
[email protected]. J. Ren, X.D. Jiang and J. Yuan are with School of Electrical & Electronics Engineering, Nanyang Technological University, 50 Nanyang Avenue, Singapore 639798. (e-mail: jfren, exdjiang,
[email protected]) N. Thalmann is with Institute of Media Innovation, Nanyang Technological University, 50 Nanyang Drive, Singapore 637553. (e-mail:
[email protected]).
we aim to endow the robot with the ability to understand surrounding sound events, towards the objective of facilitating natural communication between human and robot. In the early work of sound-event classification, many approaches utilized traditional speech-recognition techniques, such as the hidden Markov model (HMM) on mel-frequency cepstral coefficients (MFCC) [10]–[12]. Later on, many other features were proposed as a supplement to MFCC features, e.g. MPEG-7 audio features [13], matching pursuit features [5], time-frequency-matrix features by non-negative matrix decomposition [6] and spectro-temporal signature [14]. Timefrequency representations such as short-time discrete Fourier transform (STFT), mel-frequency cepstrum [15] and Gabor spectrogram [16] well capture the power distribution of sound events, and hence are often used in sound-event classification. Time-frequency representations such as the spectrogram of sound events provide rich visual information that enables a person to visually identify the sound class. Many recent approaches [1], [2], [17]–[25] thus treat the spectrogram as a texture image and utilize image-processing techniques on the spectrogram for sound-event classification. However, the spectrogram is not a natural image, but a synthetic image, which represents the power distribution of a signal in different frequencies at different time instances. The differences between the spectrogram and natural images are not fully explored in existing approaches and hence those approaches cannot well capture the texture information of the spectrogram. We thus perform texture analysis on the spectrogram and find that the logarithm of the Gammatone-like spectrogram provides richer texture information than other spectrograms. In view of the unique image properties of the spectrogram, we find that the local binary pattern is a better texture descriptor for the spectrogram than the shift-invariant feature transform (SIFT) [26] or the histogram of oriented gradients (HOG) [27]. The LBP feature captures the micro-patterns of the spectrogram by encoding the signs of the intensity differences between a pixel and its neighbors. The LBP feature and its variants have been widely used in many image-classification applications [22], [25], [28]–[46]. Typically, the LBP feature extracted from the spectrogram has been used for music genre classification in [22] and for soundevent classification in [25]. However, the LBP feature is known to be sensitive to noise [35]. A small image noise may alter the LBP bit from 0 to 1 or vice versa. Furthermore, to solve the problem of illumination variations in natural images, the LBP feature only makes use of the sign of pixel differences, but discards the magnitude. After analyzing the spectrograms
SUBMITTED TO IEEE TRANSACTIONS ON MULTIMEDIA
of sound events and the audio noise, we find that different from natural images, the magnitude of pixel differences is also useful for sound-event classification. We thus propose a multichannel LBP feature via pixel difference quantization. The performance of the LBP feature is affected by its reliability issues. The problem mainly arises from having insufficient elements to construct the LBP histogram. Computing patch-wise LBPs leads to fewer elements in the histogram of each patch. In addition, the occurrence frequencies of different patterns vary largely, and hence the occurrence frequencies of rare patterns cannot be reliably estimated. We thus propose two projection-based LBP features with improved reliability. As pointed out in [47], [48], principal component analysis (PCA) can be used not only for dimension reduction, but more importantly to remove the dimensions that are harmful to reliable classification. Thus, PCA is applied on the LBP histogram of each patch to remove unreliable information. In many applications, the sound events occur in the presence of a wide variety of challenging noise conditions, where the signal-to-noise ratio (SNR) may even approach -5 dB. The noise significantly distorts the spectrogram, which imposes a great challenge for sound-event classification. In a recent approach [2], a noise mask is estimated and used to discard the distorted image regions of the spectrogram. However, the useful information in the distorted image regions is discarded as well. Thus, we use the whole spectrogram to extract the proposed multi-channel projection-based LBP features and use a linear support vector machine (SVM) for classification. By including the training samples injected with various types of noise at random noise levels, we expect that the proposed approaches could work well under different noise conditions. We apply the proposed approaches on robot hearing, and enable the robot with the capability of understanding environmental sounds. To the best of our knowledge, no existing database is designed to evaluate sound-event classification in a social context. We thus build a new dataset called NTU-SEC, which consists of 10 classes of sounds for robot hearing with thousands of samples. The proposed approaches are compared with the state of the art on the RWCP database [49] and the NTU-SEC database. The proposed approaches consistently and significantly outperform others. The contributions of this paper are four-fold: 1) We conduct image texture analysis on various spectrograms and find that the local binary pattern extracted from the logarithm of the Gammatone-like spectrogram better captures the texture details of a sound event. 2) To better characterize the spectrogram and improve the robustness to the audio noise, we propose a multi-channel LBP feature via pixel difference quantization. 3) To tackle the reliability issues of the LBP histogram, we propose two projection-based LBP features that better remove the unreliable feature dimensions. 4) The proposed approaches are integrated with a humanoid robot so that it can understand surrounding sounds.
2
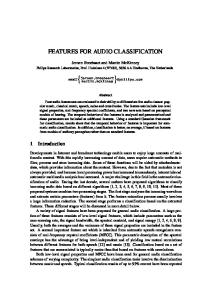
II. T HE P ROPOSED M ULTI -C HANNEL P ROJECTION - BASED LBP F EATURES FOR THE S PECTROGRAM A. Texture Analysis of the Spectrogram Time-frequency analysis has often been applied on the audio signal for sound-event classification, such as the short-time Fourier transform and its logarithm, and the Gammatonelike spectrogram and its logarithm [1], [2]. Fig. 1 shows examples of these spectrograms. The difference between the STFT spectrogram and the Gammatone-like spectrogram is that in the Gammatone-like spectrogram, the frequency bands are equally spaced on the equivalent rectangular bandwidth (ERB) scale, which approximates the human auditory system’s response more closely than the linearly-spaced frequency bands used in the STFT spectrogram. Time-frequency representations provide rich texture information. An experienced researcher can easily identify different sound events based on the spectrograms. Among these spectrograms, the logarithm of the Gammatone-like spectrogram (LGS) visually provides more texture information. Thus, we conduct texture analysis on the LGS.
(a)
(b)
(c)
(d)
Fig. 1. Spectrograms of a phone ring tone, where the horizontal axis is the time index and the vertical axis is the frequency index. The STFT spectrogram and its logarithm are shown in (a) and (b), respectively. The Gammatone-like spectrogram and its logarithm are shown in (c) and (d), respectively. By taking the logarithm, the low-amplitude frequency components are emphasized, and hence more small texture details are visible. Comparing (b) and (d), the signal energy is concentrated in (d), whereas in (b) the energy is scattered in the background noise.
More specifically, we use a bank of 50 filters for the Gammatone-like spectrogram, with center frequencies equally spaced between 100 Hz and 8000 Hz on the ERB scale, the same as in [1], [2]. The Gammatone-like spectrogram is denoted as S(f, t), where f is the center frequency and t is the time index. It is obtained using the auditory toolbox [50]. 1 To enhance the low-power elements and hence obtain more 1 Available
at http://labrosa.ee.columbia.edu/matlab/gammatonegram/.
SUBMITTED TO IEEE TRANSACTIONS ON MULTIMEDIA
3
texture information, we take the logarithm of the spectrogram: G(f, t) = log S(f, t).
(1)
To obtain a gray-level image normalized in [0, 1], G(f, t) is normalized as: G(f, t) − minf,t G(f, t) I(f, t) = . (2) maxf,t G(f, t) − minf,t G(f, t) We call this gray-level image the logarithm of the Gammatonelike spectrogram. B. LBP Features for the Spectrogram Many feature descriptors have been proposed for image analysis, such as SIFT [26], HOG [27] and LBP [28]. Among these, the LBP feature is one of the simplest and the most effective features. The spectrogram is a synthesized image, not a natural image. There are many differences between a spectrogram and a natural image. Visually, a spectrogram does not have the following properties that we usually have for a natural image: Smoothness: The natural image is smooth and its intensities change gradually, whereas the neighboring pixels of the spectrogram may differ significantly. These pixels represent the power distribution across frequencies and time instances, and the neighboring frequencies may have very different power distributions. Translation, scaling and rotation: The objects in natural images may appear at different locations, in different scales and in different poses. The spectrogram does not have such variations except translation along the time axis. Thus SIFT, which extracts scale-invariant features, may not be the best choice for spectrograms. Micro-structure: Image micro-structures such as edges, spots and corners commonly appear in a natural image, but may not appear in the spectrogram. HOG features, which mainly capture edge information, may not be suitable for the spectrogram. The LBP feature has some advantages over others for spectrograms. 1) The LBP feature is robust to monotonic image variations of the spectrogram, as it encodes the signs of relative intensities. 2) Besides common image micro-structures such as edges and spots, it can capture other micro-structures by encoding the signs of the relative intensities of a pixel to its neighbors, which is not feasible for HOG features. Therefore, we use the LBP feature for texture analysis of the spectrogram. Now we briefly describe how to extract the LBP features. The LBP code is first derived for every pixel of an image. Formally, denote the intensity of a pixel as i, and the intensity of its p-th neighbor as ip , where p = 1, 2, . . . , P , and P is the number of neighbors. The distance between ip and i is denoted as R. Then, LBPP,R [28] encodes the pixel difference zp = ip − i between ip and i at the distance of R. Each LBP bit is encoded as: ( 1 if zp ≥ 0, bp = (3) 0 if zp < 0. −−−−−−−−−→ Those LBP bits form the LBP code bP bP −1 . . . b1 . Then, the histogram of LBP codes is used as the feature descriptor.
The dimension of LBPP,R is 2P . LBP features using more neighbors can capture more information on image microstructures, but at the cost of high dimensionality. The radius R determines the scale of micro-structures captured by LBP features. After considering the computational complexity and the image resolution of the spectrogram, we choose LBP8,1 as the LBP feature descriptor. An illustrative example is shown in Fig. 2. The center pixel is compared with 8 nearest neighbors, −−−−−−→ and encoded as 11000111, which is decimal number 199. In such a way, each pixel is encoded as an LBP code, and the image is encoded as an LBP image. The LBP histogram is then built from the LBP image. In Fig. 2, P = 8, and the number of histogram bins is 2P = 256.
Fig. 2. Illustration of LBP encoding scheme. A pixel is compared to its neighbors and an LBP code is generated for each pixel. The histogram of these codes is then used as the LBP feature.
C. The Proposed Multi-Channel LBP Features for the Spectrogram via Pixel Difference Quantization The pixel intensities of natural images may change greatly due to illumination variations. Thus, the pixel difference zp also has large variation. To improve the robustness to illumination variations, the LBP feature only utilizes the sign of the pixel difference, discarding its magnitude. Different from natural images, the spectrogram, which represents the energy distribution across different frequencies and different time instances, does not have the illumination variations, but mainly the variations caused by the audio noise. The magnitude of the pixel difference carries important information to characterize the spectrogram. Therefore, we make use of both the sign and the magnitude of the pixel difference to extract the LBP features from the spectrogram. Audio noise may significantly change the spectrograms. Fig. 3(a) and (b) show the spectrograms of a clean signal and a noisy signal with 20 dB SNR, respectively. The injected noise is speech noise from the NOISEX92 database [51]. We can see that even such a small audio noise can greatly alter the spectrogram, as shown in Fig. 3(b). The LBP feature is known sensitive to image noise [35]. A small amount of image noise may change the LBP bit from 0 to 1 or vice-versa. Fig. 3(c) and (d) show the LBP images of the spectrograms in Fig. 3(a) and (b), respectively. Different from the LBP image shown in Fig. 3(c) that captures the textures of the spectrogram for the clean signal, the LBP image shown in Fig. 3(d) captures the fine textures of the audio noise. From Fig. 3(c) and (d), we can see that the audio noise mainly changes the regions of the LBP image in which the
SUBMITTED TO IEEE TRANSACTIONS ON MULTIMEDIA
(a) Spectrogram, clean signal
(b) Spectrogram, 20 dB SNR
(c) LBP image, clean signal
(d) LBP image, 20 dB SNR
Fig. 3. Spectrograms of a phone ring tone and the ring tone injected with the speech noise at 20 dB of SNR are shown in (a) and (b), respectively. Even such a small audio noise can change the appearance of the spectrogram significantly. The corresponding LBP images are shown in (c) and (d), respectively. The LBP is sensitive to noise. It captures the fine textures of the audio noise, as shown in (d).
pixel differences are small, but unlikely change the regions in which the pixel differences are large. For traditional LBP features, the noise can easily change the sign of the small pixel differences, and hence change the LBP bits from 0 to 1 or vice versa, because of thresholding at 0. But, the noise is unlikely to change the encoding of large pixel differences. On the other hand, if we apply a large threshold, the noise may easily change the encoding of the pixel differences around the large threshold, but not the pixel differences far away from it, e.g. the small pixel differences. By utilizing different thresholds, we could capture the information residing in different ranges of the pixel differences that is robust to the audio noise. To capture both the sign and the magnitude of the pixel differences, we propose a multi-channel LBP (MCLBP) feature that quantizes the pixel differences using multiple thresholds. Formally, instead of thresholding the pixel differences at 0 as in Eq. (3), we threshold them at Ti , i.e. ( 1 if zp ≥ Ti , i bp = (4) 0 if zp < Ti . where bip is the p-th bit of an LBP code in channel i and Ti is the user-defined threshold for channel i. The LBP features whose pixel differences are thresholded at Ti are treated as the i-th channel of the MCLBP feature. By choosing different thresholds, we obtain different channels of the MCLBP feature. For simplicity, the thresholds are equally spaced in [−N t, N t], where N is a positive integer and t is a small positive constant, i.e. they are {−N t, . . . , −t, 0, t, . . . , N t}. We thus have C = 2N + 1 channels. Now we briefly discuss the selection of the parameters {t, N }. A small t will cause the LBP features of two successive channels to be highly correlated, whereas a large t may result in fewer channels and coarser quantization of the pixel
4
differences. A small N may not sufficiently cover the whole dynamic range of the pixel differences, whereas an excessively large N may result in a large feature vector. In addition, the performance gain brought by more channels becomes small with a larger N . The optimal values of {t, N } are taskdependent. Based on the preliminary experimental results, we find t = 0.02 is a good choice for the LGS image normalized in [0, 1]. We choose N ≤ 5 in this paper, and hence evaluate up to 11 channels for the proposed MCLBP feature. Fig. 4 shows the LBP images for the clean signal and the noisy signal with 0 dB SNR for Ti = −0.1, −0.04, 0, 0.04 and 0.1. By using different thresholds, we capture the information residing in different dynamic ranges of the pixel differences. At the thresholds of larger magnitude, the LBP images of the noisy signal are more similar to those of the clean signal, as shown in Fig. 4. Thus, the LBP features extracted using the thresholds of larger magnitude are more robust to the audio noise. However, the fine textures of the clean signal in these channels are suppressed as well, which results in information loss. At the thresholds of smaller magnitude, we capture fine textures of the sound events, but may capture those of the audio noise as well. We thus make use of all these LBP features obtained at different thresholds together, forming the proposed multi-channel LBP feature. D. The Proposed Projection-Based LBP Features for the Spectrogram For each LBP channel, we divide the LBP image into patches and extract one LBP histogram from each patch, to capture the image characteristics of different patches. It is difficult to align the audio signal along the time axis, as the audio signal may have large variations in time. Thus, we divide the spectrogram along the frequency axis so that the extracted LBP histogram is invariant to time. Those bandwise histograms are then concatenated to form the final feature vector. The resulting feature dimensionality is often very high, and hence principal component analysis is often applied to reduce the feature dimension in the literature [34], [52]–[57]. LBP features suffer from reliability issues, mainly due to the limited number of pixels of an image and the fact that the occurrence frequencies of different LBP codes vary significantly in the LBP histogram [28], [35]. The uneven distribution of LBP codes causes unreliable estimation of the LBP histogram. Especially, those bins corresponding to infrequent patterns are poorly estimated. The reliability problem becomes more pronounced for the band-wise LBP histogram due to the partitioning of the pixels by band. The uniform LBP [28] is often extracted as the feature descriptor to address this issue. An LBP code is a uniform code if it has at most two circularly 0 to 1 or 1 to 0 transitions; otherwise it is a non-uniform code. The uniform codes represent image micro-structures such as edges, spots and corners, and the non-uniform codes mainly represent noisy patterns. Most LBP codes in a natural image are uniform codes. The noisy and unreliable non-uniform codes are grouped into one bin when building the histogram in order to suppress the unreliable information. The uniform LBP captures the image microstructures of a natural image well, but it does not capture the
SUBMITTED TO IEEE TRANSACTIONS ON MULTIMEDIA
5
(a) Clean, Ti = −0.1
(b) Clean, Ti = −0.04
(c) Clean, Ti = 0
(d) Clean, Ti = 0.04
(e) Clean, Ti = 0.1
(f) 0 dB SNR, Ti = −0.1
(g) 0 dB SNR, Ti = −0.04
(h) 0 dB SNR, Ti = 0
(i) 0 dB SNR, Ti = 0.04
(j) 0 dB SNR, Ti = 0.1
Fig. 4. The LBP images of the clean signal thresholded at Ti = −0.1, −0.04, 0, 0.04 and 0.1 are shown in (a) - (e), respectively. The corresponding LBP images of the signal injected with the speech noise at 0 dB of SNR are shown in (f) - (j), respectively. The LBP images obtained using a negative threshold are inverted for better viewing. By using different thresholds, the pixel differences of different magnitudes are highlighted. In addition, by using a threshold of large magnitude, the texture details of the noise signal are greatly suppressed, but the texture details of the true signal are preserved.
image characteristics of the spectrogram well. As illustrated in Section II-B, the spectrogram is very different from a natural image. It has a large portion of non-uniform codes, and hence the uniform LBP is not suitable for the spectrogram. To address this problem, we propose two projection-based LBP features. As pointed out in [47], [48], PCA not only reduces the feature dimensionality, but more importantly removes unreliable feature dimensions. We thus apply PCA on the scatter matrix of the LBP histogram of each patch. The proposed projection-based LBP features can be derived in a band-independent manner or a band-dependent manner, as described below. 1) The Proposed Band-Independent LBP Feature: The block diagram to build the band-independent projection-based LBP (BILBP) is shown in Fig. 5. The LBP image in Fig. 2 is divided into 5 bands, and one LBP histogram is extracted from each band. One scatter matrix is built for each band and the scatter matrices of all bands are summed to one scatter matrix and a unified projection matrix P is derived for all bands. More specifically, denote hi,j,k ∈ R256 as the histogram of the i-th band of the j-th image of the k-th class. The scatter matrix of the i-th band is obtained as: X Σi = (hi,j,k − µi )(hi,j,k − µi )T , (5) j,k
where µi = N1 j,k hi,j,k is the mean histogram of the i-th band and N is the total number of training samples. The total scatter matrix is obtained as: X Σi . (6) Σ= P
i
T
PCA is then applied on Σ, i.e. Σ = ΦΛΦ . Eigenvectors Φm corresponding to the m largest eigenvalues are selected, and hi,j,k is projected to the feature space as fi,j,k = ΦTm (hi,j,k − µi ). The Mahanalobis distance is shown to perform well on classification [47], [48]. We normalize the feature vector by
Fig. 5. The block diagram of building band-independent projection-based LBP. All covariance matrices of different bands are summed up and one unified projection matrix P is obtained for all bands.
the inverse of the within-class scatter matrix Σfw . XXX (fi,j,k − µfi,k )(fi,j,k − µfi,k )T , Σfw = i
k
(7)
j
P where µfi,k = N1k j fi,j,k is the mean feature vector of the i-th band of the k-th class in the feature space and Nk is the number of samples in the k-th class. After performing PCA on Σfw , i.e. Σfw = Φw Λw ΦTw , the normalized feature vector for BILBP is obtained as: gi,j,k = (Φm Φw Λ−0.5 )T (hi,j,k − µi ). w
(8)
Linear discriminant analysis is then applied to further reduce the dimensionality. The between-class scatter matrix in the reduced feature space Rm is calculated as: XX g Σgb = (µi,k − µgi )(µgi,k − µgi )T , (9) i
k
SUBMITTED TO IEEE TRANSACTIONS ON MULTIMEDIA
6
P P where µgi,k = N1k j gi,j,k , µgi = 1c k µgi,k and c is the number of classes. After applying PCA on Σgb , i.e. Σgb = Φb Λb ΦTb , the first t eigenvectors Φb,t corresponding to the t leading eigenvalues are selected and the final feature vector is obtained as: ˆi,j,k = (Φm Φw Λ−0.5 g Φb,t )T (hi,j,k − µi ). w
(10)
2) The Proposed Band-dependent LBP Feature: In BILBP, the scatter matrices of different bands are summed up, and hence the resulting scatter matrix can be better estimated. However, band locality is sacrificed as one projection matrix is built for all bands. In the spectrogram, we can observe that the image characteristics of the spectrogram differ significantly from band to band. To preserve the band locality, a banddependent projection-based LBP (BDLBP) is proposed, i.e. one projection matrix is built for each band. The block diagram to extract BDLBP is shown in Fig. 6.
Uniform patterns represent the micro-structures of a natural image and non-uniform patterns represent noisy patterns. The uniform LBP can capture the image characteristics of a natural image well, but not those of a spectrogram. In addition, useful patterns and noisy patterns are different for different applications. Compared with the ULBP, the proposed projectionbased approaches can better remove the unreliable information of the LBP histogram. The proposed approaches are also different from the LBP feature used in [25]. To highlight the significant local patterns, some fixed local statistics of individual image such as the standard derivation of the neighborhood were used as the weight to the LBP histogram in [25]. In the proposed approaches, the weights of different histogram bins are learned from the whole training data. Compared to PCA on the concatenated LBP features (CLBP) [52]–[54], [56], [57], the scatter matrix is better estimated in the proposed approaches. Assume each image is divided into I bands, we then have in total N samples to estimate the scatter matrix of 256I × 256I for C-LBP, N I and N samples for the scatter matrix of size 256 × 256 for BILBP and BDLBP, respectively. Many more samples are available to estimate smaller scatter matrices in the proposed BILBP and BDLBP features. Thus, the scatter matrices of BILBP and BDLBP can be better estimated. Compared with BILBP, the scatter matrix of BDLBP is constructed from fewer samples, and hence is less reliable. The advantages of BDLBP are that the band locality is preserved and the projection matrix can better capture the intrinsic properties of each band. E. Summary of the Proposed Feature-Extraction Process
Fig. 6. The block diagram of band-dependent projection-based LBP. To better capture the intrinsic image characteristics of different bands, one projection matrix is built for each band.
PCA is then applied on the scatter matrix Σi of the i-th band, i.e. Σi = Φi Λi ΦTi . We select m eigenvectors Φi,m corresponding to the m largest eigenvalues and project the histogram of the i-th band hi,j,k to the feature space as ˜fi,j,k = ΦT (hi,j,k − µi ). The remaining procedures are i,m similar to those for BILBP. Finally, one projection matrix is built for each band. BDLBP can better capture the intrinsic image characteristics of different patches when the image characteristics of various bands are significantly different. BDLBP also preserves more image locality as one unique projection matrix is derived for each band. 3) Relations to Other Approaches: The proposed approaches are different from the uniform LBP (ULBP) [28] used in music genre classification [22]. The ULBP in [22] uses the fixed 59 uniform bins (features), whereas the proposed BILBP/BDLBP extracts m features from the linear combinations of the full 256 bins learned from the training data.
The proposed feature-extraction process is summarized in Fig. 7. We first perform time-frequency analysis on the audio signal and derive the logarithm of the Gammatone-like spectrogram (LGS). As shown in Fig. 7, LGS is a synthetic gray-level image. To capture different dynamic ranges of the pixel differences of the LGS image, we derive a multichannel LBP features via pixel difference quantization. Then, the LBP image of each channel is divided into I bands along the frequency axis. One LBP histogram is extracted from each band. We then extract BILBP or BDLBP according to Fig. 5 or Fig. 6, respectively. Finally, we concatenate the BILBP/BDLBP features of all bands and all channels, forming the final feature vector of length tIC. We call the proposed approaches multi-channel BILBP (MC-BILBP) and multi-channel BDLBP (MC-BDLBP), respectively. We use the linear support vector machine as the classifier. Existing image-based methods often rely on basic local image statistics such as mean and variance to capture the power distribution of the spectrogram [1], [2]. In the proposed approaches, we conduct a comprehensive texture analysis on the spectrogram in order to characterize the sound in a much more sophisticated manner. We analyze the differences between the spectrogram and natural images. The LBP feature is found to better characterize the spectrogram. To utilize more information of the pixel differences and to improve the robustness of the LBP features to audio noise, we propose
SUBMITTED TO IEEE TRANSACTIONS ON MULTIMEDIA
7
Thus, we built a new sound-event-classification database, the NTU-SEC database, to evaluate the performance of soundevent classification for robot hearing in a social context. It consists of a set of sound events when people visited Nadine’s office and interacted with Nadine. The recording environment is reverberant due to glass walls, and noisy due to air conditioning and human activities outside the office. The 10 sound categories collected are coughing, keys jiggling, object dropping, nails tapping, pen tapping, phone ringing, speech, clapping, dribbling a basketball and silence. All sounds are sampled in 16 bits at 48kHz, and recorded using an array of 8 microphones. The collected audio signals are chopped into one-second frames with no overlap, amounting to 3327 sound-event samples. 3 The number of samples in these 10 sound categories is 158, 188, 165, 219, 188, 461, 306, 442, 538 and 664, respectively. Fig. 8 shows the spectrograms of the examples from these 10 classes. This database is challenging because the spectrograms of some classes are fairly similar, e.g. coughing, nails tapping, pen tapping, clapping and dribbling a basketball. The database can be downloaded from https://sites.google.com/site/renjianfengnus/databases. Fig. 7. The block diagram of the proposed feature-extraction process. By applying different thresholds on the pixel differences, we derive a multichannel LBP feature. After applying band-wise PCA projection on the LBP features of each channel, we derive the proposed MC-BILBP and MC-BDLBP features. The feature dimension of MC-BDLBP/MC-BILBP is 200C, where C is the number of LBP channels and C ≤ 11.
to quantize the pixel differences of the spectrogram using multiple thresholds to derive a multi-channel LBP feature. We further propose BILBP and BDLBP, which better remove the unreliable feature dimensions than the uniform LBP that is widely used in natural image analysis.
IV. E XPERIMENTAL R ESULTS We conduct comparison experiments on the RWCP database [49] and the NTU-SEC database. The proposed MCBILBP and MC-BDLBP features are compared with four stateof-the-art approaches: Gabor-HMM [58], MFCC-HMM [2], [59], Spectrogram Image Feature (SIF) [1] and Subband Power Distribution Image Feature (SPD-IF) [2]. A. Experimental Setup
We incorporate the sound-event classification algorithm into a humanoid robot named Nadine, enabling Nadine to understand surrounding sound events. Additionally, we enable Nadine with many other sensor capabilities, such as face recognition, gesture recognition, hand gesture recognition, sound localization, etc. 2 In this paper, the target application of the proposed features is to enable robust sound-event classification for robot hearing in an indoor environment to facilitate a natural interaction between human and robot. The RWCP database [49] has been widely used as the benchmark database to evaluate the performance of sound-event-classification algorithms. The non-speech sounds in this database were collected in an anechoic room, including crash sounds of wood, plastic and ceramics, and other sounds such as that of coins, bells, saw, toys etc. Since the target application is robot hearing in a social setting, the RWCP database may not be suitable to evaluate the performance for such an application.
Gabor-HMM [58]: 36 Gabor features are selected using the feature-finding-neural-network approach, and classified by an HMM classifier, which uses 5 states and 6 Gaussian mixtures. Both training and testing are conducted using HTK [60]. MFCC-HMM [2], [59]: 36-dimension frame-by-frame melfrequency cepstral coefficients are extracted as features, including 12 cepstral coefficients, their deltas and accelerations. Then, MFCCs are classified by an HMM classifier. SIF [1]: Spectrogram image feature extracts image local statistics such as the first three moments from the STFT spectrogram. It is then classified by a support vector machine. SPD-IF [2]: The subband power distribution is derived from the spectrogram. Image local statistics such as mean and variance are then extracted as features, and classified by a k-nearest-neighbor classifier with Hellinger distance, where k = 5. To handle the noise, a noise mask is estimated and used to remove distorted image regions. To evaluate the effectiveness of the proposed features, we implement MFCC-SVM, SIF-SVM and SPDIF-SVM by replacing the proposed MCLBP features by MFCC features, SIF features and SPD-IF features, respectively. The remaining procedures are the same as the proposed approaches, e.g. using a linear SVM as the classifier. These three are the major competitors of the proposed approaches.
2 More information on the Nadine robot can be found at http://imi.ntu.edu. sg/BeingThereCentre/Projects/Pages/Project4.aspx
3 The object-dropping sound is not chopped due to its short duration and non-separable nature.
III. S OUND -E VENT C LASSIFICATION H EARING
FOR
ROBOT
SUBMITTED TO IEEE TRANSACTIONS ON MULTIMEDIA
(a) Coughing
(b) Keys jiggling
(c) Object dropping
(d) Nails tapping
(e) Pen tapping
(f) Phone ringing
(g) Speech
(h) Clapping
(i) Dribbling a basketball
(j) Silence
Fig. 8. Spectrograms of the sound event samples of the NTU-SEC database. The spectrograms of some classes of sound events are very similar in appearance.
In addition, the proposed approaches are compared with the following approaches to evaluate the effectiveness of each single step in constructing the proposed features: ULBP [22]: Uniform LBP features are extracted from 5 bands of the spectrogram, and classified by a linear SVM. BDLBP: Only one channel of LBP features is used, i.e. Ti = 0. The remaining procedures are the same as MC-BDLBP. BDLBP-E: All procedures are the same as BDLBP except that no Mahalanobis-distance normalization is applied as in Eq. (8). Since the distance measure is Euclidean distance if the normalization of Eq. (8) is not applied, we use BDLBP-E to denote BDLBP in Euclidean distance space. For the proposed MC-BILBP and MC-BDLBP, the following parameters are determined based on the initial experimental results. As the number of frequency bins is 50, we divide the spectrogram into I = 5 bands. A larger I will result in fewer elements in computing the LBP histogram so that the histogram cannot be estimated reliably, whereas a smaller I will result in the loss of locality. The optimal I depends on the number of frequency bins used in the spectrogram. The feature
8
dimension of each patch after PCA is chosen as m = 40. As this work does not aim at reducing the computational cost of the classifier, the maximal number of features extracted by LDA is applied in all experiments. The cost parameter for the linear SVM is set as 40. To validate the robustness of the proposed approaches to the audio noise, we conduct experiments under four noise levels besides clean condition, i.e. 20, 10, 0 and -5 dB SNR in four noise environments: “Speech Babble”, “Destroyer Control Room”, “Factory Floor 1” and “Jet Cockpit 1”, obtained from the NOISEX92 database [51]. For every training/testing sample, we randomly chop a segment of the noise audio and inject it into the audio signal. The same testing conditions were used previously in [1], [2]. In the literature, the audio noise was handled differently for different approaches. For SIF [1] and SPD-IF [2], only the clean samples were used in training. The noisy testing samples were handled by estimating a noise mask to mask off the distorted image regions. The remaining image regions of the testing sample can then be directly compared to those of the training samples. For Gabor-HMM [58] and MFCCHMM [59], besides the clean samples, those at 10 dB SNR were also used in training to capture the noise characteristics. In the proposed approaches, it is difficult to isolate the feature dimensions that are contaminated by noise. Thus, the proposed approaches extract features from the training samples injected with various types of noise at random noise levels in order to well model the audio events under various noise conditions. The noise levels of the training samples, the SNRs, are randomly sampled from a uniform distribution in the range of [−5, 25] dB. This range covers most of the noise levels for sound-event classification. Regarding the noise type, we use two different setups. In the first setup, we assume that we know the possible noise environments in which the sound-event classifier will be applied, but do not know which one is in the current testing samples. This is a reasonable assumption used for many classification problems elsewhere. The sound-event classifier always has a limited number of working environments in which the classifier is designed to work. We thus use the clean samples and those injected with 10 representative types of noise in training, i.e. “destroyer”, “factory”, “jet”, “leopard”, “m109”, “machinegun”, “pink”, “speech”, “volvo” and “white” taken from the NOISEX92 database. The same trained classifier is used for 4 testing noise types and 5 testing noise levels. In the second setup, we purposely exclude the noise type of the testing samples from training, and use the other nine noise types and the clean samples in training. In such a way, the noise levels and the noise types of the testing samples are both different from those of the training samples. This test setup is comparable to the setup in [2]. The compared approaches such as MFCC-SVM, SIF-SVM, SPDIF-SVM, ULBP, DBLBP, BDLBP-E and MC-BDLBP-5, use the same test setup as the proposed approaches. B. Results on the RWCP database in Four Noise Environments The RWCP database [49] comprises 9722 sound event files from 105 different classes. The sound files have a high SNR,
SUBMITTED TO IEEE TRANSACTIONS ON MULTIMEDIA
and each contains an isolated sound event, with some silence before and after the sound. It has a wide range of sound-event types, including wooden, metal and china impacts, friction sounds, and others such as bells, phones ringing, and whistles. Many of them have a sparse time-frequency spectrogram, with most of the power concentrated in some frequencies. We use the same database partition as in [1], [2]. A total of 50 sound-event classes are selected from the RWCP database. For each trial, 50 sound events are randomly selected for training and 30 for testing from each class. There are in total 2500 and 1500 sound events for training and testing, respectively. We repeat the experiments 5 times. 1) Training Using 10 Representative Noise Types: We inject the training samples with random noise levels, i.e. the SNRs are uniformly sampled from [−5, 25] dB in 10 noise environments. Including clean samples, we generate the training set of 2500 × 11 = 27500 samples. The comparison results over 5 trials are shown in Table I. We first compare the proposed projection-based BDLBP feature against the ULBP feature. The proposed BDLBP feature consistently outperforms the ULBP feature under all testing conditions. On average, it achieves performance gain about 6%. We then evaluate the effectiveness of Mahalanobisdistance normalization in Eq. (8) by comparing BDLBP with BDLBP-E. In most testing conditions, BDLBP outperforms BDLBP-E. On average, with Mahanalobis-distance normalization, BDLBP achieves performance gain of 0.58% over BDLBP-E. Now, we evaluate the effectiveness of multichannel LBP features. BDLBP utilizes a single channel of MC-BDLBP features only. It achieves an average recognition rate of 97.11%. By utilizing 5 channels (with threshold −2t, t, 0, t and 2t, respectively), the proposed MC-BDLBP-5 improves the recognition rate to 99.21%. By further increasing the number of channels to 11, the proposed MC-BDLBP consistently improves the performance over MC-BDLBP-5 under all testing conditions. However, the performance gain becomes marginal, i.e. 0.24% on average. Among all the competitors, SPDIF-SVM achieves the highest average recognition rate of 97.66%. The proposed MCBDLBP and MC-BILBP consistently outperform SPDIF-SVM under all testing conditions. The performance gain is significant when the noise level is high, e.g. the improvement is about 10% for factory noise at -5 dB SNR. On average, the proposed MC-BDLBP and MC-BILBP improve the recognition rate from 97.66% to 99.45% and 99.36%, respectively. This demonstrates the effectiveness of the proposed approaches. 2) Training Excluding the Testing Noise Type: We purposely exclude the testing noise type from training, and generate a training set of 25000 samples, including the clean training samples and the samples injected with 9 other types of noise at random noise levels. The results for the proposed approaches under this setting are directly comparable to the published results in [2]. The recognition rates are shown in Table II, where those of Gabor-HMM [58], MFCC-HMM [59], SIF [1] and SPD-IF [2] are given by [2]. We also include the results for MFCC-SVM, SIF-SVM and SPDIF-SVM for comparison. AVG4 denotes the average performance over clean, 20, 10 and 0 dB SNR, which is used as the benchmark performance in [2].
9
AVG5 denotes the average performance over all 5 testing noise levels, including -5 dB SNR. TABLE II C OMPARISON WITH THE STATE OF THE ART AT DIFFERENT NOISE LEVELS ON THE RWCP DATABASE . Method GaborHMM [58] MFCCHMM [59] MFCC-SVM SIF [1] SIF-SVM SPD-IF [2] SPDIF-SVM MC-BDLBP (Proposed) MC-BILBP (Proposed)
Clean 99.39
20dB 91.33
10dB 92.51
0dB 56.48
-5dB -
AVG4 AVG5 84.93 -
97.53
95.43
91.94
67.17
-
88.02
-
97.55 91.13 96.18 98.81 99.62 99.85
97.56 91.10 96.11 98.00 99.04 99.78
94.69 90.71 95.22 96.63 97.67 99.53
77.01 80.95 80.27 90.35 93.36 96.91
56.70 48.54 82.73 91.89
91.70 88.55 91.94 95.95 97.42 99.02
84.70 83.26 94.48 97.59
99.74
99.71
99.44
96.50
90.20
98.85
97.12
Compared with original MFCC-HMM [59], SIF [1] and SPD-IF [2], their corresponding MFCC-SVM, SIF-SVM and SPDIF-SVM achieve performance gain of 3.68%, 3.39% and 1.47%, respectively. This shows that the SVM classifier trained by both clean and noisy data suggested by this paper is better than the classification schemes used in [1], [2], [59]. The best published result was achieved by SPD-IF [2], an average recognition rate of 95.95% over first four noise levels. The proposed MC-BDLBP and MC-BILBP significantly improve it to 99.02% and 98.85%, respectively. Using the same classifier and the same training-testing setting, the proposed MCBDLBP and MC-BILBP achieve better performance than all other features at all 5 noise levels. The performance gain is significant when the noise level is high, e.g. the proposed MCBDLBP outperforms SPDIF-SVM by more than 9% at -5 dB SNR. On averaging over 5 noise levels, the proposed MCBDLBP outperforms SPDIF-SVM by 3.11%. This demonstrates the effectiveness of the proposed approaches, especially on handling high levels of audio noise. C. Results on the NTU-SEC database in Four Noise Environments The NTU-SEC database consists of 3327 sound events of 10 classes, and most of them are one-second sound events. We randomly choose half the samples from each class for training and the other half for testing. There are in total 1665 and 1662 sound events for training and testing, respectively. The experiments are repeated 5 times. All samples of the NTUSEC database contain noise, since the data were collected in a noisy environment, as against the anechoic room in the case of the RWCP Database. To validate the noise-robustness of the proposed approaches, we inject additional noise of 20, 10, 0 and -5 dB SNR using four types of noise: “speech”, “destroyer”, “factory” and “jet”. Since MFCC-SVM, SIFSVM and SPDIF-SVM consistently outperform their original approaches MFCC-HMM [59], SIF [1] and SPD-IF [2] on the RWCP database, we omit the results for these original approaches on the NTU-SEC database. The same as on the RWCP database, we conduct the comparison experiments on the NTU-SEC database using the following setups.
SUBMITTED TO IEEE TRANSACTIONS ON MULTIMEDIA
10
TABLE I C LASSIFICATION RATES IN PERCENTAGE FOR DIFFERENT APPROACHES UNDER DIFFERENT NOISE CONDITIONS ON THE RWCP DATABASE WHEN TRAINING USING 10 REPRESENTATIVE NOISE TYPES . Method
Clean
MFCC-SVM SIF-SVM SPDIF-SVM ULBP BDLBP-E BDLBP MC-BDLBP5 (Proposed) MC-BDLBP (Proposed) MC-BILBP (Proposed)
97.52 96.15 99.61 98.32 99.21 99.55 99.80
20dB 97.59 96.16 99.63 98.11 99.29 99.49 99.77
Speech 10dB 96.52 95.32 99.67 97.00 99.28 99.33 99.79
Noise 0dB 90.35 85.05 99.17 94.88 98.96 98.96 99.65
-5dB 79.64 57.12 92.33 90.00 97.65 97.59 99.53
20dB 97.64 96.07 99.49 94.99 99.08 99.23 99.80
Destroyer Noise 10dB 0dB -5dB 97.39 86.23 64.35 95.85 85.55 60.01 98.97 98.28 90.41 90.59 80.51 75.56 98.29 93.01 84.69 98.33 94.25 87.69 99.71 99.03 96.85
20dB 97.61 96.16 99.53 93.27 98.93 99.09 99.80
Factory 10dB 96.29 95.75 98.73 87.57 97.48 98.21 99.60
Noise 0dB 82.83 80.35 95.44 78.52 90.99 92.33 97.63
-5dB 63.09 44.96 86.36 70.09 82.37 84.51 95.20
20dB 97.73 96.20 99.51 97.64 99.33 99.52 99.80
Jet Noise 10dB 0dB 96.15 90.52 95.45 77.69 99.65 99.55 97.83 94.35 99.32 97.45 99.48 97.85 99.73 99.65
Avg
-5dB 78.49 43.25 97.96 89.85 97.65 98.19 99.51
90.12 84.28 97.66 91.20 96.53 97.11 99.21
99.87 99.81 99.80 99.72 99.72
99.85 99.80 99.52 97.91
99.89 99.79 98.48 96.25
99.87 99.77 99.76 99.61
99.45
99.75 99.84 99.71 99.64 99.57
99.75 99.69 99.17 97.72
99.73 99.60 98.96 96.31
99.72 99.65 99.64 99.49
99.36
TABLE III C LASSIFICATION RATES IN PERCENTAGE UNDER DIFFERENT NOISE CONDITIONS ON THE NTU-SEC DATABASE WHEN TRAINING USING 10 NOISE TYPES . Speech 10dB 82.21 68.78 87.98 95.03
Noise 0dB 63.84 49.12 81.25 91.56
Method
“Clean”
MFCC-SVM SIF-SVM SPDIF-SVM MC-BDLBP (Proposed) MC-BILBP (Proposed)
82.71 67.59 90.64 96.29
20dB 82.36 67.91 90.75 96.15
96.10
95.98 94.93 91.74 83.48
-5dB 46.33 25.94 70.79 82.97
20dB 82.59 67.88 90.30 95.86
Destroyer Noise 10dB 0dB -5dB 81.65 75.82 67.42 68.77 47.40 27.65 88.56 83.54 73.50 94.72 90.37 81.87
95.63 94.51 89.52 80.41
1) Training Using 10 Representative Noise Types: We generate the training set of 1665 × 11 = 18315 samples under this setup. The comparison results over 5 trials are shown in Table III. On the NTU-SEC database, the proposed MC-BDLBP and MC-BILBP significantly outperform all the compared approaches at all noise conditions. The performance gain is more significant for larger noise, e.g. For factory noise at -5 dB SNR, the proposed approaches improve the recognition rate of SPDIF-SVM by more than 14%. On average, the proposed approaches significantly outperform SPDIF-SVM by about 8%. This demonstrates the superior performance of the proposed approaches on the NTU-SEC database compared with the state of the art. The proposed multi-channel LBP achieves better performance because it captures the information residing in different dynamic ranges of the pixel differences by using different thresholds, and channels that use the thresholds of larger magnitude are more robust to noise, as shown in Fig. 4. 2) Training Excluding the Testing Noise Type: We generate the training set of 1665 × 10 = 16650 samples under this setup. The comparison results are shown in Table IV. The proposed approaches consistently and significantly outperform all compared approaches at all noise levels. Compared with SPDIF-SVM, the proposed MC-BDLBP and MC-BILBP improve the average classification rate from 76.66% to 83.92% and 83.73%, respectively. A demo that integrates the proposed sound-event classification into a humanoid robot can be found at https://www. youtube.com/watch?v=nXv6B8SCFzk. In this demo, the user interacts with the robot named as Nadine, and Nadine can understand surrounding sound events, and respond accordingly.
20dB 82.54 67.76 89.55 95.80
Factory 10dB 80.81 68.30 84.67 95.17
Noise 0dB 65.29 40.49 75.64 88.19
-5dB 52.60 24.38 64.73 79.09
96.04 94.92 88.00 79.16
20dB 82.36 67.10 90.66 95.93
Jet Noise 10dB 0dB 81.26 78.42 67.82 55.44 89.66 84.02 95.39 93.39
Avg
-5dB 74.50 32.56 76.97 89.17
75.54 55.89 84.26 92.29
96.06 95.45 93.23 89.04
92.13
TABLE IV C OMPARISON WITH THE STATE OF THE ART ON THE NTU-SEC DATABASE WHEN TRAINING EXCLUDING THE TESTING NOISE TYPE . Method MFCC-SVM SIF-SVM SPDIF-SVM MC-BDLBP (Proposed) MC-BILBP (Proposed)
“Clean” 82.93 67.77 90.85 96.32
20dB 82.63 67.87 89.94 95.07
10dB 79.49 68.03 82.59 89.03
0dB 61.69 43.55 64.30 74.30
-5dB 54.15 26.41 55.62 64.88
AVG 72.18 54.73 76.66 83.92
96.18
94.20
86.89
74.65
66.73
83.73
V. C ONCLUSION In this paper, we address the challenges of sound-event classification in a noisy environment. Time-frequency analysis has been widely used in sound-event classification. We conduct texture analysis on various spectrograms and find that the logarithm of the Gammatone-like spectrogram is most suitable for sound texture analysis. We analyze the differences between the spectrogram and the natural image, and find that LBP features can better capture the texture information of the spectrogram than other features such as SIFT or HOG. To make use of both the sign and the magnitude of the pixel differences and to improve the robustness of the LBP features to audio noise, we propose a multi-channel LBP feature for the spectrogram via pixel difference quantization. To address the reliability issues of the LBP features, and to capture the micro-structures of the spectrogram that cannot be well captured by the uniform LBP, we propose two projection-based LBP features: BILBP and BDLBP. The proposed MC-BILBP and MC-BDLBP are validated on the RWCP database and the NTU-SEC database, which shows significant performance enhancement compared with the state-of-the-art approaches.
SUBMITTED TO IEEE TRANSACTIONS ON MULTIMEDIA
ACKNOWLEDGMENT This research is supported in part by the Singapore National Research Foundation under its International Research Centre Singapore Funding Initiative and administered by the IDM Programme Office, and in part by Singapore Future Systems and Technology Directorate (FSTD) under project reference: MINDEF-NTU-DIRP/2014/01. R EFERENCES [1] J. Dennis, H. Tran, and H. Li, “Spectrogram image feature for sound event classification in mismatched conditions,” IEEE Signal Process. Lett., vol. 18, no. 2, pp. 130–133, 2011. [2] J. Dennis, H. Tran, and E. Chng, “Image feature representation of the subband power distribution for robust sound event classification,” IEEE Trans. Audio, Speech, Language Process., vol. 21, no. 2, pp. 367–377, 2013. [3] L. Gerosa, G. Valenzise, M. Tagliasacchi, F. Antonacci, and A. Sarti, “Scream and gunshot detection in noisy environments,” in EUSIPCO, 2007. [4] F. Weninger and B. Schuller, “Audio recognition in the wild: Static and dynamic classification on a real-world database of animal vocalizations,” in ICASSP, 2011, pp. 337–340. [5] S. Chu, S. Narayanan, and C. Kuo, “Environmental sound recognition with time–frequency audio features,” IEEE Trans. Audio, Speech, Language Process., vol. 17, no. 6, pp. 1142–1158, 2009. [6] B. Ghoraani and S. Krishnan, “Time-frequency matrix feature extraction and classification of environmental audio signals,” IEEE Trans. Audio, Speech, Language Process., vol. 19, no. 7, pp. 2197–2209, 2011. [7] X. Valero and F. Alias, “Gammatone cepstral coefficients: Biologically inspired features for non-speech audio classification,” IEEE Trans. Multimedia, vol. 14, no. 6, pp. 1684–1689, 2012. [8] R. Lyon, “Machine hearing: An emerging field [exploratory DSP],” IEEE Signal Process. Mag., vol. 27, no. 5, pp. 131–139, 2010. [9] D. Stowell, D. Giannoulis, E. Benetos, M. Lagrange, and M. D. Plumbley, “Detection and classification of acoustic scenes and events,” IEEE Trans. Multimedia, vol. 17, no. 10, pp. 1733–1746, 2015. [10] M. Cowling and R. Sitte, “Comparison of techniques for environmental sound recognition,” Pattern Recognit. Lett., vol. 24, no. 15, pp. 2895– 2907, 2003. [11] G. Guo and S. Li, “Content-based audio classification and retrieval by support vector machines,” IEEE Trans. Neural Netw., vol. 14, no. 1, pp. 209–215, 2003. [12] A. Temko and C. Nadeu, “Classification of meeting-room acoustic events with support vector machines and variable-feature-set clustering,” in ICASSP, vol. 5. IEEE, 2005, pp. v–505. [13] G. Muhammad and K. Alghathbar, “Environment recognition from audio using MPEG-7 features,” in EMC, 2009, pp. 1–6. [14] H. Tran and H. Li, “Sound event recognition with probabilistic distance SVMs,” IEEE Trans. Audio, Speech, Language Process., vol. 19, no. 6, pp. 1556–1568, 2011. [15] B. Logan, “Mel frequency cepstral coefficients for music modeling,” in ISMIR, 2000. [16] S. Qian and D. Chen, “Joint time-frequency analysis,” IEEE Signal Process. Mag., vol. 16, no. 2, pp. 52–67, 1999. [17] H. Deshpande, R. Singh, and U. Nam, “Classification of music signals in the visual domain,” in Proc. of the COST-G6 Conf. on Digital Audio Effects, 2001, pp. 1–4. [18] I. Paraskevas and E. Chilton, “Audio classification using acoustic images for retrieval from multimedia databases,” in EC-VIP-MC, vol. 1. IEEE, 2003, pp. 187–192. [19] G. Yu and J.-J. Slotine, “Audio classification from time-frequency texture,” arXiv preprint arXiv:0809.4501, 2008. [20] T. Matsui, M. Goto, J. Vert, and Y. Uchiyama, “Gradient-based musical feature extraction based on scale-invariant feature transform,” in EUSIPCO, 2011, pp. 724–728. [21] M. Kim and H. Kim, “Audio-based objectionable content detection using discriminative transforms of time-frequency dynamics,” IEEE Trans. Multimedia, vol. 14, no. 5, pp. 1390–1400, 2012. [22] Y. M. Costa, L. Oliveira, A. L. Koerich, F. Gouyon, and J. Martins, “Music genre classification using LBP textural features,” Signal Process., vol. 92, no. 11, pp. 2723–2737, 2012. [23] J. Ye, T. Kobayashi, M. Murakawa, and T. Higuchi, “Kernel discriminant analysis for environmental sound recognition based on acoustic subspace,” in ICASSP. IEEE, 2013, pp. 808–812.
11
[24] J. Wang, C. Lin, B. Chen, and M. Tsai, “Gabor-based nonuniform scale-frequency map for environmental sound classification in home automation,” IEEE Trans. Autom. Sci. Eng., vol. 11, no. 2, pp. 607– 613, 2014. [25] T. Kobayashi and J. Ye, “Acoustic feature extraction by statistics based local binary pattern for environmental sound classification,” in ICASSP. IEEE, 2014, pp. 3052–3056. [26] C. Geng and X. Jiang, “Face recognition based on the multi-scale local image structures,” Pattern Recognit., vol. 44, no. 10, pp. 2565–2575, 2011. [27] A. Satpathy, X. Jiang, and H.-L. Eng, “Human detection by quadratic classification on subspace of extended histogram of gradients,” IEEE Trans. Image Process., vol. 23, no. 1, pp. 287–297, 2014. [28] T. Ojala, M. Pietikainen, and T. Maenpaa, “Multiresolution gray-scale and rotation invariant texture classification with local binary patterns,” IEEE Trans. Pattern Anal. Mach. Intell., vol. 24, no. 7, pp. 971–987, 2002. [29] G. Zhao, M. Barnard, and M. Pietik¨ainen, “Lipreading with local spatiotemporal descriptors,” IEEE Trans. Multimedia, vol. 11, no. 7, pp. 1254–1265, 2009. [30] S. Liao, M. Law, and A. Chung, “Dominant local binary patterns for texture classification,” IEEE Trans. Image Process., vol. 18, no. 5, pp. 1107–1118, 2009. [31] Z. Guo, L. Zhang, and D. Zhang, “A completed modeling of local binary pattern operator for texture classification,” IEEE Trans. Image Process., vol. 19, no. 6, pp. 1657–1663, 2010. [32] G. Zhao and M. Pietikainen, “Dynamic texture recognition using local binary patterns with an application to facial expressions,” IEEE Trans. Pattern Anal. Mach. Intell., vol. 29, no. 6, pp. 915–928, 2007. [33] J. Ren, X. Jiang, and J. Yuan, “Dynamic texture recognition using enhanced LBP features,” in ICASSP, 2013, pp. 2400–2404. [34] J. Wu and J. Rehg, “CENTRIST: A visual descriptor for scene categorization,” IEEE Trans. Pattern Anal. Mach. Intell., vol. 33, no. 8, pp. 1489–1501, 2011. [35] J. Ren, X. Jiang, and J. Yuan, “Noise-resistant local binary pattern with an embedded error-correction mechanism,” IEEE Trans. Image Process., vol. 22, no. 10, pp. 4049–4060, 2013. [36] Z. Chen, D. B.S., R. Molina, and A. Katsaggelos, “Variational Bayesian methods for multimedia problems,” IEEE Trans. Multimedia, vol. 16, no. 4, pp. 1000–1017, 2014. [37] J. Ren, X. Jiang, and J. Yuan, “Relaxed local ternary pattern for face recognition,” in ICIP, 2013, pp. 3680–3684. [38] Y. Xiao, J. Wu, and J. Yuan, “mCENTRIST: A multi-channel feature generation mechanism for scene categorization,” IEEE Trans. Image Process., vol. 23, no. 2, pp. 823–836, 2014. [39] J. Ren, X. Jiang, and J. Yuan, “Learning binarized pixel-difference pattern for scene recognition,” in ICIP, 2013, pp. 2494–2498. [40] A. Satpathy, X. Jiang, and H. Eng, “LBP based edge-texture features for object recognition,” IEEE Trans. Image Process., vol. 23, no. 5, pp. 1953–1964, 2014. [41] J. Ren, X. Jiang, J. Yuan, and G. Wang, “Optimizing LBP structure for visual recognition using binary quadratic programming,” IEEE Signal Process. Lett., vol. 21, no. 11, pp. 1346 – 1350, 2014. [42] S. Arashloo and J. Kittler, “Dynamic texture recognition using multiscale binarized statistical image features,” IEEE Trans. Multimedia, vol. 16, no. 8, pp. 2099–2109, 2014. [43] J. Ren, X. Jiang, and J. Yuan, “Learning LBP structure by maximizing the conditional mutual information,” Pattern Recognit., vol. 48, no. 10, pp. 3180–3190, 2015. [44] ——, “LBP encoding schemes jointly utilizing the information of current bit and other LBP bits,” IEEE Signal Process. Lett., vol. 22, no. 12, pp. 2373–2377, Dec 2015. [45] S. Zhang, X. Yu, Y. Sui, S. Zhao, and L. Zhang, “Object tracking with multi-view support vector machines,” IEEE Trans. Multimedia, vol. 17, no. 3, pp. 265–278, 2015. [46] J. Ren, X. Jiang, and J. Yuan, “Sound-event classification using pseudocolor CENTRIST feature and classifier selection,” in Proc. SPIE, IWPR, 2016. [Online]. Available: http://dx.doi.org/10.1117/12.2242357 [47] X. Jiang, “Asymmetric principal component and discriminant analyses for pattern classification,” IEEE Trans. Pattern Anal. Mach. Intell., vol. 31, no. 5, pp. 931–937, 2009. [48] ——, “Linear subspace learning-based dimensionality reduction,” IEEE Signal Process. Mag., vol. 28, no. 2, pp. 16–26, 2011. [49] S. Nakamura, K. Hiyane, F. Asano, T. Nishiura, and T. Yamada, “Acoustical sound database in real environments for sound scene understanding and hands-free speech recognition.” in LREC, 2000, pp. 965–968.
SUBMITTED TO IEEE TRANSACTIONS ON MULTIMEDIA
[50] M. Slaney, “Auditory toolbox,” Interval Research Corporation, Tech. Rep, vol. 10, p. 1998, 1998. [51] A. Varga and H. Steeneken, “Assessment for automatic speech recognition: II. NOISEX-92: A database and an experiment to study the effect of additive noise on speech recognition systems,” Speech Commun., vol. 12, no. 3, pp. 247–251, 1993. [52] S. Yan, H. Wang, X. Tang, and T. Huang, “Exploring feature descriptors for face recognition,” in ICASSP, vol. 1, 2007, pp. 629–632. [53] Y. Fang and Z. Wang, “Improving LBP features for gender classification,” in ICWAPR, 2008, pp. 373–377. [54] W. Wang, F. Chang, J. Zhao, and Z. Chen, “Automatic facial expression recognition using local binary pattern,” in WCICA, 2010, pp. 6375–6378. [55] J. Yuan, M. Yang, and Y. Wu, “Mining discriminative co-occurrence patterns for visual recognition,” in CVPR, 2011, pp. 2777–2784. [56] D. Chen, X. Cao, F. Wen, and J. Sun, “Blessing of dimensionality: Highdimensional feature and its efficient compression for face verification,” in CVPR. IEEE, 2013, pp. 3025–3032. [57] J. Ren, X. Jiang, and J. Yuan, “A Chi-squared-transformed subspace of LBP histogram for visual recognition,” IEEE Trans. Image Process., vol. 24, no. 6, pp. 1893–1904, 2015. [58] M. Kleinschmidt, “Methods for capturing spectro-temporal modulations in automatic speech recognition,” Acta Acustica united with Acustica, vol. 88, no. 3, pp. 416–422, 2002. [59] S. Davis and P. Mermelstein, “Comparison of parametric representations for monosyllabic word recognition in continuously spoken sentences,” IEEE Trans. Acoust., Speech, Signal Process., vol. 28, no. 4, pp. 357– 366, 1980. [60] S. Young, G. Evermann, M. Gales, T. Hain, D. Kershaw, X. Liu, G. Moore, J. Odell, D. Ollason, and D. Povey, The HTK book. Cambridge university engineering department, 1997, vol. 2.
Jianfeng Ren (M’15) received M.Sc. and Ph.D. in 2009 and 2015, respectively, both from Nanyang Technological University (NTU). Before that, he graduated with B.Eng. from National University of Singapore in 2001. He received Professional Engineers Board Gold Medal for his outstanding academic results among all EEE M.Sc. graduates in 2009. From 2003 to 2007, he worked in industry sections. In Dec 2007, he joined NTU as a project officer, responsible for the development of the face verification system on mobile devices. In Sept 2011, he joined BeingThere Centre, Institute of Media Innovation, NTU as a research associate. Currently he worked in School of EEE, NTU as a post-doc research fellow. Since 2009, he has published 8 journal papers and 9 conference papers, include two TIP papers, two SPL papers and one TMM paper. His research interests include face recognition, image/video processing, statistical pattern recognition and machine learning.
Xudong Jiang (M’02-SM’06) received the B.Eng. and M.Eng. degrees from the University of Electronic Science and Technology of China and the Ph.D. degree from Helmut Schmidt University, Hamburg, Germany, all in electrical engineering. He received two Science and Technology Awards from the Ministry for Electronic Industry of China. From 1998 to 2004, he was with the Institute for Infocomm Research, A*STAR, Singapore, as a lead Scientist, and the Head of the Biometrics Laboratory, where he developed a system that achieved the highest efficiency and the second highest accuracy at the International Fingerprint Verification Competition in 2000. He joined Nanyang Technological University (NTU), Singapore, as a Faculty Member in 2004, and served as the Director of the Centre for Information Security from 2005 to 2011. He is currently a Tenured Associate Professor with the School of EEE, NTU. He holds 7 patents and has authored over 100 papers with 27 papers in the IEEE journals, including 8 TIP papers and 5 TPAMI papers. His research interests include image processing, pattern recognition, computer vision, machine learning, and biometrics. He is IFS TC member of the IEEE Signal Processing Society, and serves as an Associate Editor of the IEEE Signal Processing Letters and IET Biometrics.
12
Junsong Yuan (M’08-SM’14) is currently an associate professor and program director of video analytics at School of Electrical and Electronics Engineering (EEE), Nanyang Technological University (NTU). He received Ph.D. from Northwestern University and M.Eng. from National University of Singapore. Before that, he graduated from the Special Class for the Gifted Young of Huazhong University of Science and Technology in 2002. His research interests include computer vision, video analytics, gesture and action analysis, largescale visual search and mining, etc. He has co-authored 160 conference and journal papers, and filed several patents. He is Program Chair of IEEE Conf. on Visual Communications and Image Processing (VCIP15), Organizing Chair of Asian Conf. on Computer Vision (ACCV14), and has been the Area Chair for numerous conferences, including CVPR, ACCV, WACV, ICPR, ICME. He serves as guest editor of International Journal of Computer Vision (IJCV), and is currently associate editor of IEEE Trans. on Image Processing (T-IP), IEEE Trans. on Circuits and Systems for Video Technology (T-CSVT) and The Visual Computer journal (TVC). He received Nanyang Assistant Professorship and Tan Chin Tuan Exchange Fellowship from Nanyang Technological University, Outstanding EECS Ph.D. Thesis award from Northwestern University, Best Paper Award from IEEE Trans. on Multimedia, and Doctoral Spotlight Award from IEEE Conf. on Computer Vision and Pattern Recognition (CVPR’09).
Nadia Magnenat Thalmann Professor Thalmann is the Director of the interdisciplinary Institute for Media Innovation in NTU and the Director of MIRALab, at the University of Geneva. She has authored dozens of books, published with her team more than 600 papers on virtual humans/virtual worlds and social robots, organised major conferences as CGI, CASA, and delivered more than 300 keynote addresses, some of them at global events such as the World Economic Forum in Davos. In NTU, Singapore, recently, she revolutionized social robotics by unveiling the first social robot Nadine that can have mood and emotions and remember people and actions. (See https://en.wikipedia.org/wiki/Nadine Social Robot). Besides having bachelors and masters degrees in disciplines such as psychology, biology, chemistry and computer science, Professor Thalmann completed her PhD in quantum physics at the University of Geneva. She has received honorary doctorates from Leibniz University of Hannover and the University of Ottawa in Canada and several prestigious other awards as the Humboldt Research Award in Germany. She is Editor-in-Chief of The Visual Computer, co-Editor-in-Chief of Computer Animation and Virtual Worlds, and editor of many other scientific journals. She is a life member of the Swiss Academy of Engineering Sciences. (See http://en.wikipedia.org/wiki/Nadia Magnenat Thalmann)