Nottingham Monthly Market Wrap June 30, 2016 Economic Overview Throughout June, the U.S. remained the best house in an increasingly marginal global neighborhood. U.S. economic data held steady during the month, indicating slow and steady growth should continue into the fall. The most important indicators we track – employment, housing and industry – all held up well in the face of a deteriorating global macroeconomic backdrop. With “Brexit” dominating headlines in June, it was easy to overlook the data.
4.0%
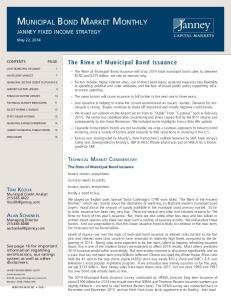
Ind. Production MOM % Change LHS & Capacity Utilization RHS
85.0% 80.0%
2.0% 75.0% 0.0% 70.0%
Despite the dire predictions about what a UK exit from the European Union might mean for the global economy, the only thing we’re sure of at this point is that it’s far too early to make any judgment calls. Granted, we don’t see how this will be a positive for the E.U. nor Great Britain, our guess is that the U.S. will likely only feel modest effects. The real risks we see center more around this unexpected event tipping the world economy into a recession, given the already weak global growth rate we’re seeing. This could pull the U.S. into a mild recession sooner than anticipated. The domestic Unemployment Rate in May dropped to a post-recession low of 4.7% (down from 5.0% in April) despite only 38,000 new nonfarm jobs being added. April’s reading of +160k jobs was revised down to +123k as well. The socalled Underemployment Rate held steady at +9.7% while the Labor Force Participation Rate dipped to 62.6% from 62.8%. Average Hourly Earnings jumped +0.2% and are now up +2.5% Y/Y. This will be an increasingly important number to watch going forward as a possible precursor to broader domestic inflation. New Home Sales dropped unexpectedly in May, falling -6.0%, while Existing Home Sales rose +1.8% and Housing Starts came in essentially unchanged. The S&P/CaseShiller Home Price index rose slightly in April and is up +5.4% Y/Y. While the numbers were mixed overall on the month, the general trend has been towards a steadily recovering housing industry, with only the absence of labor keeping stronger growth at bay. The Markit U.S. Manufacturing PMI continues to hold above 50, with May registering 50.7 and June 51.3. Durable Goods Orders for April rose +3.4% while falling -2.2% in May. Industrial Production dipped -0.4% in May while Capacity Utilization came in slightly below expectations at 74.9%. First quarter GDP ended up +1.1% SAAR, mostly in line with expectations. Key Data Points Name Current For Retail Sales ex. Autos MOM % 0.40% May Housing Starts 1164K May Factory Orders MOM % 1.90% April Leading Indicators MOM % -0.20% May Unit Labor Costs 4.50% 1Q16 GDP QOQ (Annualized) 1.10% 1Q16 Wholesale Inventories 0.60% April MBA Mortgage Applications -2.60% June
-2.0% 2011
65.0% 2012
For April April March April 4Q15 4Q15 March May
2014
2015
2016
Unem ployment Rate 10.0% 8.0%
6.0% 4.0% 2.0% 2011
2012
2013
2014
2015
2016
Consumer Confidence LHS vs. Hom e Prices RHS
130
220
90
180
50
140
10 2011
100 2012
4-Wk Moving Average of Initial Claims (000s), SA
Previous 0.80% 1167K 1.70% 0.60% 4.50% 1.40% 0.20% -4.10%
2013
2013
2014
2015
2016
PPI & CPI YOY % Change 8.0%
500
4.0% 400
0.0% 300
-4.0%
200 '11
'12
'13
'14
'15
'16
-8.0% 2011
2012
2013
2014
100 Corporate Parkway Suite 338 Buffalo, NY 14226 (716) 633-3800 www.NottinghamAdvisors.com
2015
2016
1
Nottingham Monthly Market Wrap June 30, 2016 Domestic Equity U.S. equities eked out small gains in June, despite the UK’s decision to exit the European Union. Few would have anticipated a positive month given the nearly -6% drop in the S&P following the surprise Brexit vote. Likely supporting U.S. equites was the Fed’s decision to hold off on raising short-term interest rates. It’s a good bet that following the Brexit vote, U.S. rates will stay lower for longer than even we suspected! This should bode well for equities in a technical sense over the short-term, but Q2 earnings, set to be released soon, will ultimately determine the near-term fate for stocks.
From a sector standpoint, already expensive defensive sectors led the way in June, becoming even more overvalued than in May. Telecoms rose over +9.0% while Utilities gained +7.8% and Staples +5.2%. U.S. telecoms are up a staggering +24.8% YTD while the Utilities sector has gained +23.4%. Modest economic growth combined with the decline in interest rates has driven investors into the arms of steady dividend-paying companies like Verizon, AT&T, Duke Energy & Southern Co. Valuations are seemingly being ignored in this quest for yield and we would encourage investors to tread cautiously here. More economically sensitive sectors continue to struggle and more accurately reflect the lowgrowth environment we find ourselves in. Financial and Tech are both down on the year while Consumer Discretionary and Healthcare are unchanged. Energy and Materials continue to rebound from the drubbing they’ve taken over the past couple years although we wouldn’t be inclined to give the all-clear signal just yet. As interest rates continue to tumble, perhaps equities can merit higher valuations. Investors should remember however, that over time, valuation is one of the most consistently mean-reverting factors out there and the more stocks deviate from longer-term averages, the greater the pull back to that average becomes.
Telecom
10.0%
Utilities
8.0%
Cons. Staples Energy
4.0%
Healthcare Industrials
2.0%
0.0% -2.0% -4.0% -6.0%
10 Year Average
25 20 15 10 5
19.44
Materials
Cons. Disc. Financials
Info. Tech.
21.48
24.00
22.45
17.12
S&P 500/Citi Growth Index
S&P 500/Citi Value Index
0 S&P 500 Index
S&P 400 Mid Cap S&P 600 Small Cap Index Index
Name S&P 500 Index S&P 400 Mid Cap Index S&P 600 Small Cap Index S&P 500/Citi Growth Index S&P 500/Citi Value Index
MTD S&P 500 Sector Returns
12.0%
6.0%
Domestic Equity Market Trailing P/E Ratios
30
Sector Consumer Discretionary Consumer Staples Energy Financials Healthcare Industrials Information Technology Materials Telecommunications Utilities
MTD -1.18% 5.18% 3.28% -3.21% 1.02% 0.99% -2.76% -0.89% 9.34% 7.81%
Domestic Equity Returns MTD QTD YTD 1 Year 0.26% 2.46% 3.84% 3.98% 0.42% 3.99% 7.93% 1.33% 0.61% 3.47% 6.22% -0.06% -0.36% 1.01% 1.55% 4.23% 0.89% 3.96% 6.24% 3.37%
S&P 500 Sector Returns QTD YTD 1 Year -0.91% 0.68% 3.78% 4.63% 10.46% 18.66% 11.62% 16.10% -3.92% 2.12% -3.05% -4.21% 6.27% 0.42% -2.02% 1.40% 6.46% 7.01% -2.84% -0.32% 4.79% 3.71% 7.46% -2.04% 7.06% 24.85% 25.14% 6.79% 23.41% 31.47%
3 Year 13.20% 14.32% -1.28% 7.62% 16.49% 12.05% 15.22% 8.69% 10.23% 15.93%
100 Corporate Parkway Suite 338 Buffalo, NY 14226 (716) 633-3800 www.NottinghamAdvisors.com
3 Year 11.61% 10.48% 10.18% 13.37% 9.62%
5 Year 16.11% 15.03% 0.75% 10.41% 17.27% 11.18% 13.40% 5.76% 11.70% 13.80%
5 Year 12.08% 10.51% 11.17% 12.90% 11.15%
% of S&P 500 12.52% 11.65% 7.23% 15.24% 14.39% 10.09% 19.75% 2.80% 2.82% 3.50%
2
Nottingham Monthly Market Wrap June 30, 2016 International Equity International equities were a real mixed bag in June as the Brexit vote rocked most world markets. Somewhat surprisingly, emerging markets fared okay throughout the E.U. turmoil with the MSCI EM Index posting a solid +4.1% gain in June. Recent flows into the EM space have been strong and we quite possibly could be seeing the makings of a rebound in this long underperforming sector.
30
The FTSE 100 index fell nearly -7% following the surprise Brexit vote, before rebounding +11% off the lows. This market action is indicative of traders caught off-sides following the unanticipated outcome, with the ultimate fate of financial markets far from certain. The U.K. remains in a state of flux (and political quagmire) after the vote and it will likely be some time before the true fallout from this historic referendum comes to light. It should be noted that with the Pound down nearly 24% verses U.S. the Dollar and -18% verses U.S. the Euro, British exporters should have a distinct trade advantage over the coming years. This will likely bode well for many of the companies in the FTSE 100 and present intrepid investors with an interesting opportunity in the near term.
15
Japan continues to struggle with the fallout from the BoJ’s negative interest rate policy. The Nikkei 225 dropped -9.5% in June as the Yen surged +5.5% against the Dollar. The Japanese economy remains stuck in neutral despite unprecedented monetary stimulus. Prime Minister Abe’s plan to revive the long-dormant Japanese economy is at risk of unraveling should the Yen continue to appreciate and growth remain at bay. We remain cautious. As mentioned above, emerging markets are beginning to see real flows into member countries, after trailing most of the developed world since the recession. Valuations, though not near historical lows, remain compelling verses U.S. developed country markets and could be offering investors with long time horizons an interesting entry point.
International Equity Market Trailing P/E Ratios
25 20
10 5
19.97 22.28 14.59 49.17 18.71 10.32 16.16 19.79 21.31
0
MSCI ACWI MSCI EAFE MSCI EM Index Index Index
Name MSCI ACWI Index MSCI EAFE Index MSCI EM Index FTSE 100 Index Nikkei 225 Index Hang Seng Index Shanghai Composite Index MSCI ACWI ex-USA Index MSCI EMU Index
MSCI ACWI Sector Returns 8.0%
Utilities
6.0%
Energy 4.0% 2.0%
Telecom Healthcare
Cons. Staples
Materials
0.0% -2.0%
Industrials
Info. Tech. Cons. Disc
-4.0%
Financials -6.0%
10 Year Average
Sector Energy Healthcare Utility Information Technology Materials Financials Consumer Discretionary Telecommunications Industrials Consumer Staples
MTD 4.34% 0.88% 5.28% -1.72% 0.70% -4.50% -3.15% 3.09% -0.74% 3.50%
FTSE 100 Nikkei 225 Hang Seng Shanghai MSCI ACWI MSCI EMU Index Index Index Composite ex-USA Index Index Index
International Equity Returns MTD QTD YTD -0.56% 1.17% 1.57% -3.32% -1.23% -4.04% 4.08% 0.78% 6.52% 4.71% 6.55% 6.67% -9.52% -6.95% -17.38% 1.43% 2.39% -2.46% 1.14% -1.64% -16.50% -1.48% -0.44% -0.69% -5.90% -2.19% -8.60%
MSCI ACWI Sector Returns QTD YTD 1 Year 9.75% 16.79% -5.50% 5.61% -1.23% -4.18% 4.44% 13.67% 13.27% -1.62% -0.04% 1.54% 3.44% 9.60% -8.63% -1.48% -6.34% -13.39% -3.60% -3.94% -5.90% 2.70% 9.91% 3.53% 0.48% 4.09% -0.04% 3.88% 8.89% 12.88%
1 Year -3.14% -9.64% -11.75% 3.84% -21.59% -17.54% -30.18% -9.75% -10.83%
3 Year -3.03% 13.28% 8.89% 13.19% -0.07% 2.19% 7.48% 7.64% 7.23% 10.17%
100 Corporate Parkway Suite 338 Buffalo, NY 14226 (716) 633-3800 www.NottinghamAdvisors.com
3 Year 6.63% 2.65% -1.24% 5.31% 6.22% 3.73% 16.53% 1.71% 8.82%
5 Year -3.15% 14.42% 5.36% 11.02% -5.75% 3.32% 9.40% 6.39% 5.66% 11.20%
5 Year 5.98% 2.25% -3.46% 5.67% 11.71% 2.23% 3.58% 0.63% 5.69%
% of ACWI 7.12% 10.74% 3.78% 13.90% 4.94% 19.59% 12.48% 5.25% 10.47% 11.73%
3
Nottingham Monthly Market Wrap June 30, 2016 Fixed Income
Central Bank Activity
U.S. municipal bonds, far removed from the global turmoil, fared well in June as the ML Municipal Master Index gained +1.63%. Many tax-exempt yields from very credit-worthy issuers remain above comparable taxable yields, lending even more value to this tax-advantaged sector of the bond market. The thinly-traded municipal high-yield sector fared even better gaining +3.9% in June in anticipation that a deal to save Puerto Rico will be forthcoming soon. Not soon enough to stave off a formal default, however, as the tiny island commonwealth has no ability to pay bond interest and principal on its outsized $70+ billion in debt. As with emerging market equities, EM bonds fared well in June. Stabilizing currencies have lured yield-seekers back into the debt markets of many EM countries, reflected in the +3.2% gain in the ML USD Emerging Market Sovereign & Credit Index. Notoriously volatile, the EM debt space represents an interesting, potentially less-volatile play on a broader EM recovery and it appears investors have taken notice.
Current
1 Month Ago
6 Months Ago
1 Year Ago
Fed Funds Rate
0.50%
0.50%
0.25%
0.25%
Bank of Japan Target Rate
0.10%
0.10%
0.10%
0.10%
European Central Bank Rate
0.00%
0.00%
0.05%
0.05%
Bank of England Official Bank Rate
0.50%
0.50%
0.50%
0.50%
Fixed Income Returns Name MTD QTD ML U.S. Treasury/Agency Master Index 2.27% 2.19% ML U.S. Broad Market Index 1.86% 2.28% ML U.S. Corporate Master Index 2.01% 2.90% ML U.S. High Yield Master II Index 1.08% 5.88% ML USD Emerging Market Sovereign & Credit Index 3.26% 6.59% ML Global Government Bond II Index 2.28% 2.68% ML Municipal Master Index 1.63% 2.72% ML Municipal High Yield Index 3.88% 6.02%
YTD 5.55% 5.42% 6.67% 9.32% 11.73% 6.51% 4.41% 8.44%
Treasury Yield Curve 3.5 3.0 2.5 2.0
Current
1.5
1 Month Ago
1.0
6 Months Ago
1 Year Ago
0.5
The Fed’s decision to hold off raising rates in June followed by the surprise Brexit decision has essentially put an end to talk of further interest rate hikes in 2016. The Fed entered the year wanting to raise the Fed Funds rate by .75% to 1.0% and will likely not touch it at all. Even 2017 looks like a reach at this point given the negative impact on global growth that we’re likely to see following Britain's decision to exit the EU. At this point, all bets are off as to expected Fed activity going forward. A lot will depend on follow-through from the latest E.U. fracture and its impact on global growth and a lot will depend on the US’s own labor, housing and industrial sectors. Two years ago the 30-year U.S. Treasury bond yielded 3.40%; today it yields 2.15%! And it might even be a good buy here…
0.0 0
1000
5
10
15
20
25
30
Year U.S. Treasury Yields 3
6
2
5
10
15
20
25
30
Period
Month
Month
Year
Year
Year
Year
Year
Year
Year
Current
0.38%
0.42%
0.62% 1.03% 1.51% 1.75% 1.96% 2.21% 2.35%
1 Month Ago
0.50%
0.57%
0.92% 1.41% 1.91% 2.15% 2.34% 2.56% 2.68%
6 Months Ago
0.44%
0.55%
1.12% 1.84% 2.37% 2.62% 2.78% 2.97% 3.07%
1 Year Ago
0.13%
0.17%
0.69% 1.67% 2.42% 2.72% 2.94% 3.11% 3.14%
TED Spread
Option-Adjusted Spread (OAS) 400
1 Year 6.51% 6.12% 7.89% 1.71% 14.59% 8.48% 8.00% 12.96%
4.0
Yield
Bonds were the primary beneficiary of the global turmoil following the UK referendum to exit the EU. Global interest rates collapsed in a classic flight to safety trade. The global uncertainty pretty much put a nail in the coffin for any Fed interest rate hike in 2016. As we go to press, the U.S. 10-year is trading with a historically low yield of just 1.38%! The yield, however, looks positively robust verses U.S. 10-year yields of .78% in the UK, .14% in France, -.17% in Germany (yes, negative) and -.26% in Japan. Again, the cleanest shirt in a hamper full of dirty ones usually shines.
Name
Inflation Outlook: Spread Between U.S. Treasury Yield Curve & U.S. TIPS Yield Curve
0.60%
1.8
0.50%
600
0.40%
400
0.30%
200
200
0 2011
2012
2013
US Corporate Master (LHS)
2014
2015
0 2016
US High Yield Master II (RHS)
1.7 1.7
Spread
800
0.20%
1.6 1.5
1.5 1.4
0.10%
0.00% 2011
1.6
1.4 1.3
2012
2013
2014
2015
2016
0
5
10
15
20
25
30
Year
100 Corporate Parkway Suite 338 Buffalo, NY 14226 (716) 633-3800 www.NottinghamAdvisors.com
4
Nottingham Monthly Market Wrap June 30, 2016 Bloomberg Commodity Index
Alternative Investments
210 170
Global commodities continued to stabilize in June, led by gold which gained approximately 10% on the month following the surge in global equity volatility. With interest rates plummeting and easy monetary policy pretty much the global norm now, gold has caught a bid from investors seeking a currency that can’t be debased. And with interest rates negative in many parts of the world, the cost of owning gold has collapsed, lending even more appeal to it.
130
90 50 2011
2012
2013
2014
2015
2016
Crude Oil Spot (WTI Cushing)
The broadly diversified Bloomberg Commodity Index gained +4.5% in June and is up nearly +19% from the lows it set in early 2016. The broad commodity index still trades at levels last seen in 1998, but it’s near-term fate is far from certain as much depends on whether recent gains in oil prices are sustainable and whether the U.S. Dollar stabilizes at current levels. Commodities do remain a decent barometer of global economic activity and bear watching regardless of their near-term investment merit.
$125
$100 $75 $50 $25
Hedge funds continue to struggle here in 2016, with many institutional investors growing impatient and disillusioned with the “2&20” model after years of lackluster returns. Even many legendary top-performers are starting to see outflows and there is a movement afoot amongst some state investment plans (pensions, etc.) to divest of the space completely. With nearly as many hedge funds in existence as mutual funds, it’s not surprising to see the list of shuttered funds growing. It is a zero-sum game after all.
One interesting sector that bears watching is the U.S. REIT space. The decline in interest rates around the world has driven valuations ever higher (and cap rates ever lower). Currently VNQ, the Vanguard REIT ETF yields 3.4%, 200 basis points more than a 10-year U.S. Treasury note and through June, it’s produced a total return of +13.5%. Although not cheap by any measure, investors seeking yield certainly may want to explore the REIT space as interest rates appear headed ever lower over the near-term. The big risk to REIT’s remains inflation, and there’s hardly a hint of that anywhere in the global economy.
2011
2012
2013
2014
2015
2016
2015
2016
Gold Spot $2,000
$1,600
$1,200
$800 2011
2012
2013
2014
U.S. Dollar Index Spot 105
100 95
90
Hedge Funds Name
MTD
QTD
YTD
1 Year
3 Year
5 Year
Global Hedge
-0.04%
0.83%
-1.06%
-5.86%
-0.65%
-0.51%
Convertible Arbitrage
0.11%
2.22%
1.11%
-1.47%
-2.30%
0.66%
Distressed Securities
1.30%
8.47%
6.85%
-5.87%
-0.65%
-1.51%
Equity Hedge (L/S)
-1.74%
-1.29%
-4.18%
-8.58%
0.28%
-0.49%
Equity Market Neutral
-1.10%
-2.50%
-5.03%
-0.68%
1.62%
-0.99%
Event Driven
0.96%
4.11%
2.83%
-5.65%
-0.88%
0.76%
Macro
0.88%
-0.53%
-0.45%
-1.07%
0.65%
-0.59%
Merger Arbitrage
-0.23%
0.51%
2.14%
6.92%
4.95%
2.85%
Relative Value Arbitrage Absolute Return
0.17% -0.26%
0.94% 0.26%
-1.85% -0.32%
-6.60% 0.51%
-2.20% 1.71%
-1.43% 1.08%
85
FTSE NAREIT All REIT's 250
80
75
200
70 2011
2012
2013
Description
Current
1 Month Ago
3 Months Ago
6 Months Ago
CAD / USD
1.29
1.31
1.30
1.38
1.25
JPY / USD
103.20
110.73
112.57
120.22
122.50
USD / GBP USD / EUR
1.33
1.45
1.44
1.47
1.57
1.11
1.11
1.14
1.09
1.11
2014
2015
2016
150 Spot Rates
100 50 2011
2012
2013
2014
2015
2016
100 Corporate Parkway Suite 338 Buffalo, NY 14226 (716) 633-3800 www.NottinghamAdvisors.com
1 Year Ago
5
Nottingham Monthly Market Wrap June 30, 2016 S&P 500 Index (SPX) – Standard and Poor’s 500 Index is a capitalization-weighted index of 500 stocks. The index is designed to measure performance of the broad domestic economy through changes in the aggregate market value of 500 stocks representing all major industries. S&P 500 Sector Indices (S5COND, S5CONS, S5ENRS, S5FINL, S5HLTH, S5INDU, S5INFT, S5MATR, S5TELS, S5UTIL) – The S&P 500 is broken down into ten subindices according to the Global Industry Classification Standard (GICS) sectors. These ten sectors include Consumer Discretionary, Consumer Staples, Energy, Financials, Health Care, Industrials, Information Technology, Materials, Telecommunication Services, and Utilities. S&P 400 Mid Cap Index (MID) – Standard and Poor’s Mid Cap 400 Index is a capitalization-weighted index, which measures the performance of the mid-range sector of the U.S. stock market. S&P 600 Small Cap Index (SML) – Standard & Poor’s Small Cap 600 Index is a capitalization-weighted index that measures the performance of selected U.S. stocks with a small market capitalization. S&P 500/Citigroup Growth Index (SGX) – The S&P 500/Citigroup Growth Index is a market capitalization-weighted index. All the stocks in the underlying parent index are allocated into value or growth. Stocks that do not have pure value or pure growth characteristics have their market caps distributed between the value & growth indices.
S&P 500/Citigroup Value Index (SVX) – The S&P 500/Citigroup Value Index is a market capitalizationweighted index. All the stocks in the underlying parent index are allocated into value or growth. Stocks that do not have pure value or pure growth characteristics have their market caps distributed between the value & growth indices. MSCI AC World Index (MXWD) – The MSCI AC World Index is a free float-weighted equity index. The index includes both emerging and developed world markets. MSCI EAFE Index (MXEA) – The MSCI EAFE Index is a capitalization-weighted index that monitors the performance of stocks from developed markets in Europe, Australia-Asia, and the Far East. MSCI Emerging Market Index (MXEF) – The MSCI Emerging Market Index is a free-float weighted index that is designed to measure the equity performance of international emerging markets. FTSE 100 Index (UKX) – The FTSE 100 Index is a capitalization-weighted index of the 100 most highly capitalized companies traded on the London Stock Exchange. The equities use an investability quotient weighting in the index calculation. Nikkei 225 Stock Average Index (NKY) – The Nikkei-225 Stock Average is a price-weighted average of 225 toprated Japanese companies listed in the First Section of the Tokyo Stock Exchange.
Hang Seng Index (HSI) – The Hang Seng is a freefloat capitalization-weighted index of selected companies from the Stock Exchange of Hong Kong. The components of the index are divided into four sub-indexes: Commerce and Industry, Finance, Utilities, and Properties. Shanghai Stock Exchange Composite Index (SHCOMP) – The Shanghai Stock Exchange Composite Index is a capitalization-weighted index. The index tracks the daily price performance of all A-shares and B-shares listed on the Shanghai Stock Exchange. S&P Global 1200 Index (SPGLOB) – The S&P Global 1200 Index is a composite index, comprised of seven regional and country indices – S&P 500, S&P Europe 350, S&P/TOPIX 150 (Japan), S&P TSX 60 (Canada), S&P/ASX 50 (Australia), S&P Asia 50, and S&P Latin America 50. The S&P Global 1200 is calculated in U.S. dollars. The index is market-cap weighted. ML U.S. Treasury & Agency Index (G0A0) – The Merrill Lynch U.S. Treasury and Agency Index tracks the performance of U.S. dollar denominated U.S. Treasury and non-subordinated U.S. agency debt issued in the U.S. domestic market.
ML U.S. Broad Market Index (US00) – The Merrill Lynch U.S. Broad Market Index tracks the performance of U.S. dollar denominated investment grade debt publicly issued in the U.S. domestic market, including U.S. Treasury, quasi-government, corporate, securitized, and collateralized securities.
100 Corporate Parkway Suite 338 Buffalo, NY 14226 (716) 633-3800 www.NottinghamAdvisors.com
6
Nottingham Monthly Market Wrap June 30, 2016 ML U.S. Corporate Index (C0A0) – The Merrill Lynch U.S. Corporate Index tracks the performance of U.S. dollar denominated investment grade corporate debt publicly issued in the U.S. domestic market. ML U.S. High Yield Index (H0A0) – The Merrill Lynch U.S. High Yield Index tracks the performance of U.S. dollar denominated below investment grade corporate debt publicly issued in the U.S. domestic market. ML Global Government Index (W0G1) – The Merrill Lynch Global Government Index tracks the performance of investment grade sovereign debt publicly issued and denominated in the issuer’s own domestic market and currency. ML U.S. Municipal Securities Index (U0A0) – The Merrill Lynch U.S. Municipal Securities Index tracks the performance of U.S. dollar denominated investment grade tax-exempt publicly issued by U.S. states and territories, and their political subdivisions, in the U.S. domestic market. FTSE NAREIT All REITs Index (FNAR) – The FTSE NAREIT All REITs Index is a free float adjusted market capitalization-weighted index that includes all tax qualified REITs listed in the NYSE, AMEX, and NASDAQ National Market.
Dow Jones UBS Commodity Index (DJUBS) – The Dow Jones UBS Commodity Index is composed of futures contracts on 19 physical commodities. It reflects the return of underlying commodity futures price movements only. Previously, the index was the Dow Jones AIG Commodity Index.
U.S. Dollar Index (DXY) – The U.S. Dollar Index (USDX) indicates the general int’l value of the USD. The USDX does this by averaging the exchange rates between the USD and 6 major world currencies. The ICE U.S. computes this by using the rates supplied by some 500 banks. HFRX Global Hedge Fund Index (HFRXGL) – The HFRX Global Hedge Fund Index is designed to be representative of the overall composition of the hedge fund universe. It is comprised of all eligible hedge fund strategies. HFRX Convertible Arbitrage Index (HFRXCA) – The HFRX Convertible Arbitrage Index is designed to reflect the general performance of strategies in which the investment thesis is predicated on realization of a spread between related instruments in which one or multiple components of the spread is a convertible fixed income instrument.
HFRX Distressed Securities Index (HFRXDS) – The HFRX Distressed Securities Index is designed to reflect the general performance of strategies focused on corporate fixed income instruments, primarily on corporate credit instruments of companies trading at significant discounts to their value at issuance of obliged (par value) at maturity as a result of either formal bankruptcy proceeding or financial market perception of near term proceedings. HFRX Macro Index (HFRXM) – The HFRX Macro Index reflects the general performance of strategies in which the investment process is predicated on movements in underlying economic variables and the impact these have on equity, fixed income, hard currency, and commodity markets.
HFRX Equity Hedge Index (HFRXEH) – The HFRX Equity Hedge Index is designed to reflect the general performance of strategies that maintain both long and short positions in primarily equity and equity derivative securities. A wide variety of investment processes can be employed to arrive at an investment decision, including both quantitative and fundamental techniques. Strategies can be broadly diversified or narrowly focused. HFRX Equity Market Neutral Index (HFRXEMN) – The HFRX Equity Market Neutral Index is designed to reflect the general performance of strategies that employ sophisticated quantitative techniques of analyzing price data to ascertain information about future price movement and relationships between securities. HFRX Event Driven Index (HFRXED) – The HFRX Event Driven Index reflects the general performance of strategies that maintain positions in companies currently or prospectively involved in corporate transactions of a wide variety including, but not limited to, mergers, restructurings, financial distress, tender offers, shareholder buybacks, debt exchanges, security issuance, or other capital structure adjustments. HFRX Merger Arbitrage Index (HFRXMA) – The HFRX Merger Arbitrage Index reflects the general performance of strategies which employ an investment process primarily focused on opportunities in equity and equity related instruments of companies which are current engaged in a corporate transaction.
100 Corporate Parkway Suite 338 Buffalo, NY 14226 (716) 633-3800 www.NottinghamAdvisors.com
7
Nottingham Monthly Market Wrap June 30, 2016 HFRX Relative Value Arbitrage Index (HFRXRVA) – The HFRX Relative Value Arbitrage Index reflects the general performance of strategies that maintain positions in which the investment thesis is predicated on realization of a valuation discrepancy in the relationship between multiple securities.
Economic Data Sources: PPI & CPI – Bureau of Labor Statistics Unemployment Rate – Bureau of Labor Statistics Consumer Confidence – Conference Board S&P/Case-Shiller Composite 20 – Case-Shiller Industrial Production – Federal Reserve Capacity Utilization – Federal Reserve Retail Sales – U.S. CensU.S. Bureau Housing Starts – U.S. Department of Commerce Factory Orders – U.S. CensU.S. Bureau Leading Indicators – Conference Board Unit Labor Costs – Bureau of Labor Statistics GDP – Bureau of Economic Analysis Wholesale Inventories – U.S. CensU.S. Bureau MBA Mortgage Applications – Mortgage Bankers Association 4-Week Moving Average of Initial Claims, SA – Bureau of Labor Statistics
If you have any questions or comments, please feel free to contact any member of our investment team: Tom Quealy, Chief Executive Officer –
[email protected] Larry Whistler, CFA, President/Chief Investment Officer –
[email protected] Nick Verbanic, CFP® V.P./Portfolio Manager –
[email protected] Matthew Krajna, CFA, Portfolio Manager –
[email protected] Brock Wilkinson, Associate Portfolio Manager –
[email protected] Jason Cassorla, Associate Portfolio Manager –
[email protected] James Ferguson, CFA, Business Development Officer –
[email protected] The indices referenced in the Nottingham Monthly Market Wrap are unmanaged and cannot be invested in directly. The returns of these indices do not reflect any investment management fees or transaction expenses. Had these additional fees and expenses been reflected, the returns of these indices would have been lower. Information herein has been obtained from third party sources that are believed to be reliable; however, the accuracy of the data is not guaranteed by Nottingham Advisors. The content of this report is as current as of the date indicated and is subject to change without notice. This report was prepared by Nottingham Advisors, a registered investment adviser with the SEC under the Investment Advisers Act of 1940, as amended. This report does not constitute an offer of any kind, nor does it invite anyone to make an offer to buy or sell securities. The Nottingham Monthly Market Wrap does not take into account the specific investment objectives or financial situations of any particular investor. All commentary contained within this report is the opinion of Nottingham Advisors. Past performance is not an indication of future results.
100 Corporate Parkway Suite 338 Buffalo, NY 14226 (716) 633-3800 www.NottinghamAdvisors.com
8