L in e D iff er e n ti al P r o t ec t io n o v er IP / MP L S
Test Report
Line Differential Protection over IP/MPLS Test Report
Page 1 of 41
L in e D iff er e n ti al P r o t ec t io n o v er IP / MP L S
Test Report
Document Version History The purpose of this section is to capture the changes made to the document.
Date
Author
Version
Description
26 Oct 2015
BAO Xiongbo
1.0
Initial release
13 Nov 2015
WEI Pin
1.1
Updated the test case sections
20 Nov 2015
WEI Pin
1.2
Update
20 Jan 2016
WEI Pin
1.3
Added section 2 ; updated section 8 and section 9
16 Feb 2016
WEI Pin
1.4
Update; edited section 8
19 Feb 2016
WEI Pin
1.5
Updated section 9.1
26 Feb 2016
WEI Pin
1.6
Updated figure number and adjusted format throughout
29 Feb 2016
WEI Pin
1.7
Initial publication
Page 2 of 41
L in e D iff er e n ti al P r o t ec t io n o v er IP / MP L S
Test Report
Table of Contents 1 2 3 4
Executive overview ................................................................................................. 4 Acronyms ................................................................................................................ 4 Equipment List ........................................................................................................ 5 Physical topology .................................................................................................... 6 4.1 Physical connection ................................................................................................. 6 4.2 Equipment Configurations ........................................................................................ 7 4.3 Physical port connection .......................................................................................... 8 4.4 Omicron tester electrical wiring with protection relays ................................................ 8 5 IP/MPLS topology ................................................................................................... 9 5.1 MPLS LSP connectivity ............................................................................................. 9 5.2 IP configuration ...................................................................................................... 9 6 SAR configuration ................................................................................................... 9 6.1 IGP configuration .................................................................................................... 9 6.2 RSVP-TE configuration........................................................................................... 13 6.3 Service configuration ............................................................................................. 15 6.4 Cpipe jitter-buffer and payload-size setting ............................................................. 17 7 Relay configuration............................................................................................... 17 8 Test cases ............................................................................................................. 18 8.1 Direct connection .................................................................................................. 18 8.2 IP/MPLS without background traffic ........................................................................ 22 8.3 IP/MPLS with background traffic ............................................................................. 24 9 Results and conclusion ......................................................................................... 38 9.1 Test results summary ............................................................................................ 38 9.2 Conclusion............................................................................................................ 40 10 Acknowledgement ................................................................................................ 41
Page 3 of 41
L in e D iff er e n ti al P r o t ec t io n o v er IP / MP L S
Test Report
1 Executive overview As TDM networks and services are being discontinued, utilities are beginning to consider or plan migration of grid applications traffic to packet networks and services. Protection applications such as line differential protection have the most stringent communications requirements for network performance in general, latency, jitter, delay symmetry and resiliency in particular. Consequently, Schneider Electric and Nokia collaborate to build a test bed to evaluate and characterize the performance of an IP/MPLS network and investigate whether it can support line differential protection. The test bed comprises two Schneider Electric MiCOM P545 Current Differential Protection Relays, and three Nokia 7705 Service Aggregation Routers (SAR) in a ring topology, configured with path diversity, RSVP-TE-based traffic engineering and fast re-route, as well as QoS (quality of service). The relay interface used is IEEE C37.94. It is an N x 64 Kb/s optical fiber interface between protection relays and the network. 7705 SAR’s Voice & Teleprotection (VT) card terminates this interface and packetizes the traffic in a Cpipe connection, also known as TDM pseudowire or circuit emulation service (CES), over a MPLS label switched path (LSP). As detailed in the following sections: a. the test exercise successfully validates that IP/MPLS is fully qualified to transport safety-critical line differential protection communications b. end-to-end channel delay and tripping delay are within maximum limit without any application performance degradation c. differential current measurement accuracy is not impacted by severe network congestion in IP/MLS network d. MPLS’s quality of service (QoS) capability and resiliency are pivotal to enable IP/MPLS network to reliably deliver required network performance under different network conditions (normal uncongested, severely congested and link failure). It is concluded that with proper network configurations, IP/MPLS network can consistently meet the stringent communications requirements imposed by line differential protection. Therefore IP/MPLS is fully qualified to transport this safety-critical grid application.
2 Acronyms Term ADC CES CSM QoS CIR LSP MPLS
Semantics Asymmetrical Delay Control Circuit Emulation Service Control and Switch Module Quality of Service Committed Information Rate Label Switched Path Multi-protocol Label Switching Page 4 of 41
L in e D iff er e n ti al P r o t ec t io n o v er IP / MP L S
Test Report
PIR RSVP-TE SAR TDM VT
Peak Information Rate Reservation Protocol – Traffic Engineering Service Aggregation Router Time Division Multiplex Voice & Teleprotection
3 Equipment List Below table lists the equipment used to perform the tests. No. 1
Subsystem Element
Vendor Nokia
1.1
7705 SAR-8 7705 SAR-8 Chassis
1.2
7705 SAR-8 Slot A
1.3
Nokia
Vendor Code
Description SAR8_R1
7.0.R2
Nokia
3HE06791AA 3HE02774AB
SAR-8 Shelf V2 Control Switch Module (CSM) V2
7705 SAR-8 Slot B
Nokia
3HE02774AB
Control Switch Module (CSM) V2
1.4
7705 SAR-8 MDA 1
Nokia
1.5
7705 SAR-8 MDA 2
Nokia
3HE02776AB 3HE06006AA
8 PORT GE/FE Ethernet Card V2 8 Port Voice & Teleprotection Card
2
Nokia
2.1
7705 SAR-8 7705 SAR-8 Chassis
2.2
7705 SAR-8 Slot A
2.3
Nokia
Version
SAR8_R1
7.0.R2
Nokia
3HE06791AA 3HE02774AB
SAR-8 SHELF V2 Control Switch Module (CSM) V2
7705 SAR-8 Slot B
Nokia
3HE02774AB
Control Switch Module (CSM) V2
2.4
7705 SAR-8 MDA 1
Nokia
2.5
7705 SAR-8 MDA 2
Nokia
3HE02776AB 3HE06006AA
8 PORT GE/FE Ethernet Card V2 8 Port Voice & Teleprotection Card
2.6
7705 SAR-8 MDA 3
Nokia
3HE02776AB
8 PORT GE/FE Ethernet Card V2
3
7705 SAR-8
Nokia
3.1
7705 SAR-8
Nokia
3.2
7705 SAR-8 Slot A
3.3
SAR8_R1
6.1.R4
Nokia
3HE02773AA 3HE02774AA
SAR-8 Shelf Control Switch Module (CSM)
7705 SAR-8 Slot B
Nokia
3HE02774AA
Control Switch Module (CSM)
3.4
7705 SAR-8 MDA 1
4
MiCOM P545
5
MiCOM P545
Nokia 3HE02776AB Schneider Electric — Schneider Electric —
8 PORT GE/FE Ethernet Card V2 MiCom1 with model number P54531JA6M0578K MiCom2 with model number P54531JA6M0578K Page 5 of 41
— —
L in e D iff er e n ti al P r o t ec t io n o v er IP / MP L S
Test Report
6
Omicron CMC356
7
DC power supply
Omicron
GK903N
Provide voltages and currents for relays, and record the tripping time of relays. Provide DC power supply for 7705 SAR-8
—
4 Physical topology 4.1 Physical connection The test bed was setup in Schneider Electric lab in Shanghai, China (Fig. 1). The test bed’s physical topology is depicted in Fig. 2.
Fig. 1 The test bed in the Schneider Electric Shanghai Lab
Page 6 of 41
L in e D iff er e n ti al P r o t ec t io n o v er IP / MP L S
Test Report
Fig. 2 The test bed network topology
4.2 Equipment Configurations SAR8_R1 CSM 8P ETH ---
CSM 8P VT ---
SAR8_R2 CSM 8P ETH 8P ETH --
CSM 8P VT ---
Page 7 of 41
L in e D iff er e n ti al P r o t ec t io n o v er IP / MP L S
Test Report
SAR8_R3 CSM 8P ETH ---
CSM ----
4.3 Physical port connection The table below shows the 7705 SAR-8 physical port connection information. Local Site SAR8_R1 SAR8_R2 SAR8_R3 MiCOM1 MiCOM2
Local port 1/1/7 1/3/7 1/1/7 ---
Port Type 1000M 1000M 1000M C37.94 C37.94
Remote Site SAR8_R2 SAR8_R3 SAR8_R1 SAR8_R2 SAR8_R3
Remote port 1/1/8 1/1/8 1/1/8 1/2/1 1/2/1
4.4 Omicron tester electrical wiring with protection relays Omicron CMC356 plays a seminal role in supplying voltages and currents to the protection relays, P545A and P545B, in the test bed, and records the relay tripping time. Fig. 3 shows the wiring connection between Omicron and the two protection relays for the tripping time test.
Fig. 3 the wiring with tester
Page 8 of 41
L in e D iff er e n ti al P r o t ec t io n o v er IP / MP L S
Test Report
5 IP/MPLS topology 5.1 MPLS LSP connectivity The LSP tunnel setup in the test bed is shown in Fig. 4.
Fig. 4 MPLS LSP connectivity in the test bed
5.2 IP configuration The test network’s IP configuration is shown below.
Local Site SAR8_R1 SAR8_R2 SAR8_R3
Local Port 1/1/7 1/3/7 1/1/7
IP address 10.1.12.1/24 10.1.23.2/24 10.1.13.3/24
Remote Site SAR8_R2 SAR8_R3 SAR8_R1
Remote Port 1/1/8 1/1/8 1/1/8
IP Address BFD 10.1.12.2/24 10.1.23.3/24 10.1.13.1/24
6 SAR configuration 6.1 IGP configuration Below is the basic configuration of the 7705 SAR-8.
Page 9 of 41
Yes Yes Yes
L in e D iff er e n ti al P r o t ec t io n o v er IP / MP L S
Test Report
6.1.1 SAR8_R1 SAR8_R1 configuration #-------------------------------------------------echo "Router (Network Side) Configuration" //interface configuration #-------------------------------------------------router interface "system" address 1.1.1.1/32 no shutdown exit interface "x1" address 10.1.12.1/24 port 1/1/7 bfd 10 receive 10 multiplier 3 type np no shutdown exit interface "x2" address 10.1.13.1/24 port 1/1/8 bfd 10 receive 10 multiplier 3 type np no shutdown exit #-------------------------------------------------echo "ISIS Configuration" //ISIS configuration #-------------------------------------------------isis level-capability level-2 area-id 49.0000 traffic-engineering //enable traffic-engineering for RSVP TE interface "system" level-capability level-2 no shutdown exit interface "x2" level-capability level-2 bfd-enable ipv4 //enable bfd for ISIS no shutdown exit interface "x1" level-capability level-2 bfd-enable ipv4 no shutdown exit no shutdown Page 10 of 41
L in e D iff er e n ti al P r o t ec t io n o v er IP / MP L S
Test Report
exit
6.1.2 SAR8_R2 SAR8_R2 configuration #-------------------------------------------------echo "Router (Network Side) Configuration" //interface configuration #-------------------------------------------------router interface "system" address 1.1.1.2/32 no shutdown exit interface "x1" address 10.1.12.2/24 port 1/1/8 bfd 10 receive 10 multiplier 3 type np no shutdown exit interface "x2" address 10.1.23.2/24 port 1/3/7 bfd 10 receive 10 multiplier 3 type np no shutdown exit #-------------------------------------------------echo "ISIS Configuration" //ISIS configuration #-------------------------------------------------isis level-capability level-2 area-id 49.0000 traffic-engineering //enable traffic-engineering for RSVP TE interface "system" level-capability level-2 no shutdown exit interface "x1" level-capability level-2 bfd-enable ipv4 //enable bfd for ISIS no shutdown exit interface "x2" level-capability level-2 bfd-enable ipv4 Page 11 of 41
L in e D iff er e n ti al P r o t ec t io n o v er IP / MP L S
Test Report
no shutdown exit no shutdown exit
6.1.3 SAR8_R3 SAR8_R3 configuration #-------------------------------------------------echo "Router (Network Side) Configuration" //interface configuration #-------------------------------------------------router interface "system" address 1.1.1.3/32 exit interface "x1" address 10.1.23.3/24 port 1/1/8 bfd 10 receive 10 multiplier 3 type np exit interface "x2" address 10.1.13.3/24 port 1/1/7 bfd 10 receive 10 multiplier 3 type np exit #-------------------------------------------------echo "ISIS Configuration" //ISIS configuration #-------------------------------------------------isis level-capability level-2 area-id 49.0000 traffic-engineering //enable traffic-engineering for RSVP TE interface "system" level-capability level-2 exit interface "x1" level-capability level-2 bfd-enable ipv4 //enable bfd for ISIS exit interface "x2" level-capability level-2 bfd-enable ipv4 exit exit Page 12 of 41
L in e D iff er e n ti al P r o t ec t io n o v er IP / MP L S
Test Report
6.2 RSVP-TE configuration Below is the RSVP-TE configuration in SAR-8.
6.2.1 SAR_R1 #-------------------------------------------------echo "MPLS Configuration" #-------------------------------------------------mpls interface "system" //enable MPLS on interface no shutdown exit interface "x2" //enable MPLS on interface no shutdown exit interface "x1" //enable MPLS on interface no shutdown exit exit #-------------------------------------------------echo "RSVP Configuration" #-------------------------------------------------rsvp interface "system" //enable RSVP on interface no shutdown exit interface "x2" //enable RSVP on interface bfd-enable //enable bfd for RSVP no shutdown exit interface "x1" //enable RSVP on interface bfd-enable //enable bfd for RSVP no shutdown exit no shutdown exit #-------------------------------------------------echo "MPLS LSP Configuration" #-------------------------------------------------mpls path "Primary_R2" //Create “Paimary_R2” path. Specify the next hop. hop 1 10.1.12.2 strict Page 13 of 41
L in e D iff er e n ti al P r o t ec t io n o v er IP / MP L S
Test Report
no shutdown exit path "Standby_R2" //Create “Standby_R2” path. Specify the next hop. hop 1 10.1.13.3 strict no shutdown exit lsp "LSP-R2" //Create LSP to R2 system ip. to 1.1.1.2 cspf //enable CSPF fast-reroute one-to-one //enable fast reroute exit primary "Primary_R2" // Primary path exit secondary "Standby_R2" // Standby path (Hot standby) standby exit no shutdown exit no shutdown exit
6.2.2 SAR_R2 #-------------------------------------------------echo "MPLS Configuration" #-------------------------------------------------mpls interface "system" //enable MPLS on interface no shutdown exit interface "x1" //enable MPLS on interface no shutdown exit interface "x2" //enable MPLS on interface no shutdown exit exit #-------------------------------------------------echo "RSVP Configuration" #-------------------------------------------------rsvp interface "system" //enable RSVP on interface no shutdown exit interface "x1" //enable RSVP on interface bfd-enable //enable bfd for RSVP Page 14 of 41
L in e D iff er e n ti al P r o t ec t io n o v er IP / MP L S
Test Report
no shutdown exit interface "x2" //enable RSVP on interface bfd-enable //enable bfd for RSVP no shutdown exit no shutdown exit #-------------------------------------------------echo "MPLS LSP Configuration" #-------------------------------------------------mpls path "Primary_R1" //Create “Paimary_R1” path. Specify the next hop. hop 1 10.1.12.1 strict no shutdown exit path "Standby_R1" //Create “Standby_R1” path. Specify the next hop. hop 1 10.1.23.3 strict no shutdown exit lsp "LSP-R1" //Create LSP to R2 system ip. to 1.1.1.1 cspf //enable CSPF fast-reroute one-to-one //enable fast reroute exit primary "Primary_R1" // Primary path exit secondary "Standby_R1" // Standby path (Hot standby) standby exit no shutdown exit no shutdown exit
6.3 Service configuration 6.3.1 SAR8_R1 #-------------------------------------------------echo "Service Configuration" #-------------------------------------------------service
Page 15 of 41
L in e D iff er e n ti al P r o t ec t io n o v er IP / MP L S
Test Report
sdp 1 create //Create SDP using LSP "LSP-R2" far-end 1.1.1.2 lsp "LSP-R2" path-mtu 1550 keep-alive shutdown exit no shutdown exit customer 1 create description "Default customer" exit cpipe 10 customer 1 vc-type cesopsn create //Create circuit service for C37.94 sap 1/2/1.1 create // Specify the local service sap connect to C37.94 cem packet jitter-buffer 1 payload-size 3 //jitter-buffer and payload-size exit exit spoke-sdp 1:1 create //Specify the SDP 1 and vi-id=1 to R2 no shutdown exit no shutdown exit exit
6.3.2 SAR8_R2 #-------------------------------------------------echo "Service Configuration" #-------------------------------------------------service sdp 1 create //Create SDP using LSP "LSP-R1" far-end 1.1.1.1 lsp "LSP-R1" path-mtu 1550 keep-alive shutdown exit no shutdown exit customer 1 create description "Default customer" exit cpipe 10 customer 1 vc-type cesopsn create //Create circuit service for C37.94 sap 1/2/1.1 create // Specify the local service sap connect to C37.94 Page 16 of 41
L in e D iff er e n ti al P r o t ec t io n o v er IP / MP L S
Test Report
cem packet jitter-buffer 1 payload-size 3 //jitter-buffer and payload-size exit exit spoke-sdp 1:1 create //Specify the SDP 1 and vi-id=1 to R1 no shutdown exit no shutdown exit exit
6.4 Cpipe jitter-buffer and payload-size setting 7705 SAR-8 supports IEEE C37.94 N x 64kb/s data transmission over optical interface, packetizing up to 12 timeslots. Below shows the different jitter-buffer value and payload-size value configured on the 7705 SAR-8 and delay measurement recorded in the MiCOM P545 protection relays.
Item
No. of timeslot (N)
Jitter-buffer
Payload-size
Time(ms)
1 2 3 4 5 6 7
1 1 1 1 6 12 12
32 8 8 1 8 8 1
64 24 8 3 192 192 24
27.65 9.56 8.05 4.32 7.08 6.85 1.68
Noted Default setting
Testing configuration Default setting Default setting
For tests in the rest of this report, N, jitter-buffer and payload-size were set to 1, 1, and 3 respectively. Under this combination, the measured propagation time by the protection relay was 4.32ms. This propagation time is attributed to router processing delay (packetization, label switching and buffer playout) and fiber transmission delay.
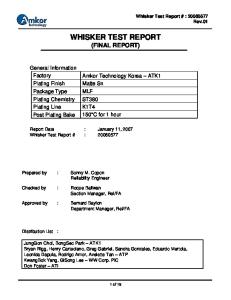
7 Relay configuration In this test exercise, two P545 relays were used. The protection communication was configured as in Fig. 5 below. All the protection functions were disabled except the “Phase Diff” protection, and the PHASE DIFFERENTIAL configuration was the default setting, as shown in Fig 6.
Page 17 of 41
L in e D iff er e n ti al P r o t ec t io n o v er IP / MP L S
Test Report
Fig. 5 Protection communication configuration
Fig. 6 PHASE DIFFERENTIAL configuration
8 Test cases 8.1 Direct connection Test case 8.1 is to measure the protection channel latency time, current measurement data accuracy, and tripping time of the relays when they are directly connected by a pair of optical fiber. The results are used later as a baseline to compare with results measured with an IP/MPLS network.
8.1.1 Channel delay The channel latency time was measured to be 2.860 ms. The latency is attributed to optical transmissions along the fibers. When comparing this measurement with relay latency time with the IP/MPLS network which was 4.218 ms (see section 8.3.3.2 below), it can be concluded that the delay introduced by the IP/MPLS network routers is 4.218 ms – 2.860 ms = 1.358 ms.
Page 18 of 41
L in e D iff er e n ti al P r o t ec t io n o v er IP / MP L S
Test Report
8.1.2 Tripping time 8.1.2.1 Test procedures The test scheme of using a pair of optical fiber to connect relay P545 A and relay P545 B directly, is shown in Fig. 7. The wiring connection with Omicron was already shown in Fig. 3 above. The Omicron was used to inject state sequence Phase A current into the two relays, with input currents set to 1A, 2A, 5A, and 10A. Testing for each current setting was repeated 50 times. The Omicron recorded all the differential operation times, and then calculated the average operation time.
Fig. 7 Direct connection between two protection relays
8.1.2.2 Test results The test results are shown as following table and Fig. 8. From the test results, it is observed that :
The relay operation time (tripping time) becomes shorter as the input current increases;
The operation time is always well under 35 ms which is the maximum limit allowed by the protection application. Injected current (Amp) 1 2 5 10
Relay P545 A P545 B P545 A P545 B P545 A P545 B P545 A P545 B
Average tripping time (ms) 27.072 26.916 25.887 25.664 24.846 24.444 24.386 24.002 Page 19 of 41
L in e D iff er e n ti al P r o t ec t io n o v er IP / MP L S
Test Report
direct connection 36
Tripping time (ms)
34 32
30 28 direct
26 24 22 20 0
100
200
300
400
Current (0-99:1A, 100-199:2 A,200-299:5A, 300-399:10A)
Fig. 8 Differential tripping time when directly connected
8.1.3 Current measurement data accuracy The objective of this test case is to analyze the accuracy of differential current calculation by the relays to compare with the results in an IP/MPLS network .
8.1.3.1 Test procedures The Phase A current output of Omicron was connected to Phase A currents of Relay A and Relay B. Phase A current of Relay A and that of Relay B were in reverse series. Different currents of 100 mA, 200 mA, 500 mA, 1A, 2A, and 5A were injected to Relay A and Relay B. Then the values of IA Local, IA Angle Local, IA Remote, IA Angle Remote, IA Diff and IA Bias in each relay were recorded.
8.1.3.2 Test results By using Courier Browser to poll the data at an interval of 250ms for 250 times for analysis, IA differential absolute error and percentage error for both Relay A and Relay B are shown in Fig. 9 and Fig. 10.
Page 20 of 41
L in e D iff er e n ti al P r o t ec t io n o v er IP / MP L S
Test Report
Interval Interval Interval Interval Interval Interval Interval
0-1500 is for Relay A, Interval 1500-3000 is for Relay B 0-250, 1500-1750: injected current = 100mA 250-500, 1750-2000: injected current = 200mA 500-750, 2000-2250: injected current = 500mA 750-1000, 2250-2500: injected current = 1A 1000-1250, 2500-2750: injected current = 2A 1250-1500, 2750-3000: injected current = 5A
Differential current error (mA) 250 200 150 100 50 0
0
250
500
750
1000
1250
1500
1750
2000
2250
2500
2750
3000
3250
Direct connection
Fig. 9 Differential current error (mA) when directly connected
Differential current percentage error (%) 4.00% 3.00% 2.00% 1.00% 0.00% 0
250
500
750
1000
1250
1500
1750
2000
2250
2500
2750
3000
Direct connection
Fig. 10 Differential current percentage error (%) when directly connected
Page 21 of 41
3250
L in e D iff er e n ti al P r o t ec t io n o v er IP / MP L S
Test Report
Differential current error (mA) = IA Diff Differential current percentage error (%) = IA Diff/ (IA Local + IA Remote) *100% The result shows:
differential current error becomes greater when the inject current increases, and the max percentage error is under 5% which is acceptable.
8.2 IP/MPLS without background traffic Test case 8.2 is to evaluate the protection performance when relays are connected via the IP/MPLS test bed network without background network traffic.
8.2.1 Test procedures The two relays were connected through the IP/MPLS test bed as shown in Fig. 11. The primary path was P545A—SAR8-R1—SAR8-R2—P545B, the host standby path was P545A—SAR8-R1— SAR8-R3— SAR8-R2—P545B. The wiring connection with Omicron was shown in Fig. 3. Then the Omicron was used to inject state sequence Phase A current into the two relays, with input currents being 1A, 2A, 5A, and 10A. Testing for each current setting is repeated 50 times. The Omicron will record all the differential operation times of two relays, and then calculate the average operation time.
Fig. 11 Routers between two relays
8.2.2 Tripping performance test results
Page 22 of 41
L in e D iff er e n ti al P r o t ec t io n o v er IP / MP L S
Test Report
The test results for the primary path are shown in the table, and the differential tripping time is plotted for direct connection and MPLS without background traffic in Fig. 12 and Fig. 13 below.
Two 7705 SAR-8 Relay 1 Amp Relay Relay 2 Amps Relay Relay 5 Amps Relay Relay 10 Amps Relay
MPLS
A B A B A B A B
Avarage tripping time (ms) 28.146 27.902 27.038 27.003 26.49 26.218 25.898 25.5
direct
36 34
Tripping time (ms)
32
30 28 26 24 22 20 0
50
100
150
200
250
300
350
400
450
Current (0-99:1A, 100-199:2 A,200-299:5A, 300-399:10A)
Fig. 12 Differential tripping time for direct connection and MPLS without traffic
Page 23 of 41
L in e D iff er e n ti al P r o t ec t io n o v er IP / MP L S
Test Report
Average tripping time 30.00
Average tripping time(ms)
29.00 28.00
27.00 Direct 26.00
IP/MPLS (1hop)
25.00 24.00 23.00 1A
1A
2A
2A
5A
5A
10A 10A
Fig. 13 Average differential tripping time for direct connection and MPLS without traffic Tripping times in IP/MPLS scenario are compared with those of direct connect scenario (see the graph below). The following conclusions can be drawn from the results that:
the tripping time for IP/MPLS scenario is very close to that of direct connect scenario; this shows that the delay incurred in each router hop is not significant; it is found that the average tripping time increase in the IP/MPLS scenario is under 1.37 ms while the maximum is 1.51 ms
This is consistent with the measured router processing latency which is 1.46 ms, as discussed in section 8.1 above.
8.3 IP/MPLS with background traffic 8.3.1 Traffic profiles The Jperf 2.0.2, a Java-based tool in Windows environment, was used to generate background load. It was used to generate traffic in TCP and UDP format to load up the network to investigate how network loading can impact protection applications performance.
Jperf Client: as the background traffic sender.
Jperf Server: as the background traffic receiver.
Page 24 of 41
L in e D iff er e n ti al P r o t ec t io n o v er IP / MP L S
Test Report
Fig. 14 shows how the Jperf tool is connected to the network.
Fig. 14 Network traffic injected into the IP/MPLS test bed In this test case, as shown in Fig. 15 and 16, two loads with different packet length were used:
1024 Bytes
Fig. 15 1024 Bytes Client
Page 25 of 41
L in e D iff er e n ti al P r o t ec t io n o v er IP / MP L S
Test Report
128 Bytes
Fig. 16 128 Bytes Client
8.3.2 QoS configuration in 7705 SAR-8 QoS is a router capability to provide differentiated and consistent service level under all circumstances. There are three steps in a QoS scheme:
Classifying user traffic into different forwarding class
Marking user traffic for differentiated services
Applying differentiated services to user traffic.
Once user traffic is classified, it must be marked for differentiated services using a protocol such as 802.1P in an Ethernet frame; diffserv codepoint (DSCP), formerly known as IP precedence, in an IP packet; or Class of service (CoS) bits, previously known as EXP bits, in a MPLS frame Based on the packet marking. Based on the QoS policy configured, different level of traffic management will be applied to meet different level of service level required.
Page 26 of 41
L in e D iff er e n ti al P r o t ec t io n o v er IP / MP L S
Test Report
1. Traffic Classification Sap-ingress: Based on classification at the SAP, user traffic is mapped to different forwarding class 2. Network queue Network queue: Configure the pir (peak information rate) and cir (committed information rate) for different queue. Set high priority forwarding queue for the protection application traffic. Below shows the 7705 SAR-8 QoS configuration 7705SAR8_1 Qos configuration 1. Create sap-ingress Sap-ingress 101 create //Create sap-ingress 101, classify all the traffic to l2. queue 1 create exit queue 2 create exit fc "l2" create queue 2 exit default-fc "l2" exit Sap-ingress 102 create //Create sap-ingress 102, classify all the traffic to h1. queue 1 create exit queue 2 create exit fc "h1" create queue 2 exit default-fc "h1" exit 2. Apply the sap-ingress cpipe 1 customer 1 vc-type cesopsn create sap 1/2/1.1 create cem asym-delay-control samples 32 min-repeat 4 packet jitter-buffer 1 payload-size 3 exit ingress qos 102 //Apply sap-ingress 102 exit exit
Page 27 of 41
L in e D iff er e n ti al P r o t ec t io n o v er IP / MP L S
Test Report
spoke-sdp 101:1 create no shutdown exit no shutdown exit ies 10 customer 1 create interface "client" create address 10.2.1.1/24 sap 1/1/8 create ingress qos 101 //Apply sap-ingress 101 exit exit exit 3. Create network queue policy network-queue "10" create //Create network queue 10 queue 1 create high-prio-only 10 exit queue 2 create // exit queue 3 expedite create //set queue 3 cir rate 100 cir 50 exit queue 9 multipoint create high-prio-only 10 exit fc h1 create multicast-queue 9 queue 3 //Specified h1 to queue 3 exit fc l2 create multicast-queue 9 queue 2 //Specified l2 to queue 2 exit exit 4. Apply the network-queue *A:SAR8-1# configure port 1/1/2 *A:SAR8-1>config>port# info ---------------------------------------------ethernet mode network mtu 3014 Page 28 of 41
L in e D iff er e n ti al P r o t ec t io n o v er IP / MP L S
Test Report
network queue-policy "10" //Apply network queue on egress exit ssm no shutdown exit egress-rate 100000 exit no shutdown ---------------------------------------------*A:SAR8-1>config>port# *A:SAR8-1# configure card 1 mda 1 *A:SAR8-1>config>card>mda# info ---------------------------------------------mda-type a8-1gb-v2-sfp fabric-stats-enabled network ingress fabric-policy 2 queue-policy "10" // Apply network queue on ingress exit exit access ingress fabric-policy 2 exit exit no shutdown ---------------------------------------------*A:SAR8-1>config>card>mda#
8.3.3 Channel delay under congestion This test case investigates what the impact is on channel delay when the network is congested by low-priority traffic. QoS in the network will be toggled on and off to see its impact on channel delay.
8.3.3.1 Test procedures The following settings were toggled on and off in different combinations to investigate their impacts on protection performance: -
QoS (prioritize protection relay traffic over background traffic)
-
Asymmetrical delay control (ADC)
Page 29 of 41
L in e D iff er e n ti al P r o t ec t io n o v er IP / MP L S
Test Report
-
Load of packet size of 128 bytes and 1024 bytes
Courier Browser was used to poll the Ch1 Prop Delay of both relays at a time interval of 250ms for 500 times to calculate the average channel delay time. The test cases and results are summarized in the following tables.
Test ID
Test Case 1
7705 SAR-8 Configurations ADC QoS UDP packet size N
N
N/A
Test Case 2
N
N
1024 Bytes
Test Case 3
N
Y
1024 Bytes
Test Case 4
Y
N
1024 Bytes
Test Case 5
Y
Y
1024 Bytes
Test Case 6
Y
N
128 Bytes
Test Case 7
Y
Y
128 Bytes
Traffic load conditions Description
No background traffic load 400 Mb/s 1024 bytes long background traffic; 7705 SAR-8 network port rate-limited to 100 Mb/s 400 Mb/s 1024 bytes long background traffic; 7705 SAR-8 network port rate-limited to 100 Mb/s 400 Mb/s 1024 bytes long background traffic; 7705 SAR-8 network port rate-limited to 100 Mb/s 400 Mb/s 1024 bytes long backgroundtraffic; 7705 SAR-8 network port rate-limited to 100 Mb/s 160 Mb/s 128 bytes long background traffic7705 SAR-8 network port rate-limited to 100 Mb/s 160 Mb/s 128 bytes long background traffic7705 SAR-8 network port rate-limited to 100 Mb/s
Table 8-3-3-1 Different network configuration combinations
8.3.3.2 Test results The recorded channel delay time are shown in Table 8-3-3-2. Page 30 of 41
L in e D iff er e n ti al P r o t ec t io n o v er IP / MP L S
Test Report
Test ID
Max time (ms) 4.339
Min time (ms)
PDV (Max – Min)
Remarks
Test case 1
Average time (ms) 4.218
4.120
0.219
Test case 2
----
----
----
----
Test case 3
4.237
4.421
4.144
0.277
Test case 4
----
----
----
----
Test case 5
4.356
4.577
4.261
0.316
Test case 6
----
----
----
----
Test case 7
4.365
4.482
4.257
0.225
Relay works OK. No alarm and err messages. Ch1 Prop Delay not available, Err Msg, signal fail alarm, C Differential Failure alarm, Invalid Msg Fmt alarm. Relay works OK. No alarm and err messages. Ch1 Prop Delay not available, Err Msg, signal fail alarm, C Differential Failure alarm, Invalid Msg Fmt alarm. Relay works OK. No alarm and err messages. Ch1 Prop Delay not available, Err Msg, signal fail alarm, C Differential Failure alarm, Invalid Msg Fmt alarm. Relay works OK. No alarm and err messages.
Table 8-3-3-2 Channel delay time The channel delay time was not available for test case 2, 4 and 6, in which QoS was turned off, due to the message lost caused by heavy network congestion. With QoS turned back on, as in test cases1, 3, 5 and 7, the operation was restored to normal. It demonstrates that QoS is crucial for the network to consistently deliver the performance required by the protection application.
8.3.4 Current measurement data accuracy under
congestion
The objective of this test case is to investigate the impact of network congestion on data alignment by the two relays running in ping-pong mode. The accuracy of differential current calculation by the relays is analyzed.
8.3.4.1 Test procedures Inject different types of background traffic flows to create congestion on the network, as shown in Table 8-3-4. Connect the Phase A current output of Omicron to Relay A and Relay B, as shown in Fig. 17. Inject different current of 100 mA, 200 mA, 500 mA, 1A, 2A, and 5A to Relay A and Relay Page 31 of 41
L in e D iff er e n ti al P r o t ec t io n o v er IP / MP L S
Test Report
B. Then record the values of IA Local, IA Angle Local, IA Remote, IA Angle Remote, IA Diff and IA Bias under each current value on the relays. 7705 SAR-8 Configurations Jitter Payload ADC QoS buffer size
UDP packet size
Test Case 1
1
3
N
Y
128 Bytes
160 Mb/s of 128 bytes long background traffic with 128 bytes; s7705 SAR-8 network port ratelimited to 100 Mb/s
Test Case 2
1
3
N
Y
1024 Bytes
400 Mb/s of 1024 bytes long background traffic with 1024 bytes,; 7705 SAR-8 network port rate-limited to 100 Mb/s
Test ID
Traffic load conditions Description
Table 8-3-4 Different background flows
Fig. 17 Connections between Omicron and protection relays
8.3.4.2 Test results By using Courier Browser to poll the data at an interval of 250ms for 250 times, IA differential error data for both Relay A and Relay B are plotted in Fig. 18 and Fig. 19. The graph for test case 3 in which the relays were directly connected has been shown previously in section 8.1.3 but repeated here for comparison. Interval Interval Interval Interval Interval Interval Interval
0-1500 is for Relay A, Interval 1500-3000 is for Relay B 0-250, 1500-1750: injected current = 100mA 250-500, 1750-2000: injected current = 200mA 500-750, 2000-2250: injected current = 500mA 750-1000, 2250-2500: injected current = 1A 1000-1250, 2500-2750: injected current = 2A 1250-1500, 2750-3000: injected current = 5A
Page 32 of 41
L in e D iff er e n ti al P r o t ec t io n o v er IP / MP L S
Test Report
Differential current error (mA) 250 200 150 100 50 0
0
250
500
750
1000
1250
Test Case 1
1500
1750
Test Case 2
2000
2250
2500
2750
3000
3250
2750
3000
3250
Test Case 3
Fig. 18 Differential current measurement error
Differential current percentage error (%) 4.00% 3.50% 3.00% 2.50% 2.00% 1.50% 1.00% 0.50% 0.00% 0
250
500
750
1000
1250
Test Case 1
1500
1750
Test Case 2
2000
2250
2500
Test Case 3
Fig. 19 Differential current measurement percentage error
Note: Test Case 3 is the directly-connected scenario (8.1.3). Differential current error (mA) = IA Diff Differential current percentage error (%) = IA Diff/ (IA Local + IA Remote) *100% The result shows:
Page 33 of 41
L in e D iff er e n ti al P r o t ec t io n o v er IP / MP L S
Test Report
the differential current error becomes greater when the inject current increases, and the max percentage error is under 5% which is acceptable;
background traffic flow packet size has negligible impact on measurement accuracy; this is due to the use of high speed Gigabit Ethernet link connecting in the network.
8.3.5 Tripping time under congestion This test is to investigate the impact of network congestion on tripping time.
8.3.5.1 Test procedures The connection between the two relays in IP/MPLS is shown in Fig 7. The primary path is P545A— SAR8-R1—SAR8-R2—P545B and the hot standby path is P545A—SAR8-R1—SAR8-R3— SAR8-R2— P545B. The wiring connection is as shown in Fig 3. Different types of background traffic flows, as shown in Table 8-3-5-1, is configured to create congestion on the network,. The Omicron was used inject state sequence Phase A current for the two relays with input current equal to 1A, 2A, 5A, and 10A. Repeat the test for 50 times for each case. The Omicron then recorded all the differential operation times, then calculate the average operation time.
Test ID
Test Case 1
Test Case 2
7705 SAR-8 configurations ADC QoS UDP packet size N
N
Y
Y
Network load conditions Description
128 Bytes
160 Mb/s of 128 bytes long background traffic; 7705- SAR-8 network port rate-limited to 100 Mb/s
1024 Bytes
400 Mb/s of 1024 bytes long background traffic ; 7705SAR-8 network port rate-limited to 100 Mb/s
Table 8-3-5-1 Different background flows
8.3.5.2 Test results The test results for the differential tripping time are shown in Table 8-3-5-2 and Fig. 20 below.
Test ID Test Case 1
Current Input(A) 1
Average tripping time(ms) 28.616
Max time (ms) 31.300
Min time (ms) 25.400
Page 34 of 41
L in e D iff er e n ti al P r o t ec t io n o v er IP / MP L S
Test Report
Test case 2
2
27.670
32.100
24.500
5
26.711
30.300
23.700
10
26.223
28.700
23.100
1
28.584
33.200
25.600
2
27.707
31.300
24.100
5
26.571
29.300
23.700
10
26.223
30.200
23.200
Table 8-3-5-2 Differential tripping time 36
34
Tripping time (ms)
32 30 28
Test Case 1
26
Test Case 2
24 22 20 0
100
200
300
400
500
Current (0-99:1A, 100-199:2 A,200-299:5A, 300-399:10A)
Fig. 20 Differential tripping time To compare with the tripping time test results as that of section 8.1.2 direct connection and section 8.2 IP/MPLS without background traffic, the average tripping time for the 4 test cases are summarized in the following table and Fig. 21.
Note: Test case 3 is the directly connected scenario (8.1.2) while test case 4 is that of IP/MPLS network with no background load (8.2)
Test ID Test Case 1
Current Input(A) 1
Average tripping time(ms) 28.616
Page 35 of 41
L in e D iff er e n ti al P r o t ec t io n o v er IP / MP L S
Test Report
Test case 2
Test Case 3
Test Case 4
2
27.67
5
26.711
10
26.223
1
28.584
2
27.707
5
26.571
10
26.223
1
26.994
2
25.776
5
24.645
10
24.194
1
28.024
2
27.021
5
26.354
10
25.699
Average tripping chart 29.00 Average tripping time (ms)
28.50 28.00 27.50 27.00 26.50
Test Case 1
26.00
Test Case 2
25.50
Test Case 3
25.00
Test Case 4
24.50 24.00 23.50 0
2
4
6
8
10
12
Phase A Current (A)
Fig. 21 Differential tripping time The result shows:
The relay tripping time is shorter when the input current increases
Page 36 of 41
L in e D iff er e n ti al P r o t ec t io n o v er IP / MP L S
Test Report
When compared with tripping time with no background traffic, the average tripping time increase is insignificant (under 1ms)
The operation time is mostly below 30 ms and is always less than 35 ms which is the maximum tripping time allowed
No significant performance difference between long size and short size of package; this is due to the use of Gigabit Ethernet link connecting the two routers.
8.3.6 Channel communications failure recovery time 8.3.6.1 Test procedures The test scheme is as shown in Figure 4. The Omicron was used to inject phase A current output with 1A to both relay A and relay B, as shown in the Figure 12. The optical fibers between 7705 SAR1 and 7705 SAR2 was disconnected to simulate a failure of the primary path, then the command line interface (CLI) commands on 7705 SAR1 and 7705 SAR2 were executed to verify whether the differential protection traffic transmitted over the IP/MPLS network has been switched to the backup path. The messages of the relays were monitored:
Differential current (IA Diff should be 0A);
The Ch1 Prop Delay
Error messages
Alarms/logs
After the switchover was completed, the optical fibers between 7705 SAR1 and 7705 SAR2 was re-connected to restore the communications channel, the CLI commands on 7705 SAR1 and 7705 SAR2 were executed to check whether the teleprotection service traffic transmitted over the IP/MPLS network had now been switched back to the primary path. The differential current, latency, error messages, and alarms of the relay were checked.
8.3.6.2 Test results No alarms were reported, the latency, error message numbers and IA differential current percentage error on relay A and B are shown in Fig. 22 and Fig. 23 respectively. The results are summarized as below:
No alarms are reported but a few error messages (between 1 to 4) were reported during the channel communications failure detection and traffic switching;
No alarms and error messages are found when the channel restores from backup path to the primary path, due to the make-before-break feature; Page 37 of 41
L in e D iff er e n ti al P r o t ec t io n o v er IP / MP L S
Test Report
Latency with primary path and backup path are almost identical;
The IA Differential values on the two relays are normal.
5
5
4.5
4.5
4
4
3.5
3.5
Ch1 Prop Delay (ms)
3
Ch1 Prop Delay (ms)
3
No. Err Mess
2.5
IA Diff error (%)
2
No. Err Mess
2.5
IA diff error (%)
2
1.5
1.5
1
1
0.5
0.5
0
0 0
200
400
600
Fig. 22 Relay A
0
200
400
600
Fig. 23 Relay B
9 Results and conclusion 9.1 Test results summary All test cases were conducted with protection relay configured in ping pong mode, and the 7705 SAR-8 TDM playout buffer and payload sizes were set to 1 and 3 respectively. Test results are summarized in the table below: Test cases
Channel delay
Test Scenarios Direct connection No background traffic load 400 Mb/s of 1024 bytes long background traffic (4 times oversubscription), 7705 SAR-8 network port rate-limited to 100Mb/s, QoS enabled. 400 Mb/s of 1024 bytes long background traffic (4 times oversubscription), 7705 SAR-8 network port rate-limited to 100
Test results 2.86 ms Average network latency = 4.218 ms; no alarm and no Err Msg Average network latency = 4.237 ms; no alarm and no Err Msg
Conclusion PASS PASS
Network latency measurement not available, Err Msg, signal fail alarm, C Differential
QoS is absolutely required to pass
PASS
Page 38 of 41
L in e D iff er e n ti al P r o t ec t io n o v er IP / MP L S
Test Report
Mb/s, QoS disabled 400 Mb/s of 1024 bytes long background traffic (4 times oversubscription), 7705 SAR-8 network port rate-limited to 100M, both QoS and ADC enabled 400 Mb/s of 1024 bytes long background traffic (4 times oversubscription), 7705 SAR-8 network port rate-limited to 100M, no QoS, with ADC enabled 400 Mb/s of 1024 bytes long background traffic (4 times oversubscription), set 7705 SAR-8 network port rate-limited to 100M, both QoS and ADC enabled 160 Mb/s 128 bytes long background traffic (1.6 times oversubscription), 7705 SAR-8 network port rate-limited to 100 Mb/s, QoS disabled, ADC enabled 160 Mb/s 128 byte background traffic(1.6 times oversubscription), 7705 SAR-8 network port ratelimited to 100 Mb/s, QoS and ADC enabled Direct Connection
Current measurement data accuracy
Tripping time
160 Mb/s of 128 bytes long background traffic with 128 bytes, 7705 SAR-8 network port ratelimited to 100 Mb/s 400 Mb/s of 1024 bytes long background traffic with 1024 bytes, 7705 SAR-8 network port ratelimited to 100 Mb/s No background flow 160 Mb/s 128 byte background traffic (1.6 times oversubscription), 7705 SAR-8 network port ratelimited to 100 Mb/s 400 Mb/s 1024 bytes long background traffic (4 times oversubscription), 7705 SAR-8 network port rate-limited to 100
Failure alarm, Invalid Msg Fmt alarm are reported. Average network latency = 4.356 ms; no alarm and no Err Msg.
PASS
Latency measurement not available, Err Msg, signal fail alarm, C Differential Failure alarm, Invalid Msg Fmt alarm are reported. Average network latency = 4.356 ms; no alarm and no error Msg.
QoS is absolutely required to pass
Latency is not available, Err Msg, signal fail alarm, C Differential Failure alarm, Invalid Msg Fmt alarm are reported. Average network latency = 4.365 ms; no alarm and error message.
QoS is absolutely required to pass
PASS
PASS
The percentage error is PASS under 5%. The percentage error is PASS under 5%. The percentage error is under 5%.
PASS
Max < 30 ms Max < 33 ms
PASS PASS
Max < 35 ms
PASS
Page 39 of 41
L in e D iff er e n ti al P r o t ec t io n o v er IP / MP L S
Test Report
Channel communicatio ns recovery
Mb/s Disconnect and re-connect router < 50 ms * connection to the network No alarms but error message(s) were reported; when reconnecting, no alarm nor error message were reported
PASS
Table 9-1 Test results summary * Recovery time is estimated based on the number of error messages since the required tester is not available
9.2 Conclusion Tests to validate transporting line differential protection traffic over an IP/MPLS network were completed successfully. From the test results, the following lessons can be drawn:
Network QoS must be in place throughout the network to assure normal communications between relays during network congestion
IP/MPLS has robust QoS since the protection performance is not degraded even in the case of severe congestion with background traffic (4 times oversubscription)
IP/MPLS has strong resiliency to recover from communications failure
Since jitter-buffer and payload-size configuration parameters can impact the end-to-end teleprotection channel delay significantly, they need to be optimized to cater for delay requirement, network jitter and bandwidth availability
Depending on the input current (1A to 10A), the average tripping time varies between 25.5 to 28.1 ms. This is well under the maximum allowed time of 35 ms
The extra tripping time incurred by IP/MPLS routers is very small. It is in the range of 1 to 2 ms, well under 2 ms
The differential current measurement accuracy is not impacted under severe congestion (4 times oversubscription) in IP/MPLS network
Page 40 of 41
L in e D iff er e n ti al P r o t ec t io n o v er IP / MP L S
Test Report
The channel delay is affected by the jitter buffer and payload size configuration. These two parameters are configurable to optimize communication delays depending on the delay budget and network bandwidth
Differential protection traffic on primary LSP can be switched to backup LSP automatically by 7705 SAR-8 with no impact on line differential protection (except for a few error messages reported by the protection relays).
From this investigation, it is concluded that with proper network configurations, IP/MPLS network can consistently meet the stringent communications requirements imposed by line differential protection. Therefore IP/MPLS is fully qualified to transport this safety-critical grid application.
10 Acknowledgement This collaborative project was conducted in two phases over a period of 6 months. Lifan Yang (Schneider Electric) and Fulei Yang (Nokia) initiated and led the project to successful completion. Hansen Chan (Nokia) provided technical advice throughout. Vincent Gao (Nokia) and Anthony Lam (Nokia) supplied 7705 SAR and other required technical resources. Pin Wei (Schneider Electric) and Xiongbo Bao (Nokia) conducted the test and prepared this test report. James Jin (Nokia) also rendered support to this endeavour.
Page 41 of 41