Lifetime distribution of localized excitons in InGaN quantum dots M. Winkelnkemper∗ ,† M. Dworzak, T. Stempel Pereira‡ , T. Bartel§ , L. Reißmann¶ , A. Schliwa∗∗ , A. Strittmatter, A. Hoffmann, and D. Bimberg Institut f¨ ur Festk¨ orperphysik, Technische Universit¨ at Berlin, Hardenbergstraße 36, D-10623 Berlin, Germany (Dated: September 7, 2007) Time- and energy-resolved photoluminescence (PL) measurements on InGaN/GaN quantum dots (QDs) are presented. Although the PL decay is strongly non-exponential for all detection energies, excitation density dependent measurements yield no indication for dynamical screening effects. We show that the non-exponential decay is well explained with a broad distribution of excitonic lifetimes within the QD ensemble. Using an inverse Laplace transformation, we derive an energy-dependent lifetime distribution function, which is in very good agreement with recently published single-QD time-resolved PL measurements. Within the framework of eight-band k·p theory, we calculate the dependence of the radiative excitonic lifetimes on structural parameters, like QD height, lateral diameter, and chemical composition. The built-in piezo- and pyroelectric fields cause a sensitive dependence of the radiative lifetimes on the exact QD geometry and composition, resulting in a broad lifetime distribution even for moderate variations of the QD structure. PACS numbers: Valid PACS appear here
I.
INTRODUCTION
The InGaN/GaN system has evolved to one of the most important material systems for solid-state light emitters. Recently developed applications include green and blue light emitting diodes (LEDs),1,2 laser diodes (LDs),3,4 and white light emitters.5–7 Despite tremendous advances in this research field, some group-III-nitride-typical material properties still pose continuous problems for the incorporation of InGaN active layers in optoelectronic devices. In particular the large built-in piezo- and pyroelectric field within InGaN quantum wells (QWs)—which are mostly grown on the (0001) surface—affect device performance via the quantum-confined Stark effect (QCSE), resulting in long radiative lifetimes and a blue shift of the emission wavelength at high-power operation due to dynamical screening effects.? Zitat gesucht Already at early stage of research the enormous light efficiency of InGaN devices was attributed to quantumdot (QD) properties of localization centers within the InGaN layer(s).8–11 In addition to well-established benefits of quantum dots (QDs), like high temperature stability and low threshold currents,12–14 InGaN QDs have the advantage over InGaN QWs that the dynamic blue-shift is efficiently suppressed.15
∗ Also
at: Fritz-Haber-Institut der Max-Planck-Gesellschaft, Faradayweg 4-6, D-14195 Berlin, Germany ‡ Current address: Division of Solar Energy, Hahn-Meitner-Institut Berlin GmbH, Glienicker Strasse 100, D-14109 Berlin, Germany § Current address: National Center for Electron Microscopy, Material Sciences Division, Lawrence Berkeley National Laboratory, One Cyclotron Rd., Berkeley 94720, USA ¶ Current address: Institut f¨ ur Experimentelle Physik, Otto-vonGuericke-Universit¨ at Magdeburg, D-39016 Magdeburg, Germany ∗∗ Current address: Weierstrass Institut f¨ ur Angewandte Analysis und Stochastik, D-10117 Berlin, Germany
Time-resolved photoluminescence (TRPL) measurements are an excellent tool to investigate the effects of the built-in piezo- and pyroelectric fields, which strongly affect the carrier dynamics in the QDs. Both, the charge carrier separation by the QCSE (and the corresponding increase of the radiative lifetimes) and its dynamical screening are visible in TRPL.
In this article, we present energy-resolved TRPL measurements of the ensemble luminescence of InGaN/GaN QDs, which form due to spinodal decomposition in ultrathin (2 nm) InGaN layers. All measured decays are strongly non-exponential. Excitation density dependent measurements yield no indications for dynamical screening processes. (Sec. II) Using an inverse Laplace transformation, we show that, if a broad distribution of excitonic lifetimes is assumed as origin of the non-exponential decay, the non-exponential macro-PL decay provides a consistent picture with recently published single-QD TRPL measurements.16 (Sec. III) Using eight-band k·p modeling we analyze the dependence of the radiative lifetimes on the structural properties of the QDs. We find that a broad distribution of excitonic lifetimes can only be explained if the built-in electric fields are present in the QDs. An ensemble of field-free QDs yields a very narrow lifetime distribution, the individual lifetimes are independent from variations of the QD structure. If, on the other hand, the piezo- and pyroelectric fields are included in the calculations, even slight variations of the QDs lead to pronounced changes of the radiative excitonic lifetimes. Thus, variations of the QDs’ structural properties within the ensemble lead to a broad distribution of radiative lifetimes. (Sec. IV)
2 II.
SAMPLE PREPARATION AND EXPERIMENTAL RESULTS
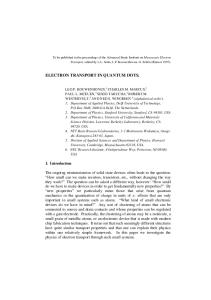
The sample investigated in this work was grown on Si(111) substrate by low-pressure metal-organic chemical vapor deposition using a horizontal AIX200 RF reactor. An AlAs layer was grown and subsequently converted to AlN as a nucleation surface.17 In the following step an Al0.05 Ga0.95 N/GaN buffer layer was grown at T=1150 ◦ C up to a total thickness of 1 µm. The InGaN layer was grown at 800 ◦ C with a nominal thickness of 2 nm using trimethylgallium, trimethylindium, and ammonia as precursors. The QDs form within the InGaN-layer due to spinodal decomposition.18 The growth was finished with a 20 nm GaN cap layer grown during the heat-up phase to 1100 ◦ C. The sample was investigated by TRPL spectroscopy. The QD luminescence was excited at 353 nm by the second harmonic wave of a mode-locked Ti:sapphire laser. The temporal width of the laser pulses was 2 ps at a repetition rate of 80 MHz. The measurements were performed in a helium-flow microscope cryostat at a temperature of 5 K. The luminescence light was collected through a microscope objective. The detection system consists of two 0.35 m McPherson monochromators in subtractive mode and an ultrafast photo detector (multi-channel plate) providing a spectral resolution of about 0.6 meV and a temporal resolution better than 30 ps. The PL spectrum of the entire QD ensemble has its maximum at 3.05 eV and a full width at half of maximum (FWHM) of 75 meV. Sharp emission lines of discrete QD states were observed from 2.8 to 3.2 eV indicating QD origin of the entire emission.16,18 Further experimental details and the results of single dot TRPL are given elsewhere.16 Figure 1 shows the temporal evolution of the PL of the InGaN-QD ensemble at different detection energies. The PL decay is non-exponential for all transition energies, which is typical for such InGaN layers.19–22 Two different mechanisms, responsible for the non-exponential decay, have been proposed in the literature: (a) Temporally varying lifetimes due to dynamical screening effects23,24 and (b) a broad lifetime distribution within the QD ensemble.16 The first mechanism proposes the screening of the quantum-confined Stark effect (QCSE) by photogenerated charge carriers. At low excitation densities electrons and holes are spatially separated by the huge piezo- and pyroelectric fields within the QDs. Their wave-function overlap is reduced, and thus, the excitonic lifetimes are long. Carriers generated by the short laser pulses screen the electric fields and, hence, the excitonic lifetimes decrease. Thus, the luminescence starts with a fast decay becoming slower while the excitons recombine. Consequently, stronger laser pulse would lead to a faster PL decay in the beginning than weaker ones and the shape of the transient would depend on the excitation power. The PL decay of the investigated sample, however, does not show an excitation density dependence (Fig. 2). Also the mono-exponential decays observed in
FIG. 1: Time-resolved PL of InGaN QD subensemble at different detection energies. The PL decays have been fitted (white lines) using the Kohlrausch function (Eq. 1). The inset shows the time-integrated PL of the sample. Black arrow indicate the detection energies for the three TRPL decays shown. The shape of the PL peak is attributed to FabryP´erot oscillations.
single-QD TRPL experiments16 contradict the screening hypothesis. As we will show in the following, the nonexponential decay of the ensemble PL can be fully understood in terms of a broad lifetime distribution within the ensemble and without any dynamical screening effects.
III.
DISTRIBUTION OF EXCITONIC LIFETIMES
In contrast to QDs in other material systems, the present InGaN/GaN QDs show no unambiguous correlation between the measured excitonic lifetimes and transition energies. Quantum dots with identical transition energies, but significantly different excitonic lifetimes, have been found in single-QD TRPL.16 [black symbols in Fig. 4(b)] The broad lifetime distribution results in the non-exponential decay of the ensemble PL. All QDs with the same excitonic transition energy E
3 can be considered as a subensemble within the entire QD ensemble. In each subensemble the number of QDs with a given exciton lifetime τ shall be described by the distribution function fE (τ ). This distribution function can, in principle, be determined by investigating the decay of a large number of single QDs for each transition energy using single-QD TRPL. However, this is clearly not feasible, given the experimental difficulties of time-resolved single-dot spectroscopy on InGaN QDs.16,20,25 On the other hand, an approximation of fE (τ ) can also be extracted from the TRPL measurements on the (energyselected) subensembles: The non-exponential subensemble PL decays can be approximated by the Kohlrausch (or stretched exponential) function26 (solid white lines in Fig. 1) IE (t) = IE,0 exp[−(t/τE∗ )βE ] ,
(1)
where τE∗ and βE are the time and stretching parameters for the given energy. τ ∗ is identical to the decay time of the system τ only if β = 1. It has no direct physical meaning for β 6= 1. Both parameters vary for different QD subensembles. (Fig. 3) The (non-exponential) PL decay of each QD subensemble can be expressed as an integral over the (exponential) single-QD PL decays of all QD which form the subensemble. Thus, using the Kohlrausch function to describe the decay, we can expand Eq. 1 to I(t) ∝ exp[−(t/τE∗ )βE ] ∝ FIG. 2: Time-resolved PL of InGaN QD ensemble at fixed detection energy (3.05 eV) for different excitation intensities. A shorter PL decay with increasing excitation intensity due to dynamical screening effects could not be observed.
FIG. 3: Parameters (β and τ ∗ ) of the Kohlrausch function as a function of the transition energy.
Z
∞
fE (τ ) exp(−t/τ )dτ
.
0
(2) Mathematically, the subensemble decay IE (t) is, hence, the Laplace transformation of the lifetime distribution function fE (τ ) within the subensemble, which can thus be obtained by an inverse Laplace transformation of I(t).27,28 The results of the inverse Laplace transformation are shown in Fig. 4. A broad distribution of lifetimes for all transition energies is found, in good agreement with the single-QD TRPL results from Ref. 16 [black symbols in Fig. 4(b)], which also show an appreciable scatter for identical transition energies. All single-QD time constants fall in the range covered by the lifetime distribution function. For GaN/AlN QDs a drastic increase of the excitonic lifetimes for lower transition energies has been reported,29 which is caused by the increasing QCSE for increasing QD height. Such an effect can not be observed in the lifetime distribution function in Fig. 4: The maximum of the distribution function is constants at ≈ 1.2 ns up to transition energies of ≈ 3.05 eV; for higher transition energies it shifts slightly to shorter lifetimes, accompanied by a pronounced broadening of the distribution. As will be alluded to in Sec. IV, the broadening of the distribution at higher transition energies can be explained with the delocalization of charge carriers that are only weakly bound in shallower localization centers.
4 The radiative lifetimes τrad of the confined excitons have been calculated by31 τrad =
2πε0 m0 c30 ~2 2 f n ˜ e2 Eex eff
.
(3)
Here, ε0 is the permittivity of free space, m0 the freeelectron mass, c0 is the vacuum speed of light, ~ the reduced Planck constant, and Eex the transition energy of the exciton. Thr¨anhardt et al.32 have shown that, in order to account for different refractive indices of the matrix material (nmatrix ) and the QD material (nQD ), n ˜ has to be calculated by n ˜=
FIG. 4: (a) Lifetime distribution functions fE (τ ), obtain by inverse Laplace transformation of the non-exponential PL decay of different InGaN QD subensembles (different detection energies E). The integral of each fE (τ ) is normalized to 1. (b) f (E, τ ) as gray-scale plot together with the decay times of single InGaN QDs reported in Ref. 16. The single-dot lifetimes agree well with the obtain distribution function.
IV.
QUANTUM DOT STRUCTURE AND RADIATIVE LIFETIMES
The broad lifetime distribution within the InGaN-QD ensemble can be understood in terms of varying electronhole wave-function overlaps for excitons confined in different QDs. We will show here that the different electronhole overlaps are caused by differences in the built-in piezo- and pyroelectric fields within each localization center. Therefore, we have calculated the radiative lifetimes of different InGaN QDs using a three-dimensional eightband k · p model. The model accounts for strain effects, piezoelectric and pyroelectric polarization, spin-orbit and crystal-field splitting, and coupling between the valence bands (VBs) and the conduction band (CB). Excitonic corrections have been included using a self-consistent Hartree (mean field) scheme. A detailed description of the method can be found elsewhere.30
9n5matrix (2n2matrix + n2QD )2
.
(4)
For the given emission energy of Eex ≈ 3 eV, we use nmatrix = 2.5 for the GaN matrix33 and nQD = 2.2 as an estimation for Inx Ga1−x N with x ≈ 0.3 − 0.5.34 The effective oscillator strength feff has been calculated by integrating the (anisotropic) oscillator strength fe over the unit sphere: Z 2~2 1 2 fe de ; fe = feff = |hϕe |e · p ˆ |ϕh i| . 4π ∂O m0 Eex (5) Here, |ϕi i are the involved electron an hole wave functions, and e is a unit vector indicating the polarization of the light. When calculating the matrix elements hϕe |ˆ p|ϕh i, contribution arising from the Bloch parts and the envelope-function parts of the wave functions have been accounted for. In accord with recent publications,35,36 the QDs have been modeled as ellipsoids with height h and lateral diameter d. They are embedded in a 2 nm thick InGaN quantum well (QW) with indium concentration xw . The indium concentration within the QDs increases linearly from the indium fraction of the surrounding QW (xw ) to the maximum indium concentration xc at the QD center. Starting with a QD with a height of h = 2 nm, a lateral diameter of d = 5.2 nm, and indium concentration of xc = 0.5, the influences of three different structural parameters on the radiative excitonic lifetimes have been investigated: The QD height (with h varying between 1.2 and 2.8 nm), the lateral diameter (with d varying between 2.8 and 7.6 nm), and the indium concentration within the QD (xc between 0.3 and 0.6). All three series have been calculated once embedded in an In0.1 Ga0.9 N QW, once embedded in an In0.05 Ga0.95 N QW, and once without a QW, embedded directly in the GaN matrix. In the last case QDs with slightly higher In concentration (xc = 0.7) or slightly larger diameter (d = 8.8 nm), respectively, have been included in order to cover the experimentally observed energy range. The calculated radiative lifetimes are shown in Fig. 5. The radiative lifetimes of excitons localized in the QDs are governed by the electron-hole wave-function overlap, which, in turn, depends on the spatial separation of the respective wave functions and their extensions.
5
FIG. 6: Comparison of the lifetime distribution function determined from the experimental PL decays (gray-scale, cf Fig. 4) and calculated excitonic lifetimes: White circles and gray lines show the theoretical values from Fig. 5(d), QDs with different indium concentrations embedded in a 10, 5, or 0 % InGaN QW. Black circles and dashed black lines show the same values but scaled by a factor of 0.5. The quantitative agreement with the experimental lifetime distribution is much better for the scaled values. The discrepancy by a factor of 0.5 between experiment and theory can be explained by, e.g., the uncertainties of the material parameters of Inx Ga1-x N (see text). FIG. 5: Radiative excitonic lifetimes vs. transition energies calculated with eight-band k · p theory: (a) All model QDs considered in this paper (see text), neglecting the built-in piezo- and pyroelectric fields. (b-d) As a function of the QD height, diameter, and composition, including piezo- and pyroelectric effects.
Neglecting the built-in piezo- and pyroelectric fields [Fig. 5(a)] all QDs show similar excitonic lifetimes of 0.70.9 ns. The radiative lifetimes are insensitive to the exact QD shape and composition. The trend to shorter lifetimes at larger transition energies is caused by the energy dependence of the transition probability. (Combining Eqs. 3 and 5 yields τrad ∼ 1/Eex for a given optical matrix element.) This lifetime distribution would lead to mono-exponential PL decay for all transition energies. Such a behaviour has been observed by S´en`es et al.37 for InGaN-QDs grown in a strain-induced growth mode by molecular beam epitaxy (MBE). In these QDs field effects seem to be negligible.37 For the MOCVD-grown QDs investigated in this work, however, a strong deviation from the mono-exponential decay has been observed for all transition energies. This behavior can only be explained if the built-in electrostatic fields are included in the calculations [Fig. 5(b-d)]. The radiative excitonic lifetimes now scatter over a wide range between 0.9 and 4.6 ns. Pronounced dependencies on the different structural parameters height, lateral size, and chemical composition can be observed. Interestingly, the radiative lifetimes significantly decrease, if the In concen-
tration of the surrounding QW is decreased from 10 to 5, or even 0 %. This is due to the reduction of biaxial strain within the QDs, which reduces the built-in piezoelectric potential and therefore the separation of the wave functions within the QD. Thus, not only the exact geometry and chemical composition of the QD itself, but also the properties of the QD’s direct surrounding are decisive for the size of the radiative lifetimes. The built-in piezo- and pyroelectric fields act as a mediator between QD morphology and radiative excitonic lifetimes, giving the radiative lifetimes a very sensitive dependence on the QD’s structural properties. Hence, the lifetimes scatter over a wide range in an inhomogeneous ensemble. The non-exponential decay of the ensemble PL can therefore be explained without any dynamical-screening effects. A large variety of different time constants can be found even for identical transition energies. For instance, among all considered model QDs, six different QDs emit at ≈ 3.1 eV (Fig. 5). Although all six QDs have nearly the same transition energy, their radiative lifetimes scatter appreciably between 1.0 ns and 3.7 ns. Therefore, no unambiguous relation between the transition energy and the radiative lifetimes of the QDs exists. Luminescence at a certain detection energy originates from a subensemble of QDs, which all have the same transition energy, but a broad distribution of excitonic lifetimes. It is clearly not possible to isolate one single structural parameter that is responsible for the broad distribution
6 of transition energies within the QD ensemble. However, an eligible concept should at least reproduce the key features of the lifetime distribution function shown in Fig. 4. Theoretically, shifts of the transition energy can be achieved by changing the QD height [Fig. 5(b)], lateral diameter [Fig. 5(c)], indium concentration in the QD [Fig. 5(d)], and, of course, various combinations of these factors. Varying either height or diameter of the QDs yields increasing time constant for lower transition energies [cf Fig. 5(b,c)], which is not supported by the experimental findings (cf Fig. 4). Varying the indium concentration within the QDs, on the other hand, leads to no significant increase of the time constants at the low-energy side of the spectrum [cf Fig. 5(d)]. The calculated lifetimes of this series are plotted in Fig. 6 (white circles) together with the lifetimes distribution function obtained from the experimental PL decays (gray-scale plot). The theoretical lifetimes also support the broadening of the lifetime distribution on the high energy side, which is caused by the delocalization (leaking of the wave function in the matrix and/or in the QW) of the confined electron states in QDs with shallow confinement potential (those embedded in QWs with high indium concentration). This ensemble of QDs with varying indium concentration that are embedded in different surrounding materials describes the experimentally determined lifetime distribution very well qualitatively, but quantitatively the calculated lifetimes are generally larger than the measured ones. Interestingly, this discrepancy could be resolved by scaling all time constants with a factor of ≈ 0.5, which would lead to an excellent agreement with the measured distribution (black circles in Fig. 6 (black circles): The scaled lifetimes are in very good agreement with the measured distribution. Since the radiative lifetime are directly proportional to a number of material parameters that have not been determined conclusively yet,38 we attribute this systematic deviation to the uncertainties of the material parameters rather than to non-radiative decay processes or a misconception of the QDs’ morphology. Also the excitonic lifetimes of the field-free QDs would be more consistent with experimental values. If scaled by the same factor the decay times of the field-free QDs (≈ 0.8 ns · 0.5 = 0.4 ns) would correspond well to those
† 1
2 3
4
5
Electronic address:
[email protected] T. M. S. Nakamura and M. Senoh, Jpn. J. Appl. Phys. 30, L1998 (1991). S. Nakamura, Science 281, 956 (1998). S. Nakamura, M. Senoh, S. Nagahama, N. Iwasa, T. Yamada, T. Matsushita, Y. Sugimoto, and H. Kiyoku, Appl. Phys. Lett. 69, 4056 (1996). S. Nakamura, M. Senoh, S. Nagahama, N. Iwasa, T. Yamada, T. Matsushita, H. Kiyoku, and Y. Sugimoto, Jpn. J. Appl. Phys. 35, L74 (1996). F. Hide, P. Kozodoy, S. P. DenBaars, and A. J. Heeger,
reported by S´en`es et al.37 (≈ 0.34 ns).
V.
SUMMARY
We have presented time- and energy-resolved PL measurements of the ensemble luminescence of InGaN/GaN QDs. The TRPL decay is non-exponential for all transition energies. By excitation-density dependent measurements and comparison to recently published single-QD TRPL data we have shown that dynamical screening effects are unlikely to be the source of the non-exponential decay. By analyzing the shape of the transients using an inverse Laplace transformation, we have demonstrated that, if a broad distribution of excitonic lifetimes is assumed as origin of the non-exponential decay, the macro-PL measurements provide a consistent picture with single-QD TRPL measurements. The radiative lifetimes of localized excitons in InGaN QDs have been calculated using eight-band k·p theory and their dependence on structural parameters, like QD height, lateral extension, and chemical composition, investigated. Neglecting the built-in piezo- and pyroelectric fields all QDs have the same radiative excitonic lifetime. The broad lifetime distribution can only be explained if the built-in fields are included in the calculations. They act as a mediator between the QD structure and the recombination dynamics, resulting in a sensitive dependence of the radiative lifetimes on the QD geometry and composition. The non-exponential PL decay can therefore be fully explained with a broad lifetime distribution within the inhomogeneously broadened QD ensemble.
VI.
ACKNOWLEDGEMENTS
The authors acknowledge S. Rodt for fruitful discussions. This work was supported by the Deutsche Forschungsgemeinschaft in the framework of Sfb296 and by the SANDiE Network of Excellence of the European Commission, contract number NMP4-CT-2004-500101.
6 7
8
9
10
11
Appl. Phys. Lett. 70, 2664 (1997). C. Zhang and A. J. Heeger, J. Appl. Phys. 84, 1579 (1998). Y. Sato, N. Takahashi, and S. Sato, Jpn. J. Appl. Phys. 35, L838 (1996). S. Chichibu, T. Azuhata, T. Sota, and S. Nakamura, Appl. Phys. Lett. 69, 4188 (1996). S. Chichibu, T. Azuhata, T. Sota, and S. Nakamura, Appl. Phys. Lett. 70, 2822 (1997). S. Chichibu, K. Wada, and S. Nakamura, Appl. Phys. Lett. 71, 2346 (1997). K. P. O’Donnell, R. W. Martin, and P. G. Middleton, Phys.
7
12
13
14
15
16
17
18
19
20
21
22
23
24
25
Rev. Lett. 82, 237 (1999). Y. Arakawa and H. Sakaki, Appl. Phys. Lett. 40, 939 (1982). M. Asada, Y. Miyamoto, and Y. Suematsu, IEEE J. Quant. Electron. 22, 1915 (1986). N. Kirstaedter, N. Ledentsov, M. Grundmann, D. Bimberg, V. Ustinov, S. Ruvimov, M. Maximov, P. Kop’ev, Z. Alferov, U. Richter, et al., Electron. Lett. 30, 1416 (1994). I.-K. Park, M.-K. Kwon, S.-B. Seo, J.-Y. Kim, J.-H. Lim, and S.-J. Park, Appl. Phys. Lett. 90, 111116 (2007). T. Bartel, M. Dworzak, M. Strassburg, A. Hoffmann, A. Strittmatter, and D. Bimberg, Appl. Phys. Lett. 85, 1946 (2004). A. Strittmatter, A. Krost, J. Bl¨ asing, and D. Bimberg, Phys. Stat. Sol. (a) 176, 611 (1999). R. Seguin, S. Rodt, A. Strittmatter, L. Reißmann, T. Bartel, A. Hoffmann, D. Bimberg, E. Hahn, and D. Gerthsen, Appl. Phys. Lett. 84, 4023 (2004). I. L. Krestnikov, N. N. Ledentsov, A. Hoffmann, D. Bimberg, A. V. Sakharov, W. V. Lundin, A. F. Tsatsul’nikov, A. S. Usikov, Z. I. Alferov, Y. G. Musikhin, et al., Phys. Rev. B 66, 155310 (2002). J. W. Robinson, J. H. Rice, A. Jarjour, J. D. Smith, R. A. Taylor, R. A. Oliver, G. A. D. Briggs, M. J. Kappers, C. J. Humphreys, and Y. Arakawa, Appl. Phys. Lett. 83, 2674 (2003). A. Bell, J. Christen, F. Bertram, F. A. Ponce, H. Marui, and S. Tanaka, Appl. Phys. Lett. 84, 58 (2004). A. Morel, P. Lefebvre, T. Taliercio, T. Bretagnon, B. Gil, N. Grandjean, B. Damilano, and J. Massies, Physica E 17, 64 (2003). A. Reale, G. Massari, A. D. Carlo, P. Lugli, A. Vinattieri, D. Alderighi, M. Colocci, F. Semond, N. Grandjean, and J. Massies, J. Appl. Phys. 93, 400 (2003). H. Gotoh, T. Tawara, Y. Kobayashi, N. Kobayashi, and T. Saitoh, Appl. Phys. Lett. 83, 4791 (2003). J. H. Rice, J. W. Robinson, J. H. Na, K. H. Lee, R. A. Taylor, D. P. Williams, E. P. O’Reilly, A. D. Andreev, Y. Arakawa, and S. Yasin, Nanotechnology 16, 1477
26 27
28
29
30
31
32
33 34
35
36
37
38
39
40
(2005). R. Kohlrausch, Pogg. Ann Phys. Chem. 91, 179 (1854). The authors use the numerical Laplace transformation package available at http://www.wolframresearch.com. A similar approach has been applied by Van Driel et al. on the TRPL of CdSe QDs.39 . T. Bretagnon, P. Lefebvre, P. Valvin, R. Bardoux, T. Guillet, T. Taliercio, B. Gil, N. Grandjean, F. Semond, B. Damilano, et al., Phys. Rev. B 73, 113304 (2006). The entire method is described in Ref. 36. The material parameters from Ref. 40 have been included as described in Ref. 35. G. W. p’t Hooft, W. A. J. A. van der Poel, L. W. Molenkamp, and C. T. Foxon, Phys. Rev. B 35, 8281 (1987). A. Thr¨ anhardt, C. Ell, G. Khitrova, and H. M. Gibbs, Phys. Rev. B 65, 035327 (2002). E. Ejder, Phys. Stat. Sol. (a) 6, 445 (1971). M. Anani, H. Abid, Z. Chama, C. Mathieu, A. Sayede, and B. Khelifa, Microelectronics Journal 38, 262 (2007). M. Winkelnkemper, R. Seguin, S. Rodt, A. Schliwa, L. Reissmann, A. Strittmatter, A. Hoffmann, and D. Bimberg, J. Appl. Phys. 101, 113708 (2007). M. Winkelnkemper, A. Schliwa, and D. Bimberg, Phys. Rev. B 74, 155322 (2006). M. Senes, K. L. Smith, T. M. Smeeton, S. E. Hooper, and J. Heffernan, Phys. Rev. B 75, 045314 (2007). Among other uncertain material parameters, the decay times are directly proportional to 1/˜ n (cf Eq. 3) and the EP parameters of Inx Ga1-x N. In particular the interpolation rules for an arbitrary indium concentration x are unclear. A. F. van Driel, I. S. Nikolaev, P. Vergeer, P. Lodahl, D. Vanmaekelbergh, and W. L. Vos, Phys. Rev. B 75, 035329 (2007). P. Rinke, M. Scheffler, A. Qteish, M. Winkelnkemper, D. Bimberg, and J. Neugebauer, Appl. Phys. Lett. 89, 161919 (2006).