© 2004 Nature Publishing Group http://www.nature.com/naturebiotechnology
ARTICLES
In vivo cancer targeting and imaging with semiconductor quantum dots Xiaohu Gao,1 Yuanyuan Cui,2 Richard M Levenson,3 Leland W K Chung2 & Shuming Nie1 We describe the development of multifunctional nanoparticle probes based on semiconductor quantum dots (QDs) for cancer targeting and imaging in living animals. The structural design involves encapsulating luminescent QDs with an ABC triblock copolymer and linking this amphiphilic polymer to tumor-targeting ligands and drug-delivery functionalities. In vivo targeting studies of human prostate cancer growing in nude mice indicate that the QD probes accumulate at tumors both by the enhanced permeability and retention of tumor sites and by antibody binding to cancer-specific cell surface biomarkers. Using both subcutaneous injection of QD-tagged cancer cells and systemic injection of multifunctional QD probes, we have achieved sensitive and multicolor fluorescence imaging of cancer cells under in vivo conditions. We have also integrated a whole-body macro-illumination system with wavelengthresolved spectral imaging for efficient background removal and precise delineation of weak spectral signatures. These results raise new possibilities for ultrasensitive and multiplexed imaging of molecular targets in vivo.
The development of high-sensitivity and high-specificity probes that lack the intrinsic limitations of organic dyes and fluorescent proteins is of considerable interest in many areas of research, from molecular and cellular biology to molecular imaging and medical diagnostics. Nanometer-sized semiconductor particles have been covalently linked to biorecognition molecules such as peptides, antibodies, nucleic acids or small-molecule ligands for application as fluorescent probes1–13. In comparison with organic fluorophores, these quantum-confined particles or QDs have unique optical and electronic properties, such as size- and composition-tunable fluorescence emission from visible to infrared wavelengths, large absorption coefficients across a wide spectral range and very high levels of brightness and photostability14,15. Because of their broad excitation profiles and narrow, symmetric emission spectra, high-quality QDs are also well suited to optical multiplexing, in which multiple colors and intensities are combined to encode genes, proteins and small-molecule libraries16–18. Despite their relatively large hydrodynamic radii (10–15 nm), bioconjugated QD probes do not suffer from serious binding kinetic or steric-hindrance problems6–13. In this ‘mesoscopic’ size range, QDs also have more surface areas and functionalities that can be used for linking to multiple diagnostic (e.g., radioisotopic or magnetic) and therapeutic (e.g., anticancer) agents. Indeed, dual magnetic and optical probes have been developed using similarly sized iron oxide nanoparticles, a magnetic contrast agent currently in clinical use19. These properties have opened new possibilities for advanced molecular and cellular imaging as well as for ultrasensitive bioassays and diagnostics20,21. In the first reported use of QD–peptide conjugates to target tumor vasculatures, the QD probes were not detected in living animals5. Nonetheless, the in vitro histological results revealed that
QDs homed to tumor vessels guided by the peptides and escaped clearance by the reticuloendothelial system. In an important improvement, QDs were encapsulated in phospholipid micelles, and these biocompatible dots were injected into frog oocyte cells for real-time tracking of embryonic development6. With two-photon laser excitation, the use of quantum dots was demonstrated as a fluorescent blood tracer to image small vasculatures close to the skin surface9. Theoretical modeling studies have indicated that two spectral windows are available for in vivo QD imaging (one at 700–900 nm and another at 1,200–1,600 nm)22. Most recently, QDs have been used as stable fluorescent tracers for nonspecific uptake studies and lymph node mapping in living animals23,24. Antibody-conjugated QDs have allowed real-time imaging and tracking of single receptor molecules on the surface of living cells with improved sensitivity and resolution12,25. However, no combined QD targeting and imaging studies have been reported with live animals, and it is unclear whether QD probes could be used to target specific cells or diseased sites upon systemic injection. We report the development of bioconjugated QD probes suitable for in vivo targeting and imaging of human prostate cancer cells growing in mice. This new class of QD conjugates contains an amphiphilic triblock copolymer for in vivo protection, targeting-ligands for tumor antigen recognition and multiple PEG molecules for improved biocompatibility and circulation. Because of their structural diversity and novel chemical properties, di- and triblock copolymers have been used in drug delivery as well as in soft nanolithography (spontaneous assembly of polymer films into periodic nanoscale domains)26–28. Here the use of an ABC triblock copolymer has solved the problems of particle aggregation and fluorescence loss previously encountered for
1Departments of Biomedical Engineering, Chemistry, Hematology and Oncology, and the Winship Cancer Institute, Emory University and Georgia Institute of Technology, 1639 Pierce Drive, Suite 2001, Atlanta, Georgia 30322, USA. 2Department of Urology and Winship Cancer Institute, Emory University, 1365 Clifton Road, Suite B5101, Atlanta, Georgia 30322, USA. 3Cambridge Research & Instrumentation, Inc., 35-B Cabot Road, Woburn, Massachusetts 01801, USA. Correspondence should be addressed to L.W.K.C. (
[email protected]) or S.N. (
[email protected]).
Published online 18 July 2004; doi:10.1038/nbt994
NATURE BIOTECHNOLOGY VOLUME 22 NUMBER 8 AUGUST 2004
969
ARTICLES a QD capping ligand TOPO
PEG
QD capping ligand: TOPO
O=P
PEG: poly (ethylene glycol) )n MW = 5,000 — ( CH2-CH2-O—
Polymer coating
Affinity ligands:
antibody, peptide, small-molecule drug, inhibitors
b Block copolymer Z = 23% wt, x + y = 77% wt
CH2-CH
x
CH2-CH
y
Hydrophilic
OH OH OH CO CO CO C8H17 -NH2 CH2-C- CH2-C- CH2-C z
Hydrophilic
CH2-CH
CH2-CH
x
y
C NH CO
3 CH
H 17
8
Hydrophobic
OH OH 3 CO CO CH CH2-C-CH2-C- CH2-C z 3 CH
H5 2 OC CO
H9 4 OC CO
3 CH
3 CH
Hydrophobic
3 CH
H5 2 OC CO
H9 4 OC CO
© 2004 Nature Publishing Group http://www.nature.com/naturebiotechnology
Affinity ligands
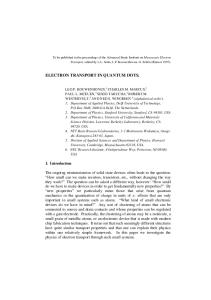
Figure 1 Schematic illustration of biconjugated QDs for in vivo cancer targeting and imaging. (a) Structure of a multifunctional QD probe, showing the capping ligand TOPO, an encapsulating copolymer layer, tumor-targeting ligands (such as peptides, antibodies or smallmolecule inhibitors) and polyethylene glycol (PEG). (b) Chemical modification of a triblock copolymer with an 8-carbon side chain. This hydrophobic side chain is directly attached to the hydrophilic acrylic acid segment and interacts strongly with the hydrophobic tails of TOPO. Dynamic light scattering shows a compact QD-polymer structure, indicating that QDs are tightly wrapped by the hydrophobic segments and hydrocarbon side chains. (c) Permeation and retention of QD probes via leaky tumor vasculatures (passive targeting) and high affinity binding of QD-antibody conjugates to tumor antigens (active targeting).
Hydrophobic
c
QDs stored in physiological buffer or injected into live animals5,29. We have examined the biodistribution, nonspecific uptake, cellular toxicity and pharmacokinetics of these highly stable and bright QD probes in cells and animal models. We have achieved both passive tumor targeting (due to enhanced permeation and retention of QDs at tumor sites) and active tumor targeting (due to rapid QD-antibody binding to tumor-specific antigens). For both QD-tagged cancer cells and QD-encoded microbeads injected subcutaneously into living animals, we have achieved excellent detection sensitivity and multicolor capability. These results open new possibilities for ultrasensitive and simultaneous imaging of multiple biomarkers involved in cancer metastasis and invasion. RESULTS Probe design Bioconjugated QD probes for in vivo cancer targeting and imaging were designed using drug delivery and targeting principles26,27. Coreshell CdSe-ZnS QDs are protected by both a coordinating ligand, tri-n-octylphosphine oxide (TOPO), and an amphiphilic polymer coating (Fig. 1a). Because of strong hydrophobic interactions between TOPO and the polymer hydrocarbon, these two layers ‘bond’ to each other and form a hydrophobic protection structure that resists hydrolysis and enzymatic degradation even under complex in vivo conditions
970
(see below). We used a high-molecular-weight (100 kDa) copolymer with an elaborate ABC triblock structure and a grafted 8-carbon (C-8) alkyl side chain (Fig. 1b), in contrast to simple polymers and amphiphilic lipids used in previous studies6,7. This triblock polymer consists of a polybutylacrylate segment (hydrophobic), a polyethylacrylate segment (hydrophobic), a polymethacrylic acid segment (hydrophilic) and a hydrophobic hydrocarbon side chain. A key finding is that this polymer can disperse and encapsulate single TOPO-capped QDs via a spontaneous self-assembly process, similar to previously reported uses in soft nanolithography28. As a result, after linking to PEG molecules, the polymer-coated QDs are protected to such a degree that their optical properties (e.g., absorption spectra, emission spectra and fluorescence quantum yields) did not change in a broad range of pH (1 to 14) and salt conditions (0.01 to 1 M) or after harsh treatment with 1.0 M hydrochloric acid. Dynamic light scattering measurement indicates that the assembled QD probes have a hydrodynamic radius of 10–15 nm (depending on attached ligands). This value agrees with a compact probe structure consisting of a 5-nm QD core (2.5-nm radius), a 1-nm TOPO cap, a 2nm thick polymer layer and a 4- to 5-nm PEG/antibody layer. Recent work9 suggests that the hydrodynamic radii of QDs could be considerably larger than their transmission electron microscope (TEM) ‘dry’ radii, but the reported TEM values do not represent the true physical sizes of organic-coated QDs. The reason is that organic materials (such as TOPO, polymers and conjugated biomolecules) are not electrondense enough for TEM visualization on the nanometer scale. Because QDs are tightly protected from contacting the outside environment, their hydrodynamic behavior is mainly controlled by the surface coating layer. Thus, the polymer-coated QDs should behave similarly to standard polymer micelles or nanoparticles, and there is no fundamental reason for coated QDs to have hydrodynamic properties different from those of macromolecules and nanoparticles. Based on the geometric and size constraints and the ligand coupling efficiencies (40%–50%, experimentally determined by using fluorescently labeled ligands), we have estimated that each dot contains
VOLUME 22 NUMBER 8 AUGUST 2004 NATURE BIOTECHNOLOGY
ARTICLES Bright field
QD-COOH
a
Fluorescence
a
QD-PEG
QD-PSMA
Brain
QD-PSMA C4-2 cells
© 2004 Nature Publishing Group http://www.nature.com/naturebiotechnology
Heart 20 µm
b
Kidney
QD-PEG C4-2 cells
Liver
Lung
c QD-PSMA PC-3 cells
Spleen
Tumor
Figure 2 Immunocytochemical studies of QD-PSMA Ab binding activity in cultured prostate cancer cells. (a) C4-2 cells, which are PSMA-positive, as revealed by the presence of the QD-PSMA Ab bioconjugate on the cell surface. (b) Negative staining was detected in C4-2 cells exposed to QD-PEG in the absence of PSMA Ab. (c) Negative staining was noted in PC-3 cells that lack PSMA expression. QD-PSMA Ab fluorescence was detected on the cell surface of C4-2 but not PC-3 cells, confirming PSMA as a cell surface–specific marker for some prostate cancer cell lines. The presence or absence of PSMA in C4-2 and PC-3 cells was also confirmed by flow cytometric (FACS) analysis of the respective cell preparations (labeled with QDs, data not shown). Nonspecific QD uptake at elevated temperatures (25 °C and 37 °C) was negligible at the low QD concentrations and short incubation times used in this study.
∼200 TOPO molecules, 4–5 triblock copolymer molecules, 5–6 PEG molecules and 5–6 antibody molecules. High-sensitivity fluorescence imaging showed ‘blinking’ signals when a dilute solution (10−12 M) of the QD bioconjugate was spread on a glass surface. This blinking behavior is characteristic of single quantum systems such as single dye molecules and single QDs30,31, indicating that the triblock copolymer has efficiently dispersed the dots into single particles. Preliminary TEM results also revealed that the QD probes consisted of single particles, with little or no aggregation. It is worth noting, however, that QD blinking has no adverse implications for in vivo tumor imaging because the tumor cells are labeled with a large population (up to millions) of QDs, far from the single-dot regime. At its current level of conjugation, PEG does not interfere with antibody binding, as confirmed by positive cellular staining. At higher PEG densities or longer chains, substantial interference with ligand binding could occur, as reported previously for pegylated liposomes32. To reduce interference, the targeting ligands could be attached to the distal termini of PEG. The fully exposed ligands, however, could elicit nonspecific cellular uptake or an immune response, thus reducing the probe’s biocompatibility and duration of circulation in vivo.
NATURE BIOTECHNOLOGY VOLUME 22 NUMBER 8 AUGUST 2004
b Tumor
Figure 3 Histological examination of QD uptake, retention and distribution in six different normal host organs and in C4-2 tumor xenografts maintained in athymic nude mice. We evaluated QD uptake and retention by using three surface modifications. (a) Left column: QD coated with surface carboxylic acid groups (6.0 nmol and 6 h circulation). Middle column: QD with surface coated with PEG groups (6.0 nmol and 24 h circulation). Right column: QD with surface modified by PEG and bioconjugated with a PSMA antibody (0.4 nmol and 2 h circulation). (b) Same as a except that the amount of QD injection was reduced to 0.4 nmol and the circulation was reduced to 2 h. All images were obtained from 5 to 10 µm–thin tissue sections on an epifluorescence microscope. All the tumors had similar sizes, measuring about 0.5–1 cm in diameter along the long axis. QDs were detected by their characteristic red-orange fluorescence, and all other signals were due to background autofluorescence.
Tumor targeting Under in vivo conditions, QD probes can be delivered to tumors by both passive and active targeting mechanisms (see Fig. 1c). In the passive mode, macromolecules and nanometer-sized particles accumulate preferentially at tumor sites through an enhanced permeability and retention effect33–35. This effect is believed to arise from two factors: (i) angiogenic tumors produce vascular endothelial growth factors that hyperpermeabilize the tumor-associated neovasculatures and cause leakage of circulating macromolecules and small particles; and (ii) tumors lack an effective lymphatic drainage system, which leads to macromolecule or nanoparticle accumulation. For active tumor targeting, we used antibody-conjugated QDs to target a prostate-specific membrane antigen (PSMA). Previous research has identified PSMA as
971
© 2004 Nature Publishing Group http://www.nature.com/naturebiotechnology
ARTICLES a
b
c
d
a cell surface marker for both prostate epithelial cells and neovascular endothelial cells36. PSMA has been selected as an attractive target for both imaging and therapeutic intervention of prostate cancer37. Accumulation and retention of PSMA antibody at the site of tumor growth is the basis of radioimmunoscintigraphic scanning (e.g., ProstaScint scan) and targeted therapy for human prostate cancer metastasis38. QD probes conjugated to a PSMA monoclonal antibody (Ab), which recognizes the extracellular domain of PSMA, were first evaluated for binding to PSMA in prostate cancer cell lines. Immunocytochemical data confirmed strong and specific binding of the PSMA Ab conjugated QD probes to a human prostate cancer cell line, C4-2, which is known to express PSMA on the cell surface (Fig. 2a). Control studies using QD-PEG (without antibody) showed only a low level of nonspecific cell binding to C4-2 cells (Fig. 2b). Additional control studies using PC-3 cells, a PSMA-negative human prostate cancer cell line, also showed the absence of QD binding (Fig. 2c). These results establish that the PSMA antibody–QD conjugates retain their PSMA binding activity and specificity. To investigate the behavior of QD-PSMA Ab probes in living animals, we examined their specific uptake and retention, background or nonspecific uptake, blood clearance and organ distribution as well as their relationship to QD surface modifications. Figure 3 shows comparative histological data of a tumor xenograft and six normal host organs obtained from a nude mouse after a single tail vein administration of QD-PSMA Ab conjugate. As seen from the characteristic redorange fluorescence of QDs, nonspecific QD uptake and retention took place primarily in the liver and the spleen, with little or no QD accumulation in the brain, the heart, the kidney or the lung. This pattern of in vivo organ uptake and distribution is similar to that of dextran-coated magnetic iron oxide nanoparticles39. For polymerFigure 5 In vivo fluorescence images of tumor-bearing mice using QD probes with three different surface modifications: carboxylic acid groups (left), PEG groups (middle) and PEG-PSMA Ab conjugates (right). For each surface modification, a color image (top), two fluorescence spectra from QD and animal skin (middle) and a spectrally resolved image (bottom) were obtained from the live mouse models bearing C4-2 human prostate tumors of similar sizes (0.5–1.0 cm in diameter). The amounts of injected QDs and the lengths of circulation were: 6 nmol and 6 h for the COOH probe; 6 nmol and 24 h for the PEG probe; and 0.4 nmol and 2 h for the PSMA probe (same as in Fig. 4). The site of QD injection was observed as a red spot on the mouse tail. The spectral feature at ∼700 nm (red curve, middle panel) was an artifact caused by mathematical fitting of the original QD spectrum, which has little or no effect on background removal.
972
Figure 4 Spectral imaging of QD-PSMA Ab conjugates in live animals harboring C4-2 tumor xenografts. Orange-red fluorescence signals indicate a prostate tumor growing in a live mouse (right). Control studies using a healthy mouse (no tumor) and the same amount of QD injection showed no localized fluorescence signals (left). (a) Original image; (b) unmixed autofluorescence image; (c) unmixed QD image; and (d) super-imposed image. After in vivo imaging, histological and immunocytochemical examinations confirmed that the QD signals came from an underlying tumor. Note that QDs in deep organs such as liver and spleen were not detected because of the limited penetration depth of visible light.
encapsulated QDs with excess COOH groups, no tumor targeting was observed, indicating rapid blood clearance by reticuloendothelial system. For polymer-encapsulated QDs with surface PEG groups, the rate of organ uptake was reduced and the length of blood circulation was improved, leading to slow accumulation of the nanoparticles in the tumors33–35. For QDs encapsulated by PEG and bioconjugated with PSMA antibody, the nanoparticles were delivered and retained by the tumor xenografts, but nonspecific liver and spleen uptake was still apparent. We noted that passive tumor targeting was observed only with an increased dose of QD-PEG conjugate (6 nmol injected plus a 24-h latent period of probe circulation). In contrast, this same dose of QDCOOH conjugate was found to have little accumulation in tumors due to passive targeting following the same length of circulation in athymic hosts. This low efficiency of QD uptake and retention is likely due to the excess negative charges on the probe surface (free carboxylic acid groups on the polymer coating), which is known to reduce the rate of probe extravasation and its subsequent accumulation into tumor xenografts40. In vivo cancer imaging Figure 4 depicts spectral imaging results obtained from QD-PSMA Ab probes injected into the tail vein of a tumor-bearing mouse and a control mouse (no tumor). The original image (a) shows QD signals
Mouse QD-PEG
Mouse QD-COOH
Mouse QD-PSMA
True-color fluorescent images
1.00
Autofluorescence
0.75
Spectral unmixing
0.50
Quantum dot 0.25
0
580
600
620 640
660 680 700
Tumors
Unmixed images
Injection site Tumor
Tumor
VOLUME 22 NUMBER 8 AUGUST 2004 NATURE BIOTECHNOLOGY
© 2004 Nature Publishing Group http://www.nature.com/naturebiotechnology
ARTICLES Figure 6 Sensitivity and multicolor capability of QD imaging in live animals. (a,b) Sensitivity and spectral comparison between QD-tagged and GFPtransfected cancer cells (a), and simultaneous in vivo imaging of multicolor QD-encoded microbeads (b). The right-hand images in a show QD-tagged cancer cells (orange, upper) and GFP-labeled cells (green, lower). Approximately 1,000 of the QD-labeled cells were injected on the right flank of a mouse, while the same number of GFP-labeled cells was injected on the left flank (circle) of the same animal. Similarly, the right-hand images in b show QD-encoded microbeads (0.5 µm diameter) emitting green, yellow or red light. Approximately 1–2 million beads in each color were injected subcutaneously at three adjacent locations on a host animal. In both a and b, cell and animal imaging data were acquired with tungsten or mercury lamp excitation, a filter set designed for GFP fluorescence and true color digital cameras. Transfected cancer cell lines for high level expression of GFP were developed by using retroviral vectors, but the exact copy numbers of GFP per cell have not been determined quantitatively56.
at one tumor site among an autofluorescence background (mouse skin). Using spectral unmixing algorithms41, we separated the fluorescence background signals (b) from the QD signals (c). The composite image (d) clearly shows the whole animal and the tumor site. The enhanced contrast in the bottom right image indicates that the QD probes can be visualized against an essentially black background, with little or no interference from the mouse autofluorescence. Results from separate tests using QDs excited in vitro indicate that spectral imaging techniques can be used to unmix multiple fluorescent signals that differ by as little as 5 nm in peak position (results not shown). Thus, the ability to exclude interference from autofluorescence and the capability of resolving multiple simultaneous labels suggest that spectral imaging will have considerable utility when combined with QD-based labeling strategies. We have further examined how functional groups on the QD probe surface affect in vivo imaging results. Figure 5 compares the in vivo imaging results from three types of surface modifications: COOH groups, PEG groups and PEG plus PSMA Ab. In agreement with histological examinations, no tumor signals were detected with the COOH probe, only weak tumor signals were observed with the PEG probe (passive targeting) and intense signals were detected in the PEGPSMA Ab conjugated probe (active targeting). This comparison provides further evidence for the conclusion that active tumor targeting by using a tumor-specific ligand is much faster and more efficient than passive targeting based on tumor permeation, uptake and retention. Probe brightness and spectral comparison with GFP Because genetically encoded fluorescent proteins such as green fluorescent protein (GFP) have been used to tag cells for in vivo cancer imaging42, it is important to compare the detection sensitivity and spectral features of GFP and QD probes. For this purpose, we linked QDs to a translocation peptide (such as HIV Tat or polyarginine) and delivered them into living cancer cells. Similar peptides have been used to deliver magnetic nanoparticles into living cells for in vivo monitoring of cell migration and integration43. Fluorescence intensity measurement indicates that as many as three million QDs can be delivered into each cancer cell. Surprisingly, this level of QD loading did not affect cell viability and growth, as the implantation of QD-tagged cancer cells led to normal tumor growth in animal models (X.G. and S.N., unpublished data). Figure 6a shows in vivo imaging data for the same number (∼1,000) of QD-tagged cells and GFP stably transfected cells injected into each side of a host mouse. Although the QD-tagged cells and the GFP-transfected cells were similarly bright in cell cultures (two images on the right), only the QD signal was observed in vivo (orange
NATURE BIOTECHNOLOGY VOLUME 22 NUMBER 8 AUGUST 2004
a
10 µm
b
1 µm
glow on the right flank). No GFP signals could be discerned at the injection site (circle on the left flank). This result does not provide an absolute intensity comparison between GFP and QDs because several factors (such as optical density and tissue scattering) are difficult to normalize or calibrate. Instead, it is a qualitative spectral comparison demonstrating that the emission spectra of QDs can be shifted away from the autofluorescence, allowing spectroscopic detection at low signal intensities. In contrast, organic dyes and fluorescent proteins give rise to small Stokes shifts, resulting in GFP emission and background fluorescence in the same spectral region. The brightness and spectral shifting advantages of QDs are further shown in Supplementary Figures 1 and 2. Another important feature is the large absorption coefficients of QDs, which makes them brighter probes under photon-limited in vivo conditions (where light intensities are severely attenuated by scattering and absorption). To appreciate this feature, let’s compare the photophysics of QDs and organic dyes. In theory, the lifetimelimited emission rates for single QDs are 5–10 times lower than those of single organic dyes because of their longer excited state lifetimes (20–50 ns). In practice, however, fluorescence imaging usually operates under absorption-limited conditions, in which the rate of absorption is the main limiting factor of fluorescence emission. Because the molar extinction coefficients (0.5–2 × 10⁶ M–1cm–1) of QDs are about 10–50 times larger than those of organic dyes (5–10 × 104 M–1cm–1), the QD absorption rates will be 10–50 times faster than those of organic dyes at the same excitation photon flux. Because of this increased rate of light emission, single QDs appear 10–20 times
973
© 2004 Nature Publishing Group http://www.nature.com/naturebiotechnology
ARTICLES brighter than organic dyes, a result that has been experimentally confirmed by us and other groups1–12. We further explored multicolor in vivo imaging with QD-encoded microbeads. For this purpose, we injected three samples of 0.5-µm polymer beads, each doped with green, yellow or red QDs, into a mouse at three different locations, a technique similar to the use of fluorescent beads in cell differentiation and trafficking studies44. Because of the usually large Stokes shifts and broad excitation profiles of QDs, all three colors were observed simultaneously in the same mouse and with a single light source (Fig. 6b). DISCUSSION Several groups have reported the use of QDs for sensitive bioassays and cellular imaging2–12, but a substantial loss of fluorescence has been noted by us and another group upon the administration of QDs to live animals5. Although the exact origin of this signal loss is still not clear, recent research in our group suggests that the surface ligands and coatings are slowly degraded in body fluids, leading to surface defects and fluorescence quenching. This mechanism is supported by the observation that the surface defects can be annealed by continuous laser excitation, and the loss of QD fluorescence can be partially restored (involving surface structural changes)45,46. The QD probes reported in this work represent an improvement because they are highly stable in vivo. The most important feature is a high-molecular-weight triblock copolymer that completely encapsulates TOPO-QDs and forms a stable hydrophobic protective layer around single QDs. The hydrophilic surface of this polymer layer has a large number of functional groups (e.g., 400–500 carboxylic acid groups), allowing the attachment of both diagnostic and therapeutic agents. With smallmolecule ligands such as synthetic organic molecules, short oligonucleotides and peptides, many copies of the same ligand can be linked to single dots, leading to multivalent QD-target binding. Properly designed multivalent ligands have been shown to increase the binding affinity by ten orders of magnitude47. Colloidal gold nanoparticles linked to oligos at high surface densities have improved the sequence selectivity of DNA hybridization 100–1,000 times (sharper melting curves)48. Moreover, QD-peptide conjugates have been shown to exhibit exquisite binding specificity5, most likely due to multivalent peptide binding to protein targets distributed on the surface of tumor vasculature. This feature is not available with organic dyes and fluorescent proteins and could allow the design of multivalent QD probes to target cancer cells based on the density and distribution of biomarkers on the cell surface. This might offer a new strategy for molecular cancer diagnosis and therapy because truly unique cancer biomarkers are often not available or are present at extremely low concentrations. In addition, polymer-encapsulated QD probes are in an excellent size range for in vivo tumor targeting. With small peptide-dye conjugates, rapid extravasation often leads to blood clearance of the probe in less than 1 min. The circulation or retention time can be improved by attaching small probes to macromolecules or nanoparticles, a strategy widely used in drug delivery research33–35. Indeed, research in our group indicates that PEG-shielded QDs are able to circulate in blood for as long as 48–72 h, with a half decay time of 5–8 h (X.G. and S. N., unpublished data). At the same time, these probes are small enough for efficient binding to cell surface receptors, for internalization through endocytosis or peptide translocation and for passing through the nuclear pores to enter the cell nucleus (using nuclear-localization peptides) (Fig. 6a, top right). However, the penetration depth of QDs into solid tumors will be limited by their nanometer sizes. The unique optical properties of QDs also provide new opportunities for multicolor imaging and multiplexing. For example, multicolor
974
imaging will allow intensity ratioing, spatial colocalization and quantitative target measurements at metastatic tumor sites. Optical encoding strategies based on the use of multiple colors and multiple intensity levels are also possible. This combinatorial approach has been demonstrated for tagging a large number of genes, proteins and small-molecule libraries 16–18. In addition to wavelength and intensity, lifetime fluorescence imaging represents a new dimension. Because the excited state lifetimes (20–50 ns) of QDs are nearly one order of magnitude longer than that of organic dyes (2–5 ns), QD probes should be suitable for fluorescence lifetime imaging of cells, tissue specimens and living animals. We note that the current work using orange/red-emitting QDs is not optimized for tissue penetration or imaging sensitivity. Extensive work in tissue optics has shown that deep tissue imaging (millimeters to centimeters) requires the use of far-red and near-infrared light in the spectral range 650–900 nm49. This wavelength range provides a ‘clear’ window for in vivo optical imaging because it is separated from the major absorption peaks of blood and water50. Based on tissue optical calculations, we estimate that the use of near-infrared-emitting QDs should improve the tumor imaging sensitivity by at least tenfold, allowing sensitive detection of 10–100 cancer cells. Toward this goal, recent research has yielded a new class of alloyed semiconductor QDs consisting of cadmium selenium telluride, with tunable fluorescence emission up to 850 nm and quantum yields up to 60% (ref. 51). Together with core-shell CdTe/CdSe type-II materials52, the use of near-infrared-emitting QDs should bring major improvements in tissue penetration depth and cell detection sensitivity. A remaining issue is the toxicity and metabolism of QDs in vivo. Recent work indicates that CdSe QDs are highly toxic to cells under UV illumination for extended periods of time53. This is understandable because UV-irradiation often dissolves the semiconductor particles, releasing toxic cadmium ions into the medium. In the absence of UV irradiation, we have found that QDs with a stable polymer coating are essentially nontoxic to cells (no effect on cell division or ATP production). In vivo studies have also confirmed the nontoxic nature of stably protected QDs23. This is perhaps not surprising because the polymer protection layer is so stable that the QD core would not be exposed to the outside environment. Consistent with this conclusion, it has been shown that the uptake of dextran-protected iron oxide nanoparticles (up to 10 million particles per cell) does not significantly reduce cell viability43, and that the injection of micelle-protected QDs (up to 2 × 10⁹ per embryo cell) does not affect frog embryo development6. In this work, we observed that up to 3 × 10⁶ QDs in a single cancer cell did not appreciably reduce its viability or growth. At present, however, little is known about the mechanism of metabolism or clearance of QD probes injected into living animals. For the polymer-encapsulated QDs, chemical or enzymatic degradation of the semiconductor cores is unlikely to occur. But the polymer-protected QDs might be cleared from the body by slow filtration and excretion through the kidney. This and other possible mechanisms need to be examined carefully before semiconductor QDs are used in humans. In conclusion, we have developed a class of polymer-encapsulated and bioconjugated QD probes for cancer targeting and imaging in vivo. These probes are bright, stable and have a versatile triblock copolymer structure that is well suited for conjugation to diagnostic and therapeutic agents. In vivo imaging results indicate the QD probes can be targeted to tumor sites through both passive and active mechanisms, but passive targeting is much slower and less efficient than active targeting. When combined with wavelength-resolved imaging, the QD probes allow sensitive and multicolor imaging of cancer cells in living animals. The use of near-infrared-emitting QDs should
VOLUME 22 NUMBER 8 AUGUST 2004 NATURE BIOTECHNOLOGY
ARTICLES improve both the tissue penetration depth and imaging sensitivity. We envision that QDs might be integrated with targeting, imaging and therapeutic agents to develop ‘smart’ nanostructures for noninvasive imaging, diagnosis and treatment of cancer, cardiovascular plaques and neurodegenerative disease. METHODS
© 2004 Nature Publishing Group http://www.nature.com/naturebiotechnology
Animal use protocols were reviewed and approved by the Institutional Animal Care and Use Committee of Emory University. Materials. Except where otherwise noted, all chemicals and biochemicals were purchased from Sigma-Aldrich and were used without further purification. A monoclonal antibody (J591) to PSMA was a kind gift from Millennium Pharmaceuticals. Membrane translocation peptides (Tat and polyarginine, with a c-terminal biotin for conjugation to streptavidin-QD) were synthesized and purified by Invitrogen. Core-shell QDs (ZnS-capped CdSe) were synthesized according to literature procedures54,55. A high-temperature coordinating solvent, TOPO, was used for the synthesis, leading to high-quality QDs that were capped by a monolayer of TOPO molecules. Additional details are provided in Supplementary Notes. These dots were highly fluorescent (∼60% quantum yields) and monodispersed (∼5% size variations). QD-encoded microbeads were prepared by using 0.5 µm mesoporous microbeads in butanol and were isolated and purified as reported previously16–18. A triblock copolymer consisting of a polybutylacrylate segment, a polyethylacrylate segment and a polymethacrylic acid segment was purchased from Sigma. At a molecular weight of ∼100,000 daltons, this polymer contains more than 1,000 total monomer units, with a weight distribution of 23% methacrylic acid and 77% combined butyl and ethyl acrylates. For encapsulating QDs, about 25% of the free carboxylic acid groups were derivatized with octylamine (a hydrophobic side chain). Thus, the original polymer dissolved in dimethylformamide (DMF) was reacted with n-octylamine at a polymer/octylamine molar ratio of 1:40, using ethyl-3-dimethyl amino propyl carbodiimide (EDAC, threefold excess of n-octylamine) as a cross-linking reagent. The product yields were generally greater than 90% because of the high EDAC coupling efficiency in DMF (determined by a change of the free octylamine band in thin layer chromatography). The reaction mixture was dried with a ratovap (Rotavapor R-3000, Buchi Analytical). The resulting oily liquid was precipitated with water and was rinsed with water five times to remove excess EDAC and other byproducts. After vacuum drying, the octylamine-grafted polymer was resuspended in an ethanol-chloroform mixture and was stored for use. Surface modification and bioconjugation. Using a 3:1 (vol/vol) chloroform/ethanol solvent mixture, TOPO-capped QDs were encapsulated by the amphiphilic triblock polymer. A polymer/QD ratio of 5-10 was used because molecular geometry calculations indicated that at least four polymer molecules would be required to completely encapsulate one QD. Indeed, stable encapsulation (e.g., no aggregation) was not achieved at polymer/dot ratios less than 4:1. After vacuum drying, the encapsulated dots were suspended in a polar solvent (aqueous buffer or ethanol) and were purified by gel filtration. Standard procedures were then used to crosslink free carboxylic acid groups (∼100 on each polymer molecule) with amine-containing ligands such as amino-PEGs, peptides and antibodies. Briefly, the polymer-coated dots were activated with 1 mM EDAC at pH 6 for 30 min. After purification, the activated dots were reacted with amino-PEG at a QD/PEG molar ratio of 1:50 at pH 8 for 2 h, generating PEG-linked probes. Alternatively, the activated dots were reacted with PEG at a reduced QD/PEG ratio of 1:6 at pH 8 for 20 min, and then with a tumortargeting antibody at a QD/antibody molar ratio of 1:15 for 2 h. The final QD bioconjugates were purified by column filtration or ultracentrifugation at 100,000g for 30 min. After resuspension in PBS buffer (pH 7), aggregated particles were removed by centrifugation at 6,000g for 10 min. QD-streptavidin was prepared by using the same cross-linking reagent (1 mM EDAC) and under the same experimental conditions (1:15 QD/streptavidin molar ratio, pH 8, 25 °C and 2 h) as for QD-antibody conjugates. After purification by column filtration, QD-streptavidin was mixed with biotinylated Tat (or polyarginine) at a QD/peptide molar ratio of 1:20 and was incubated at 25 °C in PBS buffer (pH 7) for 30 min with occasional sonication. The product was purified by filtration column chromatography. Conjugation of Tat or
NATURE BIOTECHNOLOGY VOLUME 22 NUMBER 8 AUGUST 2004
polyarginine to QDs was confirmed by using dual-labeled peptides (biotin at one end and an organic dye separate from QD fluorescence at the other end). The peptide-QD conjugate was added to cell culture media to a final concentration of 20 nM and was incubated at 37 °C from 1 h to 24 h. Fluorescence imaging. In vivo fluorescence imaging was accomplished by using a macro-illumination system (Lightools Research), designed specifically for small animal studies. True-color fluorescence images were obtained using dielectric long-pass filters (Chroma Tech) and a digital color camera (Optronics, Magnafire SP, Olympus America). Wavelength-resolved spectral imaging was carried out by using a spectral imaging system (CRI) comprising an optical head that includes a liquid crystal tunable filter (LCTF, with a bandwidth of 20 nm and a scanning wavelength range of 400 to 720 nm), an optical coupler and a cooled, scientific-grade monochrome CCD camera, along with image acquisition and analysis software. The tunable filter was automatically stepped in 10-nm increments from 580 to 700 nm while the camera captured images at each wavelength with constant exposure. Overall acquisition time was about 10 s. The 13 resulting TIFF images were loaded into a single data structure in memory, forming a spectral stack with a spectrum at every pixel. With spectral imaging software, small but meaningful spectral differences could be rapidly detected and analyzed. Autofluorescence spectra and QD spectra were manually selected from the spectral image using the computer mouse to select appropriate regions. Spectral unmixing algorithms (available from CRI) were applied to create the unmixed images of ‘pure’ autofluorescence and ‘pure’ QD signal, a procedure that takes about 1 s on a typical personal computer. When appropriately generated, the autofluorescence image should be uniform in intensity regardless of the presence or absence of quantum-dot signals (as is the case in Fig. 4). The identification of valid spectra for unmixing purposes need only be done initially, as the spectra can be saved in spectral libraries and reused on additional spectral stacks. Cells and tissue sections were examined by using an inverted Olympus microscope (IX-70) equipped with a digital color camera (Nikon D1), a broadband light source (ultraviolet 330–385 nm and blue 460-500 nm) and long-pass interference filters (DM 400 and 510, Chroma Tech). Wavelength-resolved spectra were obtained by using a single-stage spectrometer (SpectraPro 150, Roper Scientific). Cell, tissue and whole-animal studies. Both human breast cancer cells (MDAMB-231) and PSMA-positive human prostate cancer cells (C4-2, a lineagederived LNCaP subline) were used for implantation into immunocompromised Balb/c nude mice. These two cell lines were maintained in RPMI and T media, respectively, with 10% fetal bovine serum. Conventional immunohistochemical procedures were used to determine the binding of QD-PSMA Ab J591 conjugate to C4-2 prostate cancer cells, using both QD-PEG (no antibody) and PC-3 cells (no PSMA antigen) as negative controls. In these studies, C4-2 or PC-3 cells were cultured 2–3 d and were stained on chamber slides. QD-PSMA or QD-PEG bioconjugates (100 nM) were incubated with the cells for 1 h at 4 °C, washed and photographed. For pre-tagging of cancer cells, QDs were linked to a transduction peptide such as HIV Tat or polyarginine, as noted above, and were delivered into living cancer cells by incubation at 37 °C. After 1 h incubation, each cell was found to contain more than one million QDs, and with overnight incubation, essentially all the QDs were localized in the cell nucleus. Using protocols approved by the Institutional Animal Care and Use Committee of Emory University, ∼106 tumor cells were injected into 6- to 8-week-old nude mice subcutaneously (Charles River). Tumor growth was monitored daily until it reached the acceptable sizes. The mice were divided into two groups for passive and active targeting studies. QD bioconjugates were injected into the tail vein, at 0.4 nmol for active targeting or 6.0 nmol (about 15 times more) for passive targeting. The mice were placed under anesthesia by injection of a ketamine and xylazine mixture intraperitoneally at a dosage of 95 mg/kg and 5 mg/kg, respectively. In a dark box, illumination was provided by fiber optic lighting, and a long pass filter was used to reject scattered excitation light and to pass Stokes-shifted QD fluorescence. Fluorescent images were recorded by scientific-grade CCD cameras. After whole-body imaging, the mice were killed by CO2 overdose. Tumor and major organs were removed and frozen for histological QD uptake and distribution studies. Tissue collections
975
ARTICLES were cryosectioned into sections 5–10 µm thick, fixed with acetone at 0 °C and examined with an epifluorescence microscope (Olympus IX-70).
© 2004 Nature Publishing Group http://www.nature.com/naturebiotechnology
Note: Supplementary information is available on the Nature Biotechnology website. ACKNOWLEDGMENTS This work was supported by grants to S.N. and L.W.K.C. from the National Institutes of Health (R01 GM60562 to S.N. and P01 CA098912 to L.W.K.C.), the Georgia Cancer Coalition (Distinguished Cancer Scholar Awards), the Coulter Translational Research Program at Georgia Tech and Emory University and the Department of Defense (17-03-2-0033 to L.W.K.C.). We acknowledge Lily Yang and Binfei Zhou for technical help, and Fray F. Marshall, John A. Petros, Hyunsuk Shim and Jonathan W. Simons for stimulating discussions. We are also grateful to Millennium Pharmaceuticals for providing the PSMA monoclonal antibody (J591). COMPETING INTERESTS STATEMENT The authors declare that they have no competing financial interests. Received 2 December 2003; accepted 17 May 2004 Published online at http://www.nature.com/naturebiotechnology/ 1. Chan, W.C.W. et al. Luminescent QDs for multiplexed biological detection and imaging. Curr. Opin. Biotechnol. 13, 40–46 (2002). 2. Bruchez, M., Jr, Moronne, M., Gin, P., Weiss, S. & Alivisatos, A.P. Semiconductor nanocrystals as fluorescent biological labels. Science 281, 2013–2015 (1998). 3. Chan, W.C.W. & Nie, S.M. Quantum dot bioconjugates for ultrasensitive nonisotopic detection. Science 281, 2016–2018 (1998). 4. Mattoussi, H. et al. Self-assembly of CdSe-ZnS quantum dot bioconjugates using an engineered recombinant protein . J. Am. Chem. Soc. 122, 12142–12150 (2000). 5. Akerman, M.E., Chan, W.C.W., Laakkonen, P., Bhatia, S.N. & Ruoslahti, E. Nanocrystal targeting in vivo. Proc. Natl. Acad. Sci. USA 99, 12617–12621 (2002). 6. Dubertret, B. et al. In vivo imaging of QDs encapsulated in phospholipid micelles. Science 298, 1759–1762 (2002). 7. Wu, X.Y. et al. Immunofluorescent labeling of cancer marker Her2 and other cellular targets with semiconductor QDs. Nat. Biotechnol. 21, 41–46 (2003). 8. Jaiswal, J.K., Mattoussi, H., Mauro, J.M. & Simon, S.M. Long-term multiple color imaging of live cells using quantum dot bioconjugates. Nat. Biotechnol. 21, 47–51 (2003). 9. Larson, D.R. et al. Water-soluble quantum dots for multiphoton fluorescence imaging in vivo. Science 300, 1434–1436 (2003). 10. Ishii, D. et al. Chaperonin-mediated stabilization and ATP-triggered release of semiconductor nanoparticles. Nature 423, 628–632 (2003). 11. Medintz, I.L. et al. Self-assembled nanoscale biosensors based on quantum dot FRET donors. Nat. Mater. 2, 630–639 (2003). 12. Dahan, M. et al. Diffusion dynamics of glycine receptors revealed by single–quantum dot tracking. Science 302, 442–445 (2003). 13. Rosenthal, S.J. et al. Targeting cell surface receptors with ligand-conjugated nanocrystals. J. Am. Chem. Soc.124, 4586–4594 (2002). 14. Niemeyer, C.M. Nanoparticles, proteins, and nucleic acids: biotechnology meets materials science. Angew. Chem. Int. Ed. Engl. 40, 4128–4158 (2001). 15. Alivisatos, A.P. Semiconductor clusters, nanocrystals, and quantum dots. Science 271, 933–937 (1996). 16. Han, M.Y., Gao, X.H., Su, J.Z. & Nie, S.M. Quantum dot-tagged microbeads for multiplexed optical coding of biomolecules. Nat. Biotechnol. 19, 631–635 (2001). 17. Gao, X.H. & Nie, S.M. Doping mesoporous materials with multicolor quantum dots. J. Phys. Chem. B. 107, 11575–11578 (2003). 18. Gao, X.H. & Nie, S.M. Quantum dot-encoded mesoporous beads with high brightness and uniformity: rapid readout using flow cytometry. Anal. Chem. 76, 2406–2410 (2004). 19. Josephson, L., Kircher, M.F., Mahmood, U., Tang, Y. & Weissleder, R. Near-infrared fluorescent nanoparticles as combined MR/optical imaging probes. Bioconjug. Chem. 13, 554–560 (2002). 20. Gao, X.H. & Nie, S.M. Molecular profiling of single cells and tissue specimens with quantum dots. Trends Biotechnol. 21, 371–373 (2003). 21. Jovin, T.M. Quantum dots finally come of age. Nat. Biotechnol. 21, 32–33 (2003). 22. Lim, Y.T. et al. Selection of quantum dot wavelengths for biomedical assays and imaging. Mol. Imaging 2, 50–64 (2003). 23. Ballou, B., Lagerholm, B.C., Ernst, L.A., Bruchez, M.P. & Waggoner, A.S. Noninvasive imaging of quantum dots in mice. Bioconjug. Chem. 15, 79–86 (2004). 24. Kim, S. et al. Near-infrared fluorescent type II quantum dots for sentinel lymph node mapping. Nat. Biotechnol. 22, 93–95 (2004). 25. Lidke, D.S. et al. Quantum dot ligands provide new insights into erbB/HER recep-
976
tor–mediated signal transduction. Nat. Biotechnol. 22, 198–203 (2004). 26. Savic, R., Luo, L.B., Eisenberg, A. & Maysinger, D. Micellar nanocontainers distribute to defined cytoplasmic organelles. Science 300, 615–618 (2003). 27. Allen, C., Maysinger, D. & Eisenberg, A. Nano-engineering block copolymer aggregates for drug delivery. Colloids Surf. B Biointerfaces 16, 3–27 (1999). 28. Ludwigs, S. et al. Self-assembly of functional nanostructures from ABC triblock copolymers. Nat. Mater. 2, 744–747 (2003). 29. Ness, J.M., Akhtar, R.S., Latham, C.B. & Roth, K.A. Combined tyramide signal amplification and quantum dots for sensitive and photostable immunofluorescence detection. J. Histochem. Cytochem. 51, 981–987 (2003). 30. Nirmal, M. et al. Fluorescence intermittency in single cadmium selenide nanocrystals Nature 383, 802–804 (1996). 31. Empedocles, S.A. & Bawendi, M.G. Quantum-confined stark effect in single CdSe nanocrystallite quantum dots. Science 278, 2114–2117 (1997). 32. Kirpotin, D. et al. Sterically stabilized anti-HER2 immunoliposomes: design and targeting to human breast cancer cell in vitro. Biochemistry 36, 66–75 (1997). 33. Duncan, R. The dawning era of polymer therapeutics. Nat. Rev. Drug Discov. 2, 347–360 (2003). 34. Jain, R.K. Transport of molecules, particles, and cells in solid tumors. Ann. Rev. Biomed. Eng. 1, 241–263 (1999). 35. Jain, R.K. Delivery of molecular medicine to solid tumors: lessons from in vivo imaging of gene expression and function. J. Control. Release 74, 7–25 (2001). 36. Chang, S.S., Reuter, V.E., Heston, W.D.W. & Gaudin, P.B. Metastatic renal cell carcinoma neovasculature expresses prostate-specific membrane antigen. Urology 57, 801–805 (2001). 37. Schulke, N. et al. The homodimer of prostate-specific membrane antigen is a functional target for cancer therapy. Proc. Natl. Acad. Sci. USA 100, 12590–12595 (2003). 38. Bander, N.H. et al. Targeting metastatic prostate cancer with radiolabeled monoclonal antibody J591 to the extracellular domain of prostate specific membrane antigen. J. Urol. 170, 1717–1721 (2003). 39. Wunderbaldinger, P., Josephson, L. & Weissleder, R. Tat peptide directs enhanced clearance and hepatic permeability of magnetic nanoparticles. Bioconjug. Chem. 13, 264–268 (2002). 40. Campbell, R.B. et al. Cationic Charge Determines the Distribution of Liposomes between the Vascular and Extravascular Compartments of Tumors. Cancer Res. 62, 6831–6836 (2002). 41. Levenson, R.M. Spectral imaging and pathology: seeing more. Lab. Med. 35, 244–251 (2004). 42. Yang, M. et al. Direct external imaging of nascent cancer, tumor progression, angiogenesis, and metastasis on internal organs in the fluorescent orthotopic model. Proc. Natl. Acad. Sci. USA 99, 3824–3829 (2002). 43. Lewin, M. el al. Tat peptide-derivatized magnetic nanoparticles allow in vivo tracking and recovery of progenitor cells. Nat. Biotechnol 18, 410–414 (2000). 44. Randolph, G.J., Inaba, K., Robbiani, D.F., Steinman, R.M. & Muller, W.A. Differentiation of phagocytic monocytes into lymph node dendritic cells in vivo. Immunity 11, 753–761 (1999). 45. Hess, B.C. et al. Surface transformation and photoinduced recovery in CdSe nanocrystals. Phys. Rev. Lett. 86, 3132–3135 (2001). 46. Manna, L., Scher, E.C., Li, L.-S. & Alivisatos, A.P. Epitaxial growth and photochemical annealing of graded CdS/ZnS shells on colloidal CdSe nanorods. J. Am. Chem. Soc. 124, 7136–7145 (2002). 47. Mammen, M., Choi, S.K. & Whitesides, G.M. Polyvalent interactions in biological systems: implications for design and use of multivalent ligands and inhibitors. Angew. Chem. Int. Edn Engl. 37, 2754–2794 (1998). 48. Jin, R., Wu, G., Li, Z. & Mirkin, C.A. & and Schatz, G.C. What controls the melting properties of DNA-linked gold nanoparticle assemblies. J. Am. Chem. Soc. 125, 1643–1654 (2003). 49. Cheong, W.F., Prahl, S.A. & Welch, A.J. A review of the optical properties of biological tissues. IEEE J. Quantum Electron. 26, 2166–2185 (1990). 50. Ntziachristos, V., Bremer, C. & Weissleder, R. Fluorescence imaging with nearinfrared light: new technological advances that enable in vivo molecular imaging. Eur. Radiol. 13, 195–208 (2003). 51. Bailey, R.E. & Nie, S.M. Alloyed semiconductor QDs: tuning the optical properties without changing the particle size. J. Am. Chem. Soc. 125, 7100–7106 (2003). 52. Kim, S., Fisher, B., Eisler, H.J. & Bawendi, M.G. Type-II quantum dots: CdTe/CdSe (core/shell) and CdSe/ZnTe (core/shell) heterostructures. J. Am. Chem. Soc. 125, 11466–11467 (2003). 53. Derfus, A.M., Chan, W.C.W. & Bhatia, S.N. Probing the cytotoxicity of semiconductor quantum dots. Nano Lett. 4, 11–18 (2004). 54. Peng, Z.A. & Peng, X. Formation of high-quality CdTe, CdSe, and CdS nanocrystals using CdO as precursor. J. Am. Chem. Soc.123, 183–184 (2001). 55. Qu, L.H., Peng, Z.A. & Peng, X. Alternative routes toward high quality CdSe nanocrystals. Nano Lett. 1, 333–337 (2001). 56. Hsieh, C.L. et al. Improved gene-expression by a modified bicistronic retroviral vector. Biochem. Bioph. Res. Commun. 214, 910–917 (1995).
VOLUME 22 NUMBER 8 AUGUST 2004 NATURE BIOTECHNOLOGY
In vivo cancer targeting and imaging with semiconductor quantum dots
Xiaohu Gao,1 Yuanyuan Cui,2 Richard M. Levenson,3 Leland W. K. Chung2 and Shuming Nie1
1
Departments of Biomedical Engineering, Chemistry, Hematology and Oncology, and the
Winship Cancer Institute, Emory University and Georgia Institute of Technology, 1639 Pierce Drive, Suite 2001, Atlanta, GA 30322, USA. 2Department of Urology and Winship Cancer Institute, Emory University, 1365 Clifton Road, Suite B5101, Atlanta, GA 30322, USA. 3Cambridge Research & Instrumentation, Inc., 35-B Cabot Road, Woburn, MA 01801, USA. Correspondence should be addressed to L.W.K.C. (
[email protected]) or S. N. (
[email protected]).
Supplementary Notes
1. Comparison of red QDs and red organic dyes for in-vivo fluorescence imaging In addition to a comparison of red-emitting QDs and green fluorescent proteins (GFP), we have further evaluated the performance of color-matched QDs and organic dyes for in vivo optical imaging. Supplementary Figure 1 shows in vivo imaging data for the same number (~1,000) of QD-tagged and dye-labeled cells in two spectral windows. In the first spectral window (470-nm excitation and 515-nm long-pass emission, Fig. 1a), the QD signals were seen as a red/orange glow, but no signals were detected from the dye-labeled cells. The reason for this difference is that the red organic dye is not efficiently excited at 470 nm. In the second spectral window (570-nm excitation and 600-nm long-pass emission, Fig. 1b), the fluorescence signals significantly overlap with the mouse skin autofluorescence. The QD-tagged cells were still detected as a spot brighter than the autofluorescence, but the dye-labeled cells did not show signals above the background. Although this comparison is not calibrated and is not quantitative, it does indicate that QDs have both spectral shifting and brightness advantages over organic dyes for in vivo fluorescence imaging.
2. Mouse autofluorescence and QD wavelength shifting Due to the unique excitation profiles of semiconductor QDs, a blue light source can be used to excite red-emitting QDs, leading to Stokes wavelength shifts as large as 300350 nm. This novel feature becomes critically important when examining complex animal tissues and clinical human specimens because these “real-world” materials often exhibit background emission (autofluorescence) across the entire visible spectrum. Supplementary Figure 2a shows autofluorescence spectra obtained from a nude mouse skin specimen at four excitation wavelengths (centered at 350, 480, 535 and 560 nm, respectively). The results demonstrate that the mouse autofluorescence is extremely board and complex, and can be excited across the visible spectrum. Organic dyes and fluorescent proteins give rise to small Stokes shifts, and their emission signals are often in the same spectral region as background fluorescence. This leads to a serious spectral overlap that limits the detection sensitivity (signal-to-noise ratio) of in vivo optical imaging. On the other hand, the emission spectra of QDs can be shifted to a region where autofluorescence is significantly reduced, thus improving the signal-tonoise ratios. Supplementary Figure 2b shows the mouse skin and QD emission spectra obtained under the same excitation conditions (UV lamp excitation at 350 nm). The red curve is the fluorescence spectrum obtained from a mixture of green and red QDs, with emission peaks at 520 nm and 650 nm, respectively. The light blue curve is the autofluorescence spectrum excited in the UV. The solid blue curve is a combination of the mouse skin and QD spectra. This comparison indicates significant background interference at 520 nm, but this interference is greatly reduced at 650 nm. It is remarkable that the QD emission spectrum is shifted away from the excitation wavelength by as much as 300 nm. This large spectral shift effectively moves the QD signals to a region where the autofluorescence is minimal.
3. Synthesis of high-quality quantum dots (Supplementary Method) To prepare high-quality QDs suitable for block polymer encapsulation and in-vivo imaging, we synthesized core CdSe nanocrystals by using the procedure of Peng et al (J. Am. Chem. Soc. 123, 183, 2001) and coated the core particles with a CdS shell (1nm thick) by the procedure of Hines et al. (J. Phys. Chem. B 100, 468-471, 1996). Briefly, cadmium oxide (CdO, 0.2 millimole) precursor was first dissolved in 0.5 g stearic acid and 2 g TOPO with heating under argon flow. After formation of a clear solution, the reaction was cooled down to room temperature, followed by addition of 2 g HDA, which was then heated back to 250 ºC under argon for 10 minutes. The temperature was briefly raised to 360 ºC, and equal molar selenium solution (in 2 ml in TOP) was quickly injected into the hot solvents. The mixture immediately changed color to orangered, indicating quantum dot formation. The dots were refluxed for 30 minutes and cooled to 220 ºC. A capping solution of 0.1 millimole dimethylzinc and hexamethlydisilathiane in 5 ml TOP was slowly added over a time course of 10 min at 220 ºC and was refluxed for 30 min. The CdSe/ZnS dots formed have emission wavelength around 630-640 nm and excellent chemical and photo stability. The reaction mixture was then cooled to room temperature, and the dots were extracted with solvent methanol/hexane mixture (v/v 1:2).
In vivo cancer targeting and imaging with semiconductor quantum dots
Xiaohu Gao,1 Yuanyuan Cui,2 Richard M. Levenson,3 Leland W. K. Chung2 and Shuming Nie1
Supplementary Figure 1 Comparison of red-emitting QDs and red organic dyes for in vivo optical imaging. Image (a) was obtained with blue excitation at 470 nm and 515-nm long-pass emission, and image (b) was obtained with yellow excitation at 570 nm and 600-nm long-pass emission. Cancer cells (MDA-MB-231) were labeled with either Tat-QD or Tat-nanobeads (250-nm particles with embedded organic dyes, λex = 575, and λem = 615 nm, Sigma-Aldrich, St Louis, MO) in cell culture. Prior to injection, the QD- and dye-labeled cells were similarly bright when examined with an epi-fluorescence microscope. Approximately 1000 cells were injected subcutaneously into a living mouse at two adjacent sites for in vivo imaging.
Supplementary Figure 2 (a)Autofluorescence
spectra of a nude mouse skin specimen obtained at
four excitation wavelengths (350, 480, 535 and 560 nm). Note the presence of significant autofluorescence up to 800-850 nm and a background peak at ca. 670 nm. (b) Fluorescence spectra of mouse skin and QDs with UV excitation. Due to the large Stokes shift of QDs, their fluorescence signals can be shifted to a spectral region where the autofluorescence is reduced. See text for further discussion.