Budget
Budget TOTAL UNIVERSITY BUDGET The 2010-2011 budget for George Mason University (GMU) is projected to generate $889.8 million in revenue. Revenue is derived from a variety of sources, with General Fund appropriations from the Commonwealth of Virginia ($114.9 million), student tuition and fees ($333.9 million), and sponsored research programs ($113.0 million) being the most significant sources. The GMU budget is expended within seven programs: Educational and General (E&G), Auxiliary Enterprises, Sponsored Research, Equipment Trust Fund, Capital Outlay, Student Financial Aid, and Private Funds. Educational and General is the largest of these programs, with budgeted revenue and expenditures of $390.6 million for 2010-2011. Fig. 7.1. 2010-11 University Original Budget - Total $889.8 million Private Funds - $23.0
State Financial Aid - $14.3 Equipment Trust Fund - $3.2
Independent Operations - $43.6 Student Fees - $58.2
Tuition and Miscellaneous - $275.7
Auxiliary Enterprise Revenue - $99.3
Sponsored Programs - $113.0 Capital Outlay - $144.6 General Fund - $114.9
TABLE 7.1 2010-2011 University Original Budget Amount Category ($ in millions) Tuition & Miscellaneous 275.7
% of Total 27.0
Capital Outlay
144.6
24.4
General Fund
114.9
13.3
Sponsored Programs
113.0
11.4
Auxiliary Enterprise Revenue
99.3
8.8
Student Fees
58.2
5.7
Independent Operations
43.6
5.1
Private Funds
23.0
2.4
State Financial Aid
14.3
1.6
3.2
0.4
889.8
100
Equipment Trust Fund Total Budget Note: Numbers may not add up to total due to rounding.
2010-11 Factbook • 88
Budget
BUDGET BREAKDOWN AND COMPARISON WITH LAST TWO YEARS Overall, the George Mason University budget increased by 0.3% in 2010-11 as compared to the prior year. Major areas of growth are tuition and auxiliary enterprises while major areas of reduction are in the general fund and capital outlay.
TABLE 7.2 Budget Breakdown and Comparison 2008-2009 ($ in millions) Educational and General General Fund 140.5 Tuition/Misc. 213.0 Auxiliary Enterprises Student Fees 45.5 Aux. Ent. Revenue 70.9 Independent Operations 35.5 Sponsored Programs 82.0 State Financial Aid 13.0 Equipment Trust Fund 3.5 Private Funds 20.0 Capital Outlay 265.8 Total
89 • 2010-11 Factbook
889.7
2009-2010 ($ in millions)
2010-2011 ($ in millions)
% Change from 09-10 to 10-11
118.2 239.3
114.9 275.7
-2.8 15.2
50.5 78.1 45.3 100.7 14.3 3.5 21.0 216.2
58.2 99.3 43.6 113 14.3 3.2 23.0 144.6
15.2 27.1 -3.8 12.2 0.0 -8.6 9.5 -33.1
887.1
889.8
0.3
Budget
EDUCATIONAL AND GENERAL BUDGET The General Fund, within the original 2010-11 budget, will provide approximately 29.4% of the total E&G revenues of $391 million, with tuition and other sources of revenue providing the remaining 70.6%. General Fund support in 2010-11 is 3.3% ($3.6 million) more than the original 2009-10 budget. Educational and General consists of seven sub-programs: Instruction, Public Service, Libraries, Academic Support, Student Services, Institutional Support, and Physical Plant. The largest of these is Instruction (which includes institution-based research), accounting for 58.9% of E&G expenditures. Approximately 75.5% of the overall E&G budget is spent on personnel costs (salary, wages and benefits), with the remaining 24.5% spent on supplies, utilities, equipment, contractual services and other non-personnel expenses. TABLE 7.3 Educational and General Funds Revenues by Source 2006-2007 Actual ($)
Source
2007-2008 Actual ($)
2008-2009 Actual($)
2009-2010 Actual($)
2010-2011 Original Budget ($)
General Fund State Appropriation
127,035,672
137,605,572
130,577,141
111,310,588
$114,951,947
Tuition Admission/Graduation Fees Higher Ed. Operating Revenues Clinics/Fees Public Service/Community Education Indirect Cost Reimbursement ARRA Funds* Miscellaneous English Language Institute Other Total Non-General Fund Revenue Total E&G Revenues Annualized FTE**
158,701,977 1,739,996 160,441,973 284,783
171,757,938 1,743,954 173,501,892 332,553
191,276,326 1,860,033 193,136,359 328,520
215,283,229 2,339,595 217,622,824 287,961
236,005,006 1,954,474 237,959,480 298,000
2,470,430 3,150,000
3,078,157 3,150,246 0 13,337,876 1,736,113 21,634,945 195,136,837 332,742,409 22,985.0
2,623,479 3,150,000 0 8,067,421 2,127,722 16,297,142 209,433,501 340,010,642 23,506.0
3,276,635 3,147,151 6,203,142 6,783,868 2,257,078 21,955,835 $239,578,659 $350,889,247 24,759.0
2,580,543 3,400,000 19,894,643 9,829,873 1,753,914 37,756,973 $275,716,453 $390,668,400 25,800.0
9,144,961 1,795,092 16,845,266 177,287,239 304,322,911 22,710.4
** 2010-11 FTE is estimated * American Recovery and Reinvestment Act
Fig. 7.2 Educational and General Fund Revenue Trends 400 350 Dollars (in millions)
300 250
Non-General Fund Revenue
200
General Fund State Appropriation
150 100 50
0
2006-07
2007-08
2008-09
2009-10
Fiscal Year
2010-11 2010-11 Factbook • 90
Budget
EDUCATIONAL AND GENERAL EXPENDITURES BY PROGRAM AREA Fig. 7.3 E&G Expenditures by Program Area, Fiscal Year 2010-11
Academic Support 8.3% Institutional Support 12.7%
Instruction 58.9%
Student Services 4.6% Physical Plant 9.7%
Public Service 0.6%
Libraries 5.3%
TABLE 7.4 Educational and General Expenditures by Program Area Program Area Instruction Public Service
2008-2009 Actual ($) 202,537,364
% of Total 59.57
2009-2010 Actual ($) $211,028,576
% of Total 60.14
2010-2011 Original Budget ($) $229,917,900
% of Total 58.85
1,325,863
0.39
1,890,280
0.54
2,214,900
0.57
Libraries
20,742,163
6.10
21,026,674
5.99
20,500,800
5.25
Academic Support
27,998,535
8.23
26,518,429
7.56
32,329,800
8.28
Student Services
19,758,158
5.81
19,886,849
5.67
17,969,600
4.60
Institutional Support
39,600,328
11.65
41,035,781
11.69
49,718,600
12.73
Physical Plant
28,048,231
8.25
29,502,658
8.41
38,016,800
9.73
$340,010,642
100.00
$350,889,247
100.00
$390,668,400
100.00
Total % Change
2.18
Note: Numbers may not add up to totals due to rounding.
91 • 2010-11 Factbook
3.20
11.34
Budget
EDUCATIONAL AND GENERAL BASE BUDGET TABLE 7.5 2010-2011 Educational and General Base Budget, Summary by Unit Personnel NonTotal Unit Services ($) Personnel ($) FTE Co�llege of Education & Human Dev 17,929,600 4,491,300 229.18 14,472,000 1,099,600 149.98 College of Health & Human Services
Total Budget ($)
% of Total
22,420,900 15,571,600
5.58 3.99
College of Humanities & Social Sciences College of Science
50,630,500 25,217,000
2,049,100 4,313,900
653.03 282.58
52,679,600 29,530,900
13.48 7.56
College of Visual and Performing Arts
10,226,500
538,500
126.16
10,765,000
2.76
3,554,600 1,721,700
83,700 139,200
34.37 14.99
3,638,300 1,860,900
1.00 0.48
School of Law
11,696,200
2,445,700
97.27
14,141,900
3.62
School of Management
19,290,000
3,707,200
162.85
22,997,200
5.89
School of Public Policy
11,147,400
640,800
92.83
11,788,200
3.02
61,500
17,700
0.00
79,200
0.02
21,849,500 $187,796,500
1,070,300 $20,597,000
238.73 2,081.97
22,919,800 208,393,500
6.10 53.48
9,727,800
1,740,800
127.41
11,468,600
2.94
0
1,100,000
0.00
1,100,000
0.28
Library
9,068,300
9,499,700
126.75
18,568,000
4.75
Professional Development
1,378,200
935,700
20.00
2,313,900
0.59
11,209,900
2,735,500
105.91
13,945,400
3.57
0
6,242,000
0.00
6,242,000
1.62
7,393,700
813,900
93.62
8,207,600
2.22
$38,777,900
$23,067,600
473.69
61,845,500
15.83
$226,574,400
$43,664,600
2,555.66
270,239,000
69.17
20,959,200
8,363,800
213.50
29,323,000
7.51
New Administrative Systems Subtotal Information Technology
0
0
0.00
0
0.00
20,959,200
8,363,800
213.50
29,323,000
7.51
Finance and Planning
11,516,200
1,976,200
140.95
13,492,400
3.45
Plant/Facilities
18,093,600
15,334,400
261.80
33,428,000
8.56
2,630,100
481,300
23.02
3,111,400
0.80
0
9,359,200
0.00
9,359,200
2.40
Regional Campus Support
1,451,900
410,900
15.00
1,862,800
0.48
Security/Operations
6,213,100
2,676,200
85.00
8,889,300
2.28
University Development
3,322,500
876,400
32.63
4,198,900
1.07
Conflict Analysis and Resolution Krasnow Institute
Summer Term Volgenau School of Information Technology and Engineering Subtotal Academic Units Enrollment Services Eminent Scholars
Provost Student Financial Aid University Life Subtotal Academic Support Total Academic Information Technology Unit
President/Equity/Internal Audit Property Rental
University Relations Total Non-Academic Central Total % of Total
3,433,700
2,150,400
39.35
5,584,100
1.43
$46,661,100
$33,265,000
597.75
79,926,100
20.46
795,900
10,384,400
0.00
11,180,300
2.86
$294,990,600
$95,677,800
3,366.91
390,668,400
100.00
75.5
24.5
100.0
Note: Numbers may not add up to subtotals/totals due to rounding.
2010-11 Factbook • 92
Budget
EDUCATIONAL AND GENERAL BUDGET SUMMARY BY MAJOR UNIT Fig. 7.4 Educational and General Base Budget Summary by Major Unit, Fiscal Year 2010-11
Central
Other Non-academic Support Property Rental $9,359,200
$11,180,300
$37,138,900
Plant/Facilities $33,428,000
Academic Units $208,393,500
Information Technology $29,323,000
Academic Support $61,845,500 TABLE 7.6 Educational and General Budget Summary by Major Unit 2008-09 2009-10 Actual ($) Budget ($) 199,585,478 202,109,159 Academic Units
2010-11 Budget ($) 208,393,500
% Change FY10 to FY11 3.11
Academic Support
50,974,920
53,967,786
61,845,500
14.60
Information Technology
28,024,927
27,792,402
29,323,000
5.51
Plant/Facilities
22,464,078
22,949,728
33,428,000
45.66
Property Rental
5,882,260
7,341,284
9,359,200
27.49
Other Non-academic Support
39,393,476
39,957,290
37,138,900
-7.05
Central
-6,314,497
-3,228,402
11,180,300
446.31
$340,010,642
$350,889,247
$390,668,400
11.34
Total
AUXILIARY ENTERPRISES Auxiliary Enterprises consists of activities that are ancillary to the university’s central mission of instruction, service, and research. Auxiliary Enterprises is the second largest program of the university’s operation, with budgeted revenues of $157.7 million and expenditures of $155.5 million. Mandatory student fees provide approximately 36.9% of Auxiliary Enterprises revenue. The remaining 63.1% is obtained from self-generated user fees of the activities themselves (for example, student room and board fees, parking fees, ticket sales). State appropriations are not made available for Auxiliary Enterprises activities. The nature of these enterprises makes them less personnel-intensive than E&G activities, with 24.7% of expenditures going to salaries, wages and benefits. Non-personnel costs account for approximately 48.6% of expenditures, with the remainder going to debt service and other costs.
93 • 2010-11 Factbook
Budget
TABLE 7.7 Auxiliary Enterprises: Budgeted Revenues and Expenditures by Source, FY 2010-11
Source
AE Multicampus AE Reserve - Other Increases (2) AE Reserve - Utils & Equip (1) All-University Card System Aquia Building - Debt Arts Centers Athletic Facility Improvments Auxilary Operations Budget & Planning Campus Access Campus Police Cadets Child Development Center College of Humanities and Social Sciences Computer Store Facility Reserves Fairfax Aquatic Center Food Service (Meal Plans) Freedom Aquatic and Fitness Center Hotel & Conference Center Housing and Residential Life Indirect Cost Intercollegiate Athletics Patriot Center Print Services REC Athletic Complex REC Sports Club REC Sports Complex Salary Increases Skyline Fitness Center Student Centers Student Health Services Telecommunications Transportation University Life University Scholars University Services Warehouse Total Auxiliary Enterprise Budget % of Total
Revenue Self% of Generated Total ($)
Student Fees ($) 72,500 564, 697 208,500 678,056 637,389 5,194,470 200,000 521,655 107,900 480,788 132,934 0 315,643
0.12 0.97 0.36 1.16 1.09 8.90 0.34 0.89 0.18 0.82 0.23 0.00 0.54
0 900,000 2,831,255 0 146,338 0 0 6,400,000 11,575,713 1,614,876 45,000 3,227,551 587,304 1,874,188 544,529 255,374 8,088,441 2,235,850 153,722 2,130,138 4,853,980 799,250 971,959
0
58,350,000 37.01
Expenditures Total Revenue ($)
0 8,838,657 0 1,301,400 3,000
72,500 2,592,558 208,500 787,056 637,389 12,001,094 200,000 521,655 107,900 9,319,445 132,934 1,301,400 $318,643
0.00 1.54 0.00 0.00 0.00 0.00 0.00 10.97 19.84 2.77 0.08 5.53 1.01 3.21 0.93 0.44 13.86 3.83 0.26 3.65 8.32 1.37 1.67
3,400,000 0 909,163 12,656,900 6,418,858 9,347,985 28,981,660 0 4,244,793 125,000 1,582,300 87,265 86,150 80,350 0 0 3,259,999 1,844,860 4,067,655 1,034,735 1,611,500 125,750 70,000
3,400,000 900,000 3,740,418 12,656,900 6,565,196 9,347,985 28,981,660 6,400,000 15,820,506 1,739,876 1,627,300 3,314,816 673,454 1,954,538 544,529 255,374 11,348,440 4,080,710 4,221,377 3,164,873 6,465,480 925,000 1,041,959
0.00
287,535
287,535
94.90
2,027,861 0 109,000 0 6,806,624 0
99,309,000 62.99
157,659,000 100.00
Operating Expenses ($)
Debt Service ($)
72,500
0
674,639
0
208,500 787,056 0 8,809,090 200,000 521,655
0 0 637,389 3,192,004 0 0
107,900
0
3,952,880 132,934 1,174,800 318,643
5,366,565 0 126,600 0
3,300,000
0
0
0
2,324,951 12,656,900 5,189,446 7,576,922 15,680,730
1,415,467 0 1,342,470 2,753,713 13,300,930
6,400,000
0
15,820,506 973,636 1,627,300 1,043,845 673,454 1,763,413 544,529 255,374 6,486,135 4,080,710 4,091,421 3,164,873 6,465,480 925,000 1,041,959
0
119,047,181 76.56
0 766,240 0 2,270,971 0 191,125 0 0 4,787,310 0 0 0 0 0
0 287,535
36,438,319 23.44
Total Expense ($) 72,500 674,639 208,500 787,056 637,389 12,001,094 200,000 521,655 107,900 9,319,445 132,934 1,301,400 318,643 3,300,000 0 3,740,418 12,656,900 6,531,916 10,330,635 28,981,660 6,400,000 15,820,506 1,739,876 1,627,300 3,314,816 673,454 1,954,538 544,529 255,374 11,273,445 4,080,710 4,091,421 3,164,873 6,465,480 925,000 1,041,959
287,535
155,485,500 100.00
Note: Numbers may not add up to totals due to rounding. (1) - Amount set aside to address unforeseen equipment needs and/or higher than anticipated utility costs. (2) - Amount set aside to address unforeseen operational items that occur during the course of the fiscal year.
2010-11 Factbook • 94
Budget
AUXILIARY ENTERPRISES: 2010-11 REVENUE AND EXPENSE BUDGETS Fig. 7.5 Auxiliary Enterprises (Revenue $157.66 million)
Other - 21.7% Student Fees - 36.9% Athletic Scholarships - 2.3% Student Unions - 2.1% Campus Access and Transportation - 6.3% Arts Centers- 4.3%
Food Services(Meal Plans) - 8.0%
Housing and Residential Life - 18.4%
Fig. 7.6 Auxiliary Enterprises (Expenditures $155.49 million) Athletic and University Scholarship- 3.2%
Debt Service - 23.5%
Personnel Services - 24.7%
Non-personnel - 48.6%
95 • 2010-11 Factbook
Budget
STUDENT TUITION AND FEES The tuition rate for a full-time undergraduate student domiciled in Virginia is $8,684 for the 2010-2011 academic year. This consists of $6,266 for tuition, $54 for the technology fee and $2,364 for student fees. Different rates apply to out-of-state, graduate, and law students. TABLE 7.8 Tuition and Fee Rates (Last Ten Years Trend) Out-ofNonIn-State State E&G TechnoTuition Tuition Fees logy Fee Academic Year ($) ($) ($) ($) 2001-2002 Undergraduate 2,376 11,280 1,374 42.00 Law 6,685 17,297 1,365 42.00 Graduate 3,168 11,280 1,374 42.00 2002-2003 Undergraduate 3,168 12,468 1,398 42.00 Law 7,880 17,989 1,393 42.00 Graduate 3,756 12,468 1,398 42.00 2003-2004 Undergraduate 3,630 13,470 1,440 42.00 Law 8,789 18,939 1,431 42.00 Graduate 4,398 13,470 1,440 42.00 2004-2005 Undergraduate 3,942 14,310 1,464 42.00 Law 9,409 20,035 1,455 42.00 Graduate 4,758 14,310 1,464 42.00 2005-2006 Undergraduate 4,302 15,582 1,524 54.00 Law 11,370 22,934 1,512 54.00 Graduate 5,190 15,582 1,524 54.00 2006-2007 Undergraduate 4,698 16,842 1,656 54.00 Law 13,582 24,810 1,638 54.00 Graduate 5,670 16,842 1,656 54.00 2007-2008 Undergraduate 4,981 17,869 1,805 54.00 Law 14,870 26,686 1,792 54.00 Graduate 6,229 18,421 1,805 54.00 2008-2009 Undergraduate 5,472 20,436* 1,986 54.00 Law 16,713 29,929 1,965 54.00 Graduate 6,840 20,232 1,986 54.00 2009-2010** Undergraduate 5,786 21,770* 2,184 54.00 Law 18,346 32,010 2,156 54.00 Graduate 7,514 21,650 2,184 54.00 2010-2011** Undergraduate 6,266 23,030* 2,364 54.00 Law 19,830 33,886 2,338 54.00 Graduate 8,138 22,898 2,364 54.00
In-State Total ($)
Out-ofState Total ($)
In-State Per Credit Hour ($)
Out-ofState Per Credit Hour ($)
3,792 8,092 4,584
12,696 18,704 12,696
158.00 289.00 191.00
529.00 668.00 529.00
4,608 9,315 5,196
13,908 19,424 13,908
192.00 332.68 216.50
579.50 693.71 579.50
5,112 10,262 5,880
14,952 20,412 14,952
213.00 366.50 245.00
623.00 729.00 623.00
5,448 10,906 6,264
15,816 21,532 15,816
227.00 389.50 261.00
659.00 769.00 659.00
5,880 12,936 6,768
17,160 24,500 17,160
245.00 462.00 282.00
715.00 875.00 715.00
6,408 15,274 7,380
18,552 26,502 18,552
267.00 545.50 307.50
773.00 946.50 773.00
6,840 16,716 8,088
19,728 28,532 20,280
285.00 597.00 337.00
822.00 1,019.00 845.00
7,512 18,732 8,880
22,476 31,948 22,272
313.00 669.00 370.00
936.50 1,141.00 928.00
8,024 20,556 9,752
24,008 34,220 23,888
334.33 734.14 406.33
1,000.33 1,222.14 995.33
8,684 22,222 10,556
25,448 36,278 25,316
361.83 793.64 439.83
1,060.33 1,295.64 1,054.83
*Tuition reflects the rate for out-of-state undergraduates who matriculated in the Fall 2008 semester or later; 2010-2011 tuition for out-of-state undergraduates who matriculated before the Fall 2008 semester is $22,082. ** Tuition for Academic Years 2009-2010 and 2010-2011 includes $200 for the education resources fee.
2010-11 Factbook • 96
Budget
TUITION AND FEE RATES HISTORY (2001-02 THROUGH 2010-11) Fig. 7.7 Full-Time, In-State Undergraduate Tuition and Fee Rates
Dollars
6,500
Tuition
6,000 5,500 5,000 4,500 4,000 3,500 3,000 2,500
Fees
2,000 1,500 1,000
Technology Fees
500 0
01-02 02-03 03-04 04-05 05-06 06-07 07-08 08-09 09-10
10-11
Fig. 7.8 In-State Undergraduate Vs. Out-of-State Undergraduate Total Tuition and Fees Costs
Dollars 27,000
Out-of-State
24,000 21,000 18,000 15,000 12,000 9,000
In-State
6,000 3,000 0
01-02 02-03 03-04 04-05 05-06 06-07 07-08 08-09 09-10 10-11
97 • 2010-11 Factbook
Budget
CAMPUS BUILDINGS TABLE 7.9 Campus Buildings by First Year of Occupancy Calendar Year Building
Gross Square Footage (sq. ft.)
Gross Replacement Value ($)
1960
George’s Hall
7,500
602,752
1964
East Building
13,110
1,197,751
1964
Finley Building
19,633
1,478,670
1964
Krug Hall
31,904
3,726,312
1964
Lecture Hall
7,998
739,204
1964
West Building
18,385
1,628,467
1967
Carty House
3,488
120,000
1967
Fenwick Library
140,600
14,131,312
1968
Development House
4,951
341,266
1968
Earle House
2,099
86,035
1968
Strong House
1,873
86,019
1968
Tallwood House
6,641
292,297
1971
Thompson Hall
71,957
6,187,221
1972
P.E. Building
61,440
4,343,005
1974
Biology Greenhouse
2,196
184,954
1974
Maintenance Building
12,002
672,175
1974
Student Union I
83,100
6,660,603
1975
Robinson Hall/Harris Theater
207,000
18,197,143
1976
Cooling/Heating Plant
10,900
2,952,105
1977
Student Housing I (Apartments)
109,200
6,306,482
1980
Buchanan House
2,452
n/a
1980
Mathy House
5,400
*
1980
Arlington Metro Center
131,272
11,268,553
1980
Telecommunications House
3,203
160,941
1981
Student Housing IIA (Halls)
100,000
5,167,422
1982
Field House
117,600
6,482,376
1982
Information Booths
192
2,144
1982
King Hall
83,585
9,423,631
1982
Student Union II
90,875
9,452,347
1984
Trailers and Modules
34,052
4,501,239
* Leased Note: Gross replacement value is the total construction cost for each facility
(Continues on next page)
2010-11 Factbook • 98
Budget
TABLE 7.9 Campus Buildings by First Year of Occupancy (Continued) Calendar Year Building
Gross Square Footage (sq. ft.)
Gross Replacement Value ($)
57,912
2,526,587
162,200
16,075,606
1984
Student Housing (Patriot Village)
1985
Patriot Center
1986
4260 Chain Bridge Road (ICAR)
12,000
*
1986
Student Housing IIB (Commons)
101,380
8,713,593
1986
Student Housing IIB (University Park)
40,383
*
1987
Science and Technology I
95,068
10,065,393
1988
Humanities I (Performing Arts)
81,900
7,532,338
1989
Commerce Building I
14,738
*
1989
Humanities II (Mason Hall, College Hall, Fine Arts)
101,333
11,477,402
1989
University Police Building
3,400
300,000
1989
Student Housing III (President’s Park)
97,126
10,809,109
1990
Commerce Building II
13,572
*
1990
Center for Innovative Technology (4th Floor)
8,000
*
1990
Student Housing IV (Presidents Park)
101,955
11,277,273
1990
Humanities III (Concert Hall)
59,400
9,419,610
1991
Science and Technology II
100,000
9,517,900
1995
Enterprise Hall
101,000
11,855,823
1996
Mason Enterprise Center
3,697
*
1996
George W. Johnson Center
310,000
32,888,424
1997
Warehouse/Facilities Administration
35,170
3,052,177
1997
Krasnow Institute
22,965
4,620,299
1998
Prince William I
99,136
15,574,340
1998
Prince William II
90,000
20,385,981
1998
Arlington I
211,983
18,853,350
1998
Fairfax Aquatic and Fitness Center
66,901
11,109,662
1999
Prince William Freedom Aquatic and Fitness Center
110,607
18,023,055
1999
Prince William I - Verizon Auditorium
6,500
1,191,526
2000
North/South Chesapeake Modules
17,000
1,047,255
2000
Police Module
1,040
70,149
2000
Residence Life Module
3,360
194,395
2000
Patriot Square
15,500
*
* Leased Note: Gross replacement value is the total construction cost for each facility
99 • 2010-11 Factbook
(Continues on next page)
Budget
TABLE 7.9 Campus Buildings by First Year of Occupancy (Continued) Calendar Year Building 2000
Truland Building
2001
Gross Square Footage (sq. ft.)
Gross Replacement Value ($)
16,000
*
Democracy Lane (Psychology)
6,259
*
2001
Greenbelt Executive Center (SCS)
2,000
*
2001
Parking Garage I Expansion
90,000
4,591,259
2002
4031 University Drive (School of Computational Sciences)
2,396
*
2003
Innovation Hall
103,994
22,295,130
2003
Housing V (Liberty Square)
183,960
32,396,316
2004
Housing VI (Potomac Heights)
192,000
26,700,000
2004
Prince William IIIA (Bull Run Hall)
102,979
23,431,000
2005
Parking Garage II
360,000
14,144,253
2006
Fairfax Research I
100,000
23,632,255
2007
Aquatic Center Addition/Renovation
38,100
7,630,000
2007
Child Development Center
8,500
2,250,000
2007
Krasnow Institute Addition
12,500
6,700,000
2007
Student Housing VII (A&B)
439,000
63,800,000
2008
Student Union III (Southside and Skyline)
55,000
16,177,179
2008
Softball Field Complex
10,400
2,633,274
2009
Art and Design Building
88,000
30,100,000
2009
Long and Kimmy Nguyen Engineering Building
180,000
67,000,000
2009
Archives/Carpenter/Storage Building
7,200
990,000
2009
Rappahannock Parking Deck
840,000
33,900,000
2009
Patriot Center Renovation Addition (Phase I)
38,900
14,000,000
2009
Police & Safety Headquarters
16,615
11,000,000
2009
Recreation and Athletic Complex (formerly Physical Education Building) Addition & Renovation
106,900
30,100,000
2010
Aquia Building
55,818
24,800,000
2010
Performing Arts Building Addition
161,093
8,300,000
2010
Housing VII-C
189,120
51,400,000
2010
Mason Inn Hotel & Conference Center
173,035
52,600,000
2010
Hylton Performing Arts Center
112,353
54,000,000
2010
Biomedical Research Lab
54,543
49,800,000
2010
Founders Hall
413,532
87,900,000
* Leased Note: Gross replacement value is the total construction cost for each facility
2010-11 Factbook • 100
Budget
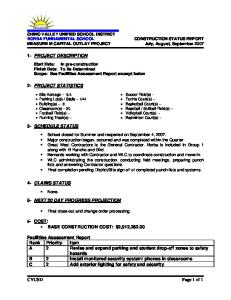
BUILDINGS OPENED IN 2010 (As of Fall 2010) Aquia Building, Fairfax Campus Square Feet: 55,818 Project Cost: $24.8 million Occupancy: Spring 2010
Hylton Performing Arts Center, Prince William Campus Square Feet: 112,353 Project Cost: $54.0 million Occupancy: Spring 2010
Performing Arts Building Addition, Fairfax Campus Square Feet: 161,093 (total for building) Project Cost: $8.3 million Occupancy: Summer 2010
Biomedical Research Lab, Prince William Campus Square Feet: 54,543 Project Cost: $49.8 million Occupancy: Summer 2010
Housing VII-C, Fairfax Campus Square Feet: 189,120 Project Cost: $51.4 million Occupancy: Summer 2010
Founders Hall, Arlington Campus Square Feet: 413,532 Project Cost: $87.9 million Occupancy: Fall 2010
Mason Inn Hotel and Conference Center, Fairfax Campus Square Feet: 173,035 Project Cost: $52.6 million Occupancy: Summer 2010
BUILDINGS UNDER CONSTRUCTION Student Union I Addition-Renovation, Fairfax Campus Square Feet: 157,771 Project Cost: $27.8 million Occupancy: Spring 2011, Summer 2011
Thompson Hall Renovation, Fairfax Campus Square Feet: 72,571 Project Cost: $10.0 million Occupancy: Fall 2011
Student Union II Renovation, Fairfax Campus Square Feet: 101,279 Project Cost: $10.5 million Occupancy: Spring 2011
Presidents Park Renovation Phase 4, Fairfax Campus Square Feet: 33451 Project Cost: $5.0 million Occupancy: Fall 2011
Krasnow Addition-Phase II, Fairfax Campus Square Feet: 15,014 Project Cost: $10.5 million Occupancy: Spring 2011
Housing VIII-A, Fairfax Campus Square Feet: 190,000 Project Cost: $53.5 million Occupancy: Spring 2012, Fall 2012
University Hall, Fairfax Campus Square Feet: 143,869 Project Cost: $34.0 million Occupancy: Summer 2011
Science and Technology II Addition-Renovation, Fairfax Campus Square Feet: 150,000 Project Cost: $47.7 million Occupancy: Summer 2013
Smithsonian/Mason Housing and Dining, Off-Campus Square Feet: 44,000 Project Cost: $14.3 million Occupancy: Fall 2012
101 • 2010-11 Factbook
Budget
PROJECTS THAT HAVE RECEIVED FUNDING FOR DESIGN AND CONSTRUCTION (PROJECTS PLANNED) Fenwick Library Addition, Fairfax Campus Square Feet: 150,000 Project Cost: $57.3 million
Student Commons Housing Renovation, Fairfax Campus Square Feet: 114,000 Project Cost: $16.0 million
Fine Arts Building Renovation, Fairfax Campus Square Feet: 33,200 Project Cost: $9.8 million
Field House Renovation, Fairfax Campus Square Feet: 149,000 Project Cost: $13.0 million
Point of View Conference Center, Off-Campus Square Feet: 23,961 Project Cost: $6.0 million
Aquatic and Fitness Center HVAC Upgrades, Fairfax Campus Square Feet: 90,700 Project Cost: $2.6 million
2010-11 Factbook • 102
Budget
FINANCE DATA FOR SCHEV-APPROVED PEER INSTITUTIONS This list of 25 peer institutions is approved and maintained as a benchmark for targeting comparative data by the State Council of Higher Education for Virginia (SCHEV). The following expenditures data have been reported to the Integrated Postsecondary Education Data Systems (IPEDS). The library amount is included in the Academic Support total. George Mason University totals have been included in the calculations for the averages. TABLE 7.10 SCHEV-Approved Peer Group Comparative Finance Data, FY 2009 University
Instruction
Research
Public Service
Academic Support*
Student Services
Institutional Support
Operations & Maint.**
Total
George Mason University
207,125,522
57,818,412
18,636,933
44,610,567
19,995,552
41,784,250
31,233,748
421,204,984
Arizona State University
454,929,000
180,901,000
43,121,000
171,546,000
51,412,000
126,920,000
87,530,000
1,116,359,000
Boston University
730,533,717
180,652,965
0
140,044,471
23,551,915
143,961,883
0
1,218,744,951
George Washington University
342,947,517
148,153,409
0
133,824,975
82,246,206
102,877,607
0
810,049,714
Georgia State University
150,854,472
102,899,486
23,980,270
51,529,181
26,255,850
37,443,892
28,468,845
421,431,996
48,607,886
103,227,306
92,532,451
886,788,582
Indiana UniversityBloomington Indiana University-Purdue University-Indianapolis
427,538,634
79,685,842
59,772,928
75,423,535
360,792,150
144,099,292
86,529,796
127,196,905
27,794,449
27,893,658
71,679,054
845,985,304
Northeastern University
261,529,824
66,662,380
3,652,989
81,321,500
71,496,253
99,262,770
0
583,925,716
SUNY at Albany
157,221,936
182,479,504
38,081,559
40,221,907
15,980,996
56,384,249
41,713,492
532,083,643
Syracuse University
281,652,923
83,735,638
0
85,833,415
44,905,622
74,024,510
0
570,152,108
University at Buffalo University of Arkansas Main Campus
318,400,426
103,764,704
7,971,787
84,574,247
23,458,364
104,011,082
70,558,361
712,738,971
122,665,192
99,454,087
69,623,591
34,754,957
18,117,768
39,296,579
41,818,621
425,730,795
University of Cincinnati-Main Campus
254,525,979
161,958,726
53,302,617
62,686,856
35,111,172
66,459,373
55,485,072
689,529,795
University of Connecticut
452,575,133
156,958,854
65,383,825
133,993,701
55,596,149
185,046,509
0
1,049,554,171
University of Houston
218,929,413
97,006,322
38,686,090
127,478,111
47,656,892
64,916,330
0
594,673,158
University of Kansas
296,734,823
201,084,728
34,616,408
77,640,856
27,577,398
54,922,942
68,531,408
761,108,563
University of Louisville
233,438,000
110,323,000
81,993,000
76,684,000
23,606,000
46,200,000
49,488,000
621,732,000
University of MarylandCollege Park
416,159,435
353,402,042
81,330,446
151,414,740
47,766,251
82,640,977
0
1,132,713,891
University of Memphis
119,100,959
35,166,391
13,671,696
28,636,207
38,212,975
27,693,913
27,071,785
289,553,926
University of MissouriColumbia
277,045,292
171,907,552
114,448,892
71,409,168
31,367,408
18,761,410
0
684,939,722
University of Nebraska-Lincoln
173,294,299
147,860,983
78,678,895
58,778,989
11,821,270
37,697,019
49,700,969
557,832,424
University of Nevada-Las Vegas
175,414,000
34,483,000
12,144,000
57,979,000
32,322,000
25,867,000
47,225,000
385,434,000
University of Nevada-Reno
178,890,778
76,265,334
47,053,958
40,487,425
28,865,675
35,219,506
39,674,252
446,456,928
University of New MexicoMain Campus
219,751,778
150,657,299
199,945,999
40,199,774
22,485,592
55,701,218
73,983,108
762,724,768
University of Oklahoma Norman Campus
207,029,000
78,897,000
74,267,000
59,179,000
18,263,000
69,493,000
34,919,000
542,047,000
Wayne State University
304,749,770
174,013,945
52,183,108
91,452,081
39,169,276
66,978,409
0
728,546,589
Average (Includes Mason)
282,454,999
130,011,227
49,964,492
82,650,060
35,140,151
69,026,361
35,062,045
684,309,335
Source: IPEDS FY08 Finance data. * Library amount is included in the Academic Support total. ** Private institutions do not use this function.
103 • 2010-11 Factbook