WP 12-51 Eleftherios Goulas University of Patras, Greece Athina Zervoyianni University of Patras, Greece The Rimini Centre for Economic Analysis (RCEA), Italy
ECONOMIC GROWTH AND CRIME: DOES UNCERTAINTY MATTER?
Copyright belongs to the author. Small sections of the text, not exceeding three paragraphs, can be used provided proper acknowledgement is given. The Rimini Centre for Economic Analysis (RCEA) was established in March 2007. RCEA is a private, nonprofit organization dedicated to independent research in Applied and Theoretical Economics and related fields. RCEA organizes seminars and workshops, sponsors a general interest journal The Review of Economic Analysis, and organizes a biennial conference: The Rimini Conference in Economics and Finance (RCEF) . The RCEA has a Canadian branch: The Rimini Centre for Economic Analysis in Canada (RCEACanada). Scientific work contributed by the RCEA Scholars is published in the RCEA Working Papers and Professional Report series. The views expressed in this paper are those of the authors. No responsibility for them should be attributed to the Rimini Centre for Economic Analysis. The Rimini Centre for Economic Analysis Legal address: Via Angherà, 22 – Head office: Via Patara, 3 - 47900 Rimini (RN) – Italy www.rcfea.org -
[email protected]
Economic Growth and Crime: Does Uncertainty Matter?
Eleftherios Goulas* and Athina Zervoyianni** Department of Economics University of Patras University-Campus Rio, 26504 Patras, Greece April 2012
Abstract This paper contributes to the crime literature by exploring how the crime-uncertainty interaction impacts on economic growth. Using a panel of 25 countries over the period 1991-2007, we find evidence suggesting that increased crime has an asymmetric effect on growth depending on the future prospects of the economy as reflected in the degree of macroeconomic uncertainty. In particular, our results indicate that higher-than-average macroeconomic uncertainty enhances the adverse impact of crime on growth implying that a 10% increase in the crime rate can reduce annual per-capita GDP-growth by between 0.49 and 0.62 percent.
Key words: growth, crime, uncertainty JEL classification: O40, K14, D80
*
Adjunct Lecturer, Email:
[email protected] Associate Professor (corresponding author), Tel.: +30 2610996271 , Email:
[email protected]
**
1
I. Introduction The importance of crime in determining a country’s economic progress has long been recognized both in the academic literature and in policy-making circles. Numerous studies have explored the mechanisms through which crime, either directly or indirectly, imposes costs on society (see e.g. Kirton et al. (2003); World Bank (2006, 2007); Czabanski (2008); European Commission (2010)). Nevertheless, despite the growing literature, empirical studies have not yet produced a definite conclusion regarding the impact of crime on economic growth. Existing findings are often contradictory, with some estimates suggesting a strong adverse influence of crime on growth while other studies report evidence indicating no effect at all. For example, Peri (2004) finds crime to have a statistically significant impact in reducing both per capita income growth and employment growth using panel data at provincial level from Italy for 1951-1999. His results, however, indicate the possibility of non-linearities in the crime-growth relationship. Burnham et al. (2004) explore the impact of central-city crime on US county-level per-capita income growth and report results suggesting no clear crime-growth relationship. In particular, while they find a statistically significant adverse violent-crime effect on growth, the impact of property crime is weak and in some specifications perverse. On the other hand, a World Bank study (World Bank, 2006), based on data from 43 countries for 1975-2000, reports results suggesting a strong negative effect of crime on growth even after controlling for human-capital accumulation and income inequality, that is, variables which are likely to be causally linked to crime. Càrdenas (2007) also finds a significantly negative association between crime and per-capita output growth in a panel of 65 countries using homicides data for 1971-1999 and a country-fixed effects specification. Mauro & Carmeci (2007) find that crime impacts negatively on income levels but exerts no significant long-run adverse influence on growth rates employing the pooled-mean-group estimator (Pesaran et al. (1999)) and homicides data from 19 Italian regions during the period 1963-1995. Dettoto & Pulina (2009) explore the cointegration status between six types of crime and employment growth using Italian national-level data between 1970 and 2004. Their results indicate that property crime, but not homicides, causes lower long-run employment growth. In a more recent study, Dettoto & Otranto (2010) apply an autoregressive model, in which real GDP growth is explained by past GDP and a crime proxy, to monthly data for Italy during the period 1979-2002 and find only a relatively small annualized real-GDP growth reduction due to crime. Chatterjee & Ray (2009), based on a large cross-country data set for the period 1991-2005 and controlling for human capital and institutional quality, also find no strong evidence of a uniformly negative association between crime and growth and this applies both to total crime and to sub-categories of crime. These results suggest that, despite the growing empirical literature, the effects of crime on economic growth still are not well understood and that the growth-crime relationship is likely to be more complex than often assumed in existing studies. For example, none of the existing empirical studies explores the impact on growth of the interaction between increasing crime and
2
macroeconomic uncertainty. If crime is defined broadly as non-compliance with the government’s laws, and thus consists of all illegal activities, including tax evasion, bribery and public corruption, its interaction with uncertainty could increase growth in countries with inefficient and/or bureaucratic institutions by making it possible for individuals wishing to engage in mutually beneficial exchanges to avoid restrictions and/or delays and to circumvent an institutional environment hostile to business (see e.g. Colombatto (2003); Svensson (2005); Mendez & Sepulveda (2006)). However, if crime is considered narrowly, as involving criminal behavior, then increased crime is likely to undermine confidence in the rule of law and reduce the perceived security of property rights. This, if combined with higher-than-average uncertainty regarding the future prospects of the economy and poor business climate, can deter new investment, and thereby cause a fall in growth. This paper seeks to add to the existing crime literature by exploring to what extent the degree of macroeconomic uncertainty influences the way that changes in crime impact on growth. For this purpose, we examine how the interaction between accelerations of crime and macroeconomic uncertainty affect per-capita income growth, after controlling for other explanatory variables typically included in growth regressions. We use annual data from 25 countries for the period 19912007 and two alternative measures of uncertainty, based on the conditional variance of industrial production and the unconditional variance of a survey-based consumer sentiment indicator. We find that the effect on growth of increased crime is asymmetric: as uncertainty regarding the future prospects of the economy increases, increasing levels of crime become more harmful to growth. In particular, we find that accelerations of crime exert a strong adverse influence on growth when interacted with high levels of macroeconomic uncertainty but have no statistically significant impact on growth when interacted with low macroeconomic uncertainty. This indicates that crime mainly contributes to reducing economic growth in bad times, that is, when worsening economic conditions, and thus higher-than-average uncertainty regarding the future state of the economy and poor business climate, make the return on private investment less secure. By contrast, in good times, when the perceived degree of macroeconomic uncertainty is low, crime accelerations exert no independent adverse influence on growth. This result has important policy implications. It suggests that viewing crime as an important impediment to growth can be misleading if information regarding the future prospects of the economy is not explicitly taken into account. The structure of the remainder of the paper is as follows. In Section II we discuss the data, describe the construction of the uncertainty measures and present the empirical specification. The estimation results follow in Section III. Section IV contains concluding comments.
3
II. Construction and Definition of Variables We employ a dataset of 25 countries1 during the period 1991-2007. Data from the World Bank (World Development Indicators) are used to construct the following variables: Real Output Growth, d ln ( GDP ) j ,t , measured by the annual percentage change of GDP per capita (US$ constant (2005, PPP) prices); Investment, ( INV ) j ,t , defined as gross capital formation over GDP; Human Capital,
( HUM ) j ,t , measured by the ratio of gross tertiary enrolment to the population of the corresponding age group; Technology, (TEC ) j ,t , proxied by the ratio of high-technology exports to manufactured exports; and Globalization , ( GLO ) j ,t , captured by the KOF index of economic globalization2 (Dreher (2006)). Table 1 reports the statistical properties of the sample. [Table 1, about here] 3
Data on crime offenses come from the European Sourcebook of Crime and Criminal Justice Statistics (ESCCJ Statistics, European Commission). Total crime is computed as the sum of data on robberies, thefts, burglaries, rapes, assaults and completed intentional homicides, with the crime rate,
( CRI ) j ,t , defined as: ( CRI ) j ,t =
( offenses ) j ,t ( pop ) j ,t
100,000
(1)
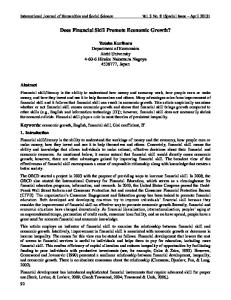
where ( offenses ) j ,t represents the reported number of crime offenses and ( pop ) j ,t is total mid-year population4 in country j and year t . Graph 1 shows country averages for total crime rates for 19912007. Graph 2 shows crime rates over the 1990s versus crime rates over the 2000s. The graph indicates that crime is persistent over time, with only little variation in the ranking of countries in terms of crime intensity between the two periods. Further, Graph 3 shows the distribution of the total-crime data for the set of countries in our sample and time period considered. The graph suggests that whatever crime-growth relationship will be obtained, it will not be the result of a few outlying crime observations. [Graphs 1, 2, 3 about here] The empirical specification corresponds to the following model:
1
Austria (AUT), Bulgaria (BGR), Cyprus (CYP), Czech Republic (CZE), Denmark (DNK), Estonia (EST), Finland (FIN), France (FRA), Germany (DEU), Greece (GRC), Hungary (HUN), Ireland (IRL), Italy (ITA), Japan (JPN), Lithuania (LTU), Netherlands (NLD), Poland (POL), Portugal (PRT), Romania (ROM), Slovakia (SVK), Slovenia (SVN), Spain (ESP), Sweden (SWE), United Kingdom (GBR), United States (USA). 2 KOF index (actual flows), higher values indicate greater economic globalization. 3 For Japan and the USA, we collect data from the United Nations Surveys on Crime Trends and the Operations of Criminal Justice Systems. 4 Data were collected from the U.S. Bureau of the Census (International Database).
4
d ln ( GDP ) j ,t = δ 0 + δ1 ln ( GDP ) j ,t −1 +δ 2 ( INV ) j ,t +δ 3 ( HUM ) j ,t +δ 4 (TEC ) j ,t + + δ 5 ( GLO ) j ,t + δ 6 d ln ( CRI ) j ,t +
(2)
2007
∑ τ ( year ) + ε
t =1991
t
j ,t
The δ i ' s, τ i ' s are unknown constant parameters to be estimated and ε is an unobserved spherical disturbance term. We further include time dummies to control for common shocks across countries that may have taken place during the period under consideration. The lagged value of GDP per capita, ln ( GDP ) j ,t −1 , will enter the regression with a negative coefficient δ1 if conditional convergence applies. Following much of the empirical growth literature, investment, ( INV ) j ,t , human
capital, ( HUM ) j ,t ,
the
level
of
technology, (TEC ) j ,t ,
and
the
degree
of
globalization, ( GLO ) j ,t , are added as explanatory variables in (2), where the corresponding coefficients δ 2 , δ 3 , δ 4 and δ 5 are expected to be positive. Finally, d ln ( CRI ) j ,t is the percentage change in the crime rate. If accelerations of crime cause lower growth then δ 6 < 0 .
Uncertainty Metrics In order to capture uncertainty, we use the annual percentage changes in the industrial production index (seasonally-adjusted) obtained from the OECD database5. We compute the conditional standard deviation by estimating a Pooled Panel-GARCH model (Cermeño & Grier (2006)). In contrast to the standard GARCH models, Pooled Panel-GARCH estimation reduces the number of parameters dramatically and does not imply constant cross-sectional correlation over time. Table 2 reports the estimation results. [Table 2, about here] The fitted values from the volatility equation are recovered and used as proxies for uncertainty. Recall that this measure of volatility possesses the desirable properties of being conditional, as well as being cross-sectionally and time-varying. To check the robustness of the results we also consider unconditional uncertainty arising from the annual standard deviation of the seasonally-adjusted Consumer Sentiment Indicator6 (CSI). The data cover the period from January 1991 to December 2007 and were obtained from Eurostat (Business and Consumer Surveys, Economic and Financial Affairs of the EU). This measure of uncertainty is inherently forward-looking as well as a direct measure of perceived uncertainty. We classify a country j as facing a higher-than-average degree of uncertainty when its annual (un)conditional standard deviation, (σ ) j ,t , of the corresponding variable is above the median value,
5
For Bulgaria, Cyprus, Lithuania and Romania industrial-production data are from Eurostat. Due to unavailability of data for Japan and the USA, we resort to the (seasonally-adjusted) Consumer Confidence Indicator (CCI) obtained from the monthly indicators of the OECD database. 6
5
σ med , obtained from the distribution of all countries. Hence, the high uncertainty dummy is defined as: med 1, if (σ ) j ,t > σ HUNC j ,t = 0, otherwise
(3a)
and the low uncertainty dummy is defined as:
1, if (σ ) j ,t < σ med LUNC j ,t = 0, otherwise
(3b)
Transforming equation (2) accordingly to include the crime-uncertainty interaction yields: d ln ( GDP ) j ,t = δ 0 + δ1 ln ( GDP ) j ,t −1 +δ 2 ( INV ) j ,t +δ 3 ( HUM ) j ,t +δ 4 (TEC ) j ,t + δ 5 ( GLO ) j ,t +
+ δ 6 ( HUNC ) j ,t ∗ d ln ( CRI ) j ,t + δ 7 ( LUNC ) j ,t ∗ d ln ( CRI ) j ,t +
(4)
2007
∑ τ ( year ) + ε
t =1991
t
j ,t
Rejecting the joint hypothesis of H 0 : δ 6 = δ 7 = 0 in favor of the alternative that at least one parameter is significant would indicate that the growth-crime elasticity is a function of macroeconomic uncertainty. At the same time, δ 6 > δ 7 would provide evidence of an asymmetric response of growth to crime depending on the degree of uncertainty (i.e. the negative effect of crime on output growth increases monotonically with the degree of macroeconomic uncertainty).
III. Estimation Results Equations (2) and (4) are estimated by applying the system-GMM technique (Arellano & Bover (1995); Blundell & Bond (1998, 2000)), which is relevant for estimating growth models to address, among other things, two-way causality (see e.g. Bond et al. (2001); Hoeffler (2002); Christiansen et al. (2009)). Column (i) of Table 3 shows estimates of equation (2), while columns (ii)-(iii) report
estimates of equation (4). In all columns, the Sargan test indicates that the model is well specified. [Table 3, about here] The results show a statistically significant positive effect on growth of investment, technology and globalization in all regressions, something consistent with the results obtained by other studies (Barro (1991); Levine & Renelt (1992); Mankiw et al. (1992); Bassanini & Scarpetta (2001); Adam & Bevan (2005); Morgese-Borys et al. (2008); Romero-Avila & Strauch (2008)). Further, the coefficient on the human capital proxy is positive and highly significant in all columns of Table 3. Moreover, the estimate on lagged GDP per capita is always negative and significant, indicating conditional convergence for the set of countries in our sample and time period under consideration. At the same time, the results suggest that changes in crime have no uniformly strong negative effect on growth. Independently of the measure of uncertainty used, there is an asymmetric response of growth to changes in crime, with increased crime having a strong negative effect on growth when high uncertainty regarding the future state of the economic prevails and no significant effect in the
6
low-uncertainty case. In particular, the estimated coefficient of d ln ( CRI ) in column (i), while negative (with a value of -0.016), is only marginally significant at the 5% level suggesting a weak general effect of higher crime on growth. In columns (ii)-(iii), the estimate for δ6 is negative and significant at 1% but the estimate for δ7 is insignificant even at 10%, suggesting that the adverse effect of crime on growth works mainly through higher uncertainty and bad business climate. Indeed, columns (ii)-(iii) indicate that a 10 percent increase in crime can lead to an annual GDPgrowth reduction between 0.49 and 0.62 percent under highly uncertain macroeconomic conditions. Finally, we emphatically reject the null hypotheses that the coefficients in the interaction terms are both equal to zero (hypothesis 1) and of the same magnitude (hypothesis 2), confirming that i) the growth-crime elasticity is a function of uncertainty and ii) there is an asymmetric response of growth to increased crime depending on the degree of uncertainty.
IV. Concluding comments Although there is a growing body of literature on the link between crime and macroeconomic performance, there is no cross-country evidence on the impact on economic growth of the crimeuncertainty interaction. Yet, if the growth-uncertainty relationship is negative, as many empirical studies suggest7, and the uncertainty-crime relationship is positive, then the crime-uncertainty interaction should exert a strong negative impact on economic growth. Our results support this view. We find evidence that increasing crime has no independent negative effect on growth under favorable economic conditions and thus under circumstances of low macroeconomic uncertainty. Higher-than-average macroeconomic uncertainty, however, enhances the adverse impact of crime on growth, making the effect of the crime-uncertainty interaction highly significant and negative. Accordingly, crime appears to be particularly harmful to growth in bad times, that is, when worsening economic conditions make the return to investment less secure. This result has important policy implications. Since the global financial crisis of 2007-2009, the degree of uncertainty surrounding macroeconomic performance in many countries has increased. At the same time, the opportunity cost of engaging in certain types of crime activity, including property crime and drug trafficking, has fallen for a number of individuals who have experienced a reduction in income as a result of the global financial crisis of 2007-2009 and of the recent European debt crisis. So, increased total crime is a possibility. Accordingly, the combined effect of higher-thanaverage macroeconomic uncertainty and possibly higher-than-average crime may well be a further reduction in growth rates in the coming years.
7
See e.g. Ramey & Ramey (1995); Marin & Rogers (2000); Asteriou & Price (2005); Imbs (2007); Furceri (2010).
7
REFERENCES Adam, C. and Bevan D. (2005). Fiscal Deficits and Growth in Developing Countries. Journal of Public Economics, 89, 571-597. Arellano, M. and Bover, O. (1995). Another Look at the Instrumental Variable Estimation of ErrorComponent Models. Journal of Econometrics, 68, 29-45. Asteriou, D. and Price, S. (2005). Uncertainty, Investment and Economic Growth: Evidence from a Dynamic Panel. Review of Development Economics, 9, 277-288. Barro, R. (1991). Economic Growth in a Cross Section of Countries. Quarterly Journal of Economics, 106, 407-430. Bassanini, A. and Scarpetta, S. (2001). The Driving Forces of Economic Growth: Panel Data Evidence for the OECD Countries. OECD Economic Studies No. 33. Blundell, R. and Bond, S. (1998). Initial Conditions and Moment Restrictions in Dynamic Panel Data Models. Journal of Econometrics, 87, 115-43. Blundell, R. and Bond, S. (2000). GMM Estimation with Persistent Panel Data: An Application to Production Functions. Econometric Reviews, 19, 321- 340. Bond, S.R. Hoeffler, A. and Temple, J. (2001). GMM Estimation of Empirical Growth Models. CEPR Discussion Paper No. 3048, Centre for Economic Policy Research, London, UK. Burnham, R., Feinberg, R. and Husted, T.A. (2004). Central City Crime and Suburban Economic Growth. Applied Economics, 36, 917-922. Càrdenas, M. (2007). Economic Growth in Columbia: A Reversal of Fortune? Ensayos Sobre Poltíica Económica, 25, 220-259. Cermeño, R. and Grier, K.B. (2006). Conditional Heteroscedasticity and Cross-Sectional Dependence in Panel Data: An Empirical Study of Inflation Uncertainty in the G7 Countries. Ch. 10, in Baltagi, B.H. (Ed.): Panel Data Econometrics, North-Holland. Chatterjee, I. and Ray, R. (2009). Crime, Corruption and Institutions. Monash University Working Paper No. 20. Christiansen, L. Schindler, M. and Tressel, T. (2009). Growth and Structural Reforms: A New Assessment. IMF Working Paper No. 284. Colombatto, E. (2003). Why is Corruption Tolerated? Review of Austrian Economics, 16(4), 363379. Czabanski, J. (2008). Estimates of Costs of Crime: History, Methodologies and Implications. Berlin: Springer. Detotto, C. and Otranto, E. (2010). Does Crime Affect Economic Growth? Kyklos, 63, 330-345. Detotto, C. and Pulina, M. (2009). Does Crime Mean Fewer Jobs? An ARDL Model. CRENoS Working Paper No. 5. Dreher, A. (2006). Does Globalization Affect Growth? Evidence from a New Index of Globalization. Applied Economics, 38(10), 1091-1110. European Commission (2010). Review of Costs of Crime Literature, http:// www.costsofcrime.org/AnnotedBibliography. Furceri, D. (2010). Long-run Growth and Volatility: Which Source Really Matters? Applied Economics, 42, 1865-1879. Hoeffler, A. (2002). The Augmented Solow Model and the African Growth Debate. Oxford Bulletin of Economics and Statistics, 64(2), 135-158. Imbs, J. (2007). Growth and Volatility, Journal of Monetary Economics, 54, 1848-1862. Kirton, C., Francis, A. and Gibbison, G. (2003). Crime and Development: The Jamaican Experience, World Bank Report. Levine, R. and Renelt D. (1992). A Sensitivity Analysis of Cross-Country Growth Regressions. American Economic Review, 82, 942-963. Mankiw, G., Romer, D. and Weil, D. (1992). A Contribution to the Empirics of Economic Growth. Quarterly Journal of Economics, 107, 407-437. Martin, P. and Rogers, C.A. (2000). Long-term Growth and Short-term Economic Instability. European Economic Review, 44, 359-381. Mauro, L. and Carmeci, G. (2007). A Poverty Trap of Crime and Unemployment. Review of Development Economics, 110, 681-712.
8
Mendez, F. and Sepulveda, K. (2006). Corruption, Growth and Political Regimes: Cross-country Evidence. European Journal of Political Economy, 22, 82-98. Morgese-Borys, M., Polgàr, K. and Zlate, A. (2008). Real Convergence and Determinants of Growth in the EURO Candidate and Potential Candidate Countries: A Panel Data Approach. ECB Occasional Paper No. 86. Peri, G. (2004). Socio-Cultural Variables and Economic Success: Evidence from Italian Provinces 1951-1991. The B.E. Journal of Macroeconomics, 4, 1-34. Pesaran, M.H., Shin, Y. and Smith, R.P. (1999). Pooled Mean Group Estimation of Dynamic Heterogeneous Panels. Journal of the American Statistical Association, 94, 621 - 634. Ramey, G. and Ramey, V.A. (1995). Cross-Country Evidence on the Link between Volatility and Growth. American Economic Review, 85, 1138-1151. Romero-Avila, D. and Strauch, R. (2008). Public Finances and Long-term Growth in Europe: Evidence from a Panel Data Analysis. European Journal of Political Economy, 24, 172-191. Svensson, J. (2005). Eight Questions about Corruption. Journal of Economic Perspectives, 19, 1942. World Bank (2006). Crime, Violence and Economic Development in Brazil: Elements for Effective Public Policy, Report No. 36525. World Bank (2007). Crime, Violence and Development: Trends, Costs and Policy Options in the Caribbean, Report No. 37820.
9
TABLES
Table 1. Descriptive statistics Variable
Obs.
Mean
Std. Dev.
Min
Max
d ln ( GDP ) j ,t
228
0.031
0.023
-0.023
0.113
228
0.219
0.039
0.149
0.369
228
0.534
0.168
0.157
0.949
228
0.178
0.111
0.019
0.475
228
0.711
0.160
0.312
0.980
( INV ) j ,t ( HUM ) j ,t (TEC ) j ,t ( GLO ) j ,t
Notes: The sample consists of 25 countries over the period 1991-2007.
Table 2. Pooled-Panel ARCH model for production indexa Estimates (z-scores) 0.017*** (5.59) 0.539*** (12.06)
Regressorb constant
( P ) j ,t -1 Conditional Variance Equation
0.001*** (7.06) 0.344*** ARCH (1) (2.92) Log-likelihood 413.113 Observations 222 Notes: (a) Annual percentage change in the industrial production index. (b) The term ( P ) j ,t -1 represents the first-order constant
lag of the dependent variable. Numbers in parentheses denote z-scores. One, two, three asterisks denote significance at the 10, 5, and 1 percent level respectively.
10
Table 3. System-GMM estimates of the growth model Dependent Variable Model 1 d ln ( GDP ) j ,t Regressor ln ( GDP ) j ,t -1
( INV ) j ,t ( HUM ) j ,t (TEC ) j ,t ( GLO ) j ,t d ln ( CRI ) j ,t
-0.042*** (-7.34) 0.226*** (6.25) 0.053*** (5.65) 0.072*** (2.69) 0.030*** (3.12) -0.016** (-2.28) -
( LUNC ) j ,t ∗ d ln ( CRI ) j ,t
-
m1 m2
Sargan Test (Hypothesis 1) (Hypothesis 2)
H0 : δ6 = δ7 = 0 H0 : δ6 = δ7
Model 3b
Estimates (z-scores) -0.041*** (-5.66) 0.268*** (5.55) 0.059*** (5.50) 0.088*** (3.27) 0.024** (2.32)
-0.042*** (-6.59) 0.226*** (6.37) 0.053*** (5.34) 0.074** (2.56) 0.029*** (2.75)
-
***
( HUNC ) j ,t ∗ d ln ( CRI ) j ,t Observations
Model 2a
206 -2.30** 0.96 108.65 (p-val. 0.54) -
-0.062 (-4.08) -0.0005 (-0.11) 198 -2.20** 1.48 85.47 (p-val. 0.95) x 2 = 16.64*** x 2 = 15.40***
-0.049*** (-5.25) -0.007 (-1.64) 206 -2.52** 1.64 94.01 (p-val. 0.84) x 2 = 28.97*** x 2 = 17.05***
Notes: Numbers in parentheses denote z-scores, m1 and m 2 are residual first and second order serial correlation tests, while Sargan stands for the over-identifying restrictions test. One, two, three asterisks denote significance at the 10, 5, and 1 percent level respectively. All models allow for robust standard errors. Time dummies are included in all specifications. Source of uncertainty: (a) Industrial Production Index. (b) Consumer Sentiment Indicator.
11
GRAPHS
10,000
Graph 1. Mean crime rates by country 9413
8658
6,000
5978
5061
5048
4729
4,000
Mean crime rate
8,000
8295 8094
3997 3722
3712
3007
2993
2887 2922 2640
2845
2632
2,000
2330
1611 1424
1400 1003 791
0
387
AUT BGR CYP
CZE DNK EST
FIN
FRA DEU GRC HUN
IRL
ITA
JPN
LTU
NLD
POL PRT ROM SVK SVN
ESP SWE GBR USA
Notes: Total crime rate is defined as the sum of thefts, burglaries, robberies, assaults, rapes and completed intentional homicides per 100,000 persons. Figures denote averages by country for the period 1991-2007.
10000
Graph 2. Scatter plot of crime rates
SWE NLD
6000
FIN
4000
FRA USA
EST
AUT
HUN
2000
IRL PRT ESP SVN SVK JPN GRC
0
1991-1999
8000
GBR DNK
0
2000
4000
6000
8000
2000-2007
12
.00015 .0001 .00005
Density
.0002
Graph 3. Distribution of crime rates
0
2000
4000
6000
8000
10000
Crime rate
1991-1999
2000-2007
13