VIOLENT CRIME: DOES SOCIAL CAPITAL MATTER?
Daniel Lederman, Norman Loayza, and Ana María Menéndez∗
First draft: July 1999 This draft: July 2000 Abstract This paper examines empirically the effect of some commonly used indicators of social capital, such as the prevalence of trust on community members and the participation in voluntary secular and religious organizations, on the incidence of violent crimes. This is a cross-country study whose basic sample consists of 39 developed and developing countries and whose dependent variable is the national intentional homicide rate. The paper identifies and deals with three challenges in the empirical estimation of the effect of social capital on the incidence of violent crimes. The omittedvariable problem is dealt with by including income inequality and economic growth as additional determinants of a country’s violent crime rate. The joint endogeneity (or reverse-causation) problem is accounted for by using instrumental variables for social capital in the crime regression. The specificity problem, that is the potentially opposite effects of group-specific and society-wide social capital, is noted and addressed only indirectly by emphasizing the results applied to the social capital indicators that have application for society as a whole. The main result of the paper is that only the component of social capital measured by trust on community members has the effect of reducing the incidence of violent crimes. The results regarding measures of other indicators of social capital are rather unclear. This may be due to a combination of limited samples, inability to fully control for reverse causation, and most likely, the opposite effects that society-wide and group-specific social capital may have on violent crime.
∗
Lederman and Menéndez are economists with the Office of the Chief Economist for Latin America and the Caribbean of the World Bank. Loayza is a senior economist with the research department of the Central Bank of Chile, and he is currently on leave from the Development Economics Research Group of the World Bank. The opinions expressed herein should not be attributed to the World Bank. The authors are grateful to Ed Glaeser, Jeff Grogger, Gale Johnson, Sanjay Marwah, Steve Messner, Nicholas Sambanis, and an anonymous referee for invaluable comments and suggestions. The authors are responsible for any remaining errors.
I. INTRODUCTION Since the 1960’s the economics literature on crime has grown rapidly both on theoretical and empirical grounds.1 However, it has mostly expanded following the direction outlined in Becker’s (1968) original paradigm, by which crime is the result of an individual’s decision based on a costbenefit analysis. The theoretical and empirical work has, thus, concentrated on the comparison of legal and criminal returns and the role of deterrence by the police and justice systems. The effect of social interactions on criminal behavior has only recently been the focus of some economics studies, most of them theoretical (see Glaeser, Sacerdote, and Scheinkman 1996; and Rosenfeld, Messner and Baumer 1999). DiIulio (1996) argues that one of the areas that have so far received little attention from economists is the potential link between "social capital" and violent crime. Attempting to fill this gap, we explore empirically the effect of different indicators of social capital, such as the prevalence of trust on members of the community and the membership and participation in voluntary secular and religious organizations, on the incidence of violent crimes across countries.
Social capital and crime Social capital is broadly defined as the set of rules, norms, obligations, reciprocity, and trust embedded in social relations, social structures, and society’s institutional arrangements which enables its members to achieve their individual and community objectives (Coleman 1990 and Narayan 1997). Thus, social capital is not a homogeneous concept but comprises various social elements that promote individual and collective action. It follows from this definitional complexity that measuring social capital is problematic. Nevertheless, researchers have used --with varying degrees of success-indicators of social capital based on people’s participation in social organizations, attitudes of civic
1
See Glaeser (1999) and Fajnzylber, Lederman, and Loayza (1998) for brief reviews of the literature.
2
cooperation, and the sense of trust among community members. No single indicator can embrace the whole spectrum of social capital, but they can jointly approach its complex concept. There are two basic arguments in favor of a crime-reducing effect of social capital (see Brehm and Rahn 1997, Sampson 1997, and LaFree 1999). The first is that social capital decreases the costs of social transactions, which would then allow for peaceful resolution of conflicts. The second argument is that communities with stronger ties among its members are better equipped to organize themselves to overcome the free-rider problem of collective action. However, there are also reasons to think that social capital may lead to more violent crime (see Glaeser, Sacerdote, and Scheinkman 1996; and Rubio 1997). In certain contexts, stronger social interactions allow individuals involved in criminal activities to more easily exchange information and know-how that diminish the costs of crime. Furthermore, these social interactions may facilitate the influence of criminals on other community members to develop a propensity for crime and violence.
The
seemingly opposite effects of social capital on crime may create some confusion. One way to reconcile these two antagonistic effects is to consider that social capital has the potential for inducing more crime and violence when it is specific to particular groups (such as gangs, ethnic clans, and closed neighborhoods) rather than disseminated throughout society. We develop this idea further in the next section of the paper. The relationship between social capital and crime is even more complex given that the causality between the two may run in both directions -- crime can also affect social capital (Rosenfeld, Messner, and Baumer 1999). The incidence of violent crime may diminish social capital by reducing the sense of trust among community members or may increase it through the formation of community organizations to fight crime. In summary, the relationship between social capital and violence and crime is multifaceted and, therefore, worthy of study.
3
The empirical approach In this paper, we conduct a cross-country study whose main purpose is to estimate the effect of different indicators of social capital, such as trust, religiosity, and participation in voluntary community organizations, on the incidence of violent crimes. The indicators of social capital were obtained from comparable household surveys conducted in countries representing most regions of the globe. Our unit of analysis is the country, and our sample consists of 39 developed and developing countries over the period 1980-94. The dependent variable of the empirical model, that is the variable whose cross-country variance we attempt to explain, is the incidence of violent crime. The incidence of violent crime in a country is represented by its rate of intentional homicides. This is an imperfect proxy, but suffers the least from the underreporting that afflicts official crime data and is the most comparable across countries. There are three main challenges in isolating the effect of social capital indicators on violent crime. The first is that there are other variables that also affect the incidence of crime, and ignoring them may bias the estimated effect of social capital. This will happen if the social-capital indicators are correlated with the omitted variables. According to cross-country studies, income inequality, per capita GDP growth, and the quality of police and justice systems are important determinants of the incidence of violent crime (see Fajnzylber, Lederman, and Loayza 1998). It is very likely that these variables are also linked to the participation in voluntary social organizations and the prevalence of trust on community members, two important indicators of social capital (see Knack and Keefer 1997). We deal with the omitted-variable problem by also considering the crime-related effects of income inequality and per capita GDP growth. As illustrated by the large endogenous-growth literature, per capita GDP growth can serve not only as an indicator of economic opportunities in
4
the legal sector but also as a proxy for the quality of government institutions, including the police and justice systems. The second challenge is that the incidence of crime and violence may in turn affect social capital, as mentioned above. Furthermore, the overall effect of crime and violence on some indicators of social capital may be ambiguous. For example, participation in voluntary communal organizations may rise as result of higher crime, precisely as a reaction to organize the community to fight crime. On the other hand, voluntary participation may be reduced if violent crime leads to fears of leaving the house or the neighborhood. Thus, to be able to conclude that social capital leads to more or less violent crime, we need to isolate the components of social-capital measures that are exogenous to violent crime rates. We deal with the joint endogeneity problem through the use of instrumental variables, which affect crime and violence solely through social capital (more precisely, we employ the generalized method of moments). As instruments for social capital we use, first, regional dummy variables indicating groups of countries according to geographic location or stage of development (with the idea that countries in a region share certain cultural traits that in turn affect their social capital), and, second, the numbers of telephones per capita and radios per capita in the country (which, as argued by Collier 1998, diminish the costs of social interactions). The third challenge is that social capital may have different effects on violent crime within and outside certain communities and social groups. For example, the trust and cohesion within a group of criminals (as in organized crime or neighborhood gangs) may lower crime inside the group but increase it for the city or country as a whole. In order to differentiate the effects of social capital for either particular groups or society as a whole, we would need information on disaggregated crime rates for various groups and measures that distinguish group-related social capital from
5
society-wide social capital.2 To our knowledge, this type of detailed information is not available for a cross-section of countries. Therefore, in this paper we cannot do more than acknowledge the problem of social capital specificity and highlight the results related to the social-capital indicators that by construction are more likely to represent society-wide social capital.
Main Results Our main conclusion is that, controlling for omitted variables and joint endogeneity, the prevalence of trust on community members seems to have a significant and robust effect of reducing the incidence of violent crimes. The effect of other social capital indicators on violent crime is not clear. In the case of the religion-related variables, namely, religiosity (the self-proclaimed importance of religion in the individual’s daily life) and church attendance, the differing results obtained with various samples indicate that their effect on violent crime may be specific to either particular countries or particular types of religion.
In the case of social capital variables that reflect
involvement in social organizations, namely the rates of membership and participation in voluntary social organizations, their unclear effect on violent crime may be due to a combination of two factors. The first is our inability to fully isolate their exogenous component and, thus, estimate correctly its effect on violent crime. The second, and possibly most important, factor behind their ambiguous effect on violent crime rates is that the rates of membership and participation in voluntary social organizations reflect both group-specific and society-wide social capital. As argued above, while the latter type of social capital would reduce violent crime, the former may increase it. Confirming previous studies, we find that even after controlling for social capital, income inequality (measured by the Gini coefficient) and per capita GDP growth rate are robust determinants of the incidence of violent crime rates.
Nisbett and Cohen (1996) show that community stability, which might be related to stronger ties among neighbors and thus higher social capital, is negatively correlated to homicide rates in the North of the U.S. but is positively correlated in states of the South and West. 2
6
The rest of the paper is organized as follows. Section II explores the concept of social capital (by considering its various definitions and indicators presented in the literature) and analyzes its relationship with crime and violence. Section III describes the data to be used in the empirical section. Section IV presents the results. The final section discusses the results and conclusions. II. BASIC DEFINITIONS AND INDICATORS OF SOCIAL CAPITAL
Definitions and indicators The purpose of this sub-section is to motivate the indicators of social capital used in the empirical section of the paper by exploring the concept of social capital. Numerous definitions of “social capital” can be found in the work of contemporary social scientists. However, most of them draw from the work of James Coleman (1990), who defines social capital as the relations among persons that enable them to cooperate in the pursuit of mutual objectives.
Starting from this broad
definition, some authors have emphasized the role of informal micro-institutional features of communities. For instance, in his work on democracy in Italy, Robert Putnam (1993, 167) defined social capital as those “features of social organization, such as trust, norms and networks that can improve the efficiency of society by facilitating coordinated actions.” Most authors, however, have used broader definitions that include not only these micro-institutional features but also the rules and regulations of the marketplace, political institutions, and civil society. Inspired in the work of Coleman (1990), Narayan writes that “Social Capital is the rules, norms, obligations, reciprocity, and trust embedded in social relations, social structures, and society’s institutional arrangements which enables its members to achieve their individual and community objectives” (1997, 50). Some social scientists have emphasized the links between social capital and other types of capital in order to make its meaning more concrete. In some cases, however, this attempt may have led to the confusion between the effects and the substance of social capital (an example of this confusion would be the question, does social capital “become” physical capital when it helps build a
7
school?) Two careful attempts to link social capital with other capital forms are provided by Fukuyama (1995) and Collier (1998). Fukuyama rephrased Coleman’s definition of social capital as a component of human capital: “A key cultural characteristic, …[that] the sociologist James Coleman has labeled social capital – that is, the component of human capital that allows members of a given society to trust one another and cooperate in the formation of new groups and associations” (1995, 90). Collier (1998) provides a definition that highlights not only the “social” part of the concept but also the “capital” component. Collier states that the “social” component requires that measures of social capital should be born out of social interactions that produce economic or social effects that are incidental to the purpose of the association. In other words, in order for social capital to have important economic and social effects, it must be capable of producing externalities. Collier suggests three types of externalities that can be affected by social capital: those that increase the stock of knowledge, those that reduce the scope for individual opportunistic behavior, and, related to the latter, those that ameliorate the free-rider problem of collective action. The “capital” element requires that measures of social capital must have some longevity that is independent of the social interactions that produced it. Thus social capital must be either embodied in physical capital, as in the case of a school constructed by the community, or it can be stored in human capital, as is the case of trust among members of a social group that persists even after the group disappears. Social capital is not a homogeneous “substance” but a multifaceted one. Therefore, all simplistic attempts to measure it are bound to fail. To approach an appropriate measure, empirical researchers should use an array of indicators that reflects the complexity of social capital. Coleman (1990) initiated this approach when he identified several forms of social capital and illustrated how they made possible communal action. More recently, political scientists and sociologists (Brehm and Rahn 1997; Jackman and Miller 1998; and Rosenfeld, Messner, and Baumer 1999) have focused on two core elements of social capital: trust among community members and participation in social
8
organizations. These elements correspond to what Rosenfeld, Messner and Baumer (1999, 2) call “social trust and civic engagement,” respectively. Following this approach, we adopt the view that, since the concept of social capital covers both behavioral traits and attitudes, indicators of social capital should reflect this broad spectrum.3 As their name implies, these indicators are proxies for various aspects of social capital. As such, they are approximate quantifications of this concept and are not meant to represent social capital itself. Although this limitation applies to most empirical work on social issues, it is particularly important to recognize it in the case of social capital given the novelty of the concept and its complex links with notions of cultural capital and institutional arrangements. In practice, these indicators are constructed from information obtained through household and individual surveys. Thus, cross-country studies rely on surveys that ask similar questions to residents of various countries. The behavioral pattern that best represents social capital is the voluntary involvement in communal organizations, from membership to active participation in voluntary secular or religious organizations. The attitudes that most closely reflect social capital are the prevalence of trust on other community members, the importance of religion in the individual’s daily life (religiosity), and the propensity for civic cooperation.4
Other variables are often used as proxies of social capital. There are some researchers that use crime data and other economic and social outcome variables as proxies of social capital. For example, Robinson and Siles (1997) include variables like education, crime, labor force participation, and poverty as proxies. Their view is that social capital is better measured by several outcome variables. The main drawback of this approach is that they assume a particular direction of causality. If we were sure that social capital reduces crime, then we would not need to investigate this issue in the first place. 4 Because of lack of comparable cross-country data, we do not use an indicator of civic cooperation in our empirical analysis. We recognize, however, that using it would have enriched our investigation. An interesting application dealing with civic cooperation is provided by Knack and Keefer (1997). They use a composite measure of civic cooperation based on people’s self-admitted propensity towards claiming benefits to which they are not entitled, avoiding fare in public transport, cheating on taxes if given the chance, pocketing found money, and failing to report damage accidentally done to a parked vehicle. 3
9
Social capital and violent crime There are two basic arguments for social capital to reduce violent crimes. Both are based on the existence of sympathetic relationships among community members. The first argument is that social capital decreases the costs of social transactions. This allows for peaceful resolution of conflicts, both interpersonal (in the home, neighborhood, and workplace) and societal (such as a perceived unfair distribution of economic opportunities).
This argument is in the spirit of
Fukuyama’s assertion that “trust can dramatically reduce what economists call transaction costs – costs of negotiations, enforcement and the like -- and makes possible certain efficient forms of economic organization” (1995, 90), or in the words of Robinson and Siles “…transaction costs are reduced by increases in social capital because each party to the trade has his well-being linked to the well-being of his or her trading partner” (1997, 5). The second argument in favor of a crimereducing impact of social capital is that communities with stronger ties among its members are better equipped to organize themselves to overcome the free-rider problems of collective action. This decreases the potential for individual opportunistic behavior, thus lessening the potential for social contention and conflict. Glaeser and Sacerdote (1999) point out that opportunistic behavior is one of the problems of big cities, where individuals are less likely to be long-term residents and urban anonymity protects criminals from the social stigma. Rosenfeld, Messner, and Baumer (1999) present an alternative, theory-based argumentation for the crime-reducing impact of social capital. They outline how strands of social disorganization theory, anomie theory, and deprivation/strain theory can explain a negative link between social capital and crime and violence. Naturally, the mechanisms through which this link is produced vary from theory to theory. According to social disorganization theory, weak social controls harm the ability of groups to organize and protect themselves, induces widespread mistrust and suspicion and, thus, creates a situation propitious for predatory crime (see Bursik and Grasmick 1993). Moving the
10
emphasis to personal behavior, anomie theory predicts that in environments where people lack a strong moral order, behave egotistically and are willing to exploit others (“anomic” environments), social trust will decline at the same time as crime and violence intensify (see Rosenfeld and Messner 1998). Finally, according to deprivation/strain theory, the lack of social capital should be regarded as any other form of resource scarcity (such as unemployment or lack of education) that would prevent society members from achieving their common goals. Some of the most important of them would be peaceful conflict resolution and control of predatory behavior (see Land, McCall, and Cohen 1990). Conversely, there are also reasons to think that social capital may lead to more violent crime. In certain contexts, stronger social interactions allow individuals involved in criminal activities to more easily exchange information and know-how that diminish the costs of crime. Furthermore, deep ties among community members may facilitate the influence of “successful” criminals, enacting them as role models and inducing stronger tastes and propensity for crime and violence in the community.
According to Glaeser, Sacerdote and Scheinkman (1996), these perverse social
interactions may be the fundamental cause of the observed inertia of crime rates in cities in the United States.5
Rubio (1997) analyzes the role of drug cartels, guerrilla groups, and gangs in
generating a perverse social capital in Colombia. He argues that these groups corrupt whole communities by providing youths with role models and by training them in the use of arms and violence. The seemingly opposite effects of social capital on crime may lead to confusion. In this paper we propose a way to reconcile these apparently contradictory effects. We postulate that social capital has a beneficial, crime-reducing impact when the relationships that form social capital involve 5 Fajnzylber, Lederman, and Loayza (1998) find that shocks to the crime rate in a sample of developing and developed countries tend to be persistent. That is, the autocorrelation coefficient seems to be above 0.5 and
11
all society members. In this case, the whole society behaves as a single group in which social relationships foster individual and collective action to facilitate conflict resolution and prevent predatory behavior. Conversely, social capital has the potential for inducing more crime and violence when it is concentrated in particular groups, such as gangs, ethnic clans, and closed neighborhoods, and is not disseminated throughout society. Furthermore, the cohesion inside mutually belligerent groups may exacerbate the tensions between them, lower their ability to reach compromises, and, then, increase society’s overall violence. Along similar lines, Durlauf (1999) points out that social capital facilitates intra-group coordination by enhancing group identity which in turn may promote inter-group hostility. A related notion has been formalized through the concept of polarization. In a seminal paper, Esteban and Ray (1994) defined polarization as the degree of separation between large and internally homogeneous groups.6 To highlight the importance of this societal characteristic, Esteban and Ray (1994) argue that society’s level of polarization may be the cause of rebellions, civil wars, social tension, and, by extension, violent crime. In summary, we propose that while society-wide social capital reduces crime and violence, group-specific social capital may promote them. The relationship between social capital and crime is even more complex given that the causality between the two may run in both directions.7 The incidence of violent crime may diminish social capital, such as trust, or may increase it, through the formation of community organizations to fight crime. Moser and Holland (1997) and Moser and Shrader (1998) argue that violence in Latin America and the Caribbean countries has eroded social capital in diverse ways.
It prevents
is statistically significant, even after controlling for a number of possible determinants of homicide and robbery rates (including country-specific effects). 6 Polarization with respect to a certain characteristic, say income, is increasing in both the income difference between groups and the degree of “identification” within each group, where identification depends positively on the size of the group and negatively on its internal income dispersion.
12
communities from meeting locally, prevents individuals (especially women) from going to work and therefore extend their social network, increases school drop-out rates (especially from night school), and impairs the coverage of health services. These authors find that “[t]here are often higher levels of participation in community action groups in less violent areas, and lower in more violent areas” (Moser and Shrader 1998, 9). To help formalize the connection between crime and social capital, in Appendix B we develop a simple model of criminal behavior. The general principle is that a rational individual chooses to commit a crime if the expected net benefit derived from this activity is higher than her moral threshold. This model is extended to include the linkages of social capital and crime just reviewed. The individual increases its net benefit from the crime if there is low deterrence, which may be a feature of ‘disorganized societies’. The net benefit of crime also rises where the alternative source of income (which depends on physical, human and social capital) is not sufficient to achieve the individuals’ goals as predicted by ‘strain theories of crime’. Finally, sociological theories that predict more crime because of low widespread trust could be considered by lowering the moral threshold. The appendix underscores the different effect that society-wide and group-specific social capital can have on the probability that an individual will commit criminal acts. It shows that societywide social capital produces stronger disincentives for criminal behavior than group-specific social capital.
III. DATA
Indicators of social capital
See Rosenfeld, Messner, and Baumer (1999) for one of the few studies that recognize and deal with this feedback effect. They use structural equation modelling to examine the relationship between social capital and homicide in the U.S. 7
13
We use two types of variables that measure social capital. The first reflects attitudes and includes the prevalence of trust on the members of the community and the self-proclaimed importance of religion in the individual’s daily life (religiosity, for short). The second type reflects behavioral patterns and includes membership and participation rates in voluntary secular and religious organizations (including church attendance). Table 1 describes all these variables in detail. They come from the World Values Survey (WVS) and were complemented with data from Muller and Seligson (1994), who incorporated countries from Central America. The WVS reports data for two periods, 1982-84 and 1990-93. For the latter period, the WVS has data for 43 nations for at least one social capital indicator; however, for the former period, it provides observations for only 24 nations. In order to maximize our working sample, we average the available data over the two time intervals.8 We assume that these averages represent the respective social-capital variable over the period 198094 in each country. In order to complete our working data set, we then take averages for the dependent variable and other explanatory variables over the same period for each country. We express the social capital indicators in natural logarithms. Since these indicators are given in different units, it is necessary to express them in logs to be able both to compare their coefficients and to interpret them as the effect on crime rates of (approximately) a percentage change in each indicator. The WVS has some shortcomings. First, it tends to over-represent higher-status groups within countries. Second, it under-represents Africa and Asia, for which only 1 and 4 countries are available, respectively. For trust, the WVS and data from Muller and Seligson (1994) include 24 industrialized countries, 11 transition economies, and 10 Latin American countries. This bias is heightened for the other social capital variables for which there are fewer observations. When we
8
It is worth mentioning that the correlation of trust in the 1980’s and 1990’s is 0.91.
14
cross the sample on social capital indicators with that on violent crime rates, we are left with a maximum sample of 39 countries (none of them from Africa or Asia).9
The incidence of violent crimes Cross-country studies of crime have to face severe data problems. Most official crime data are not comparable across countries. Each country suffers from its own degree of underreporting, and each defines certain crimes in different ways. Underreporting is worse in countries where the police and justice systems are not reliable and where the level of education is low. Country-specific crime classifications, arising from different legal traditions and different cultural perceptions of crime, also impede cross-country comparisons. The type of crime that suffers the least from underreporting and idiosyncratic classification is homicide. It is also well documented that the incidence of homicide is highly correlated with the incidence of other violent crimes (see Donohue 1998, and Fajnzylber et al. 2000). For these reasons, we use the rate of homicides (per population) as the proxy for violent crimes.10 The homicide data are taken from the World Health Organization (WHO), which in turn gathers the data from national public health records. In the WHO data set, a homicide is defined as a death purposefully inflicted by another person, as determined by an accredited public health official. The homicide rate per country is the annual average over the period 1980-94. In order both to account for potential non-linearities in the relationship between violent crime and its determinants and to interpret the estimated coefficients as crime elasticities, we express the homicide rates in natural logarithms.
China was included in the group of transition economies while Japan and Korea in the group of industrialized countries. 10 We acknowledge that special attention should be given to intra-household and inter-personal violence and other crimes like rape or theft. However, to our knowledge, there is no international data set of such crimes that is reliable enough to undertake a serious cross-country empirical investigation. 9
15
Other explanatory variables Income inequality for each country is proxied by its Gini coefficient, which is taken from the Deininger and Squire (1996) database.
Per capita GDP growth is obtained from the World
Development Indicators of the World Bank. All variables are averaged over the period 1980-94 for each country.11 The complete data set used in this empirical study is presented in Appendix A.
IV. RESULTS
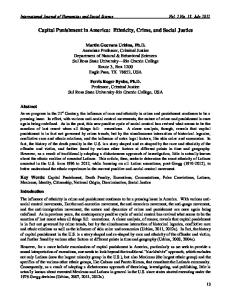
Univariate linear regressions Figure 1 illustrates the simple relationship between each indicator of social capital and homicide rates. The panels of the figure show fitted lines from simple linear regressions with their coefficients and respective t-statistics. At first glance we see that higher levels of trust, higher religiosity, and higher membership in voluntary secular organizations are associated with lower levels of homicide rates. In contrast, higher church attendance appears positively related to homicide rates. Membership and participation in voluntary social organizations appear unrelated to homicide rates. Of all indicators of social capital, however, only trust has a statistically significant association with homicide rates in these simple regressions.12 Yet, these results are only illustrative and should not be taken too seriously because they suffer from the problems of omitted variables and joint endogeneity of explanatory variables. These problems are addressed in the following sub-sections.
Multivariate regressions: Accounting for other determinants of violent crime In analyzing the effect of social capital on violent crime rates, we must acknowledge and control for other variables that also affect the incidence of crime. Ignoring them may bias the estimated effect of social capital if its measures are correlated with the omitted variables. According 11 We used the average annual growth of GDP per capita for the Czech Republic for the period 1984-94, and 1987-94 for Lithuania.
16
to cross-country studies, income inequality, GDP growth, and the quality of police and justice systems are important determinants of the incidence of violent crime (see Fajnzylber, Lederman, and Loayza 1998).13 It is very likely that these variables are also linked to indicators of social capital, such as the participation in voluntary social organizations and the prevalence of trust among community members (see Knack and Keefer 1997). We deal with the omitted-variable problem by also considering the crime-related effect of income inequality and per capita GDP growth. Notwithstanding their conceptual importance, we do not include deterrence variables, such as police per capita and conviction rates, because they suffer empirically from joint endogeneity with violent crime, mismeasurement, and very limited data availability.
Their effect is, however, captured
indirectly through per capita GDP growth. As demonstrated by the large endogenous-growth literature (e.g., Barro 1997), economic growth can serve not only as an indicator of legal economic opportunities but also as a proxy for the rule of law and the quality of public institutions, including the police and justice systems (see Burki and Perry 1998). In summary, in our multiple regression framework, the homicide rate (in logs) is determined by a linear function of income distribution (represented by the Gini coefficient), the growth rate of per capita GDP at constant local prices, and each separate measure of social capital (also in logs). Tables 2 and 3 show the results for the multivariate regressions on homicide rates, using an ordinary-least-squares (OLS) estimator. There is one regression (column) for each social capital measure. While in Table 2 the largest possible number of observations (countries) are used for each regression, in Table 3 a smaller common sample of countries is used in each regression.14 The
12 The negative and significant coefficient on trust is maintained when two outliers (Brasil and China) are excluded. 13According to Fajnzylber, et al. (1998), the average years of schooling, the degree of urbanization, income per capita, and drug related variables are other determinants of homicide rates. However, they are not as significant or robust as income inequality and GDP growth. 14 See the Appendix A for the list of countries included in the common sample.
17
purpose of Table 3 is to allow us to compare the coefficients of the various social capital indicators, holding constant the sample of countries Tables 2 and 3 render similar results. In every regression, the per capita GDP growth rate and the Gini coefficient are significant and have the expected signs. That is, more income inequality and lower growth are associated with higher homicide rates. On the other hand, most social capital variables are not significant. Only participation in voluntary social organizations is significant, although it has a positive sign indicating that higher rates of participation are associated with higher levels of crime. The coefficient on trust has the expected negative sign but is not statistically different from zero.
Instrumental variables: Correcting for joint endogeneity The coefficients reported in the previous sub-section cannot be interpreted as effects of social capital on violent crime rates because, in all likelihood, the causality between crime and social capital runs in both directions. An increase in violent crime is expected to erode trust. Its effect on other social capital indicators is, however, ambiguous. For example, high crime rates may create fears of leaving the house or neighborhood, thus inhibiting the participation in voluntary religious and secular organizations. It is also possible, however, that communities respond to rising crime by increasing their participation in social organizations, which may provide safe havens and emotional support to victims and may serve as venues to organize the community's crime-fighting strategies. In any case, in order to assess the independent effect of social capital on crime, we must use an econometric technique that controls for the joint endogeneity of social capital and violent crime. We accomplish this through the use of an instrumental-variable procedure (more precisely the generalized-method-of-moments estimator). We must first identify good instrumental variables. These are variables that are correlated with the explanatory variable to be instrumented for (the social capital indicators in our case) but uncorrelated with the regression residuals (that is, the
18
component of violent crime rates that cannot be explained by social capital, income inequality, or economic growth rates). We use as instruments for social capital, first, regional dummy variables indicating groups of countries according to geographic location or stage of development and, second, the numbers of telephones per capita and radios per capita in the country. We consider three regions, namely, Latin America, the transition economies (Eastern Europe, Central Asia, and China), and the OECD countries (Western Europe, the United States, and Japan).
The use of regional dummies as
instruments for social capital is justified by the notion that countries belonging to the aforementioned groups share historical experiences that affect the level of social capital in those countries, but these traits are not affected by the incidence of violent crime. Thus, we work under the assumption that the exogenous elements of the institutional, ethnic, and cultural factors that drive social capital are common to the countries in similar geographic location or stage of development.15 This commonality would arise from shared patterns of historical heritage and development experience. In addition, we also use as instrumental variables the number of phones per capita and the number of radios per capita in the country. According to Collier (1998), the availability of phones and radios affects social capital positively by reducing the costs of social interaction. It can also be argued that the availability of phones is affected by social capital because the demand for phones is driven by the demand for social interactions. Whether these variables are in fact “good”
Knack and Keefer (1997) find that trust is greater in societies with more equally distributed incomes, better educated and more ethnically homogeneous populations. Furthermore, they find that trust and civic cooperation tend to be higher in countries with public institutions that reduce the scope for predatory actions by the executive power (e.g., independence of the judiciary and other executive constraints). Similarly, Glaeser, Laibson, Scheinkman and Soutter (1999) find in an experiment realized with Harvard University students that trust and trustworthiness in a two-person game was well predicted by the degree of social connections between the individuals. In turn, social connection is higher among individuals who are from the same nationality, same race, and who know each other for a long time. For our purposes, what is important from these studies is that exogenous variables that capture historical heritage and development experience are appropriate instruments for social capital in a cross-country study. 15
19
instruments is an empirical question that can be answered with the econometric methodology discussed below. The instrumental-variable estimator we use is the generalized method of moments (GMM). Briefly, the GMM estimator is based on the assumption that each instrumental variable is uncorrelated with the regression residual. These assumptions are called “moment conditions.” Given that often times the number of instrumental variables is greater that the number of endogenous explanatory variables, the GMM estimator weighs optimally all instrumental variables to produce the most efficient and asymptotically consistent estimates. Testing the validity of the instruments (that is, testing the “moment conditions”) is crucial to ascertain the consistency of GMM estimates. If the regression on homicide rates passes the specification test, then we can safely draw conclusions regarding the independent (or exogenous) effect of a social capital indicator (or proxy) on violent crime rates. For instance, we can accept the statistical and economic significance of the estimated coefficient on trust as effects going from trust to the incidence of homicides; alternatively, we can safely discard the possibility that this effect is due to some omitted variable linked to the instruments. The specification test we use is the test of overidentifying restrictions introduced in the context of GMM by Hansen (1982) and further explained in Newey and West (1987). Intuitively, the fact that we have more moment conditions (instruments) than parameters to be estimated means that estimation could be done with fewer conditions. We can use this fact to estimate the error term under a set of moment conditions that excludes one instrumental variable at a time. We can then assess whether each estimated error term is uncorrelated with the instrumental variable excluded in the corresponding instrument set. The null hypothesis of Hansen's test is that the overidentifying restrictions are valid, that is, the instrumental variables are not correlated with the error term. The test statistic is simply the sample size times the value attained for the objective function at the GMM
20
estimate (called the J-statistic). Hansen's test statistic has a chi-square distribution with degrees of freedom equal to the number of moment conditions minus the number of parameters to be estimated. Tables 4 and 5 show the GMM results for the largest and common samples, respectively. We first analyze the results obtained using the largest number of observations in each regression (Table 4). The p-values of Hansen’s test, ranging from 0.12 to 0.53, indicate that we cannot reject the null hypothesis that the instruments are uncorrelated with the regression residuals. We must acknowledge that, even though all regressions pass the specification test at a 0.10 level of confidence, for some social capital indicators the null hypothesis of correct specification is barely accepted. In fact, for membership in all voluntary organizations, membership in voluntary secular organizations and participation in all voluntary organizations, the p-values of the specification test are not sufficiently high for us to conclude that their endogeneity problem was resolved. Regarding the estimated effects, Table 4 indicates that the Gini and the growth rate of GDP per capita are significant and robust determinants of homicide rates. Of the social capital variables, only the measure of trust is statistically significant and has the expected negative sign.16 The estimated coefficient of trust implies that a 1% increase in the number of survey respondents who believe that “most people can be trusted” can be associated with a 1.21% decline in the homicide rate. In the same regression, a 1 percentage-point decline in the Gini is associated with a decline in the homicide rate of about 4.9%. The estimated coefficients for the growth rate are implausibly large, indicating that this variable, indeed, is capturing the effect of many other factors. Contrary to the significant effect of trust on homicide rates, the other social capital indicators do not show a statistically significant effect.
We can identify three, not mutually exclusive,
explanations for the lack of a significantly crime-reducing effect of the social capital indicators other
16
Similar results are obtained when excluding two outliers (Brazil and China) from the sample.
21
than trust. First, the regressions for the other social capital indicators have smaller and possibly less representative samples of countries than that for trust. Second, the endogeneity problem of the other social capital indicators may not have been fully resolved with our proposed instruments, as hinted by the low Hansen test p-values of membership, membership in secular organizations, and participation in voluntary organizations. Third, the social capital indicators other than trust are more likely to reflect both group-specific and society-wide social capital, which may have opposite effects on overall violent crime rates (this is the specificity problem mentioned in the introduction). In order to analyze the first two potential causes for the differing results of trust and other social capital indicators, we first re-estimate the model using a common sample of countries for all regressions (Table 5); and, second, we use alternative instrumental variables for all social capital indicators (Table 6). Table 5 shows the GMM regression results using a common sample across the six social capital variables. First, note that these results further strengthen the argument that the Gini and the growth rate of GDP per capita are robust determinants of homicide rates -- the Gini and growth coefficients fail to be significant in only one occasion. Second, trust continues to show a negative effect on homicide rates, indicating that its effect is robust to changes in the sample of countries (although its estimated coefficient is smaller in this sample). Third, church attendance and religiosity now present a negative coefficient, which in the case of church attendance becomes statistically significant. And, fourth, the coefficients associated to the variables of membership and participation in voluntary social organizations do not change signs or statistical significance. . In summary, the crime-reducing impact of trust and the null impact of membership and participation are maintained in the common sample of countries; while in the case of church attendance and religiosity, the results obtained with the largest and common samples are dissimilar.
22
As mentioned above, another possibility for the lack of a significant crime-reducing effect of the social capital variables other than trust is that the set of chosen instrumental variables may not be appropriate, thus impeding the solution of the joint endogeneity problem. To address this issue, Table 6 shows results for GMM regressions where we have changed the set of instruments.17 We use two alternative sets of instrumental variables. First, only the regional dummy variables are employed as instruments, and second, regional dummy variables plus phones and radios per capita are used as instruments.18 In Table 6 trust is the only social capital indicator with a significant and negative coefficient with these sets of instruments. The endogeneity problem for participation in all voluntary organizations is not fully resolved by either set of instruments. Judging by the high Hansen test p-values, regions is a good instrument for member, member of secular organizations and religiosity while regions, phones, and radios is a better set for the remaining social capital indicators. Yet the corresponding estimated coefficients are not significantly different from zero.
V. DISCUSSION OF RESULTS AND CONCLUDING REMARKS Using national data for about 39 countries in the period 1980-94, we have examined the effect of various indicators of social capital on the incidence of violent crimes, measured by the homicide rate. We have also considered the effect of income inequality and economic growth on violent crime rates in order to minimize the omitted-variable bias in our estimates of social-capital effects on crime. Furthermore, acknowledging the possibility that the incidence of violent crimes in We must recognize, however, that the exercise in Table 6 only partially considers the issue of whether the instrumental variables are appropriate. While it considers the possibility that some of the current instrumental variables may not be valid (having an independent effect on crime), it does not account for the possibility that the instrumental variables may be insufficient to extract all the exogenous component of the social capital variables. 17
23
turn may affect social capital, we use instrumental variables to isolate the exogenous component of social capital variables and estimate its effect on violent crime. We thus deal with the joint endogeneity problem. We find that the sense of trust among community members has a significant negative effect on homicide rates. This effect is robust to the inclusion of income inequality and economic growth as additional explanatory variables, to changes in the sample of countries, and to changes in the set of instrumental variables used to control for reverse causation. The effect of other social capital indicators on violent crime is not clear. In the case of the religion-related variables, namely, religiosity (the self-proclaimed importance of religion in the individual’s daily life) and church attendance, the differing results obtained with various samples indicate that their effect on violent crime may be specific to either particular countries or particular types of religion. The unclear effect of these variables on crime does not seem to be explained by an inappropriate control for joint endogeneity, as the specification tests provide ample support to the corresponding GMM regressions. In the case of the social capital variables denoting involvement in social organizations, namely membership, membership in secular organizations and participation in voluntary social organizations, their null effect on violent crime does not seem to depend on the chosen sample of countries. Rather their insignificant and, thus, questionable effects may be due to a combination of two factors. The first is our inability to fully isolate the exogenous component of membership, membership in secular organizations and participation in voluntary social organizations and, thus, estimate correctly its effect on violent crime.
In other words, the joint endogeneity problem may still be present since most
specification tests can barely accept their GMM regressions under various sets of instruments. The
For ease of exposition, Table 6 does not show the estimated coefficients for our control variables. It suffices to say that the Gini index and the growth rate of GDP per capita remain robust determinants of homicide rates in every case. 18
24
second is that these indicators of "civic engagement" reflect both group-specific and society-wide social capital. While the latter type of social capital may reduce violent crime, the former may increase it. The lack of statistical significance of these variables, which persists under different samples and instruments, may indicate that for these variables the effects of group-specific and society-wide social capital neutralize each other. A major challenge for future research in this area is to discriminate, precisely and quantitatively, the effects of group-specific and society-wide social capital, thus resolving the specificity problem that we have only noted in this paper. We highlight the crime-reducing effect of trust. We can argue -- though at a hypothetical level rather than as a proven conclusion -- that this beneficial effect is representative of the effect of society-wide social capital in general, despite the ambiguous results on the other social capital indicators. Why? Given the way the WV survey questions are phrased, the indicator of Trust is likely to reflect a characteristic that is general to society (rather than specific to particular groups), and therefore, it does not suffer from the specificity problem that afflicts the indicators of membership and participation in social organizations.19 Furthermore, trust is an ideology-free social characteristic and, thus, in contrast to religiosity and church attendance, it does not depend on particular sets of beliefs that condition its social effects. Finally, we note the significant and robust effects of income inequality and economic growth on the incidence of violent crimes. Both a decrease in inequality and a rise in economic growth lead to lower rates of violent crimes. This result is robust to the inclusion of social capital variables. In particular, it cannot be argued that the crime-increasing effect of income inequality is solely due to its negative influence on social capital. Income inequality and economic growth have independent and strong effects on violent crimes. 19 It is important to notice that the question in the WWS about trust refers to the society in general and not to any specific group. Additionally, Glaeser et al. (1999, 5) find that “while survey questions are bad at
25
predicting any individual’s level of trust, they may be good at predicting the overall level of trustworthiness in society”
26
REFERENCES Barro, Robert J. 1997. “Myopia and Inconsistency in the Neoclassical Growth Model.” National Bureau of Economic Research Working Paper Series. 63, Cambridge, MA. Becker, Gary S. 1968. "Crime and Punishment: An Economic Approach.” Journal of Political Economy 76: 169-217. Brehm, John and Wendy Rahn. 1997. "Individual-Level Evidence for the Causes and Consequences of Social Capital." American Journal of Political Science 41: 999-1023. Burki, Shahid Javed, and Guillermo Perry. 1998. Beyond the Washington Consensus: Institutions Matter. World Bank Latin American and the Caribbean Studies Viewpoints. Washington, DC: World Bank. Bursik, Robert J., Jr. and Harold G. Grasmick. 1993. Neighborhoods and Crime: The Dimensions of Effective Community Control. New York: Lexington Books. Coleman, James S. 1990. Foundations of Social Theory. Cambridge, MA: Harvard University Press. Collier, Paul. 1998. “Social Capital and Poverty.” Unpublished mimeograph. Development Economics Research Group, The World Bank. Washington, DC. Deininger, Klaus, and Lyn Squire. 1996. “A New Data Set Measuring Income Inequality.” World Bank Economic Review 10 (3): 565-592. DiIulio, John J. Jr. 1996. “Help Wanted: Economists, Crime and Public Policy.” Journal of Economic Perspectives 10: 3-24. Donohue, John J. 1998. “Understanding the Time Path of Crime.” The Journal of Criminal Law and Criminology 88(4): 1423-1451. Durlauf, Steven N. 1999. “The Case “Against” Social Capital.” Focus 20 (3): 1-5. Institute for Research on Poverty. University of Wisconsin-Madison. Esteban, Joan-Maria, and Debraj Ray. 1994. “On the Measurement of Polarization.” Econometrica 62(4): 819-852. Fajnzylber, Pablo, Daniel Lederman, and Norman Loayza. 1998. Determinants of Crime Rates in Latin America and the World. An Empirical Assessment. World Bank Latin American and the Caribbean Studies Viewpoints. Washington, DC: The World Bank. http://www.worldbank.org/research/conflict/papers.htm Fajnzylber, Pablo, Daniel Lederman, and Norman Loayza. 2000. "Crime and Victimization: An Economic Perspective." Economia. Forthcoming. Fukuyama, Francis. 1995. “Social Capital and the Global Economy.” Foreign Affairs 74: 89-103.
27
Glaeser, Edward. 1999. “An Overview of Crime and Punishment.” Paper presented at the Workshop on The Economics of Civil Wars, Crime and Violence, February 1999, The World Bank, Washington, DC. http://www.worldbank.org/research/conflict/papers.htm Glaeser, Edward, David Laibson, Jose A. Scheinkman, and Christine L. Soutter. 1999. “What Is Social Capital? The Determinants of Trust and Trustworthiness.” NBER Working Paper Series 7216. National Bureau of Economic Research, Cambridge, MA. http://www.nber.org/papers/w7216 Glaeser, Edward, and Bruce Sacerdote. 1999. “Why Is There More Crime in Cities?” Journal of Political Economy,. Forthcoming. Glaeser, Edward, Bruce Sacerdote, and Jose A. Scheinkman. 1996. “Crime and Social Interactions.” Quarterly Journal of Economics 111: 507-548. Hansen, Lars P. 1982, “Large Sample Properties of Generalized Method of Moments Estimators.” Econometrica. 50:1029-1054. Jackman, Robert W. and Ross A.. Miller. 1998. “Social Capital and Politics.” Annual Review of Political Science: 47-73. Knack, Stephen, and Phillip Keefer. 1997. “Does Social Capital Have an Economic Payoff? A Cross Country Investigation.” Quarterly Journal of Economics 112:1251-1288. LaFree, Gary. 1999. "A Summary and Review of Cross-National Comparative Studies of Homicide." In M.D. Smith and M.A. Zahn, eds., Homicide: A Sourcebook of Social Research.Thousand Oaks, CA: Sage. Land, Kenneth C., Patricia L. McCall, and Lawrence E. Cohen. 1990. "Structural Covariates of Homicide Rates: Are There Any Invariances Across Time and Social Space?" American Journal of Sociology 95: 922-963. Messner, Steven F., and Richard Rosenfeld. 1998. "Social Structure and Homicide: Theory and Research." Pp. 27-41 in Homicide: A Sourcebook of Social Research, edited by M.D. Smith and M.A. Zahn. Thousand Oaks, CA: Sage. Moser, Caroline, and Elizabeth Shrader. 1998. “A Conceptual Framework for Violence Reduction.” Unpublished mimeograph. LCSES, The World Bank, Washington, DC. Moser, Caroline, and Jeremy Holland. 1997. Urban Poverty and Violence in Jamaica. World Bank Latin American and the Caribbean Studies Viewpoints. Washington, DC: The World Bank. Muller, Edward, and Mitchell Seligson. 1994. “Civic Culture and Democracy: The Question of Causal Relationships.” American Political Science Review 88:635-652. Nisbett, R., and D. Cohen. 1996. Culture of Honor: The psychology of Violence in the South. Westview Press, Boulder, CO.
28
Narayan, Deepa. 1997. “Voices of the Poor: Poverty and Social Capital in Tanzania.” Environmentally Sustainable Studies and Monograph Series 20. The World Bank. Washington, DC. Newey, Whitney, and Kenneth West. 1987. “Hypothesis Testing with Efficient Method of Moment Estimation.” International Economic Review 28: 777-787. Putnam, Robert. 1993. Making Democracy Work: Civic Traditions in Modern Italy. Princeton University Press: Princeton, NJ. Rosenfeld, Richard, and Steven F. Messner. 1998. "Beyond the Criminal Justice System: Anomie, Institutional Vitality, and Crime in the United States." Paper presented at the meeting of the American Sociological Association, San Francisco, CA. Rosenfeld, Richard, Steven F. Messner, and Eric P. Baumer. 1999. “Social Capital and Homicide.” Unpublished mimeograph. Department of Criminology and Criminal Justice, University of MissouriSt. Louis. Robinson, Lindon, and Marcelo E. Siles. 1997. “Social Capital and Household Income Distribution in the United States: 1980, 1990.” Department of Agricultural Economics, Report 595, Michigan State University, Lansing, Michigan. Rubio, Mauricio. 1997. “Perverse Social Capital – Some Evidence from Colombia.” Journal of Economic Issues 31:805-816. Sampson, Robert J. 1997. "The Embeddedness of Child and Adolescent Development: A Community-Level Perspective on Urban Violence." In J. McCord ed., Violence and Childhood in the Inner City, . Cambridge, UK: Cambridge University Press. World Values Study Group. 1994. World Values Survey, 1984-93 [Computer File]. ICPSR version. Ann Arbor MI: Institute for social Research [producer], 1994. Ann Arbor, MI: Inter-university Consortium for Political and Social Research [distributor].
29
Table 1: Definition of Variables Variables for Survey Question Social Capital TRUST* Generally speaking, would you say that most people can be trusted, or that you can’t be too careful in dealing with people?
Description
The indicator for trust is the average mean of trust for the surveys of 1981 and 1990. This indicator is the percentage of respondents in each country who said that “most people can be trusted”, after deleting the don’t know responses. MEMBER* Please look at the following list The measure of the density of member of voluntary organizations and activity is the average number of groups cited activities and say which, if any, per respondent in each country. do you belong to? MEMBER Same as above The same responses are used but now the SECULAR* measure is of membership to secular organizations only. Thus membership to religious organizations are excluded in this measure. PARTICIPAPlease look at the following list The measure of the density of voluntary work TION* of voluntary organizations and is the average number of groups cited per activities and say which, if any, respondent in each country for whom they are you currently doing are doing any form of voluntary work. voluntary work for? RELIGIOSITY* Please say how important is The numbers were averaged across the religion in your life. respondent in each country to obtain an 1 – Very Important indicator of the degree of religiosity in the 2 – Quite Important country. 3 – Not Very Important In order for an increase of this variable to 4 – Not At All Important. represent an increase in social capital we take the inverse of the original value. CHURCH Apart from weddings, funerals Measured on an 8-point scale from 1 (more ATTENand christenings, about how than once a week) to 8 (never), the responses DANCE* often do you attend religious were averaged to obtain an indicator of services these days? participation in religious services. 1 – More than Once a Week In order for an increase of this variable to 2 – Once a Week represent an increase in social capital we take 3 – Once a Month the inverse of the original value. 4 – Christmas and Easter Day 5 – Other Specific Holy Days 6 – Once a Year 7 – Less Often 8 – Never, Practically Never Other Variables Description Source HOMICIDE Homicide rates per 100,000 World Health Organization. RATES* people. http://www.who.int/whosis
30
Variables for Survey Question Social Capital GINI Gini coefficient, after adding 6.6 to the expenditure based data to make it comparable to the income-based data. GROWTH OF Rate of growth of GDP per GDP capita derived from: PER-CAPITA {[(GDPpc 94/GDPpc 80)^(1/14)] –1}*100 For Czech Rep the years are 1984-1994. For Lithuania the years are 1987-1994. TELEPHONES Main Lines per 1,000 people. * RADIOS* Radios per 1,000 people.
Description Constructed from Deninger and Squire (1996). GDP from World Development Indicators, at Constant Local Currency Market Prices of 1995. The World Bank. Population from World Development Indicators. The World Bank.
World Development Indicators. The World Bank. World Development Indicators. The World Bank.
REGIONAL Transition Economies, Latin DUMMIES America and OECD. *These variables were expressed in logarithms in the empirical section.
31
Table 2: OLS Regressions on Homicide Rates* Sample: Largest sample for the corresponding regression of each social capital variable (t-statistics in parenthesis)
CONSTANT GINI GROWTH
SOCIAL CAPITAL: TRUST MEMBER MEMBER SECULAR PARTICIPATION RELIGIOSITY CHURCH ATTENDANCE
-1.00 (-1.91) 5.12 (4.13) -24.39 (-4.57) -0.40 (-1.31)
-0.71 (-1.60) 5.84 (4.63) -31.05 (-7.23)
0.24 (1.00)
-0.62 (-1.36) 5.69 (4.49) -31.41 (-6.94)
0.11 (0.47)
-0.32 (-0.61) 6.01 (4.53) -31.37 (-7.51)
0.47 (1.72)
-0.80 (-2.12) 5.89 (5.43) -34.34 (-7.69)
-0.12 (-0.45)
Adjusted R-squared 0.59 0.71 0.70 0.75 0.75 Included observations 39 30 30 28 31 * Homicide rates and all social capital variables are expressed in logarithms.
-0.54 (-0.56) 5.74 (4.30) -31.32 (-6.23)
0.11 (0.26) 0.65 30
32
Table 3: OLS Regressions on Homicide Rates* Sample: Common sample for the regressions of all social capital variables (t-statistics in parenthesis)
CONSTANT GINI GROWTH
SOCIAL CAPITAL: TRUST MEMBER MEMBER SECULAR PARTICIPATION RELIGIOSITY CHURCH ATTENDANCE
-0.51 (-1.16) 5.37 (3.80) -40.67 (-6.52) -0.07 (-0.25)
-0.53 (-1.25) 5.80 (4.72) -41.89 (-8.18)
0.21 (0.97)
-0.40 (-0.94) 5.68 (4.68) -42.88 (-8.04)
0.09 (0.20) 5.68 (5.42) -44.07 (-9.68)
-0.48 (-1.04) 5.55 (4.41) -41.55 (-7.38)
-0.46 (-0.43) 5.54 (3.86) -41.51 (-7.84)
0.18 (0.90)
0.62 (2.79)
0.00 (0.01)
Adjusted R-squared 0.78 0.79 0.79 0.84 0.78 Included observations 25 25 25 25 25 * Homicide rates and all social capital variables are expressed in logarithms.
0.01 (0.02) 0.78 25
33
Table 4: GMM Regressions on Homicide Rates* Sample: Largest sample for the corresponding regression of each social capital variable Instrumental variables: Regional dummies and phones per capita (t-statistics in parenthesis)
CONSTANT GINI GROWTH
SOCIAL CAPITAL: TRUST MEMBER MEMBER SECULAR PARTICIPATION RELIGIOSITY CHURCH ATTENDANCE
-1.82 (-2.35) 4.90 (3.50) -20.86 (-4.08) -1.21 (-1.78)
-0.70 (-1.96) 5.58 (4.51) -35.52 (-6.77)
-0.41 (-0.46)
-1.03 (-2.22) 5.45 (4.86) -32.15 (-6.40)
-0.66 (-0.85)
-0.58 (-0.81) 6.57 (8.86) -36.69 (-7.66)
0.38 (0.59)
-0.90 (-2.18) 6.46 (8.89) -36.51 (-4.39)
0.56 (0.49)
-4.54 (-1.21) 8.26 (3.57) -38.26 (-6.39)
-1.90 (-1.00)
J-statistic 0.03 0.14 0.12 0.16 0.04 0.07 p-value 0.51 0.12 0.18 0.22 0.53 0.35 Included observations 39 30 30 28 31 30 * Homicide rates and all social capital variables are expressed in logarithms. Phones per capita is also expressed in logs. The regions are Latin America, transition economies and OECD.
34
Table 5: GMM Regressions on Homicide Rates* Sample: Common sample for the regressions of all social capital variables Instrumental Variables: Regional dummies and phones per capita (t-statistics in parenthesis)
CONSTANT GINI GROWTH
SOCIAL CAPITAL: TRUST MEMBER MEMBER SECULAR PARTICIPATION RELIGIOSITY CHURCH ATTENDANCE
-0.72 (-1.71) 3.95 (3.23) -33.71 (-6.19) -0.61 (-1.99)
0.06 (0.09) 3.16 (1.30) -40.39 (-5.54)
-1.38 (-1.15)
-0.80 (-1.48) 4.34 (2.42) -34.88 (-4.06)
-1.04 (-1.23)
0.56 (0.55) 6.28 (7.99) -46.75 (-7.04)
1.29 (1.36)
-2.36 (-1.36) 8.68 (2.94) -16.67 (-0.77)
-2.62 (-0.97)
-4.87 (-2.36) 8.49 (4.80) -45.10 (-9.45)
-2.19 (-2.28)
J-statistic 0.10 0.07 0.05 0.06 0.03 0.11 p-value 0.27 0.41 0.52 0.49 0.69 0.26 Included observations 25 25 25 25 25 25 * Homicide rates and all social capital variables are expressed in logarithms. Phones per capita is also expressed in logs. The regions are Latin America, Transition Economies and OECD.
35
Table 6: GMM Regressions on Homicide Rates Using Two Sets of Instrumental Variables* Sample: Largest sample for the corresponding regression of each social capital variable Instrumental variables: First set: Regions. Second set: Regions, phones and radios Only the coefficients and t-statistics on the social capital variables are reported for each regression** SETS OF INSTRUMENTAL VARIABLES SOCIAL CAPITAL REGIONS J-statistic's REGIONS, J-statistic's No. VARIABLES p-value PHONES and p-value Observations RADIOS TRUST -1.20 0.31 -1.24 0.70 39 (-1.72) (-1.83) MEMBER -1.82 0.50 0.76 0.20 30 (-0.92) (1.25) MEMBER -1.54 0.91 0.29 0.09 30 SECULAR (-1.20) (0.43) PARTICIPATION 0.01 0.09 0.94 0.22 28 (0.01) (1.40) RELIGIOSITY 2.37 0.90 1.68 0.45 31 (0.66) (1.42) CHURCH -0.81 0.13 -2.29 0.60 30 ATTENDANCE (-0.34) (-1.32) * Homicide rates and all social capital variables are expressed in logarithms. Phones and radios per capita are also expressed in logs. The regions are Latin America, Transition Economies and OECD. ** Coefficients and t-statistics for Gini and Growth of GDP per capita are not reported but in every case they are significant and with the expected signs.
36
Figure 1: Simple Regressions of the Log of Homicide Rates on Social Capital Indicators TRUST AND HOMICIDE RATES
MEMBER AND HOMICIDES
6
6 l(hom) = 0.8535 + 0.0033 l(member) + u t-stat (4.30) (0.01)
4
L(HOMICIDE RATES)
L(HOMICIDE RATES)
l(hom) = -0.16 - 1.07 l(trust) + u t-stat (-0.35) (-2.72)
2
0
-2 -3.0
-2.5
-2.0
-1.5
-1.0
-0.5
4
2
0
-2 -1.0
0.0
-0.5
SECULAR MEMBERSHIP AND HOMICIDES
6 l(hom) = 1.0588 + 0.2064 l(vol) + u t-stat (1.93) (0.38)
4
L(HOMICIDE RATES)
L(HOMICIDE RATES)
l(hom) = 0.5532 - 0.5065 l(memsec) + u t-stat (1.88) (-1.30)
2
0
-1.5
-1.0
-0.5
0.0
4
2
0
-2 -2.0
0.5
-1.5
-1.0
-0.5
0.0
L(MEMBER SECULAR)
L(VOLUNTEER)
RELIGIOSITY AND HOMICIDE RATES
CHURCH ATTENDANCE AND HOMICIDE RATES
6
6 l(hom) = 0.76 - 0.55 l(religiosity) + u t-stat (3.82) (-1.24)
l(hom) = 1.79 + 0.63 l(church) + u t-stat (1.65) (0.94)
4
L(HOMICIDE RATES)
L(HOMICIDE RATES)
1.0
VOLUNTEER AND HOMICIDES (WHO)
6
2
0
-2 -1.5
0.5
L(MEMBER)
L(TRUST)
-2 -2.0
0.0
-1.0
-0.5
0.0
L(RELIGIOSITY)
0.5
1.0
4
2
0
-2 -2.5
-2.0
-1.5
-1.0
-0.5
L(CHURCH ATTENDANCE)
37
Appendix A: Data Base
Homicide Rate (per 100,000 people) Argentina Australia Austria Belarus * Belgium Brazil Bulgaria Canada Chile * China CostaRica * CzechRepublic * Denmark ElSalvador * Estonia * Finland France Germany * Greece * Guatemala * Honduras * Hungary Iceland * India * Ireland Italy Japan Korea,Rep. * Latvia Lithuania * Luxembourg * Mexico Netherlands Nicaragua * Norway Panama * Poland * Portugal Romania RussianFederation * Slovenia * SouthAfrica * Spain Sweden Switzerland * Turkey * UnitedKingdom UnitedStates
4.73124 1.93399 1.38188 6.21584 1.61699 16.87023 3.40627 2.06600 3.02029 0.18189 4.41553 1.46031 1.19684 40.80075 11.97921 3.03383 1.11712 1.15690 1.00315 61.00185 3.00754 0.83926 0.80355 1.96990 0.77396 1.29722 10.46274 7.61461 1.82765 18.50258 0.98317 5.29986 1.18564 4.42356 2.19892 1.46163 4.55899 15.43816 1.94360 0.97082 1.29609 1.28137 0.90575 9.36161
Gini
Growth GDP percapita
0.43576 0.39436 0.29578
0.00075 0.01614 0.01760
0.26590 0.56938 0.24714 0.30826 0.53991 0.31708 0.44244 0.22293 0.26979 0.44770 0.40270 0.25398 0.31670
0.01423 0.00074 0.00919 0.01120 0.03324 0.08499 0.00510 -0.01189 0.01831 0.00070 -0.01924 0.01202 0.01398
0.40840 0.58660 0.53262 0.25728
0.01006 -0.00752 -0.00419 0.00152
0.38937 0.35125 0.33282 0.35167 0.35576 0.26980 0.33640 0.27130 0.54157 0.28667 0.56920 0.28511 0.51970 0.25851 0.36397 0.24940
0.03398 0.03534 0.01697 0.02761 0.07313 -0.02575 -0.04577 0.04100 -0.00055 0.01542 -0.03606 0.02326 0.00744 -0.00381 0.02582 -0.01398
0.27075 0.52825 0.32283 0.31721 0.34312 0.47545 0.28158 0.37078
-0.01262 0.02024 0.00923 0.00665 0.02089 0.01885 0.01434
Trust
0.25 0.48 0.32 0.25 0.32 0.07 0.30 0.51 0.23 0.60 0.45 0.28** 0.57 0.35 0.28 0.60 0.24 0.34 0.50 0.40 0.50 0.29 0.42 0.34 0.44 0.32 0.42 0.36 0.19 0.31** 0.32 0.26 0.51 0.32 0.63 0.43 0.35 0.21 0.16 0.38 0.17 0.29 0.35 0.62 0.43 0.10 0.44 0.48
Member
Member Volunteer Secular
0.41 1.02 1.11
0.28 0.57 0.76
0.26 0.34 0.40
1.15 0.87 0.69 1.40 0.82 0.98
0.89 0.58 0.48 1.01 0.58 0.95
0.47 0.45 0.37 0.77
1.33
0.83
0.30
1.22 0.91 0.55 1.11
0.59 0.59 0.42 0.81
0.51 0.46 0.32 0.39
0.73
0.30
0.24
0.89 0.50 0.42 1.03 1.21 0.89
0.55 0.37 0.26 0.65 0.66 0.43
0.37 0.33 0.21 0.39 0.68 0.45
0.63 1.88
0.43 1.37
0.36 0.50
1.50
1.03
0.48
0.55 0.42 1.03 0.60 0.82 0.41 1.62 0.73
0.40 0.17 0.41 0.38 0.45 0.28 1.00 0.56
0.30 0.33 0.34 0.25 0.49 0.22 0.52
1.00 1.66
0.65 1.04
0.25 0.74
0.99
* Countries that do not belong to the common sample **Growth of GDP per capita for the Czech Republic covers the years 1984-94 and for Lithuania 1987-94
38
Continuation Telephone Radio (per lines (per Religion Attendance 1,000 1,000 people) people) Argentina Australia Austria Belarus * Belgium Brazil Bulgaria Canada Chile * China CostaRica * CzechRepublic * Denmark ElSalvador * Estonia * Finland France Germany * Greece * Guatemala * Honduras * Hungary Iceland * India * Ireland Italy Japan Korea,Rep. * Latvia Lithuania * Luxembourg * Mexico Netherlands Nicaragua * Norway Panama * Poland * Portugal Romania RussianFederation * Slovenia * SouthAfrica * Spain Sweden Switzerland * Turkey * UnitedKingdom UnitedStates
1.26 0.82 1.85 2.32 1.85 0.93 1.47 0.97 1.12 0.85
3.81 4.23 4.57 6.77 5.30 4.32 6.42 4.75 4.64 7.87
0.51 1.88
5.92 6.37
1.30 1.06 1.21 2.13
5.63 6.35 5.10
0.87
5.66
1.00 0.88 1.25 1.80
2.96 2.31 4.10 5.68 4.66 6.17
3.73 1.92 1.23 1.23
3.43 5.33
0.71
6.00
0.97 0.99 0.88 1.26 2.31 1.38 1.10 1.07 1.41 0.96 0.93 1.04
2.64 4.53 4.34 7.02 4.92 3.85 4.73 6.42 4.74 4.57 5.97 3.87
96.01 414.34 381.79 125.76 345.82 58.41 198.02 499.07 58.27 6.11 89.34 146.85 522.35 23.04 188.91 474.36 440.51 415.60 347.47 17.30 14.25 89.97 465.08 5.44 235.51 334.94 404.29 224.62 216.14 176.28 446.47 59.37 427.46 13.51 444.42 84.10 79.53 199.74 95.82 118.26 248.29 75.36 277.45 644.03 531.72 88.70 401.81 515.14
611.00 1224.01 429.85 290.28 758.26 346.06 416.00 870.11 322.42 145.63 222.22 283.32 969.89 391.27 867.14 963.11 859.53 919.81 390.59 58.36 282.44 568.33 757.89 69.57 531.47 654.01 801.21 898.08 457.18 384.99 651.03 209.71 831.78 250.35 741.43 190.57 366.61 207.80 187.93 339.58 296.38 281.82 446.11 865.40 823.51 137.38 1054.18 2071.59
ECA
LAC
0 0 0 1 0 0 1 0 0 1 0 1 0 0 1 0 0 0 0 0 0 1 0 0 0 0 0 0 1 1 0 0 0 0 0 0 1 0 1 1 1 0 0 0 0 0 0 0
OECD
1 0 0 0 0 1 0 0 1 0 1 0 0 1 0 0 0 0 0 1 1 0 0 0 0 0 0 0 0 0 0 1 0 1 0 1 0 0 0 0 0 0 0 0 0 0 0 0
0 1 1 0 1 0 0 1 0 0 0 0 1 0 0 1 1 1 1 0 0 0 1 0 1 1 1 1 0 0 1 0 1 0 1 0 0 1 0 0 0 0 1 1 1 1 1 1
* Countries that do not belong to the common sample **Growth of GDP per capita for the Czech Republic covers the years 1984-94 and for Lithuania 1987-94
39
Summary Statistics
Maximum Sample HOMICIDE RATES
GINI
GROWTH GDP PC
TRUST
MEMBER
MEMSEC PARTICIP
RELIGIOS CHURCHA PHONES ITY TTEND
RADIOS
Mean Median Maximum Minimum Std. Dev.
6.068143 1.956750 61.00185 0.181894 11.06675
0.363463 0.336400 0.586600 0.222933 0.103324
0.010664 0.011199 0.084986 -0.045770 0.023785
0.361396 0.342500 0.630000 0.070000 0.133159
0.943824 0.900000 1.880000 0.410000 0.382361
0.609706 0.575000 1.370000 0.170000 0.277429
0.421250 0.380000 0.990000 0.210000 0.173647
1.327632 1.165000 3.730000 0.510000 0.598617
5.025676 4.750000 7.870000 2.310000 1.242890
245.1465 556.191 207.9386 437.981 644.0277 2071.59 5.437976 58.3632 181.2597 372.888
N
44
43
43
48
34
34
32
38
37
48
48
Common Sample HOMICIDE RATES
GINI
GROWTH GDP PC
TRUST
MEMBER
MEMSEC PARTICIP
RELIGIOSITY CHURCH PHONES RADIOS ATTEND
Mean Median Maximum Minimum Std. Dev.
3.751210 1.616992 18.50258 0.181894 4.888820
0.330243 0.014699 0.381600 0.316700 0.014336 0.345000 0.569380 0.084986 0.630000 0.247136 -0.025752 0.070000 0.083006 0.019517 0.158198
0.953600 0.910000 1.880000 0.410000 0.433300
0.634800 0.426400 0.580000 0.370000 1.370000 0.990000 0.170000 0.210000 0.311463 0.191787
1.274400 1.070000 3.730000 0.710000 0.617334
5.12640 5.30000 7.87000 2.31000 1.21808
311.3155 345.8171 644.0277 6.109991 176.1026
688.864 654.013 2071.59 145.634 410.538
N
25
25
25
25
25
25
25
25
25
25
25
40
Appendix B: A Model of Criminal Behavior with Social Capital This appendix introduces social capital to the simple model of criminal behavior presented by Fajnzylber et al. (1998). The model assumes that the potential criminal is rational. She decides to commit a crime if its benefits are higher than its costs. Consider a society composed by three individuals (i, j and z). The net benefit (nb) for agent i of committing a crime against j depends on its expected pay off, which is the size of the loot (l), minus the forgone wages from legitimate activities (w). An expected change in social capital also affects i's utility function u directly, following the model developed by Robinson and Siles (1997).20 Agent i will commit the crime against agent j if this net benefit is higher than her moral threshold (M):21 nbij = l j − wi + u (∆sk ie ) ≥ M *
(1)
The forgone wages of agent i are a function of her stock of capital (k, which includes human capital) and social capital. The inclusion of social capital in the production function follows the model presented by Collier (1998). wi = w(k i , sk i )
(2)
Based on the model developed by Robinson and Siles (1997), the social capital of agent i depends on the relationships this individual has with other members of the society. In our simple society, it depends on the “social” distance (d) between this agent i and the other two agents j and z, and also depends on how sympathetic (r) are her relationships with the rest of the members of society.22 sk i = g ij (d ij , rij ) + g iz (d iz , riz )
(3)
For simplicity we assume that social capital is additive and that total social capital is not bigger than the sum of its parts.23 The distance between individuals depends on communications costs (CC) such as geography, culture, technology, etc., which we assume to be exogenous. The size of the loot is a portion of the income of agent j. l j = αw j = α [ w(k j , sk j )], where0 < α < 1
(4)
Replacing equations (2) through (4) into (1) we obtain: 20
Since i is concerned about "net" benefits, she considers the expected change in her social capital, rather than the level.
21 Here we normalize the probability of being caught to zero. Moreover, we have excluded the effect that social capital may have on the probability of detecting the criminal by community members. 22 We assume symmetry in sympathetic relationships: r =r . ij ji 23 Glaeser, Laibson, Scheinkman, and Soutter (1999) find that the issue of aggregation of social capital is not trivial. First, because the social capital of a set of individuals is the aggregate of those individuals’ social capital that takes into account all externalities across the members of the set, and second, because private returns to social capital differ from private returns.
41
nbij = α[w(k j , (g ji (d ji , r ji ) + g jz (d jz , r jz )))]− w(ki , (gij (dij , rij ) + giz (diz , riz )))+ u(∆rije ) + u(∆rize ) (5) Assume that the stock of capital (k) and the “social” distance are fixed. Again, consider the case where agent i is deciding whether to commit a crime against agent j. The change in the expected net benefit that would be associated with changes in the sympathy received by agent i is24:
ù é ∂w ù ∂u é ∂w j ∂w j ∂w ∂u • ∆rije + ∆nbij = α ê • ∆rij + • ∆r jz ú − ê i • ∆rij + i • ∆riz ú + • ∆rize e e ∂r jz ∂riz ∂riz úû êë ∂rij úû ∂rij êë ∂rij
(6)
Now consider the following three cases presented below: (i) an increase in society-wide social capital, (ii) an increase in group-specific social capital where the group is conformed by i (the potential criminal) and j, and excludes individual z, and (iii) an increase in group-specific social capital where the group is conformed by j and z, and excludes individual i (the potential criminal). Since “social” distance is assumed constant, any increase in social capital is equivalent to a rise in the sympathetic component of social capital (r). Case (i):
∆rij = ∆riz = ∆r jz > 0
From equation (6) we can see that the effect of an increase in society-wide social capital on the net benefit of i is negative. Both components inside brackets change in equal magnitude: there is an increase in the productivity of both agents due to the rise in social capital. Since 0 0 ï íand ï∆r = ∆r = 0 jz î iz
An increase in social capital that is group-specific and excludes individual z also has a negative effect on the net benefit of i for the same reasons as in case (i), but the overall effect is smaller.
Case (iii):
24
ì∆r jz > 0 ï íand ï∆r = ∆r = 0 iz î ij
In equation (6), the impact of
∆r e feeds into ∆nb only through its elasticity with respect to r e because the
"current" level of r is fixed.
42
An increase in social capital that is group-specific and excludes individual i has a positive effect on the size of the loot, has no effect on the size of forgone wages, and therefore has an opposite effect as the two cases discussed above. In this case, the value of the net loot increases. The expected change in the utility of social capital after committing the crime is negative, and therefore, we cannot derive firm conclusions about the sign of the change in the net benefit. In sum, societywide social capital has, in this model, a greater crime-reducing effect due to the reduction in the net benefit of crime than group-specific social capital, especially when the group excludes the potential criminal. The effect of social capital on violent crime captured in the empirical section of this paper might be only accounting for the direct effect that social capital indicators have on the net benefit of committing a crime, because the gini coefficient (included in order to account for omitted variables) might be also picking up all or some of the effect that social capital has on the difference between the size of the loot and the opportunity cost of crime (the net loot). Nonetheless, note that even in the most extreme case where social capital variables are only capturing the direct effect on violent crime through the reduction of the expected utility, the conclusions of the model still apply: The net benefit of crime is lower for the potential criminal when there is an increase in society-wide social capital than when there is group-specific social capital. This is so because ∆rij e = ∆riz e =0 when i does not belong to the group conformed by j and z . Therefore the potential criminal in this case will not expect a loss of utility from losing the sympathy of her peers. In contrast, if she belonged to the group, then ∆rij e = ∆rij e < 0 thus reducing the incentive to commit the crime.
43