INTERNATIONAL JOURNAL OF
Volume 5 • Number 2 • December 2011 pp. 155-165
ECONOMICS
Does Population Growth Matter in Bhutan’s Economic Development? Komol Singha* The study of population and economic growth has been the subject of intense debates in the field of economics for nearly two centuries between the two schools of thought. One relates to pessimistic opinion that population has a negative impact on economic growth while the other is convinced that the effect is positive. Very recently, a new school (third group) argues that the rise in population is neutral on economic growth. However, till date, due to the one factor or the other, the issue remains inconclusive. The main aim of this study is to analyse whether the present population growth trend in Bhutan is tolerable or not. Is the population growth in Bhutan an issue or not? Based on Malthusian and Dalton’s Optimum Population Theory, the present paper tries to identify the limit of population that the country can expand. JEL Classification Codes: J11; J21; N30; N35. First Draft: June 2010, Gedu, Bhutan. Keywords: Population Growth; Economic Development; Malthusian Theory; Optimum Population. 1.
INTRODUCTION
Population related goals and policies are integral parts of cultural, economic and social development (UN International Conference on Population and Development 1994) of a nation. The nexus between population and economic growth has been the subject of intense debates in economics for nearly two centuries between the two schools of thought, basically the Malthusian view of Coale and Hoover, and the Cornucopian views of Julian Simon (Birdsall, et al. 2001). The former school of thought maintains that population has a negative impact on economic growth while the later is convinced that the effect is positive. Recently, a new school (third group) argues that the population growth is absolutely neutral on economic growth. It may not determine economic growth, but the former variable does not hamper the latter (Simon 1987). If there is any, it may be the problem of employment, development and distribution of the increased population (Todaro and Smith 2006; Mitra and Nagarajan 2005; Kuznets 1955). In conventional population theories, especially for the pessimists group, rise in population has often been cause of war, poverty and famine, whereas victory in battles has been cause of conquest of lands and prosperity, agricultural and economical (Verma and Bhandari 2010). These result in economic crisis, starvation and social problems. But, it is not true everywhere, *
Department of Economics, Royal University of Bhutan (Gaeddu College of Business Studies), Gedu, Bhutan, (
[email protected])
156
Komol Singha
every time. Expanding opportunities for absorption of labour led the mercantilists to advocate increase in population. The view came to be known as the Populationist Theory in the seventeenth century (Ibid 2010). Assessing the consequences of population on the pace and process of economic growth is one of the oldest themes in the literature of economics (Kelley 2000). Similarly, the impact of population growth on economic development is one of the important features of classical economists and it is basically credited to Malthus. In the opinion of new school, rise in population becomes an issue only when it retards the process of growth and development of an economy or a society. There is no point of discussion when its role is neutral on development of a nation (Singha 2007; Kuznets 1955). The centre of gravity for research on economic development (to take one example) does not lay in hand of demography or even in the journals that are most likely to be read by the demographers (Hirschman 2004). There are many schools of research and paradigms on economic development (Hirschman 2004; Birdsall, et al. 2001). Still, there is no consensus opinion on the issue even after the complete reign of modern economists in this twenty first century that the issue remains an inconclusive today (Birdsall, et al. 2001). 2.
OBJECTIVES AND METHODOLOGY
Though the issue of population is gaining increasing recognition in the field of development economics, there is no consensus opinion of its effect on the economy. Statistical correlations between the two variables do not tell which is influencing the other, or whether a third variable is influencing both (Simon 1987). However, one of the most significant stylized facts in all contemporary developed nations is that over the past couple of centuries, they have passed through three stages, i.e., demographic transition (Lee 2003). Conventionally, the study of population centres on the effects of it on economic growth; be it positive or negative. The main research question of this paper is to find out whether the population growth has promoted or obstructed economic development or growth in Bhutan. If not, what is the limit of population that the country (Bhutan) can expand? Here, the term, economic growth is confined to real GDP growth level (it is interchangeably using with material well-being) of the country, and the term “growth and development” will be used interchangeably throughout this paper. To answer these questions, with the help of secondary data collected from different national and international published sources, the paper simply analyses, with increase in population, the level of material well-being attained by the people of Bhutan. The paper studies neither the factors influencing the growth of population, nor the impacts of it on economic growth (positive or negative). It simply compares the level of growth rate of population and real GDP in the country. Based on the Malthusian and Dalton’s Optimum Population Theory, with the help of ten years dataset (from 2000 to 2010) of population and economic growth, the paper tries to identify the limit of growth of population of the country. Finally, to understand the impact of population growth on income in Bhutan, the paper uses simple regression analysis. 3.
LITERATURE REVIEW
Malthus (1798) basically focuses on the gloomy sides of population growth, and predicted for economic crisis, shortage of food supply in the country in the long run, if the growth of population is not controlled on time.
Does Population Growth Matter in Bhutan’s Economic Development?
157
Ehrlich and Ehrlich (2009) also rejuvenate the argument of Paul Ehrlich’s 1968 bestseller, The Population Bomb, and what he (Paul Ehrlich) predicted was that by 1985, the “population explosion” would lead to world famine, the death of the oceans, a reduction in life expectancy to 42 years. On the contrary, Lindsay’s (2005) study centres on whether population growth has a neutral or positive effect, but there clearly is no significant negative effect. Population grows as the resources permit or the society needs. To Simon (1987) and Liddle (2001), population growth is not inimical to economic development. How population grows, not just how much it grows, is important in determining its effect on development. In the words of Liddle (2001), “whether population growth is good or bad for a country’s sustained per capita income growth depends on that country’s human capital and technology levels”. Boserup (1981) opines that population density compelled societies to invent new technologies in order to increase food production. So, population growth has positive impact in the society. It enlarges labour force and, therefore, increases economic growth. A large population also provides a large domestic market for the economy. Moreover, population growth encourages competition, which induces technological advancements and innovations. The study by Furuoka (2009) in Malaysia, using Johansen co-integration test and the Error Correction Model (ECM), finds that there exist a long-run equilibrium relationship between the population growth and per capita Gross Domestic Product (GDP) growth. Jones (2003) also opines that endogenous growth in the scale of the economy through fertility leads to endogenous growth in per capita income. Growth of population becomes an asset of the countries, especially those who have invested more in human capital. However, slightly different from the above two schools (pessimist and optimist), Liddle (2001); Mitra and Nagarajan (2005); Bloom and Canning (2003); Liddle (2001); Fogel (1993); and others find that the relationship between population and development depends on three variables: population size, rates of change, and age structure. 4.
BACKGROUND OF THE STUDY
Literally, there are three important theories of population, which are of relevance to the present trends of population growth. They are: (1) The Malthusian Theory of maximum population; (2) The Optimum Population theory; and (3) The Demographic Transition theory. 4.1. Malthusian Theory of Maximum Population The first proposition of this theory is that if population is unchecked, increased in a faster geometric rate (i.e. 1, 2, 4, 8, 16…), whereas, the food supply grows at arithmetic rate (i.e. 1, 2, 4, 6, 8…). These two different growth rates lead to economic crisis, starvation, and social problem in the country. In his own words, Malthus (1798: 6) commented, “I said that population, when unchecked, increased in a geometrical ratio and subsistence for man in an arithmetical ratio”. As far as measures to control population is concerned; he propounded two methodsPreventive checks (reduce birth rate through different preventive measures) and Positive checks (Increase death rate by invisible hand).
158
Komol Singha Figure 1
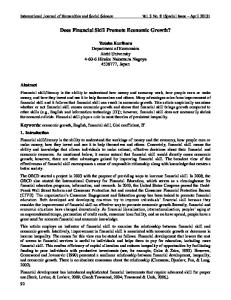
4.2. The Optimum Theory of Population This is the modern theory of population, propagated by modern economists such as Sidewide, Cannon, Dalton, and Robbins, etc. Dalton’s optimum population theory is adopted for the purpose of data analysis in this paper. Optimum population is that population which secures the maximum real income per head (Prasad 2004: 89). Dalton1 framed the following formula for judging the character of a country’s population. M= (A-O)/O [where M=Degree of Maladjustment (under/over population), A=Actual population, O= Optimum Population]. If M value is positive, it means the country is over populated. If M value is negative, the country is under-populated and if M=0, the country is in the optimum population. So, the optimum size of the population is not fixed. It depends upon the natural and economic resources and the state of technical knowledge (Shrivastava 2004). If new resources are developed, a county can support larger population. On the other hand, if some of the resources are exhausted, the existing population may become overpopulation. The change in the state of technical knowledge will also alter the optimum size2. The theory is further explained graphically. The size of population is plotted on X-axis and per capita output on Y-axis. On the horizontal axis, point A is the optimum limit of population. 5.
POPULATION OF BHUTAN3
A landlocked country located in South Asia, north of India and south of China, Bhutan has an area of 47,000 square kilometres (18,1467 square miles). Bhutan’s capital city, Thimpu, is centrally located towards the country’s western border with India. Bhutan shares a 605-kilometer (376-mile) border with India and a 470-kilometer (292-mile) border with China.
Does Population Growth Matter in Bhutan’s Economic Development?
159
Figure 2 Optimum Population (Dalton)
The total population of the country as in 2005 is only 6, 72,425 and out of which, 3, 7,443 are floating population (6, 72,425 - 37, 443 = 6, 34,982), so the real population of the country turns out to be only 6, 34,982 people. The population density is 16 people per sq. km in the same year (RGoB 2005: 17). Table 1 Growth Rate of Real GDP and Population of Bhutan (2000-2010) Year 2000 2001 2002 2003 2004 2005 2006 2007 2008 2009 2010
Annual Real GDP Growth Rate (%) 6.10 8.60 7.10 7.70 7.70 5.30 5.90 8.80 22.40 21.40 5.00
Annual Population Growth Rate (%) 2.65 2.56 2.43 2.35 2.26 2.17 2.08 1.99 1.91 1.82 1.27
Difference (%)(+/-) 3.45 6.04 4.67 5.35 5.44 3.13 3.82 6.81 20.49 19.58 3.73
Source: Computed from World Bank (W D I) 2010; NSB (2008); UN (2010); CIA World Fact Book (2010).
Quite differently, in 2000, the population of Bhutan was estimated at 20, 05,222 by the CIA World Fact book. The UN Statistical Yearbook gave the population as 1,034,774. But, the
160
Komol Singha
World Bank’s World Development Report 2000-01 estimated the population at 7, 82,000. This disparity between population estimates is caused by two different ways of counting people: the government of Bhutan’s population estimate, the World Bank figure, is based upon those who have “official” citizenship, and the CIA estimate seems to account for those who claim such status or live in the country and may not be recognised by the government. Uncertainty in population figures is also connected to Bhutan’s ongoing problem with the Lhotshampa people (Bhutanese of Nepalese origin), who have lost their citizenship or are simply not recognised due to a series of nationality-specific laws enacted in the 1980s. In 2000, the birth rate stood at 36.22 per 1,000, while the death rate was 14.32 per 1,000. The overall population density is very low at 12.5 people per square kilometre. Bhutan has a very young population with almost 50 per cent aged 17 years or younger. Given the continuation of Bhutan’s current annual population growth rate of 2.19 per cent, the United Nations Development Programme (UNDP) in Bhutan project projected that there will be 3.64 million people living in Bhutan by 2025, from a 1998 level of 1.91 million. Table 2 Average Annual Percentage Change in Real GDP for few Nations/Regions Country
1991-00
DC* DA** Africa USA Bhutan World
2.8 7.4 2.4 3.4 5.5 3.1
Source:
2001
2002
2003
2004
2005
2006
2007
2008
2009
2010
2014
1.4 5.8 4.9 1.1 6.8 2.3
1.7 6.9. 6.5 1.8 10.9 2.9
1.9 8.2 5.4 2.5 7.2 3.6
3.2 8.6 6.7 3.6 6.8 4.9
2.6 9.0 5.7 3.1 6.5 4.5
3.0 9.8 6.1 2.7 6.3 5.1
2.7 10.6 6.3 2.1 21.4 5.2
0.6 7.6 5.2 0.4 7.6 3.0
-3.4 6.2 1.7 -2.7 8.5 -1.1
1.3 7.3 4.0 1.5 5.3 3.1
2.4 8.5 5.3 2.4 6.8 4.5
* Developed Countries including USA, Canada, Japan, German, Italy, Switzerland, and UK etc. ** Developing Asian Countries including India and China. IMF WEO (2009).
Life expectancy at birth in Bhutan had increased significantly since the 1950s, when it stood at 36.3 years. By the early 1980s, life expectancy had reached 45.9 years. In 1989 the UN projected that life expectancy at birth in Bhutan would reach 55.5 years by 2005 and 61.8 years by 2025, still low compared with other South Asian countries and with the other least developed nations of the world. 6.
RESULTS AND ANALYSIS
Typically, a birth-rate4 of 10 to 20 per 1,000 is low, and a rate of 40 to 50 per 1,000 is high. In the absence of other information, a high birth-rate is assumed to be a general indication of health impairments and low life expectancy, low living standards, low status of women, and low levels of education. In the process of economic development and accompanying social change, the birth-rate and population growth rate decline as conditions improve, and potential parents choose to have fewer children. Accordingly, the birth-rate is anticipated to respond to development and to the provision of family planning services and is monitored as evidence of their achievement. CIA World Fact Book (2010) also shows that the birth rate of Bhutan in 2008 is 20.56 births per 1000 population only. The economic development of the country depends upon the size and quality of the labour force5.
Does Population Growth Matter in Bhutan’s Economic Development?
161
Figure 3 Annual Growth rate of Population and Real GDP of Bhutan (2000-10)
Generally, the low income nations are characterised by high population growth rate (Hayami and Godo 2005: 63). But, in the findings of Todaro and Smith (2006), in the poor nations, population growth is not an issue; it is only a type of politics deliberately created by the dominant rich nations to keep the poor nations under their control. And, the very idea of Malthus (mismatch between population and food supply) was rejected by Prasad (2004) and said, during his (Malthus) period the preventive measures were not widely adopted. Resource depletion or environmental degradation may not be the excuse of population growth. Todaro and Smith (2006) argued that the developed nations with less than one-quarter of the world’s population consume almost 80 per cent of the world’s resources. Moreover, the technology was very crude and the scientific measures of food production were missing. In the words of Prof. Cannon6: “There is a special relationship between the natural resources of a country and its population up to a point the production in the country goes on increasing with the increase in population. It attains a maximum point and then starts declining with further increase in population…....... Optimum population is that population, which, with the present level of technology, knowledge and resources, produces maximum production”.
It is clear from the Table 1 that the average annual population growth rate from 2000 to 2010 is 2.20 per cent and the annual real GDP growth rate in the same period is 9.83 per cent. It is the positive gap of 7.63 per cent. The growth rate of population in Bhutan was quite low, 2.65 and 2.56 per cent in 2000 and 2001 respectively. In 2009, the rate of growth of population dropped to 1.82 per cent and in 2010, further dropped to 1.27 per cent. On the other hand, the real GDP growth rate of the country was 6.10 and 8.60 per cent in 2000 and 2001 respectively. But, it rises drastically to 21.40 per cent in 2009. It is also clear that the growth rate of real GDP is much higher than the population; and the difference is visible in the last column of the table. As mentioned in Dalton’s Optimum Population Theory, the population growth or population explosion may be checked automatically if it is accompanied by rapid growth of material wellbeing (GDP in this paper) in the country. After reaching certain threshold level (optimum limit of population), it tends to decline. Similarly, Bhutan’s growth rate of real GDP is much higher
162
Komol Singha
than the growth rate of population (refer last column of Table 1). The country can still expand its population to accelerate its development level. As per the report of RGoB (2005), out of the total population of 6, 34,982, a total of 2, 56,895 labour forces are economically active, while 1, 68,128 are economically inactive. Of the active population (of urban), 95.3 per cent are employed7, while 4.7 per cent are unemployed. In case of rural, of the active population, 97.6 per cent are employed and only 2.4 per cent are unemployed (RGoB 2005: 300). In Bhutan, the annual population growth rate from 1970 to 1990 was 3.1 per cent and it was drastically dropped to 0.2 per cent from 1990 to 2000. A moderate growth rate was maintained at 2.5 from 2000 to 2008. Compared to some of the international statistics of population growth rate, the annual growth rate of population of Ireland was 2 per cent during the period from 2002 to 2006 (Meredith 2007). During this period, Bhutan, being a poor country maintained 2.25 per cent of population growth rate. According to Hayami and Godo (2005), during the period of 1980- 2000, the developing economies experience average annual population growth rate is approximately 2-3 per cent or even higher than 3 per cent for low income economies. This is not so in Bhutan. The Kingdom is much better (in respect to the growth of material well-being) than the other developing nations. On the other side of the analysis (economics front), Table 2 and Figure 3 show that the real GDP growth rate of the developed countries during 1991-2000 was 2.8 per cent and 3.1 per cent was recorded by the whole world. But, Bhutan was much ahead of them, i.e. 5.5 per cent. Even in 2010, the real GDP of developed nations was 1.3 per cent and 3.1 per cent by the whole world, but the Kingdom records highest at 5.3 per cent. To Hayami and Godo (2005), the acceleration in population growth in advanced economies was essentially an endogenous phenomenon influenced by economic growth. Further, they propounded that, this increased in population is basically to meet the ever increasing demand for labour of the newly established industries. As far as floating population is concerned; Bhutan has an emigration rate of 2.2 per cent and 5.7 per cent of immigrant of the total population (United Nations 210)8. The major continent of destination for migrants from Bhutan is Asia with 89.3 per cent of emigrants living there. Whereas, the United States of America is host to nearly 40 million international (United Nations 210), still, the nation is considered as one of the richest countries in the globe, and becomes the destination of millions of immigrants. So, the negligible difference of floating population in Bhutan may be added as positive effect on economic growth (as US welcomes skilled population). Table 3 Regression Analysis Population on Economic Growth in Bhutan (N=10) R R2 Adjusted R2 F Value Significant a. Predictors: (Constant), Population. b. Dependent Variable: Income.
.251 .063 -.041 .606 .456
Does Population Growth Matter in Bhutan’s Economic Development?
163
Table 3 explains the relationship between two variables of population and GDP growth rate. In the table, the growth of population is taken as independent variable and the real GDP is taken as dependent variable in 10 years from 2000 to 2010 (N = 10) in Bhutan. Since R2 value is .063, it is clear that the growth of population does not have much influence on the growth of Bhutan’s real GDP growth level. The p value (significance level is .456) also shows that the growth of population has insignificant relation with the country’s material well-being (real GDP growth rate). In short, both the variables function independently. 7.
CONCLUSION AND SUGGESTIONS
Population size of a community is determined by the level of their material well-being and the level of economic status desired by them (Singha 2007). Simon (1990); Eberstadt (1997); and others analyse that free market mechanism will always adjust to any scarcity created by population pressure. Richer sections of the people/urban dwellers have small family size whereas poor or rural dwellers have large number of children. It is perhaps due to either the rearing cost of baby is much lower in rural area or they may need more labour force. According to Todaro and Smith (2006), whether to have more children or not is determined by its opportunity cost. So, the growth of population in a transitional stage in any society is inevitable. It will be declining after certain level of population in which per person physical quality of life index starts dropping. Bhutan can raise its population as long as the country’s material well-being is positive and the level of education is given highest importance. Simon (1987) also finds that, had the level of education been developed, India and China could have been richest nations of the world long before. In the recent past, with the growth of education, both nations become one of the fastest growing economies in the world. Similar idea is also portrayed by Friedman (2006) in his book “The World is flat”, about how China could capture the American and European markets by their quality and value education. Since the growth of population is a socio-economic phenomenon, strict measures should be taken to improve the quality of existing population (Singha 2007). Planner and policy makers should emphasis more on economic development activities in Bhutan. Till today, the Kingdom has not faced the problem of over population. To this end, the country can expand its population till it reaches the rate at which the growth rate of material well-being grows. Notes 1. 2.
3. 4.
As quoted by Prasad (2004). See from [http://www.rajputbrotherhood.com/knowledge-hub/population-studies/what-is-theoptimum-theory-of-population-comparison-between-optimum-and-malthusian-theory.html accessed on 10/06/2010] This portion is heavily excerpted from: [http://www.nationsencyclopedia.com/economies/Asia-andthe-Pacific/Bhutan.html#ixzz0pNtp9aMD accessed on 10/06/2010] The number of births in a year per 1000 of total population is taken at the mid-year mark. This is the crude birth rate since it is not adjusted to take account, for example, of the proportion of the population which is of childbearing age. The crude birth rate may be expressed as: B/P × 1000; Where B = the number of births, and P = total population. A characteristic figure for a developed country might be 11/1000 per annum: 2002 figures for EU countries ranged from 9.2/1000 (Italy) to 12.1/1000 (Ireland). For a developing country figures of around 30/1000 per annum are not uncommon.
164
Komol Singha
5.
According to the RGoB (2005), total labour force is defined as the population of age 15 years and older.
6.
As Singha (2007) quoted.
7.
According to the RGoB (2005), worked at least one hour for payment in cash or kind is considered as employed.
8.
Bhutan was mentioned in the Report in page 80. Use this link http://hdrstats.undp.org/en/countries/ data_sheets/cty_ds_BTN.html to access the complete set of country data.
References Bloom, D. E. and David Canning (2003), Contraception and the Celtic Tiger. The Economic and Social Review, (winter). 34(3): 229-247. Birdsall, N., Allen C. Kelley and Steven W. Sinding (2001 eds.), Population Matters: Demographic Change, Economic Growth, and Poverty in the Developing World. New York: Oxford University Press. Boserup, E. (1981), Population and Technological Change-A Study of Long-term Trends. Chicago: University of Chicago Press. CIA World Fact Book (2010), The World Fact Book- South Asia-Bhutan. [Available at: https:// www.cia.gov/library/publications/the-world-factbook/geos/bt.html and retrieved on 06/06/2010] Ehrlich, Paul R. and Ehrlich, Anne H. (2009), The Population Bomb Revisited. The Electronic Journal of Sustainable Development, 1(3): 63-71 Eberstadt, Nicholas (1997), The Population Implosion. The Wall Street Journal, October 16, Editorial Page. Furuoka, F. (2009), Population Growth and Economic Development- New Empirical Evidence from Thailand. Economics Bulletin, 29 (1): 1-14. Friedman, Thomas L. (2006), The World is Flat: The Globalised World in the Twenty-first Century. London: Penguin Books. Fogel, R. W. (1993), Economic Growth, Population Theory, and Physiology- The Bearing of Long-term Processes on the Making of Economic Policy. Nobel Lecture on December 9 (1993), Chicago, IL. 60637, USA: University of Chicago, Centre for Population Economics. Hayami, Y. and Godo, Y. (2005), Development Economics-From the Poverty to the Wealth of Nations. New Delhi, Oxford University Press. Hirschman, C. (2004), Population and Development-What Do We Really Know? Paper Presented at the conference on ‘Development Challenges for the Twenty-First Century’ on 1-2 October, Ithaca (New York): Cornell University. IMF WEO (2009), World Economic Outlook [retrieved on 10/06/2010 and available at: http://www.imf.org/ external/pubs/ft/weo/2009/02/pdf/tables.pdf ] Jones, C. J. (2003), Population and Ideas- A Theory of Endogenous Growth. In Aghion, P.; Friedman, R.; Stiglitz, J.; and Woodford, M. (eds.), Knowledge, Information, and Expectations in Macro Economics (In honour of Edmund S. Phelps), Princeton, NJ: Princeton University Press. Kelley, Allen C. (2000), Population and Economic Development. Duke Economics Working Paper No. 00-05. Duke University- Department of Economics, [Available at SSRN: http://ssrn.com/ abstract=235743 or doi:10.2139/ssrn.235743 accessed on 16/06/2010]
Does Population Growth Matter in Bhutan’s Economic Development?
165
Kuznets, S. (1955), Economic Growth and Income Inequality. The American Economic Review. (March). 45(1): 1-28 Lindsay, Jeff (2005), Is Human Population Really the Problem. Accessed on 22/08/2010 and available at http://www.jefflindsay.com/Overpop.shtml Lee, R. (2003), The Demographic Transition: Three Centuries of Fundamental Change. Journal of Economic Perspectives, 17(4), 167-190. Liddle, B. (2001), The Population-Development Nexus: Insights from a Multi-country Simulation Model. Presented at 2nd Workshop on Population and the Environment: Modelling and Simulating this Complex Interaction, (May 18), Max Planck Institute for Demographic Research, Rostock, Germany. Mitra, S. and Nagarajan, R. (2005), Making Use of the Window of Demographic Opportunity-An Economic Perspective. Economic and Political Weekly, December 10, pp. 5327-32. Malthus, T. (1798), An Essay on the Principle of Population. St. Paul’s Church-Yard (London): J. Johnson National Statistics Bureau (2008), Statistical Yearbook of Bhutan, Thimphu: Royal Government of Bhutan. Prasad, B. K. (2004), Population and Family Life Education, New Delhi: Anmol Publications Pvt. Ltd. (Section 6. Page No. 88-97) RGoB (2005), Population and Housing Census of Bhutan. Thimphu: Office of the Census Commissioner (Royal Government of Bhutan). Singha, K. (2007), Highest Population Growth Rate- Is it an Issue? Southern Economist, 46 (6): 14-16. Shrivastava, O. S. (2004), Demography and Population Studies. Bhopal: Quality Publishing House. Simon, Julian L. (1990), Population Matters. New Brunswick (NJ): Transaction Publishers. ———(1987), Population Growth, Economic Growth and Foreign Aid. Cato Journal (Spring/summer) 7(1): 159-193. Todaro, M. P. and Smith, S. C. (2006), Economic Development. London: Pearson Education. United Nations (2010), Economic and Social Survey of Asia and Pacific. Thailand: United Nations Publication Centre. Verma, R.P. and Bhandari, A. (2010), Population Management and Economic Growth. Strategy 16, July 2010. Accessed on 24/08/2010 http://www.coolavenues.com/mba-journal/strategy/populationmanagement-and-economic-growth World Bank (2010), The World Development Indicators. Accessed on 22/08/2010 and available at http:/ /data.worldbank.org/