Does Corporate Governance Matter? Evidence from the Korean Market
BERNARD S. BLACK* Stanford Law School HASUNG JANG** Korea University Business School WOOCHAN KIM*** KDI School of Public Policy and Management Preliminary Draft: May 8, 2002 ABSTRACT In this paper, we show that corporate governance is an important factor explaining firm value and firm return in the Korean market. Such analysis is made possible by making use of an extensive survey data compiled by the Korea Stock Exchange in the first half of 2001, from which we construct a corporate governance index (0~100) for a cross-section of 540 companies. Evidence shows that a moderate improvement in corporate governance, say an increase of index by 10 units, on average, results in an increase of market capitalization by 3 percent of the company’s book asset value or 7 percent of the company’s book value of common equity. Also, evidence shows that an increase in corporate governance index by 10 units, on average, increases the level of buy-and-hold return by 4~6 percent over a year period.
Key words: corporate governance, firm valuation, and stock return JEL classification: G300
*
Professor of Law, Stanford Law School, Stanford, California U.S.A. 84305. Tel: (+1) 650-725-9845, fax (+1) 650-725-0684, e-mail:
[email protected]. ** Professor of Finance, Korea University Business School, Anam-Dong, Sungbuk-Ku, Seoul, Korea 136-701. Tel: (+82-2) 3290-1929, fax: (+82-2) 929-3405, e-mail:
[email protected] *** Professor of Finance, KDI School of Public Policy and Management, Chongyangri-Dong DongdaemunKu, Seoul, Korea 130-868. Tel: (+82-2) 3299-1030, fax: (+82-2) 968-5072, e-mail:
[email protected].
I.
Introduction
Since the aftermath of the financial crisis of 1997/98, Korean government has been aggressive in transplanting legal institutions that were deemed necessary to raise the corporate governance standard in Korea.
Outside directors became legally mandatory.
Audit and nomination committees were introduced. disclose consolidated statements.
Chaebol firms are now required to
Number of shares required to file derivative suits and
inspect financial books have been reduced dramatically.
The list goes on.
At least
during the few years immediately after the crisis, even the business community acknowledged that corporate governance reform is an imperative to overcome the crisis. With the economic recovery, however, complacency started to creep in.
Business
managers started to focus on the immediate costs of adapting to the new institutions, but began to ignore their long-term benefits.
They even started to lobby the government so
that it reverse the hard-won reform measures.
Regulations imposed for the sake of better
governance are now portrayed as regulations choking freedom and creativity.
Skeptics
started to question the link between corporate governance and firm performance. Against this backdrop, in this paper, we document that corporate governance is indeed an important factor explaining the variation of firm value and firm return in Korea. We make use of an extensive survey data set complied by the Korea Stock Exchange (KSE) in the first half of 2001, from which we construct a corporate governance index (0~100) for a cross-section of 540 listed companies.
Evidence shows that a moderate improvement in
corporate governance, say an increase of the index by 10 units, increases market capitalization by 3 percent of the company’s book asset value or 7 percent of the company’s book value of common equity.
Also, evidence shows that an increase in
corporate governance index by 10 units, on average, increases the level of buy-and-hold return by 4~6 percent over a year period. Most of the empirical literature studying the link between corporate governance and firm performance concentrate on a particular aspect of governance, such as board, shareholders’ activism, compensation, anti-takeover provisions, investor protection, and so on.
To name a few, Millstein and MacAvoy (1998) and Bhagat and Black (1999)
investigate the relationship between board characteristics and firm performance. Karpoff, Malatesta, and Walking (1996) and Carleton, Nelson, and Weisbach (1998) link firm performance with shareholders’ activism.
1
Bhagat, Carey, and Elson (1999) look at
the relationship between outside directors’ pay and firm performance.
Sundaramurthy,
Mahoney, and Mahoney (1997) links firm performance with anti-takeover provisions and LLSV (2002) analyses the relationship between investor protection and firm performance. In the corporate governance literature, this paper can be uniquely placed as one of the few papers that try to construct an overall corporate governance index that comprises a comprehensive set of variables.1 industry.
Recently, such attempts are popular in the financial
In 2001, Credit Lyonnaise Securities Asia (CLSA) and Standard & Poor’s both
published a report ranking individual companies according to their level of corporate governance.
They, however, did not show any rigorous analysis on the relationship
between corporate governance and firm value. This paper is organized as follows.
We first describe the data in Section II and
explain how we constructed our corporate governance index in Section III. report our results in Section IV and Section V.
II.
Then, we
In Section VI, we conclude.
Data
A. Data on Corporate Governance This paper makes use of a survey data provided by the Korea Stock Exchange (KSE).
In
March 2001, KSE sent out an extensive survey of corporate governance practices and attitudes to the disclosure officers of all listed companies.2 The survey was completed between March and July 2001.
Given the nature of the institution that conducted the
survey, the response rate was very high.3 Among the 699 listed companies in the KSE during the survey period, 139 companies on the watch list for possible de-listing were not surveyed.
Also, 20 companies that were
surveyed, but did not respond to any of the survey questions, were also dropped.
This
left us with 540 companies that can be used for analyses. The survey questions were grouped into five categories: (i) shareholders’ right, (ii)
1 Gompers, Ishii, and Metrick (2001) combine anti-takeover provisions and shareholder rights to construct a corporate governance index. Black (2001) constructs corporate governance risk. 2 The original intension of this survey was to award companies that stand out in terms of their corporate governance. The English version of the survey can be provided on request by the authors. 3 540 companies responded out of the 560 companies that were surveyed.
2
board of directors in general, (iii) outside directors, (iv) auditing, and (v) other stakeholders.
Some questions were objective, asking about the company’s practices.
Others were more subjective, asking about the company’s attitudes or plans. The survey contains 113 questions, some with several parts. questions, we extracted 123 variables.
In constructing the corporate governance index,
however, we made use of only 42 variables.
B.
From the survey
See Section III for the details.
Financial and Stock Market Data
Balance sheet and income statement data used in this paper is from a database called TS2000, which is provided by the Korea Listed Companies Association (KLCA).
Stock
market data, on the other hand, is obtained from a database complied by the Korea Stock Exchange (KSE).
The lists of top-30 Chaebol companies are from various press releases
from the Korean Fair Trade Commission (KFTC).
III.
Construction of Corporate Governance Index
A. Construction of the Index We extract 123 variables from the survey questions. reasons.
Of these, we exclude 81 for various
First, we exclude all those variables asking for management view.
Among the
variables that ask for facts, we exclude those that are not relevant to corporate governance, ambiguous as to which answer indicates better governance, had minimal variation between firms, or had very few responses.
Such exclusion rule left us with 42 variables.
The 42 variables are categorized into four groups: (i) shareholder rights, (ii) board of directors in general, (iii) outside directors, and (iv) disclosure and transparency.4
From
each group, sub-indices are constructed, each having an equal weight and standardized to 4
The KSE survey is composed of questions in five categories: (i) shareholders, (ii) directors & board, (iii) outside directors, (iv) auditing, and (v) other stakeholders. The questions on “auditing” cover both auditing as such, and disclosure practices in general. Thus, “disclosure and transparency” is a more descriptive term. The questions on “other stakeholders” are in fact a miscellaneous set of questions, some relating to stakeholders, but others relating to other survey categories. We reassigned the corporate governance related questions in this category to one of the other four categories, as appropriate. We also reassigned other selected questions, where this seemed appropriate. 3
have a value between 0 and 25. 5
Thus, the overall corporate governance index is
constructed to have a value between 0 and 100.
The index is constructed so that better
governed firms have higher index. Each variable in the sub-index is designed to have a value between 0 and 1.
To
obtain a sub-index, first, we compute a simple sum over the variables, and second, divide by the number of ‘non-missing’ variables.6
We then multiply this ratio by 25, so that the
resulting figure takes a value between 0 and 25.
The overall indices and sub-indices are
constructed before running any of the statistical tests described in the following sections. Table 1 describes the variables used in constructing the indices.
B.
Description of the Index
Figure 1 shows the histogram of the overall corporate governance index. A normal distribution curve is superimposed.
By comparing the histogram and the normal
distribution curve, one can easily see that the distribution of corporate governance index is slightly skewed to the right (long tails to the right). 7
That is, many companies
concentrated below the mean and few companies located at very high scores. shows that the mean is 29.3, the minimum is 0, and the maximum is
IV.
Table 2
77.5.8
Corporate Governance and Firm Value
We first test if companies with higher corporate governance index have greater firm value. Here, we use two measures of firm value: Tobin’s Q and market-to-book ratio.
In our
analyses, Tobin’s Q is computed by book value of debt plus market value of equity over book value of asset.9
That is, [book value of debt + market value of equity] / [book value
of asset]. Market-to-book ratio is computed by market value of common equity over 5
As an alternative method, we can combine ‘board of directors in general’ and ‘outside directors’ so that we have only three groups, each with equal weight and standardized to have a value between 0 and 33.3. This alternative method puts less weight on board matters relative to others such as shareholders’ rights or disclosure & transparency. Sensitivity analyses, which are not reported here, show that the results reported in this paper do not change in a material way by using this alternative weighting scheme. 6 Since we are computing a ratio, we do not have to worry directly about missing values. 7 Skewness is computed to be 0.5890. The median is 28.0202. 8 Please not that KSE requested that we do not disclose the names of the companies. 9 We do not have a measure for the market value of debt. 4
book value of common equity. In principle, all book values are measured at the end of year 2000.
If fiscal year does
not end in December, they are measured during a period between July 2000 and June 2001. If multiple figures exist during this period, the most recent figure is chosen.
Market
value of equity, on the other hand, is measured as of June 29, 2001, which is closer to the survey period (March ~ July, 2001).
B.
Table 2 describes the details of each variable.
Difference-in-Mean Test
540 companies in our sample are categorized into five groups according to their corporate governance scores and, for each quintile, averages of Tobin’s Q and market-to-book ratio are computed.10
Before computing the averages, outliers are identified by computing
studentized residuals and dropped from the sample.
That is, as for Tobin’s Q, a
regression of Tobin’s Q on corporate governance index is estimated and studentized residuals are obtained from the estimated regression equation.
Observations are
considered as outliers if such studentized residuals are greater than 1.96 or smaller than 1.96.
This resulted in 24 outliers.11
market-to-book
Using the same method, we found 16 outliers as for
ratio.12
Table 4 shows the results.
The third column shows that Tobin’s Qs are not
increasing monotonically with corporate governance scores.
However, when the first
(low corporate governance score) and the fifth (high corporate governance score) quintiles are compared, the difference is 0.1017 and statistically significant at 1% level.
That is,
when corporate governance improves from the level of bottom quintile companies to the level of top quintile companies, Tobin’s Q increases by 0.1017%.
More intuitively put,
market value of equity will increase by 10.17% of the company’s book value of asset. As for market-to-book ratio, the difference between the first and the fifth quintile is not statistically significant. 13
This result, however, is overturned in the follow sub-
section, where we run regressions.
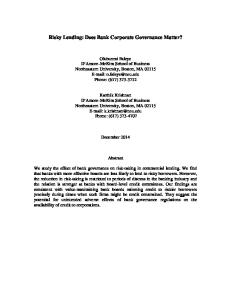
Figure 2 and 3 show scatter plots between corporate
governance index and measures of firm value.
The fitted lines are clearly upward
10
We compute equal-weighted averages. This coincided with the 24 largest figures. 12 This coincided with 6 smallest figures and 10 largest figures. negative market-to-book ratios. 13 The p-value is 0.2. 11
5
The bottom 6 figures include all the
sloping.
C. Regression Analyses In Table 5, Tobin’s Q and market-to-book ratio are regressed on corporate governance index.
Equations (1), (2), and (3) regress Tobin’s Q, while equations (4), (5), and (6)
regress market-to-book ratio.
As for the Tobin’s Q equation, following Shin and Stulz
(2000) and Gompers, Ishii, and Metrick (2001), we use the log of book value of assets, the log of years of listing, and industry dummy variables, as the basic controlling variables. We use the 2-digit KSIC to capture industry effects.
Sales growth is additionally
included in the equation to capture growth opportunities.
As for the market-to-book
ratio equation, the log of book value of debt is included as an additional variable. Detailed description of each variable can be found in Table 2. The result shows that the coefficients on corporate governance are statistically significant and economically meaningful.
In the Tobin’s Q equations, the coefficients are
around 0.003 and statistically significant at 1% level.
The coefficient of 0.003 implies that
an increase in corporate governance index by 10 units (e.g. improvement of corporate governance index by 10 units) results in an increase of market capitalization by 3% of the company’s book asset value. 100.
Notice that corporate governance index ranges from 0 to
Sales growth turned out to be insignificant in equation (4). When market-to-book ratio is regressed, the coefficient is 0.0067 and statistically
significant at 1% level as can be seen in equation (8), where we included all the control variables.
The coefficient of 0.0067 implies that an increase in corporate governance
index by 10 units (e.g. improvement of corporate governance index by 10 units) results in an increase of market capitalization by 6.7% of the company’s book value of common equity.
Sales growth turned out to be significant, but the log of book value of debt
turned out to be insignificant.
D. Regression on Different Sub-samples The governance structure of Korean firms is in large part determined by law and because of the way the laws are written, the governance structure is heavily influenced by the following three factors: book asset value, affiliation to banking industry, and affiliation to
6
chaebol.
For example, the Securities & Exchange Act sets the minimum ratio and number of
outside directors, requires the establishment of audit and nomination committees, and sets the minimum ratio of outside directors in the audit committee. Such minimum ratios and requirements, however, vary according to the company’s book asset value.
That is, listed companies with book value of asset greater than KRW 2
trillion must have at least three outside directors and the ratio of outside directors must be at least one half.
Those below the KRW 2 trillion threshold need only to have one
quarter of their directors from outside.
Also, listed companies with book value of asset
greater than KRW 2 trillion must establish audit and nomination committees, while those below the KRW 2 trillion threshold do not have to.
When the audit committee is
required, two third of the members must be filled with outside directors and the chairperson must come from outside.
All these suggest that the book value of asset is a
very important determinant of corporate governance in Korea.14 In Korea, the Banking Act shapes the governance structure of banks differently from others.
That is, most of the requirements in the Securities & Exchange Act that is applied
to companies with book asset value greater than KRW 2 trillion are applied to commercial banks and merchant banks, regardless of their size.
Thus, one can easily see that
affiliation to banking industry is another important factor determining corporate governance in Korea.15 In Korea, the Monopoly Regulation and Fair Trade Act shapes the governance structure of chaebol-affiliated firms differently from others.
That is, for companies affiliated to the
30 largest chaebols, the Act requires board approval for related-party transactions if transaction size is greater than 10% of equity capital or KRW 10 billion.
Such
requirement was not in effect for non-chaebol firms at the time the survey was conducted.16 Thus, affiliation to chaebol can be considered as another factor influencing the level of corporate governance in Korea.17 14
The correlation coefficient between corporate governance index and asset size dummy (=1 if greater than KRW 2 trillion) in our sample is 0.5501 and statistically different from zero at 1% significance level. 15 The correlation coefficient between corporate governance index and banking dummy (=1 if a commercial bank or a merchant bank) in our sample is 0.3881 and statistically different from zero at 1% significance level. 16 With the amendment of the Securities & Exchange Act in March 28, 2001, all listed companies with book asset value greater than KRW 2 trillion must obtain board approval for related party transactions if the size is greater than 1% of book asset value or 1% of total sales. Such amendment, however, was not in effect at the time when the survey was conducted. 17 The correlation coefficient between corporate governance index and chaebol dummy (=1 if affiliated to a chaebol) in our sample is 0.2354 and statistically different from zero at 1% significance level. 7
If such factors are not controlled for, one may have a biased result.
That is, if
corporate governance index and firm value measure are both positively influenced by asset size, one may see a positive relationship between corporate governance index and firm value even when there is no direct link between the two. As a way of controlling for such factors, in this sub-section, we run the same set of regression equations used in Table 5 on the following six sub-samples: banks (commercial and merchant), non-banks, firms affiliated to chaebol, firms not affiliated to chaebols, firms with book asset value greater than KRW 2 trillion, and firms with book asset value below KRW 2 trillion.18 Panel A and B of Table 6 show the results.
Panel A reports the results for Tobin’s Q
and Panel B reports the results for market-to-book ratio. Equation (1) and (5) in each of the Panels show that corporate governance does not have much power explaining variations within banks or within firms with book asset value greater than KRW 2 trillion. Other equations, however, show that corporate governance is still an important factor explaining the variation of firm value. In fact, equations (3) and (4) in both of the Panels show that the explanatory power of corporate governance is particularly high when applied to the chaebol sub-sample.
When
explaining Tobin’s Q, the coefficient on corporate governance index is 0.0042 when applied to the chaebol sub-sample, while it is only 0.0027 when applied to the non-chaebol sub-sample.
When explaining market-to-book ratio, the coefficient on corporate
governance index is 0.0140 when applied to the chaebol sub-sample, while it is only 0.0047 when applied to the non-chaebol sub-sample.
V.
Corporate Governance and Return
A. Difference-in-Mean-Test If the quality of corporate governance does not get fully reflected into price, but gets incorporated only gradually over time, one may find a positive relationship between the
18
We also ran a regression with intercept dummy variables representing asset size, affiliation to banking industry, and affiliation to chaebol. The coefficient on corporate governance index turned out to be still significant with a similar magnitude. 8
level of corporate governance and return.
To verify this in the Korean market, we again
categorized firms into five groups according to their corporate governance index scores and for each quintile, computed equal-weighted average returns.
To this end, buy-and-
hold returns are computed for each company over a year period from December 26, 2000 to December 28, 2001.
Stock-splits and stock-mergers are adjusted.
Table 7 shows the details.
Column (1) shows gross returns and columns (2), (3), (4),
and (5) show different measures of excess returns.
In column (2), excess return is defined
as gross return minus market return (e.g. KOSPI return).
In column (3), excess return is
defined as gross return minus required rate of return from the market model.19
In
column (4), excess return is defined as gross return minus required rate of return from Lastly, in column (5), excess return is defined as gross return minus average
CAPM.20
return of firms in the same size category. Before computing the averages, however, 34 observations are dropped from the sample.
Among the 34 observations, 23 are dropped as outliers.
Observations are
considered as outliers if a studentized residual obtained from a regression of gross return on corporate governance index is greater than 1.96 or smaller than –1.96. identified the 23 highest figures as outliers.
Such method
In addition, 11 firms that did not exist over
the entire sample period - year 2001 - are also dropped from the sample. Table 7 shows the results.
The overall picture is that average returns do not vary
much within the bottom four quintiles, but increase significantly when it comes to the top quintile (e.g. firms with high corporate governance index scores).
When the top quintile
and the rest are compared, the difference ranges from 13.8% to 28.8%.
The difference is
also statistically significant at the 1% level regardless of the way excess returns are measured. return.
B.
Figure 4 shows the scatter plot between corporate governance index and firm
The fitted line is clearly upward sloping.
Regression Analyses
Excess returns reported in Table 7 are regressed on the corporate governance index and
19 Intercept and beta estimates are obtained from fnGuide, a commercial vender of financial data in Korea. According to fnGuide, coefficients are estimated at a monthly frequency over a 36-month period from April 1999 to April 2001. 20 KOSPI return of 37.47% and risk-free rate of 5.88% is used to compute required rate of return. Average commercial bank deposit rate is used as a proxy for risk-free rate.
9
on other control variables.
Following Brennan, Chordia, and Subrahmanyam (1998) and
Gompers, Ishii, and Metrick (2001), we control for the log of size, market-to-book ratio, past return, the log of per share price, the log of trading volume, dividend yield, past sales growth, and industry dummies.
We use the 2-digit KSIC to capture industry effects.
Detailed description of each variable can be found in Table 2. In Table 8, we report two sets of analyses.
In Panel A, regression equations are
estimated without market-to-book ratio in the right-hand side of the equation. we include market-to-book ratio.
In Panel B,
The results show that the coefficient on corporate
governance index is materially large and statistically significant at either a 5 or a 10% level. In Panel A (without market-to-book ratio), the coefficients are between 0.5166 and 0.5799 and statistically significant at 5% level regardless of the way excess returns are measured. Intuitively put, it means that whenever corporate governance index score increases by 10 unites (e.g. corporate governance improves by 10 unites), excess return increases by 5.166~5.799% over a year period. Results in Panel B (without market-to-book ratio) basically tells the same story, except that the coefficient magnitudes are slightly smaller.
The coefficients are between 0.4016
and 0.5420 and statistically significant either at a 5 or a 10% level regardless of the way excess return is measured.
More intuitively put, it means that whenever corporate
governance index score increases by 10 unites (e.g. corporate governance improves by 10 unites), excess return increases by 4.016~5.420% over a year period.
C. Regression on Different Sub-samples As stated in Section IV, asset size, affiliation to banking industry, and affiliation to chaebol, are important factors shaping the governance structure of Korean firms.
As such, in this
section, we control for such factors by running regressions on the following six subsamples: banks (commercial and merchant), non-banks, firms affiliated to chaebol, firms not affiliated to chaebols, firms with book asset value greater than KRW 2 trillion, and firms with book asset value below KRW 2 trillion.21 Table 9 shows the results.
Notice that we do not use all the control variables that
21
We also ran a regression with intercept dummy variables representing asset size, affiliation to banking industry, and affiliation to chaebol. The coefficient on corporate governance index turned out to be still significant with a similar magnitude. 10
appear in Table 8.
The log of size, market-to-book ratio, the log of trading volume,
dividend yield, and past sales growth are dropped from the equation. coefficients on such variables are individually insignificant.
In Table 8, the
Wald-test also shows that
the variables are jointly insignificant, which justifies their omission.
In Table 9, we only
use one measure of excess return, which is defined by gross return minus KOSPI return.22 Equations (2), (4), and (6) in Table 9 show that corporate governance is still an important factor in explaining the variation of excess returns when the samples are restricted to non-banks, non-chaebols, or firms with book asset value below KRW 2 trillion. In case of the bank sub-sample, the coefficient increases dramatically.
But, given the
small sample size (N = 13), the coefficient does not deserve any series interpretation.
In
case of the chaebol sub-sample, the coefficient is nearly zero and statistically insignificant. This result is in contrast to the one reported in Table 6, which basically says that the explanatory power of corporate governance is greater among chaebol-affiliated firms than among non-chaebol-affiliated firms.
The two results, however, can be compatible.
That
is, if corporate governance gets incorporated into price quickly for chaebol-affiliated firms, the level of corporate governance would not have any influence on ex-post buy-and-hold returns.
VI.
Conclusion
In this paper, we document that corporate governance is an important factor explaining firm value and firm return in the Korean market.
Such analysis is made possible by
making use of a survey data collected by the Korea Stock Exchange in the first half of 2001, from which we construct a corporate governance index (0~100) for a cross-section of 540 companies. Evidence shows that firms with better governance have higher Tobin’s Q or higher market-to-book ratio. More specifically, an increase in corporate governance index by 10 units results into an increase of Tobin’s Q by 0.003 or market-to-book ratio by 0.007.23 This implies that an improvement of corporate governance by 10 units increases market capitalization by 3 percent of the company’s book asset value or 7 percent of the
22 23
We tried other measures of excess return, but no material difference was found. Corporate governance index ranges from 0 to 100. 11
company’s book value of common equity.
Empirical analysis also shows that the
explanatory power of corporate governance is particularly high when explaining the variation of firm value of chaebol-affiliated firms. This paper also documents that firms with better governance experience higher excess return.
More specifically, an increase in corporate governance index by 10 units
increases the level of excess return by 4-6 percent over a year period.
This is so
regardless of the way excess returns are measured. This study has two important implications. First, our empirical finding helps to clear the skepticism on the link between corporate governance and firm performance in the Korean market.
Thus, bolstering the rationale behind the reform measures that took
place since the financial crisis in 1997/98.
Second, our empirical finding justifies the
existence of corporate governance funds that reap capital gain by influencing the firms they invest to adopt better governance structure. In the corporate governance literature, this paper can be uniquely placed as one of the few papers that try to construct an overall corporate governance index when studying the link between governance and firm performance.
Most of the empirical literature in this
area have been concentrating on a particular aspect of governance, such as board, shareholders’ activism, compensation, anti-takeover provisions, investor protection, and so on. Nonetheless, this study has a few limitations.
First, firm performance and corporate
governance might be simultaneously determined.
This calls for estimating a
simultaneous equation system, which we were not able to do in this version.
Second,
variables used in constructing the corporate governance index can be weighed in many different ways and the decision can be fairly subjective. analyses in a more extensive way. noisy in nature.
We may need to do sensitivity
Third, our analysis is based on a survey data, which is
Although, we make use of only those variables that are least subject to
measurement error, the results should be interpreted with some caution.
12
REFERENCES Bhagat, Sanjai and Bernard Black (1999), “Uncertain Relationship Between Board Composition and Firm Performance, “ Business Lawyer Vol. 54 No.3 Bhagat, Sanjai, Dennis Carey, and Charles Elson (1999), “Director Ownership, Corporate Performance, and Management Turnover,” Business Lawyer Vol.54 No.3 Black, Bernard (2001), “Does Corporate Governance Matter? A Crude Test Using Russian Data,” University of Pennsylvania Law Review Vol.149, pp.2131-2150 Brennan, Michael, Tarun Chrodia, and Avanidhar Subrahmanyam (1998), “Alternative Factor Specifications, Security Characteristics, and the Cross-Section of Expected Stock Returns,” Journal of Financial Economics Vol.49, pp 345-375 Carleton, Willard, James Nelson, and Michaels Weisbach (1998), “The Influence of Institutions on Corporate Governance through Private Negotiations: Evidence from TIAA-CREF,” The Journal of Finance Vol.53 No.4 pp 1335-1362 Credit Lyonnais Securities Asia (2001), CG Watch: Corporate Governance in Emerging Markets, April Gompers, Paul, Joy Ishii, and Andrew Metrick (2001), “Corporate Governance and Equity Prices,” NBER Working Paper 8449 Karpoff, Jonathan, Paul Malatesta, and Ralph Walkling (1996), “Corporate Governance and Shareholder Initiatives: Empirical Evidence,” Journal of Financial Economics, Vol. 42 pp 365-395 La Porta, Rafael, Florencio Lopez de-Silanes, Andrei Shleifer, and Robert Vishny (2002), “Investor Protection and Corporate Valuation,” Journal of Finance (forthcoming) Millstein, Ira and Paul MacAvoy (1998), “Active Board of Directors and Performance of the Large Publicly Traded Corporation,” Columbia Law Review, 98 Shin, Hyun-Han and Rene Stulz (2000), “Firm Value, Risk, and Growth Opportunities,” NBER Working Paper 7808 Sundaramurthy, Chamu, James Mahoney, and Joseph Mahoney, “Board Structure, Anti-takeover Provisions, and Stockholder Wealth,” Strategic Management Journal Vol.18:3
13
Figure 1. Distribution of Corporate Governance Index
.08
Fraction
.06
.04
.02
0 20
0
40 (mean) cg
60
80
Figure 2. Corporate Governance and Tobin’s Q tq
Fitted values
tq
1.46064
.317134 0
77.5 (mean) cg
14
Figure 3. Corporate Governance and Market-to-Book Ratio
mbr2
Fitted values
mbr2
3.41399
.06368 77.5
0 (mean) cg
Figure 4. Corporate Governance and Return
return
Fitted values
return
208.824
-85.6774 75.2827
0 (mean) cg
15
Table 1.
Corporate Governance Index
A. Shareholder Rights Sub-index Variable Summary of the Variable
Sample Size 540
Number of “1” Responses 34
Mean
A.1
Adopts cumulative voting for electing directors
A.2
Permits voting by mail
540
71
0.13
A.3
Shareholder meeting date or location set to encourage attendance Director candidates disclosed before shareholder meeting Board approval required for related party transactions
508
89
0.18
540
96
0.18
540
181
0.34
Sample Size 482
Number of “1” Responses 330
498
30
0.06
540
223
0.41
B.4
Directors’ positions on board meeting agenda recorded in minutes CEO and board chairman are different people
540
25
0.05
B.5
System for evaluating directors exists
540
36
0.07
B.6
By-law to govern board meetings exists
540
381
0.71
B.7
Number of regular board meetings no less than four times a year
356
260
0.73
Sample Size 527
Number of “1” Responses N/A
A.4 A.5
B. Board of Directors Sub-index Variable Summary of the Variable B.1 B.2 B.3
Directors’ average attendance rate is greater than 75% Disapproved item exists at board meeting
C. Outside Directors Sub-index Variable Summary of the Variable
0.06
Mean 0.68
Mean
C.1
Ratio of outside directors
C.2
Firm has foreign outside directors
540
37
0.07
C.3
Outside director nominating committee exists
540
75
0.14
16
0.33
C.4
Outside directors do not receive retirement pay
320
281
0.88
C.5
Outside directors can get advice from outside experts at the company’s expense System of evaluating outside directors exists or planning to have one Outside directors’ pay in aggregate determined separately at shareholders’ meeting Outside directors’ average attendance rate is greater than 75% Bard meeting item opposed by outside director exists Outside directors made suggestions on management issues Provide information beyond board meeting items
320
77
0.24
509
155
0.30
482
48
0.10
465
197
0.42
540
41
0.08
540
54
0.10
495
383
0.77
One-week prior notice of agenda to outside directors Do not hesitate to provide confidential information to outside directors Code of conduct for outside directors exits
471
235
0.50
501
251
0.50
540
43
0.08
Designate contact person to support outside directors A meeting composed exclusively of outside directors exists
540
274
0.51
540
24
0.04
Sample Size 540
Number of “1” Responses 21
C.6 C.7 C.8 C.9 C.10 C.11 C.12 C.13 C.14 C.15 C.16
D. Disclosure & Transparency Sub-index Variable Summary of the Variable
Mean
D.1
Conducted IR activity in year 2000
D.2
540
47
0.09
D.3
Resume of board members found in company website Audit committee exists
518
95
0.18
D.4
Ratio of outside directors in the audit committee
103
N/A
0.77
D.5
By-laws governing audit committee (or auditor) exits Accounting experts in the audit committee
489
321
0.66
324
163
0.50
Audit committee (or auditor) recommends external auditor at AGM
495
369
0.75
D.6 D.7
17
0.04
D.8 D.9 D.10 D.11 D.12 D.13 D.14
Each audit committee member’s (or auditor’s) pay determined separately at the AGM Audit committee (or auditor) approves the appointment of internal audit head Minutes written for each audit committee (auditor) meeting Report audit committee’s (or auditor’s) activities at the AGM Rejected item exits at the audit committee meeting Audit committee members’ average attendance rate is greater than 75% English disclosure exists
18
474
72
0.15
404
192
0.48
267
164
0.61
473
422
0.90
101
4
0.04
99
93
0.94
498
24
0.05
Table 2. Variables Tobin’s Q
Market-to-Book Ratio Book Value of Debt
Book Value of Asset
Book Value of Equity
Market Value of Equity
Years of Listing Sales Growth
Asset Size Dummy Bank Dummy Chaebol Dummy Size Past Return
Price Trading Volume Dividend Yield
Other Variables
Descriptions Book value of debt plus market value of equity over book value of asset. That is, [book value of debt + market value of equity]/book value of asset. Here market value of equity includes common stocks and preferred stocks. Market value of common equity over book value common equity Total liability as of December 26, 2000 in billion KRW. If fiscal year does not end at the end of December, the liability available during a period between July 2000 and June 2001. If there are multiple figures during the period, the most recent figure is chosen [Source: Korea Listed Companies Association]. Asset value as of December 26, 2000 in billion KRW. If fiscal year does not end at the end of December, the asset value available during a period between July 2000 and June 2001. If there are multiple figures during the period, the most recent figure is chosen [Source: Korea Listed Companies Association]. Book value of asset subtracted by book value of debt and book value of preferred stocks. That is [book value of asset – book value of debt – book value of preferred stocks]. Book value of preferred stocks are in billion KRW and obtained as of December 26, 2000. Market capitalization of common equity as of June 29, 2001 in billion KRW. If a company is de-listed before June 29, 2001, the most recent figure is chosen [Source: Korea Stock Exchange]. Number of years since listing [Source: Korea Listed Companies Association]. Average growth rate of sales during the past five years in ratios. That is, between fiscal year 1996 and fiscal year 2000. If sales figures are available over less than five years, the average growth rate during that sub-period [Source: Korea Listed Companies Association]. 1 if book value asset is greater than KRW 2 trillion; 0 otherwise 1 if the firm is either a commercial bank or a merchant bank; 0 otherwise 1 if affiliated to top-30 Chaebols during a period between April 2000 and April 2001; 0 otherwise [Source: Fair Trade Commission, press releases]. Market capitalization of common equity as of December 26, 2000 in Million KRW [Source: Korea Stock Exchange]. Percentage return on common shares between December 26, 2000 and December 28, 2001 adjusted for stock-splits and stock-mergers [Source: Korea Stock Exchange]. Closing common share price as of January 2, 2001 [Source: Korea Stock Exchange]. Trading volume in KRW as of January 2, 2001 [Source: Korea Stock Exchange]. Dividend yield in percentage as of January 2, 2001 [Source: Korea Stock Exchange].
19
Table 3.
Descriptive Statistics
A. Corporate Governance Index
Shareholders’ Right Board of Directors Outside Directors Disclosure & Transparency Overall Index
No. of Obs 540 540 540 540 540
Mean 4.377 8.555 7.462 8.918 29.312
Stand. Dev. 4.614 4.819 3.658 4.629 13.007
Min 0.000 0.000 0.000 0.000 0.000
Max 20.000 21.429 20.000 20.313 77.500
Min 0.317 -7.554 1 10 -121 2 0.0 -0.295 0 0 0 1560 -94.795 445 0 0.000
Max 3.040 21.611 77265 81522 31835 29038 45.0 5.852 1 1 1 23900000 467.963 329500 1.30E+11 59.520
B. Other Variables
Tobin’s Q Market-to-Book Ratio Book Value of Debt Book Value of Asset Book Value of Equity Market Value of Equity Years of Listing Sales Growth Asset Size Dummy Bank Dummy Chaebol Dummy Size Past Return Price Trading Volume Dividend Yield
No. of Obs 539 538 539 539 539 539 540 517 540 540 540 535 535 540 535 540
Mean 0.854 0.788 1480 1923 439 357 15.8 0.144 0.133 0.206 0.031 304380 -32.626 13242 2.13E+09 3.633
20
Stand. Dev. 0.285 1.636 6725 7617 1791 1861 9.5 0.311 0.340 0.404 0.175 1861266 45.557 26521 8.61E+09 5.753
B. Correlation Matrix of Selected Variables ** indicates significant at 5% level CG Index Tobin’s Q (in ratio) CG Index 1.0000 Tobin’s Q (in ratio) M/B (in ratio) Debt (in logs) Asset (in logs) Years of listing Sales Growth (%) Asset Size Dummy Bank Dummy Chaebol Dummy
M/B (in ratio)
Debt (in logs)
Asset (in logs)
Years of listing
Sales Growth (%)
Asset Size Dummy
Bank Dummy
0.1489**
1.0000
0.0240
0.5208**
1.0000
0.4223**
0.0916**
-0.0337
1.0000
0.4405**
0.0996**
-0.0514
0.9762**
1.0000
0.1007**
-0.1384**
-0.0373
0.0943**
0.0908**
1.0000
0.1064**
0.1020**
0.0705
0.0755
0.0730
-0.0680
1.0000
0.5501**
0.1603**
-0.0162
0.4889**
0.5341**
0.1139**
0.0708
1.0000
0.3881**
0.0886**
0.0089
0.7036**
0.6397**
0.1540**
0.0487
0.3973**
1.0000
0.2354**
0.0380
-0.0392
0.0173
0.0570
0.1490**
0.1209**
0.3667**
-0.0392
21
Chaebol Dummy
1.0000
Table 4.
Corporate Governance and Firm Value (Difference-in-Mean Test)
Firms are categorized into five groups according to their corporate governance scores and for each quintile (equally-weighted) averages of Tobin’s Q and market-to-book ratio are computed. Tobin’s Q is computed by [(book value of debt + market value of equity) / book value of asset]. Market-to-book ratio is computed by [market value of common equity/(book value of asset – book value of debt – book value of preferred stocks)]. When computing average Tobin’s Q for each quintile, 24 outliers are identified and dropped from the sample. Observations are considered as outliers if a studentized residual obtained from a regression of Tobin’s Q on corporate governance index is greater than 1.96 or smaller than –1.96. Such method identified the 24 largest figures as outliers. When computing average market-to-book ratio for each quintile, 16 outliers are identified and dropped from the sample. Observations are identified as outliers if a studentized residual obtained from a regression of market-to-book ratio on corporate governance index is greater than 1.96 or smaller than –1.96. Such method identified the 6 smallest figures and 10 largest figures as outliers. The 6 smallest figures include all the negative market-to-book ratios. Numbers of observations are reported in the brackets. The last row reports the t-test results. Standard errors assuming unequal variances are reported in the parentheses. ***, **, and *, respectively indicate significance levels at 1%, 5%, and 10%. Groups according to Corporate Governance Scores (1) Low (2) (3) (4) (5) High
Corporate Governance Index 0 ~ 18.80 18.83 ~ 25.16 25.27 ~ 31.04 31.19 ~ 39.00 39.02 ~ 75.28
(5) – (1)
22
Tobin’s Q
Market-to-Book Ratio
0.8054 [102] 0.7616 [104] 0.7810 [101] 0.8090 [105] 0.9071 [104] 0.1017*** (0.0265)
0.6708 [106] 0.5008 [103] 0.6442 [104] 0.6105 [103] 0.7708 [106] 0.0999 (0.0780)
Table 5.
Corporate Governance and Firm Value (Regression Analyses)
Tobin’s Q and market-to-book ratio are regressed on corporate governance index. Equations (1), (2), and (3) regress Tobin’s Q, while equations (4), (5), and (6) regress market-to-book ratio. Tobin’s Q is computed by [(book value of debt + market value of equity) / book value of asset]. Market-to-book ratio is computed by [market value of common equity/(book value of asset – book value of debt – book value of preferred stocks)]. 24 outliers are identified and dropped from the sample when estimating equation (1), (2), and (3). Observations are identified as outliers if a studentized residual obtained from a regression of Tobin’s Q on corporate governance index is greater than 1.96 or smaller than –1.96. Such method identified the top 24 figures as outliers. 16 outliers are identified and dropped from the sample when estimating equation (4), (5), and (6). Observations are identified as outliers if a studentized residual obtained from a regression of market-to-book ratio on corporate governance index is greater than 1.96 or smaller than –1.96. Such method identified the bottom 6 figures and top 10 figures as outliers. The bottom 6 figures include all the negative market-to-book ratios. White’s heteroscedasticity-consistent robust standard errors are reported in the parentheses. ***, **, and *, respectively indicate significance levels at 1%, 5%, and 10%.
Corporate Governance
(1) 0.0035*** (0.0006)
Tobin’s Q (2) 0.0025*** (0.0007)
0.7110*** (0.208) No 516 0.0524
0.6966*** (0.0832) Yes 516 0.0872
Debt/Asset Log (asset) Log (years of listing) Sales Growth (ratio) Intercept Industry Dummies Number of Observations Adjusted R-Square
(3) 0.0022*** (0.0006) 0.5464*** (0.0451) -0.0224*** (0.0062) -0.0604*** (0.0113) 0.0581*** (0.0145) 0.6411*** (0.0593) Yes 496 0.3643
(4) 0.0049*** (0.0019)
Market-to-Book Ratio (5) 0.0032* (0.0019)
0.4962*** (0.0559) No 522 0.0163
0.3614*** (0.1363) Yes 522 0.0702
(6) 0.0067*** (0.0020) 0.0380 (0.0650) -0.0947 (0.0747) -0.1343*** (0.0287) 0.1835*** (0.0814) 0.9292*** (0.1988) Yes 501 0.1495
Table 6.
Corporate Governance and Firm Value (Regression on Different Sub-Samples)
Regression of firm value on corporate governance index is conducted for a number of sub-samples. Samples are divided in three ways: bank versus non-banks; chaebol affiliated firms versus non-chaebol firms; and firms with book value of asset greater than KRW 2 trillion versus those less than KRW 2 trillion. Panel A shows the results for Tobin’s Q and Panel B shows the results for market-to-book ratio. White’s heteroscedasticityconsistent robust standard errors are reported in the parentheses. ***, **, and *, respectively indicate significance levels at 1%, 5%, and 10%.
A. Tobin’s Q
Corporate Governance Log (asset) Log (years of listing) Intercept Industry Dummies Number of Observations Adjusted R-Square
(1) Banks
(2) Non-Banks
(3) Chaebol
(4) Non-Chaebol
0.0001 (0.0003) 0.0106** (0.0041) -0.0256*** (0.0069) 0.9613*** (0.0290) No 17 0.6838
0.0029*** (0.0008) -0.0092 (0.0073) -0.0481*** (0.0120) 0.8527** (0.0866) Yes 495 0.0975
0.0042** (0.0017) -0.0018 (0.0176) -0.0465 (0.0236) 0.8932*** (0.1229) Yes 105 0.2192
0.0027*** (0.0008) -0.0130 (0.0097) -0.0464*** (0.0132) 0.8723*** (0.0918) Yes 407 0.1091
24
(5) Asset > KRW 2 trillion 0.0017 (0.0014) -0.0190 (0.0180) -0.0544*** (0.0205) 0.9929 (0.1715) Yes 64 0.4216
(6) Asset < KRW 2 trillion 0.0022*** (0.0009) -0.0305*** (0.0106) -0.0399*** (0.0137) 0.9577*** (0.0972) Yes 448 0.0804
B. Market-to-Book Ratio
Corporate Governance Log (debt) Log (asset) Log (years of listing) Sales Growth (ratio) Intercept Industry Dummies Number of Observations Adjusted R-Square
(1) Banks
(2) Non-Banks
(3) Chaebol
(4) Non-Chaebol
0.0041 (0.0038) -3.8561 (4.9539) 3.9199 (4.9692) -0.3736** (0.1243) 0.7574 (0.4636) 0.5651 (0.9224) No 17 0.7642
0.0067*** (0.0022) 0.0456 (0.0655) -0.1057 (0.0755) -0.1210*** (0.0294) 0.1717** (0.0779) 0.9198*** (0.2024) Yes 484 0.1463
0.0140*** (0.0054) -0.3808* (0.2095) 0.4014* (0.2219) -0.1358* (0.0710) 0.0977** (0.0471) 0.2639 (0.3451) Yes 107 0.3924
0.0047** (0.0022) 0.1203* (0.0690) -0.1969** (0.0817) -0.1336*** (0.0327) 0.4858** (0.1897) 1.1109*** (0.2056) Yes 394 0.1328
25
(5) Asset > KRW 2 trillion 0.0100 (0.0072) -1.0204** (0.4018) 1.0113** (0.4083) -0.1041 (0.0728) 0.6392 (0.4216) -0.3922 (0.7153) Yes 64 0.4352
(6) Asset < KRW 2 trillion 0.0039* (0.0023) 0.0879 (0.0648) -0.2048*** (0.0758) -0.1124*** (0.0352) 0.1654** (0.0753) 1.2761*** (0.2063) Yes 437 0.1516
Table 6b.
Corporate Governance and Firm Value (Three-Stage Least Squares)
Regression of firm value on corporate governance index is conducted for a number of sub-samples. Samples are divided in three ways: bank versus non-banks; chaebol affiliated firms versus non-chaebol firms; and firms with book value of asset greater than KRW 2 trillion versus those less than KRW 2 trillion. Panel A shows the results for Tobin’s Q and Panel B shows the results for market-to-book ratio. White’s heteroscedasticityconsistent robust standard errors are reported in the parentheses. ***, **, and *, respectively indicate significance levels at 1%, 5%, and 10%.
A. Tobin’s Q
Corporate Governance Log (asset) Log (years of listing) Intercept Industry Dummies Number of Observations Adjusted R-Square
(1) Banks
(2) Non-Banks
(3) Chaebol
(4) Non-Chaebol
0.0001 (0.0003) 0.0106** (0.0041) -0.0256*** (0.0069) 0.9613*** (0.0290) No 17 0.6838
0.0029*** (0.0008) -0.0092 (0.0073) -0.0481*** (0.0120) 0.8527** (0.0866) Yes 495 0.0975
0.0042** (0.0017) -0.0018 (0.0176) -0.0465 (0.0236) 0.8932*** (0.1229) Yes 105 0.2192
0.0027*** (0.0008) -0.0130 (0.0097) -0.0464*** (0.0132) 0.8723*** (0.0918) Yes 407 0.1091
26
(5) Asset > KRW 2 trillion 0.0017 (0.0014) -0.0190 (0.0180) -0.0544*** (0.0205) 0.9929 (0.1715) Yes 64 0.4216
(6) Asset < KRW 2 trillion 0.0022*** (0.0009) -0.0305*** (0.0106) -0.0399*** (0.0137) 0.9577*** (0.0972) Yes 448 0.0804
B. Market-to-Book Ratio
Corporate Governance Log (asset) Log (years of listing) Intercept Industry Dummies Number of Observations Adjusted R-Square
(1) Banks
(2) Non-Banks
(3) Chaebol
(4) Non-Chaebol
0.0001 (0.0003) 0.0106** (0.0041) -0.0256*** (0.0069) 0.9613*** (0.0290) No 17 0.6838
0.0029*** (0.0008) -0.0092 (0.0073) -0.0481*** (0.0120) 0.8527** (0.0866) Yes 495 0.0975
0.0042** (0.0017) -0.0018 (0.0176) -0.0465 (0.0236) 0.8932*** (0.1229) Yes 105 0.2192
0.0027*** (0.0008) -0.0130 (0.0097) -0.0464*** (0.0132) 0.8723*** (0.0918) Yes 407 0.1091
27
(5) Asset > KRW 2 trillion 0.0017 (0.0014) -0.0190 (0.0180) -0.0544*** (0.0205) 0.9929 (0.1715) Yes 64 0.4216
(6) Asset < KRW 2 trillion 0.0022*** (0.0009) -0.0305*** (0.0106) -0.0399*** (0.0137) 0.9577*** (0.0972) Yes 448 0.0804
Table 7. Corporate Governance and Firm Return (Difference-in-Mean Test)
Firms are categorized into five groups according to their corporate governance scores and for each quintile (equally-weighted) average returns are computed. 34 observations are dropped from the sample. Among the 34 observations, 23 are dropped as outliers. Observations are considered as outliers if a studentized residual obtained from a regression of gross return on corporate governance index is greater than 1.96 or smaller than –1.96. Such method identified the 23 highest figures as outliers. In addition, 11 firms that did not exist over the entire sample period - year 2001 - are also dropped from the sample. Column (1) reports buy-and-hold gross return for each group from December 26, 2000 to December 28, 2001. Stock-splits and stock-mergers are adjusted. Columns (2), (3), (4), and (5) report average excess returns. Column (2) reports return in excess of KOSPI return. Column (3) reports return in excess of the required rate of return from the market model. Column (4) reports return in excess of the required rate of return from CAPM. Beta values are obtained from FnGuide. Lastly, column (5) reports return in excess of the average return of firms in the same size category. Such matching portfolio does not include the stock being concerned. Size is computed by market capitalization on December 26, 2000. The last row reports the t-test results. Standard errors assuming unequal variances are reported in the parentheses. ***, **, and *, respectively indicate significance levels at 1%, 5%, and 10%. Groups by Corporate Governance Index Scores
Corporate Governance Index Score Range
Number of Observation
Gross Returns (1)
(1) Low (2) (3) (4) (5) High
0 ~ 18.80 18.83 ~ 25.16 25.27 ~ 31.04 31.19 ~ 39.00 39.02 ~ 75.28
105 101 104 100 96
33.7740 30.5950 33.5834 32.7056 58.9681 26.2861*** (6.8556)
(5) – [(1) ~ (4)]
(2) (1) – KOSPI Return -3.6959 -6.8748 -3.8864 -4.7642 21.4983 26.2861*** (6.8556)
28
Excess Returns (3) (4) (1) – Required (1) – Required Return from Rate of Return Market Model from CAPM 9.5824 8.7054 5.0934 4.1472 7.9371 6.6445 2.2931 2.1666 20.0920 20.5739 13.8107** 15.1090** (6.6893) (6.7421)
(5) (1) – Return in the Same Size Category -7.0371 -10.6418 -7.2328 -9.9352 20.0817 28.7633*** (6.9929)
Table 8. Corporate Governance and Firm Return (Regression Analyses) Excess returns reported in Table 7 are regressed on the corporate governance index and on other control variables. Control variables include size (log of market capitalization), market-to-book ratio, past return (over year 2000), share price (in logs), trading volume (in logs), dividend yield, sales growth (over past five years), and industry dummies. Panel A shows results without B/M ratio as a control variable. Panel B shows results with B/M ratio as a control variable. White’s heteroscedasticity-consistent robust standard errors are reported in the parentheses. ***, **, and *, respectively indicate significance levels at 1%, 5%, and 10%.
A. Without Market-to-Book Raito
Corporate Governance Index Log (Size) Past Return Log (Price) Log (Trading Volume) Dividend Yield (ratio) Sales Growth (ratio) Intercept Industry Dummy Number of Observation Adjusted R Square
(1) Gross Return – KOSPI Return 0.5799** (0.2294) -2.9620 (2.4968) -0.1284*** (0.0490) 11.8471*** (2.9125) 2.2531 (1.7694) 0.4898 (0.4660) 0.0197 (7.0256) -124.1687*** (37.0815) Yes 480 0.2432
(2) Gross Return – Required Return from Market Model 0.5230** (0.2386) -3.8805 (2.4861) -0.0001 (0.0640) 12.5823*** (2.9795) -0.7344 (1.7274) 0.4404 (0.4548) -10.1179 (6.9033) -39.0214 (35.4489) Yes 479 0.1915
29
(3) Gross Return – Required Rate of Return from CAPM 0.5166** (0.2374) -4.2420* (2.4970) -0.0070 (0.0628) 13.0378*** (2.9923) 0.1749 (1.7420) 0.4385 (0.4587) -7.0063 (7.0117) -59.1761* (35.9095) Yes 479 0.1967
(4) Gross Return – Return in the Same Size Category 0.5400** (0.2283)
-0.1109** (0.0492) 11.5376*** (2.6434) 1.2244 (1.4368) 0.3572 (0.4640) -3.4819 (7.5516) -130.2550*** (37.1313) Yes 480 0.2456
B. With Market-to-Book Raito
Corporate Governance Index Log (Size) Market-to-Book Ratio Past Return Log (Price) Log (Trading Volume) Dividend Yield (ratio) Sales Growth (ratio) Intercept Industry Dummy Number of Observation Adjusted R Square
(1) Gross Return – KOSPI Return 0.4700** (0.2237) -3.6628 (2.4910) -3.6834 (4.6958) -0.1358*** (0.0485) 12.3008*** (2.9042) 2.7195 (1.8155) 0.1167 (0.4614) 0.3766 (7.1000) -124.9280*** (37.9103) Yes 469 0.2549
(2) Gross Return – Required Return from Market Model 0.4030* (0.2324) -4.4684* (2.4927) -3.4863 (5.0957) -0.0080 (0.0647) 13.0252*** (2.9623) -0.3267 (1.7807) 0.0712 (0.4582) -9.8976 (7.0507) -39.6143 (36.0553) Yes 468 0.2032
30
(3) Gross Return – Required Rate of Return from CAPM 0.4016* (0.2308) -4.8813* (2.5013) -2.6161 (4.9870) -0.0160 (0.0631) 13.3979*** (2.9776) 0.5343 (1.7935) 0.0875 (0.4584) -6.9713 (7.1838) -58.2528 (36.5552) Yes 468 0.2084
(4) Gross Return – Return in the Same Size Category 0.5420** (0.2295)
0.3338 (1.4813) -0.1111** (0.0492) 11.5301*** (2.6475) 1.2077 (1.4409) 0.3707 (0.4721) -3.5591 (7.5874) -130.1156*** (37.1861) Yes 480 0.2457
Table 9. Corporate Governance and Firm Return (Regression on Different Sub-Samples)
Regression of firm’s excess return on corporate governance index is conducted for a number of sub-samples. Samples are divided in three ways: bank versus non-banks; chaebol affiliated firms versus non-chaebol firms; and firms with book value of asset greater than KRW 2 trillion versus those less than KRW 2 trillion. Excess return is defined by gross return – KOSPI return. White’s heteroscedasticity-consistent robust standard errors are reported in the parentheses. ***, **, and *, respectively indicate significance levels at 1%, 5%, and 10%.
Corporate Governance Log (price) Past return Intercept Industry Dummies Number of Observations Adjusted R-Square
(1) Banks
(2) Non-Banks
(3) Chaebol
(4) Non-Chaebol
2.7372** (1.0520) 44.3212* (21.7784) 0.1713 (0.8439) -439.8873** (176.9082) No 13 0.6703
0.3470* (0.1958) 11.6091*** (2.5528) -0.1444*** (0.0426) -104.0005*** (27.1785) Yes 493 0.2162
-0.0224 (0.4967) 17.7592*** (6.4754) -0.2234 (0.1649) -116.1743** (57.3918) Yes 102 0.4002
0.5568** (0.2390) 10.0059*** (2.7530) -0.1185*** (0.0461) -93.9368*** (29.2991) Yes 404 0.1653
31
(5) Asset > KRW 2 trillion 0.4712 (0.6398) 21.2165*** (6.0784) -0.1603 (0.4467) -291.6720*** (71.2835) Yes 58 0.6039
(6) Asset < KRW 2 trillion 0.3973* (0.2260) 10.5744*** (2.8325) -0.1481*** (0.0438) -96.4283*** (29.5866) Yes 448 0.1661
1