Research Brief
Despite Economic Recovery, Dentist Earnings Remain Flat
Authors: Marko Vujicic, Ph.D.; Bradley Munson, B.A.; Kamyar Nasseh, Ph.D.
The Health Policy Institute (HPI) is a thought leader and trusted source for policy knowledge on critical issues affecting the U.S. dental care system. HPI strives to generate, synthesize, and
Key Messages
disseminate innovative research for policy makers, oral health advocates, and dental care
Dentists’ earnings remain sluggish despite being three years removed from the Great Recession. Low dentist busyness levels and reduced patient wait times indicate additional capacity is available in the dental care system. The coming years are a period of major transition in the dental care sector and the prospects for dentist earnings remain unclear.
providers.
Who We Are
Introduction
HPI’s interdisciplinary team of health economists, statisticians,
Dentistry is a profession in transition. Previous research has shown that a broad set of
and analysts has extensive
factors intersected in the early 2000s that led to a decline in average dentist net income.
expertise in health systems
One of these factors was a steady decrease in dental care use among adults which began
policy research. HPI staff
well before the recent economic downturn. Clearly, more than just cyclical economic effects
routinely collaborates with
are affecting the dental care sector in the United States. In fact, a recent comprehensive,
researchers in academia and
forward-looking analysis convincingly demonstrates that important structural changes are
policy think tanks.
1 2
occurring within dentistry and a ‘new normal’ may be emerging in terms of dental spending, demand for dental care, and dentist earnings.
3
Contact Us
In this research brief, we present updated data on dentist earnings through 2012. We
Contact the Health Policy
discuss the policy implications of our findings.
Institute for more information on products and services at
[email protected] or call 312.440.2928.
© 2013 American Dental Association All Rights Reserved.
October 2013
Research Brief
Data & Methods We rely on data from the American Dental Association
We compared the trend for dentist net income to gross
Health Policy Institute’s Survey of Dental Practice. This
domestic product (GDP), a basic measure of economic
annual survey is conducted on a nationally
activity. We obtained inflation-adjusted GDP data from
representative random sample of 4,000 to 17,000
the Bureau of Economic Analysis and population data
dentists in private practice. According to the most
from the Census Bureau. We adjusted dentist
recent data available, 92.2% of active dentists in the
earnings for inflation using the all-item consumer price
4
United States are in private practice. Response rates
index (CPI).
to the Survey of Dental Practice from 1982 to 2012, our period of focus, varied from 14–50%. The most recent year for which data are available is 2012 and the response rate was 14.3%. The survey oversampled specialists to ensure an adequate number of responses for statistical analysis. During data cleaning, outliers were screened and dropped from the analysis where appropriate.
Estimates were weighted, where appropriate, to compensate for oversampling of specialists. We tested for statistically significant differences in means over time using t-tests. We used a chi-square test to test for significant differences in proportions. SAS Version 9 was used in this analysis.
Results
The survey asked dentists a variety of questions related to their practice including their net income. Net income is defined for “you only” and is income left over after practice expenses and business taxes and is to
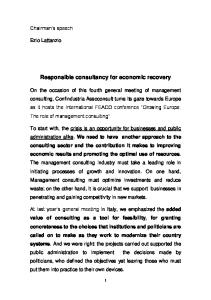
GDP per capita has increased each year from 2009 to 2012, and has approached its pre-recession level. The U.S. economy is clearly on the road to recovery.
include salary, commission, bonus and/or dividends,
In 2012, average annual net income was $193,640 for
and any payments made to a retirement plan on the
general practitioner dentists (GPs) and $289,880 for
dentist’s behalf.
specialists. Average annual net income was $202,760
The survey defined owner dentists as “sole proprietors” (the only owner/shareholder) or “partners” (one of two or more owners/shareholders). Employed dentists were defined as non-owners compensated on a salary, commission, percentage or associate basis.
for owner GPs and $146,040 for non-owner GPs (Figure 1). When adjusted for inflation, average incomes have remained about the same for GPs since 2009. They have decreased for specialists steadily since 2007 (data not shown). Clearly, our analysis indicates that dentists’ average net income levels have
A survey question on busyness offered four choices:
not matched the rebound in the U.S. economy.
(a) Too busy to treat all people requesting appointments, (b) Provided care to all who requested appointments but was overworked, (c) Provided care to all who requested appointments but was not overworked, (d) Not busy enough, could have treated more patients.
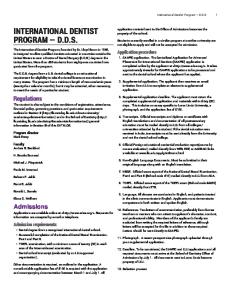
The percentages of dentists self-described as “not busy enough” in 2012 were 37% for GPs and 36% for specialists, comparable to the substantial levels of the previous year (Figure 2). Among GPs, 42% of solo practitioners (a single, owner dentist in the practice) indicated they were not busy enough compared to 30% of non-owner GPs (Figure 3). This difference was statistically significant. Average wait times also 2
Research Brief
continue to decline. The average waiting time for a GP
based on inflation-adjusted dollars, and excluding
appointment has decreased from 9.9 days in 2001 to
owner-dentist salaries in the expense calculation.
4.6 days in 2012 for a patient of record. A new patient
These changes were not statistically significant.
waited an average of 11.3 days in 2001 and 5.4 days in 2012 (Figure 4). These changes were statistically significant. Taken together with the decrease in busyness, these data suggest that significant unused capacity is available in the dental care system.
From 2000 to 2011 the average percentage of gross billings collected by GPs decreased from 94.8% to 92.0%. The comparable decrease for specialists was from 94.9% to 91.0%. These changes were statistically significant. In 2012, these statistics stopped falling for
Average practice expenses per dentist have decreased
the first time in years, equaling 92.1% for GPs and
slightly for GPs and specialists by less than one
91.8% for specialists. But it is too early to tell if this
percent per year (on average) from 2005 to 2012,
represents a reversal in the trend.
$300,000
$55,000
$280,000
$50,000
$260,000
$45,000
$220,000 $200,000 $180,000 $160,000 $140,000 $120,000 $100,000
1981 1982 128,894 1983 129,080 1984 131,525 1985 133,124 1986 141,385 1987 142,504 1988 145,655 1989 146,344 1990 149,034 1991 150,637 1992 155,299 1993 164,450 1994 175,072 1995 177,187 1996 175,093 1997 183,847 1998 201,348 1999 209,573 2000 215,790 2001 214,466 2002 215,940 2003 216,158 2004 217,808 2005 222,096 2006 224,043 2007 217,229 2008 208,441 2009 195,458 2010 200,959 2011 196,371 2012 146,040 193,640 202,760
$240,000
All GPs
Non‐owner GPs
Owner GPs
$40,000 $35,000 $30,000 $25,000
Real GDP per Capita
Mean Real Annual Net Income
Figure 1: General Practitioner Dentist Earnings and the Economy
$20,000 $15,000 $10,000
GDP
Source: ADA Health Policy Institute; Bureau of Economic Analysis; Bureau of Labor Statistics. Note: Net income data are based on the ADA Health Policy Institute annual Survey of Dental Practice. Shaded areas denote recession years according to NBER. GDP is deflated using the GDP deflator. Net income is deflated using the all-item CPI. All values are in constant 2012 dollars.
3
Research Brief
Figure 2: Percentage of Dentists “Not Busy Enough” 50%
24%
30%
36%
37%
40%
20%
20%
10%
0% GP Dentist
2007
Specialist Dentist
2008
2009
2010
2011
2012
Source: ADA Health Policy Institute annual Survey of Dental Practice. Note: Indicates the percent of dentists reporting they are 'not busy enough and can see more patients.'
Figure 3: Percentage of General Practitioner Dentists “Not Busy Enough,” 2012
37%
40%
42%
50%
30%
30% 20% 10% 0% Solo Practitioner
Employee
All
Source: ADA Health Policy Institute annual Survey of Dental Practice. Note: Indicates the percent of dentists reporting they are “not busy enough and can see more patients.” Solo Practitioner is a dentist working as the sole dentist in a practice. Employee is a non-owner dentist compensated on a salary, commission, percentage or associate basis.
4
Research Brief
Figure 4: Average Wait Time for General Practitioner Dentist Appointment
12
11.3
Days
10 9.9
8 6
5.4
4 4.6 2 0 2000
2001
2002
2003
2004
2005
2006
Patient of Record
2007
2008
2009
2010
2011
2012
New Patient
Source: ADA Health Policy Institute annual Survey of Dental Practice. Note: Indicates the average wait time in days for an appointment with a general practitioner dentist.
Discussion Dentists’ earnings remain sluggish. This is despite
Second, the average retirement age of dentists has
being three years removed from the Great Recession.
increased dramatically in the past decade. According
One critical factor is what is happening on the demand
to the ADA’s Health Policy Institute, the average age of
side – patient volume is simply down, due to falling
retirement for dentists in 2001 was 64.8 and has
utilization rates among adults. In a separate research
increased to 68.3 in 2011. This increase has been
brief, analysis through 2011 shows that dental care use
steady and does not appear to be related to cyclical
5
continues to decline among adults. This trend
fluctuations in the economy.
emerged in the early 2000s, years before the economic downturn.
An increase in the supply of dentists, in the face of sluggish demand,
On the supply side, the number of practicing dentists
8 9
could also be one factor
explaining flat earnings among dentists.
per capita in the United States has increased after years of stability, going from 59.8 dentists per 100,000 6 population in 2008 to 62.0 in 2011. The increased
number of dentists is a result of two factors. First, dental school enrolment has increased considerably in 7 recent years and these new graduates have entered
the labor market.
Looking forward, further changes in dental care use patterns may be on the horizon and will likely impact dentist earnings. As there is unlikely to be any major change in dental benefits coverage for adults due to the Affordable Care Act,
10
in the short term the trend of
declining dental care use among adults may persist. At 5
Research Brief
the same time, dental care use and dental spending among elderly adults is on the rise, use among children is stable.
12
11
while dental care
A recent analysis
13
environment for dental care providers. On top of that, dental school enrolment continues to expand. Clearly, the coming years are a period of major transition and
shows that if current dental care utilization trends
uncertainty and the prospects for dentist earnings
continue, national dental care spending will remain flat
remain somewhat unclear. The ADA’s Health Policy
for years to come in the United States. This ‘new
Institute will continue to closely monitor these and
normal’ is likely to lead to a challenging practice
other critical developments in the dental care system through this period of transition.
This Research Brief was published by the American Dental Association’s Health Policy Institute. 211 E. Chicago Avenue Chicago, Illinois 60611 312.440.2928
[email protected] For more information on products and services, please visit our website, www.ada.org/hpi. 6
Research Brief
References 1
Vujicic M, Lazar V, Wall T, Munson B. An analysis of dentists’ incomes, 1996-2009. JADA 2012;143(5):452-460.
2
Vujicic M, Wall T, Nasseh K. Dentist Income Levels Slow to Recover. Health Policy Institute Research Brief. American Dental Association. December 2012. Available from: http://www.ada.org/sections/professionalResources/pdfs/HPRCBrief_0213_1.pdf 3
A Profession in Transition: Key Forces Reshaping the Dental Landscape. American Dental Association Health Policy Institute. Available from: http://www.ada.org/sections/professionalResources/pdfs/Escan2013_ADA_Full.pdf.
4
Dentist Supply in the US: 1993 – 2011. Health Policy Institute. American Dental Association. 2013.
5
Nasseh K, Vujicic M. Dental care utilization continues to decline among working-age adults, increases among the elderly, stable among children. Health Policy Institute Research Brief. American Dental Association. October 2013. Available from: http://www.ada.org/sections/professionalResources/pdfs/HPRCBrief_1013_2.pdf
6
Dentist Supply in the US: 1993 – 2011. Health Policy Institute. American Dental Association. 2013.
7
U.S. Dental School Applicants and Enrollees, 2010 Entering Class. American Dental Education Association. Available from: http://www.adea.org/publications/library/ADEAsurveysreports/Documents/ADEADentalSchoolAppEnrollees2010ClassE xecSummaryTables.pdf. 8
Vujicic M. Dental care utilization declined among low-income adults, increased among low-income children in most states from 2000 to 2010. Health Policy Institute Research Brief. American Dental Association. February 2013. Available from: http://www.ada.org/sections/professionalResources/pdfs/HPRCBrief_0213_3.pdf
9
Nasseh K; Vujicic M. Dental expenditure expected to grow at a much lower rate over in the coming years. Health Policy Institute Research Brief. American Dental Association. August 2013. Available from: http://www.ada.org/sections/professionalResources/pdfs/HPRCBrief_0813_1.pdf.
10 Nasseh K, Vujicic M, O’Dell A. Affordable Care Act expands dental benefits for children but does not address critical access to dental care issues. Health Policy Institute Research Brief. American Dental Association. April 2013. Available from: http://www.ada.org/sections/professionalResources/pdfs/HPRCBrief_0413_3.pdf. 11
Nasseh K; Vujicic M. Dental expenditure expected to grow at a much lower rate over in the coming years. Health Policy Institute Research Brief. American Dental Association. August 2013. Available from: http://www.ada.org/sections/professionalResources/pdfs/HPRCBrief_0813_1.pdf. 12
Nasseh K, Vujicic M. Dental care utilization continues to decline among working-age adults, increases among the elderly, stable among children. Health Policy Institute Research Brief. American Dental Association. October 2013. Available from: http://www.ada.org/sections/professionalResources/pdfs/HPRCBrief_1013_2.pdf
13
Nasseh K; Vujicic M. Dental expenditure expected to grow at a much lower rate over in the coming years. Health Policy Institute Research Brief. American Dental Association. August 2013. Available from: http://www.ada.org/sections/professionalResources/pdfs/HPRCBrief_0813_1.pdf.
Suggested Citation Vujicic M, Munson B, Nasseh K. Despite economic recovery, dentist earnings remain flat. Health Policy Institute Research Brief. American Dental Association. October 2013. Available from: http://www.ada.org/sections/professionalResources/pdfs/HPRCBrief_1013_4.pdf
7