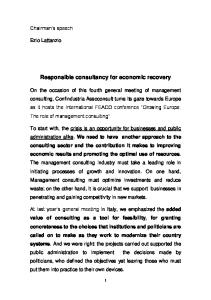
Economic recovery from disaster; safer city and economic revitalization Norio MAKI Kyoto University
Kobe(1995) and Tohoku(2011) Kobe (1995) • • •
M7 Death 6,434 people Building damage 249, 180 buildings (460,356 families) – Collapse 104,906 buildings (186,175families) – Major Damage 144,274 building(274,181 families)
• •
Debris 20M t Home less 320,000 people
• • •
Interim Housing 60,000 units Economic Loss 10trillion JPY Affected Municipality 20 cities and towns
– 1 week
Tohoku (2011) (as of August 28, 2012) • • •
M9 Death and Missing 18,715 Building damage 264,035 units – –
Collapse 129,340 units Major damage 264,035 units
• •
Debris 27Mt Home less 360,000 people
•
Interim Housing 110,000 units
– – –
• •
1 week Temporary housing 50,000 Voucher housing 60,000
Economic Loss 17 trillion JPY Affected Municipality 227(10 Prefectures
1
Urban Disaster Kobe 1995
Response Relief
渋滞
Multi Location Cascading Disasters Tohoku 2011
Multi-prefecture coordination Recovery
Fire
2
MultiMulti -Location Disaster Iwate Prefecture
Miyagi Prefecture
Fukushim a Prefectur e
Death/Mis sing 1)
5,989
11,250
1,989
Building Damage 1)
24,739
222,081
83,557
Km2
Km2
Inundation Area 2) (building Infrastructure land use %)
Coastal Area Capital Loss Rate
58 (37%)
327 (23%)
Km2
112 (13%)
47.3%
21.1%
11.9%
Evacuee at maximum
51,553
320,885
131,665
(inside/outsid
1,574
4)
227 municipality government simultaneously work for disaster response and recovery The first mutiprefectural disaster after WW2
(2011,3,1 (2011,3,14 (2012,3,1 1) 5) Prefecture, and Fukushima ) 2) Source: Iwate Prefecture, Miyagi Prefecture documents, Geospatial Information Authority of Japan, Iwate Reconstruction Basic Plan, Miyagi Current Reconstruction Basic Plan (not inclusive of JR and automobiles), Development Bank 42,771 127,952 98,221 5) evacuee of Japan, Reconstruction Agency (2012, Mar 12)
8,494
8,494
What we have learned from Kobe recovery
3
Severe Damage for Lifeline Systems Kobe Power
Damage
Recovery in
2600000
9 days
Gas
850000
3 months
Water
1300000
3 months
Sewage
260km
1 year
Phone
193,000
2 weeks
Life recovery became a target of recovery effort
4
Holistic Recovery Research by Hyogo Prefecture and Kyoto University Random Sampled Cross Sectional Survey Series
Pretest 1999 (4th)
Longitudinal Panel Study
N=1289 2001
N=486
2001 (6th)
2003
N=364
2005
N=297
N=717 ΣN=1203
2003 (8th)
N=1203
2005 (10th)
N=1028 By Hayashi
Societal Response after disaster
Phase 1
Phase 2
Phase 3
Phase 4
Phase 5
Disaster Formation of Disorientation Impacted SocietyUtopia
Back to Usual
10 hr
10000 hr
100000 hr
Recovery
Reconstruction
100 hr
1000 hr
Emergency Response
Relief
Saving Life
Recovery of Flow Alternatives
Reconstruction
Reconstruction Stock
Temporary recovery
5
Bird's-eye view of life recovery process: The 2003 study results (N=1,203, Jan. Community Empowerment
2003) +
公・共・私型の ⑤ 社会意識 ⑦
Active Citizenship Preparedness Rltn to Gov.
-
Encounter To Sig. Other
+
+
生活復興感 Life Recovery Damage Alleviation
Life
Recovery 復興過程 Process
+
-
Event Impact 震災の影響
Rebuilding
+ +
Event Evaluation 震災体験の評価
+
+
③地域活動 Community
+
+
地域における ②Social 人間関係の Ties 豊かさ
+ + +
+
①⑥Housing Income ④Stress Manag’t -
-
EQ Damage
2003 Model Source: Tatsuki Shigeo
Bird's-eye view of life recovery process: The 2005 study results Community Empowerment 公・共・私型の ⑤Preparedness 社会意識
③地域活動 Community
+
Rebuilding
Encounter To Sig. Other
⑦Relation to
+
Government
+ +
+
Life 復興過程 Recovery Process
Damage Alleviation
+
+
+
Event Evaluation 震災体験の評価
生活復興感 Life Recovery
2005 Model
(N=1,028, Jan. 2005)
地域における ②Social Ties 人間関係の 豊かさ +
+ Event Impact 震災の影響
-
①Housing ⑥Income ④
Physical & Psychological Stress
- -
Source: Tatsuki Shigeo
6
Basic Structure of Recovery Program Individual Assistance for Victims
Major Small Industries Business
Housing
Land Use Planning
Infrastructure
How Far We Came for over 10 years Individual Assistance for Victims
Major Small Industries Business
Housing
Land Use Planning
Infrastructure
7
Economic Recovery
Three Basic Economic Recovery Patterns after Kobe EQ Immediate boom & following slump Ex. Building Reconstruction
Immediate slump & following recovery Ex. Daily Consumption
Immediate slump & No full recovery Ex. Economic Activities w/ Competitors Import & Export at Kobe Harbor
8
Seven Elements for Life Recovery 489 (30.1%)
500 450
N=1623
407 ( 25.1%)
400 350 300
197 (12.1%)
250
154 (9.5%) 154 (9.5%) 138 (8.5%)
200 150
84 (5.2%)
100 50 0
Housing
Community
Mental Physical Health
Governmental Assistance
City of Kobe
Kobe recovery • Main target of the recovery projects in Kobe was housing (individual people). Kobe have successfully completed the recovery of commuting communities. • But recovery of small businesses did not work well.
9
And Tohoku (2011)
Tohoku before disaster Iwate
Sendai was only the core of developments The other part was shrinking community. They lacked resilience.
Miyagi
Fukushima
10
Land Use Concept of National Government Before “March 11”
After “March 11” Hill
Housing, Industry, Tourism Facility
Hill
Housing, Public Facility
Sea
Industry, Sea Tourism Facility Highland A: Worst Class Tsunami Evacuation B: Frequently Occurred Tsunami
Green Belt
Source: Minami-Sanriku Town Recovery Basic Plan
Recovery of business is critical for Tohoku recovery
11
Depopulation in Impacted area Continues for 8months until local recovery plan has completed Depopulation rate 1.40%
1.20%
2011
1.00%
0.80% H20 H21
0.60%
H22 0.40%
H23 H24
0.20%
0.00% 4
5
6
7
8
9
10
11
12
1
2
3
-0.20%
-0.40%
1month
3 month
April 11, 2011
July 7, 2011
Iwate Prefecture
Missio n Statem ent
5 month
July 31, 2011 Draft Plan
Vision
Draft Plan
Final Plan
Public Comments
August 26, 2011
July 3, 2011
Miyagi Prefecture
6 month Sep.11, 2011 Council Approval
July 12August 2, 2011 Public Comments
2nd Draft Plan
Oct.18, 2011 Council Approval Fin al Pla n
Nov.-Dec, 2011 Final Plan With rough Land use plan
Municipality Government
Fukushima Prefecture (Nuclear Influence)
August 11, 2011
End of Dec
Visio n
First Phase Recov ery Plan
12
Safer city or Survivability of Communities
Regional Characteristics (2005) Sustainable Dependent Marginal Disappearing
13
0.1%
2%
3%
90%
36%
10%
40-50%
M9 1978 Miyagi Earthquake Wake up call On Urban disaster Life Line failure Seismic Safety
99%
M7
70% 20% 7%
70%
87%
90% 70%
60%
40%
0-2%
地震調査研究推進本部
Transition of Japanese Disaster Management Policy Kanto Earthquake (1923)
Kobe (1995)
government Citizen
Structural Mitigation National Science Museum
Response Preparedness Tohoku (2011)
Private sector Recovery?? Resilience??
14
Lessons from Tohoku • Pre-disaster recovery planning is essential for communities to survive from disaster impact. • Collaboration with Private Sector is essential for survival of communities. • Integration with future vision is necessary for pre-disaster recovery planning. • Targeting year of pre disaster reduction plan will be target year +10-20 years. So if the target year is 2030 then the vision of 2050 should be considered for the plan.
15