February 2002 As the state’s shortage of health care workers intensifies, there is a growing need for more information about the current supply of and demand for health care professionals. For that reason, this dentist workforce profile was created to provide Minnesota policy makers, employers, educators, consumers, and others with an overview of current information. o
Dentist Workforce Profile
o o
o
o
Findings The number of dental school graduates may be insufficient to satisfy the demand for dental services across Minnesota. In 2000, 79 students graduated from the University of Minnesota’s School of Dentistry, which is the only graduate dental program in Minnesota. The average age of dentists in Minnesota is 49. More than half of Minnesota’s practicing dentists will likely retire within the next 15 years. While the proportion of female dentists (17.4 percent) is small when compared to other health practitioners (i.e., female pharmacists comprise 44 percent of the pharmacist workforce), the number of female dentists will grow in the future. According to the American Dental Association, the average net income of dentists who practiced general dentistry nationwide was about $124,960 in 1995 compared to an average net income of approximately $196,670 for dental specialists. 1 Even in areas with an adequate supply of dentists there is a reluctance among dentists to serve public program patients 2 largely because of an increased number of missed appointments, additional documentation and low reimbursement rates.
Minnesota’s dentists work in a wide range of settings, from private practices in small rural communities to large metro area HMOs. However, the dentist workforce is not evenly distributed among the state’s population. Rural areas have a dentist-to-population ratio of one dentist for every 2,000 people compared to a ratio of one metro area dentist for every 1,400 people.3 Although both of these numbers are still well below the minimum requirement for state designation as a Dental Health Professional Shortage Area (1:4,000), the dentist to population ratio in rural Minnesota is below that of the national average of one dentist for every 1,800 people and consequently, there are areas of the state that have been designated as Dental Health Professional Shortage Areas.4 See Map 1. These areas include large portions of western, northwestern, and northeastern Minnesota.5 Dentists are responsible for the diagnosis, prevention and treatment of teeth and gum tissue problems. Approximately 80 percent of Minnesota dentists are general practitioners who care for a variety of patient needs. The remaining dentists specialize in one of eight areas of expertise. See Table 1.
Table 1: Dental Specialties in Minnesota Specialty General Dentistry Orthodontist Oral and Maxillofacial Surgeon Endodontist Pediatric Dentist
Percent
Responsibility
6.2%
Diagnoses and treats teeth and gums Straightens teeth
3.3%
Operates on mouth and jaws
2.1%
Provides root canal therapy
2.0%
Diagnoses and treats children
79.7%
Prosthodontist
1.8%
Periodontist
1.6%
Public Health Dentists
0.4%
Oral Pathologist
0.3%
Other
2.6%
Makes artificial teeth and dentures Treats gums and bone Prevents and controls dental disease through communitywide efforts Studies oral diseases Not previously listed
Source: Dentist Survey, Minnesota Health Services Personnel Survey, 2001.
Minnesota Dentist Workforce Profile, Page 1
Map 1: Minnesota Dental HPSAs 2001
Minnesota Dentist Workforce Profile, Page 2
In order to practice dentistry in the United States, dentists are required to be licensed. To obtain licensure in Minnesota, dentists must first graduate from a dental school accredited by the American Dental Association’s Commission on Dental Accreditation or, in the case of foreign-trained dentists, demonstrate educational equivalency. At the University of Minnesota, incoming students need to have completed at least 100 semester credits or 150 quarter credits of college coursework to be considered for dental school admission. Dental school graduates must also pass written and practical board examinations to qualify for licensure. An additional two to four years of postgraduate education is required for specialization. According to Minnesota Board of Dentistry data, there were 2,836 Minnesota dentists actively practicing as of May 2001. 6
The Demand for Dentists Estimating the current and future demand for dentists is difficult. A common method for estimating workforce demand is to look at the number of vacancies at any given time and the length of time needed to fill those openings. In 2000, 17.1 percent of Minnesota dental care providers were recruiting additional dentists and open positions were vacant for an average of 40.4 weeks.7 However, since half of Minnesota dentists are in private solo practices, this reported number of job openings tends to underestimate the demand for dentists. This is because jobs are generally only reported for openings in group practice, educational or medical facilities.8 Other factors, such as demographic trends, technological changes and consumer preferences, must also be considered when trying to estimate the demand for dentists. Minnesota’s population is aging as the baby boomer generation is getting older and people are living longer. This population growth trend suggests that the number of people needing artificial teeth and dentures will likely grow in the future. In addition, there has been a marked increase in the demand for restorative services such as root canals offered by endodontists due to better preventive care. Improved dental hygiene is also the result of the development of better preventive dental care such as sealants and water fluoridation. In terms of consumer preferences, the relatively new field of cosmetic dentistry has steadily increased demand in recent years. Cosmetic dentistry includes procedures such as teeth whitening, teeth reshaping,
and the use of partials, crowns, and braces. These services fall within several specialty areas including general dentistry.
The Supply of Dentists The supply of dentists is likely influenced by several factors: the length of training required, workload, retirement of current dentists and reimbursement. Estimations of supply are generally based on two types of information: the total number of people graduating from area dental schools and the composition of the current dental workforce. The University of Minnesota is the only school in the state that offers a Doctor of Dental Surgery (D.D.S.) degree. It is important to remember that the total number of graduates from this program do not account for all of the new dentists who annually join the Minnesota dental workforce. Some Minnesota graduates may choose not to practice in Minnesota while graduates from other states choose to practice in Minnesota. In 2000, 79 students graduated from the University of Minnesota’s School of Dentistry.
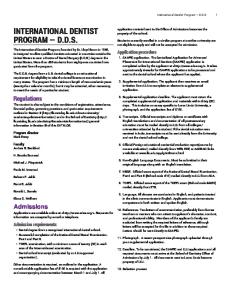
Figure 1: Training Site Location for Minnesota Active Dentists, 2001 West 1%
South 1%
East 2%
Minnesota 83%
Midwest 13%
Source: Dentist Survey, Health Service Personnel Survey, 2001.
According to results from the Minnesota Health Services Personnel Survey, approximately 84 percent of currently practicing Minnesota dentists received their dental training in Minnesota.9 The next largest suppliers of dentists are schools located elsewhere in the Midwest. Three foreign-trained dentists were practicing in Minnesota at the time of this survey. See Figure 1. 10 Legislation passed during the 2001 Special Session allows foreign-trained dentists to demonstrate educational equivalency to an accredited U.S. program, allowing them to practice dentistry in Minnesota.11 As
Minnesota Dentist Workforce Profile, Page 3
of September 2001, the Minnesota Board of Dentistry has accepted five such applications from foreigntrained dentists.
Figure 3: Age Distribution of Active Minnesota Dentists By Gender, 2001 100%
Figure 2: Age Distribution of Practicing Minnesota Dentists, 2001 25%
Percent
20%
15%
10%
5%
0% 25-29 30-34 35-39 40-44 45-49 50-54 55-59 60-64 65-69
70+
Age Cohort
90% 80% 70%
Percent
Demographic Trends: Age and Gender The dental workforce is aging just as the clients they serve are aging. In 2001 the average age of dentists in Minnesota was nearly 49. Approximately 60 percent of current dentists may retire within the next 15-20 years, based on a full-retirement age between 65 and 67.12 The age distribution of Minnesota dentists has remained relatively stable with a slight decrease in dentists in the 36 to 45 age range from 1998 to 2001 and a slight increase in dentists within the 46 to 55 age range from 1998 to 2001. At present, dentists who are between the ages of 46 and 55 represent the largest age cohort in the workforce. See Figure 2. Rural dentists are older, on average, (48.2 years) than those practicing in the metro areas of the state (46.6 years). 2
60% 50%
Female Male
40% 30% 20% 10% 0% 2529
3034
3539
4044
4549
5054
5559
6064
65- 70+ 69
Age Cohort Source: Dentist Survey, Health Service Personnel Survey, 2001
Employment Overview Currently, the dental workforce in Minnesota is not representative of the population it serves. Even though 2000 Census figures showed that 50.2 percent of Minnesotans are female, less than 17 percent of Minnesota dentists are females. The proportion of women practicing dentistry in Minnesota and across the country is significantly lower than in other health professions. Racial and ethnic data on Minnesota dentists are currently not available. Minnesota dentists are employed in a number of settings. About half of dentists work alone in a private practice, another 40 percent are part of a private group practice, and the remaining 10 percent are divided between staff-model HMOs, educational, institutional, clinical, public health and other settings. See Table 2.
Source: Dentist Survey, Health Service Personnel Survey, 2001.
While the proportion of female dentists (17.4 percent) is small when compared to other health practitioners (i.e., female pharmacists comprise 44 percent of the pharmacist workforce), the number of female dentists, based on current enrollment trends, will likely grow in the future. Almost nine out of every 10 dentists over the age of 50 is male. See Figure 3. By contrast, slightly over 40 percent of dentists under the age of 40 are female. A larger proportion of the females in the future dental workforce may have an impact on access since female dentists are, on average, more likely to work in urban areas and work fewer hours than their male counterparts. Female dentists in Minnesota work an average of 33 hours per work compared to male dentists who work 36 hours per week.
Table 2: Percent of Minnesota Dentists by Practice Setting and Region, 2001 Type Solo Practice Group Private Other Staff Model HMO Educational Institutional Clinic Public Health Hospital No Survey Response
Rural
Twin Other* State Cities Urban Average 61.5 44.7 50.5 50.3 33.8 41.1 39.9 38.8 1.6 2.3 1.1 2.0 0.0 3.0 0.5 1.9 0.3 2.7 2.1 1.9 0.9 0.9 3.2 1.1 0.3 1.3 1.6 1.0 0.3 0.9 0.5 0.8 0.1 0.7 0.0 0.5 0.9 2.4 0.5 1.8
Source: Dentists Survey, Health Service Personnel Survey, 2001. *Other Urban refers to Olmsted county and the cities of St. Cloud and Duluth.
Minnesota Dentist Workforce Profile, Page 4
The distribution of dentists relative to the population is not even across the state. In 2000, the dentist-topopulation ratio across all of Minnesota was 1:1,624. In the Twin Cities metro area this ratio was lower, 1:1,396, which in theory translates into better access to dental services than the ratio of 1:2,000 in rural areas.13 It is important to note, however, that dentist-topopulation ratios alone cannot give an accurate picture of access because it is an average over a large geographic area. Anecdotal evidence indicates that there may be pockets of the state where there are an insufficient number of dentists to meet the needs of patients in that area. The dentist per capita ratio has declined over the last decade. Between 1991 and 1998 the state’s population grew seven percent, but the number of Minnesota dentists declined by nine percent. The result was a 14 percent decline in dentists per capita, which was slightly more than the 12 percent decline in the number of dentists per capita nationwide.14 This decrease has implications for the availability of dental appointments. It may also exacerbate the severe access problems facing patients enrolled in public programs seeking dental care. The lack of public program access is a complex one. Factors contributing to this problem include a low level of dentist participation in Minnesota's public programs, reimbursement issues, challenges serving the public program population, administrative issues and other factors. These challenges are heightened as the dentist to population ratio falls, and public program patients must compete for appointments. Minnesota dentists tend to stay in one location to establish a reputation rather than move frequently. The average dentist in Minnesota has been practicing dentistry for 20.9 years. Of those practicing dentists with a current Minnesota license, 86 percent are practicing in Minnesota. In 2001, the average Minnesota dentist had been practicing at their primary location for 13.2 years. Approximately 13 percent of Minnesota dentists divide their time between two or more practice sites. The average practicing dentist in Minnesota works 36 hours per week and 31.5 (87.5%) of those hours are spent in direct patient care. Approximately 40 percent of Minnesota dentists work 40 or more hours per week. About 97 percent of dentists reported that their main activity at their primary practice location was patient care; the second greatest response was teaching (1.2%). On average, Minnesota dentists make about $124,553 a year. Specialists tend to make more than general
practitioners. The average salary for a specialty dentist is $196,670. Industry Trends and Training Costs Economic factors should also be considered when discussing the current and future supply of dentists. With unemployment rates still relatively low, there is a shortage of workers in almost every industry from technology to healthcare. In dentistry, as in other health care professions, large start-up costs can exacerbate the worker shortage. A dentist’s start-up costs include: dental school tuition, missed income while working toward a D.D.S. degree and the costs of getting a solo or group practice up and running, which includes purchasing costly equipment. All of these factors may potentially draw workers away from the dental profession and into an alternative field with comparable pay but lower start-up costs. Tuition for the graduate program in dentistry at the University of Minnesota for the 2000-2001 academic year including books, supplies and room and board was $22,336 for Minnesota residents and $29,994 for nonresidents. Tuition and fees for four years would cost $89,344 for Minnesota residents and $119,976 for nonresidents if tuition rates stayed the same, which is not typical. Students going into a specialty area would add an additional two years of tuition costs before their degree is complete. In 1999, the average Minnesota dental school graduate had $79,076 in student loan debt. This is below the nationwide average dental student’s debt of $99,608. 15 Table 3: Private Practice Start-Up Costs
Type of Expense Office Space Operatory Equipment Computer, Lab, and Office Supplies Totals
“Scratch Practice” (Costs in Thousands)* $120 - $180 $60 - $120 $30- $50 $210 - $350
Existing Practice (Costs in Thousands)* 50 – 65% of annual gross revenues depending on practice size and location. $160 - $320
*Costs are approximate average values based on estimations from Shea Practice Transitions, P.A. and calculated from an average gross revenue of $320,000 for general practitioners and $490,000 for specialists. A “Scratch Practice” is a practice built from the ground up rather than from a previously existing practice. It is likely that in some rural areas costs of establishin g a start-up practice could be much lower depending on the location in the state and whether the practice is set up in space leased from an office building or in a building owned by the dentist.
Minnesota Dentist Workforce Profile, Page 5
Besides tuition costs, there are start-up costs for a dentist starting a private practice and sometimes for those joining a group practice. See Table 3. Recent Policy Changes During the 2001 Minnesota legislative session a number of laws were enacted to try to reduce the dental shortage. These initiatives have largely focused on increasing the number of dentists in Minnesota and retaining practicing dentists. As mentioned earlier, one of the new laws makes it easier for foreign-trained dentists to obtain a license in Minnesota.16 This may both increase access and increase the diversity of the Minnesota dental workforce. The Retired Dentist Program is another new program that is designed to reimburse retired dentists for license renewal and malpractice insurance costs if they provide at least 100 hours of volunteer dental services during a 12-month period. 17 The Dental Practice Donation Program assists retiring dentists in locating a dentist to take over the practice.18 In return, the dentist’s donation of the dental practice may be considered tax deductible. The Minnesota Department of Human Services may designate dentists who practice in underserved areas as Critical Access Dental Providers (CADP). The Department may then increase reimbursement rates to CADP participants by up to 50 percent for patients covered by MinnesotaCare, Medical Assistance, and General Assistance Medical Care.19 In addition, reimbursement rates were increased for diagnostic exams and dental x-rays for children under age 21 participating in a public dental program. The Dentist Loan Forgiveness program provides $10,000 in student loan reimbursement for up to 14 applicants each year.20 Dentists accepted into the program must serve for three years in a practice in which 25% of yearly patients are either public program enrollees or receive sliding fee discounts. A program to provide Dental Access Grants was also proposed to increase access to dental services by underserved populations.21 Given the current budget shortfall, however, these two programs may be cut. By reducing the financial strain on dentists who serve these individuals, these initiatives will encourage dentists to serve in public programs, and low-income areas. Another grant program sponsored through the Medical Education and Research Costs (MERC) endowment, allows for the Commissioner of Health and the Commissioner of Human Services to award training
The Risk of Reduced Access Much more is known today about adequate dental care than was known even twenty years ago. A possible link has been identified between health problems and neglected oral health. Diabetes, heart disease, and premature low birth weight babies all have positive correlations with the incidence of periodontal disease. New mothers can transmit tooth decay to their infants causing a condition known as “baby bottle mouth syndrome”.1 Dental pain caused from caries may cause children to miss school and adults to miss work. In 1996, acute dental conditions resulted in 1.6 million lost school days and 2.4 million lost workdays.1 According to The National Institute of Dental Research, for every $1 spent on preventive care, about $4 is saved in dental costs.”1 With adequate access to dental care comes the security of preventive care, which helps people avoid expensive, restorative work down the road.
grants to teaching institutions and training sites for projects aimed to increase dental access for underserved populations and promote innovative training for dental professionals. 22 Other laws have focused on increasing the scope of practice of other dental care providers in order to increase access to dental care. Under collaborative agreements, dental hygienists may now be able to provide dental hygiene services without the patient first seeing a dentist.23 In general, the duties dental assistants and hygienists are authorized to perform may soon be expanded, contingent on adequate educational qualifications and supervision by a licensed dentist. 24 This expansion of duties by the Minnesota Legislature is still pending and is currently undergoing review by the Minnesota Board of Dentistry. Summary and Conclusions Current data indicates that the risk of a future dentist shortage exists for Minnesota. If current trends continue, dentist to population ratios will continue to decrease. This will primarily be attributed to the aging population, more female dentists entering the workforce, the overall increase in population, and an increasing demand for dental services. Even in areas with an adequate supply of dentists there is reluctance among dentists to serve public program
Minnesota Dentist Workforce Profile, Page 6
patients. Still, there is no simple solution to this apparent shortage of dentists. Although several new laws have been put into place that are aimed at recruiting new dentists and retaining current dentists, there appears to be a need to expand the number of Minnesota dental school graduates in general. Ongoing attention needs to be given to strategies to improve access for public programs patients. Dental auxiliary professionals may also be able to step in to respond to the demand for dental services. For more information about this profile, please contact Michael Grover by phone at (651) 282-5642 or email at
[email protected]. This information will be made available in alternative format - large print, Braille, or audiotape - upon request. Available on the Web at: www.health.state.mn/divs/chs/workforce.htm.
Health Service Personnel Survey and Database In 1993, the Minnesota Legislature mandated regular surveys of the state's health care providers on a variety of issues. To meet this challenge, the Health Services Personnel Survey and Database Program was created within the Office of Rural Health and Primary Care at the Minnesota Department of Health. The Office maintains a database of about 110,000 Minnesota medical professionals. Although these health practitioners do not have to complete the surveys to renew licensure or registration, response rates vary between 60 percent and 90 percent depending on the position surveyed.
Which professions are surveyed? o Physicians o Registered Nurses o Licensed Practical Nurses o Dentists o Dental Hygienists o Dental Assistants o Physical Therapists o Physician Assistants o Respiratory Care Practitioners o Chiropractors o Pharmacists What information do the surveys gather? o o o o o o o o
Professional activity Work hours Practice location Practice setting Practice specialty Educational background Job tenure Practitioner age and gender
For more information about the survey and database, please contact: Michael Grover Senior Health Care Workforce Analyst Office of Rural Health and Primary Care Minnesota Department of Health P.O. Box 64975 Saint Paul, Minnesota 55164 (651) 282-5642
[email protected]
Minnesota Dentist Workforce Profile, Page 7
Notes 1
American Dental Association. 10 November 1999. http://www.ada.org/prof/ed/careers/factsheets/dentistry.html. 2 “Public Programs patients” in this paper refers to individuals who qualify for any of Minnesota’s medical public assistance programs including: Medical Assistance, General Assistance Medical Care, and MinnesotaCare, 3 Born, David, O. "Treading Water: Minnesota's Dental Workforce in the Year 2000." Northwest Dentistry. September-October 2000, 79(5): 23-28. 4 Health Resources and Services Administration. Website. 15 August 2001. http://www.hrsa.dhhs.gov/newsroom/features/workforcechallenges.htm. 5 Minnesota Department of Health, Office of Rural Health and Primary Care. April 2001. 6 Minnesota Board of Dentistry. May 2001. 7 Born, David, O. “The State of the State: Dental Practice in 2000.” Northwest Dentistry. May-June 2001. 83(3): 39-46. 8 Wilder Research Center. "Survey of Minnesota Dentists." November 2000. 9 The Minnesota Health Services Personnel Survey is conducted annually by the Minnesota Department of Health, Office of Rural Health and Primary Care. For the 2001 re-licensing year, 80% of actively practicing Minnesota dentists responded to the survey. 10 Of the 2, 291 total active dentists who responded to the survey only 1,806 provided training information. Results are based on sites where a DDS degree was completed. Eastern states included: CT, DC, DE, KY, MA, MD, ME, NC, NH, NJ, NY, PA, RI, VT, and WV. Southern states included: AL, AR, FL, GA, LA, MS, OK, SC, TN, and TX. Midwestern states included: IA, IN, IL, KS, MI, MO, ND, NE, OH, SD, and WI. Western states included: AK, AZ, CA, CO, HI, ID, MT, NM, NV, OR, UT, WA, and WY. One dentist was trained in Puerto Rico. 11 Laws of Minnesota 2001 1 st Special Session. Chapter 9, HF No. 125, Chapter 37. 12 Social Security Administration. 29 September 2001. http://www.ssa.gov/pubs/ageincrease.htm. 13 Dental Access for Minnesota Health Care Programs Beneficiaries: Report to the 2001 Minnesota Legislature. Minnesota Department of Human Services. 14
Health Resources and Services Administration, National Center for Health Workforce Information and Analysis. Minnesota State Workforce Profile.15 August 2001. http://bhpr.hrsa.gov/healthworkforce/profiles/default.htm. 15
American Association of Dental Schools (now the ”American Dental Education Association”). Survey of Dental School Seniors. 1999. 16 Laws of Minnesota 2001 1 st Special Session. Chapter 9, HF No. 125, Chapter 37. 17 Ibid. Article 2, Section 10. 18 Ibid. Article 2, Section 11. 19 Ibid. Article 2, Section 54. 20 Ibid. Article 1, Section 34. 21 Ibid. Article 2, Sections 3 and 47; and Article 17, Section 2, Subd. 6(a). 22 Ibid. Article 2, Section 3. 23 Ibid. Article2, Section 5. 24 Ibid. Article 2, Section 71.
Minnesota Dentist Workforce Profile, Page 8