California Independent System Operator Corporation
California ISO Report on natural gas price volatility
September 21, 2015 Prepared by: Department of Market Monitoring
Department of Market Monitoring – California ISO
September 2015
TABLE OF CONTENTS
Executive summary ......................................................................................................................1 Introduction ................................................................................................................................3 1
Comparison with other gas price indices ..............................................................................5
2
Natural gas price volatility between 2005 and 2015.............................................................. 9
3
Comparison with trading hubs outside California ............................................................... 17
Conclusion ................................................................................................................................. 21 Appendix A ................................................................................................................................ 23
Report on natural gas price volatility
i
Department of Market Monitoring – California ISO
September 2015
Executive summary In May 2015 the Department of Market Monitoring (DMM) published a report analyzing the upward volatility in natural gas prices at California trading hubs (May report). 1 DMM’s May report found that there was a minimal frequency of natural gas transaction prices in excess of the 25 percent and 10 percent levels of “headroom” incorporated within the ISO’s current bidding limits for commitment costs and default energy bids used in local market power mitigation. Therefore, DMM recommended that only incremental changes were warranted to the way gas prices are incorporated into the ISO’s current bidding rules. This report provides additional analysis and recommendations concerning gas price issues relating to the ISO market design. Based on the analysis presented in this report, DMM provides the following findings and recommendations. 1. Only incremental changes are warranted to the way gas prices are incorporated into current bidding rules. The more detailed analysis in this report reinforces DMM’s prior recommendation that only incremental changes to how gas prices are incorporated into the ISO’s current bidding rules are warranted. For instance, additional analysis in this report shows that even though natural gas prices experienced higher volatility between 2005 through 2009 compared to January 2010 through March 2015, only about 0.2 percent of trades at the PG&E Citygate and 0.5 percent of trades at the SoCal Citygate and Border in the next day market were at prices that exceeded the daily index currently used in the day-ahead market by more than the 25 percent “headroom” incorporated in current commitment cost bidding rules. 2 Similarly, analysis of natural gas prices at other trading hubs across the country in this report shows that gas prices at trading hubs in California showed dramatically less upward volatility compared to Northeastern hubs. 2. Consider using more timely ICE prices instead of the lagged gas price index currently used for the day-ahead market. The ISO uses gas prices based on prices for the next day market from the previous day’s trading since all but one of the sources of published gas prices for next day gas trading are not available until after the time that the ISO’s day-ahead market begins to run. However, the final price report for one of these sources (the InterContinental Exchange or ICE) is available in time for use in the day-ahead market without a one day lag. The analysis in this report shows that this ICE price is highly representative of the other gas prices used by the ISO. Thus, DMM recommends that the ISO consider using the ICE prices for the day-ahead market either for all days 3 or at least when the ICE prices exceed the previous day’s gas price index by 10 percent, rather than only in cases when ICE prices exceed the previous day’s gas price
1
Report on natural gas price volatility at western trading hubs, May 14, 2015: http://www.caiso.com/Documents/DMMReport-GasPriceAnalysis.pdf.
2
The daily index is manually updated on days when the average trade price increased by more than 25 percent compared to the previous day. Therefore, not all of these trades that exceeded 125 percent of the prior day index value actually exceed the current commitment cost bidding parameters.
3
Using the ICE price on all days would require changes in the ISO processes given that the ICE information not available until 10 a.m., the same time the day-ahead market begins.
Report on natural gas price volatility
1
Department of Market Monitoring – California ISO
September 2015
index by 25 percent or more. 4 The analysis in this report shows that with this modification, the maximum price of gas purchased in the next day market would almost never have exceeded the price used in the day-ahead market by more than the 25 percent level of headroom incorporated in commitment cost bid rules. Only about 0.1 percent of trades in the ICE market would have exceeded the 10 percent adder incorporated in default energy bids used in local market power mitigation. 3. Any gas costs that might be recovered through extra bid cost recovery payments should be very limited. Currently, the ISO is considering the option of allowing the potential for recovery of high real-time gas costs as part of the bid cost recovery process. DMM continues to be supportive of this option as an alternative to any approach similar to that used by Eastern ISOs, which allows participants to submit commitment cost bids and reference energy bids used in market power mitigation. In the Eastern ISO approach, the burden of review is placed on the market monitoring unit to review the reasonableness of these bids on a case-by-case basis in real time or on an ex-post basis. However, DMM believes this analysis shows that since a relatively small portion of gas trades exceed the next day indexes that can be used to limit commitment cost and energy bids, any need for additional cost recovery due to gas cost incurred for real-time commitments and energy dispatches should be very infrequent and limited. In addition, it should be noted that even in cases where actual gas trade prices may exceed this gas index, this may not result in any loss of revenue. For instance, default energy bids are only used to mitigate market bids when congestion occurs on non-competitive constraints. Also, in many cases, market clearing prices may exceed a unit’s mitigated commitment cost or energy bid prices. 4. Consider exploring a way to update gas prices used in real-time market commitment cost bids and energy bid mitigation. DMM suggests that the ISO consider exploring the possibility of updating the gas price index used in the real-time market with information from the same day market as another approach for dealing with infrequent but extreme price volatility in spot markets. For instance, if actual gas trading data indicate gas prices in the same day market may actually be exceeding the price used by a significant threshold, the ISO might update commitment cost and default energy bids used in the real-time market to reflect the price of gas trades in the same day market. DMM recognizes that this may require significant changes to the ISO market systems. However, this would provide a mechanism for addressing any infrequent but relatively high increases in real-time gas prices that occur after the close of the next day market.
4
In 2014, the ISO modified market rules so that when ICE prices for next day gas exceed the previous day’s gas price index by 25 percent or more, the ISO now updates default energy and commitment cost bids used in the day-ahead market using these ICE prices.
Report on natural gas price volatility
2
Department of Market Monitoring – California ISO
September 2015
Introduction Natural gas prices are a key input in the ISO markets as most prices are set by natural gas-fired resources. There are two ways in which the spot natural gas prices are directly used in the ISO markets. •
Natural gas prices are used to calculate start-up and minimum load commitment costs under the proxy cost option that applies to most gas-fired generating units. 5 Resources on the proxy cost option have the ability to bid in their start-up and minimum load costs up to 125 percent of their proxy costs.
•
An index of various natural gas prices are also used to calculate default energy bids (DEBs) that are sometimes employed to mitigate energy bids when local market power mitigation screens are triggered. Default energy bids include a 10 percent adder that is applied to all fuel and variable cost components, including variable gas costs. 6
Currently, the natural gas price index used by the ISO in the day-ahead market to calculate default energy bids and commitment costs for units under the proxy cost option is based on prices for the next day gas market at major gas trading hubs, which are usually lagged by one day. For instance, when the day-ahead market begins to be run at 10 a.m., commitment cost and default energy bids are based on an index of multiple gas prices that were published for next day gas trading that occurred on the prior day. The ISO uses gas prices based on the previous day’s trading since all but one of the sources of published gas prices for next day gas trading are not available until after the time that the day-ahead market begins to run. The use of a gas index based on the average of several gas prices is designed to increase the accuracy of gas prices used and prevent potential manipulation. However, because of the time of publication of most gas indices, this requires a one day lag between the flow date of the next day gas prices used in this index and the flow date corresponding to the operating day for which the day-ahead market is being run. In 2014, the ISO modified market rules to address issues created when natural gas prices in next day trading, which occur on the day the day-ahead market runs, have increased significantly above the gas prices that it would normally use for the day-ahead electricity market. Specifically, when the natural gas prices reflected in current trading in the ICE market exceed the previous day’s gas price index by 25 percent or more, the ISO now updates default energy and commitment cost bids used in the day-ahead market using these ICE prices.
5
Resources that do not have a valid use-limitation are required to be on the proxy cost option, whereas use-limited resources have the option to be on either the proxy cost option or the registered cost option. The registered cost option uses monthly futures gas prices.
6
It is important to note that bid mitigation occurs very infrequently in both the day-ahead and real-time markets. DMM estimates that in 2014 just over 1 unit per hour had its bid changed in the day-ahead market, which translated to about 11 MW of increased energy dispatch on average. In the real-time markets, DMM estimated that only 0.5 units per hour had bids changed in 2014, which resulted in a total of about 23 MW in increased dispatch on average. For more information, see DMM’s 2014 Annual Report on Market Issues and Performance, June 2015, Section 6.4.1: http://www.caiso.com/Documents/2014AnnualReport_MarketIssues_Performance.pdf.
Report on natural gas price volatility
3
Department of Market Monitoring – California ISO
September 2015
In the real-time market, default energy bids are automatically updated each day to reflect the next day index price for the operational day, which traded on the previous day. However, commitment costs for units under the proxy cost option are currently based on the natural gas price used in the day-ahead market. In May 2015, DMM published a report analyzing the upward volatility in natural gas prices at California trading hubs (May report). 7 DMM’s May report found that there was minimal frequency of potential natural gas prices in excess of the 25 percent and 10 percent thresholds incorporated within the ISO’s current bidding rules. Therefore, DMM recommended that only incremental changes were warranted to the current bidding rules. This report extends the analysis in three ways: •
Investigating to what extent the ICE index is representative of other gas price indices. In Section 1 we compare the ICE gas price average used in the May report to the natural gas price index produced by SNL and to the gas price index (GPI) currently used by the ISO. 8 We find no statistically significant difference between either the ICE and SNL indices or the ICE and GPI indices.
•
Extending the analysis over a longer timeframe. The May report evaluated data from January 2010 through March 2015. Since this was a period of relative stability in natural gas markets, Section 2 of this report reviews the data going back to January 2005. While we find a higher frequency of days with upward volatility during the 2005 through 2009 period, the current commitment cost bidding rules would still have been sufficient to cover all but a small number of trades on a small percentage of days.
•
Comparing California trading hubs to hubs in other parts of the country. To assess to what extent natural gas price volatility in California differs from that of trading hubs in other regions, we compare the volatility at the two trading hubs considered in the May report to nine other major U.S. hubs. Section 3 shows that the volatility at Western trading hubs is much less severe compared to hubs in the Northeast. The higher volatility at Northeastern trading hubs is likely related to high winter demand and limited transportation capacity.
DMM believes that this additional analysis reinforces our main recommendation from the May report: that only incremental changes to the ISO’s current bidding rules may be needed. However, based on this analysis, we also recommend that the ISO consider using the ICE index price as the sole source of gas price information for the day-ahead market. This would enable the ISO to eliminate the current one-day lag for gas prices used in the day-ahead market.
7
Report on natural gas price volatility at western trading hubs, May 14, 2015: http://www.caiso.com/Documents/DMMReport-GasPriceAnalysis.pdf.
8
For the comparison between ICE and SNL we use data from January 2010 through March 2015. Due to a data limitation related to gas transport costs included in the GPI, the comparison between ICE and GPI only includes data from January 2013 through March 2015.
Report on natural gas price volatility
4
Department of Market Monitoring – California ISO
September 2015
1 Comparison with other gas price indices To assess whether ICE prices are representative of other index prices used in calculating commitment costs and default energy bids, DMM conducted statistical analysis on next day gas prices on ICE as well as SNL and the gas price index (GPI) used by the ISO. ICE indices reflect a weighted average price for natural gas traded only on the InterContinental Exchange, whereas the SNL index price includes a broader range of trades and the GPI is a simple average of four price indices, including ICE, SNL, Natural Gas Intelligence (NGI) and Platts. Comparison between ICE and SNL prices
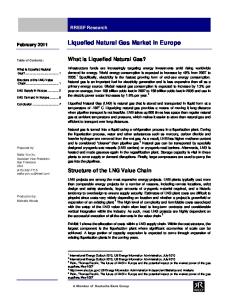
DMM compared ICE and SNL index prices from January 2010 to March 2015, totaling 1,902 days for PG&E Citygate and 1,898 days for SoCal Citygate. The analysis was to find out whether the average difference is significant at each trading hub, respectively. For the PG&E Citygate and the SoCal Citygate, DMM found no statistically significant difference between ICE and SNL prices. 9 Furthermore, the average sample difference for both hubs is very close to zero (less than 0.1 percent at both hubs). Figure 1.1
Distribution of percentage difference between ICE price and SNL price (January 2010 through March 2015) 10
60% PG&E Citygate
SoCal Citygate
Percent of days
50% 40% 30% 20% 10% 0%
Difference as a percentage of ICE price
9
A paired two-sample t-test is performed to test the null hypothesis that the ICE prices are representative of SNL prices. By convention we set the level of significance at 0.05, which means if the p-value from the test is less than 0.05, we conclude there is significant difference between the two prices, otherwise there is no significant difference. The p-value for the PG&E Citygate turned out to be 0.674 and the p-value was 0.603 for the SoCal Citygate.
10
A positive percentage indicates that the ICE price is higher.
Report on natural gas price volatility
5
Department of Market Monitoring – California ISO
September 2015
However, such a test can be passed if the average difference is near zero, but the differences include both large negative and large positive differences. Therefore, this report also examines the distribution of differences. Figure 1.1 shows the distribution of the difference between the ICE price and the SNL price as a percentage of the ICE price on the relevant day. Confirming the statistical analysis of averages, the average difference is close to zero. Just as importantly, there are few large deviations. On 98.5 percent of days, the differences were within ±2 percent. Comparison between ICE price and gas price index
DMM also compared the ICE index price with the ISO’s published daily gas price index (GPI) prices from January 2013 to March 2015. 11 This totaled 788 days for both the PG&E Citygate and the SoCal Citygate hubs. Similar to the analysis comparing the ICE price to the SNL price, the question was whether the average ICE price is representative of the gas price index at each trading hub, respectively. We found no statistically significant difference between the ICE price and the GPI at either trading hub. 12 As was the case for the difference between ICE and SNL, the average difference was within 0.1 percent at both trading hubs. Figure 1.2 shows the distribution of the difference between the ICE price and GPI as a percentage of the ICE price on the relevant day. At both trading hubs, the differences were within ±2 percent on more than 99.5 percent of the days.
11
Due to a data limitation related to gas transport costs included in the GPI, comparison between the ICE index price and GPI included fewer sample days than the comparison between the ICE and SNL index prices.
12
A paired two-sample t-test is performed to test the null hypothesis that the ICE prices are representative of GPI. By convention we set the level of significance at 0.05, which means if the p-value from the test is less than 0.05, we conclude there is significant difference between the two prices, otherwise there is no significant difference. The p-value for the PG&E Citygate was 0.195 and for the SoCal Citygate it was 0.229.
Report on natural gas price volatility
6
Department of Market Monitoring – California ISO
Figure 1.2
September 2015
Distribution of percentage difference between ICE price and GPI (January 2013 through March 2015) 13
60% PG&E Citygate
Percent of days
50%
SoCal Citygate
40% 30% 20% 10% 0%
Difference as a percent of ICE price
Conclusions
Our analysis finds that there is very little difference between the ICE index price compared with the SNL index price and the ISO’s gas price index. DMM suggests that the ISO consider solely using ICE as the source of its natural gas price index. Using the ICE index would eliminate the one-day lag that currently exists when calculating default energy bids in the day-ahead market and would eliminate the need to update the gas price when there is high volatility in the market. The benefit of making this change would need to be carefully weighed against the costs of making this change, including the costs of shifting the day-ahead market to accommodate this change and the potential for manipulation of the ICE index, before any final decision would be made.
13
A positive percentage indicates that the ICE price was higher.
Report on natural gas price volatility
7
Department of Market Monitoring – California ISO
September 2015
2 Natural gas price volatility between 2005 and 2015 DMM’s May report used information on all individual ICE trades for fixed price firm natural gas at the PG&E and SoCal Citygate hubs from January 2010 through March 2015. Because this timeframe did not cover the period of significant turbulence surrounding Hurricane Katrina in 2005 and the financial crisis in 2007-2008, we have extended the analysis by also including the time period of January 2005 through December 2009. 14 The analysis in this section shows that even though the 2005 through 2009 period was somewhat more volatile compared to January 2010 through March 2015, only about 0.2 percent of trades at the PG&E Citygate and 0.5 percent of trades at the SoCal Citygate and Border in the next day market were at prices that exceeded the daily index currently used in the day-ahead market by more than the 25 percent. 15 When comparing these two time periods it is important to keep in mind that natural gas markets have changed considerably since 2009. For example, the shale gas revolution has had significant effects on national natural gas markets, and an expanded natural gas pipeline network has changed regional dynamics in the West. 16 Thus, the 2005 through 2009 period may be less indicative of future conditions compared to the January 2010 through March 2015 period. Next day market trades compared to the prior day average
As noted above, the ISO is currently using a natural gas price index that is lagged by one day. In order to understand the implications of this lag, we have compared prices of trades occurring in the next day natural gas market to the prior day’s next day average. The left column of Table 2.1 shows the percent of days that experienced a day-over-day increase in the next day average by more than 10 percent, broken down by time period and three different ranges indicating how large the increase was. The middle column shows the percent of all next day trades that were more than 10 percent higher than the prior day average. 17 Finally, the right column shows the percent of days in which any trade (i.e., the highest price trade for that day) exceeded 10 percent. 18
14
Trading at the SoCal Citygate on ICE began in October 2008, prior to which the SoCal Border was the main trading hub in Southern California. Therefore, we include data from trades at both the SoCal Border and the SoCal Citygate for this analysis.
15
The daily index is manually updated on days when the average trade price increased by more than 25 percent compared to the previous day. Therefore, not all of these trades that exceeded 125 percent of the prior day index value actually exceeded the commitment cost bidding parameters.
16
For a summary of recent developments in the natural gas industry, see Chapter 2 in FERC’s Energy Primer – A Handbook of Energy Market Basics: http://www.ferc.gov/market-oversight/guide/energy-primer.pdf.
17
The individual trade data include all ICE trades for fixed price firm natural gas at PG&E Citygate and SoCal Citygate and Border.
18
Since next day trading for delivery on Saturdays, Sundays and Mondays all take place on Fridays and are subject to the same next day price, the prior day next day average price is identical to the next day average price for the correct flow date on Sundays and Mondays.
Report on natural gas price volatility
9
Department of Market Monitoring – California ISO
Table 2.1
September 2015
Next day prices compared to prior day average PG&E Citygate
Time Period
2005-2009
2010-2015
2005-2015
Range
Average higher than prior day average*
> 25%
0.2%
Trades higher than prior day average** 0.2%
Maximum higher than prior day average* 0.3%
15% - 25%
0.5%
0.6%
0.9%
10% - 15%
1.2%
1.2%
1.8%
Total > 10%
1.9%
2.0%
2.9%
> 25%
0.2%
0.3%
0.5%
15% - 25%
0.3%
0.2%
0.1%
10% - 15%
0.0%
0.1%
0.4%
Total > 10%
0.4%
0.5%
1.0%
> 25%
0.2%
0.2%
0.4%
15% - 25%
0.4%
0.4%
0.5%
10% - 15%
0.6%
0.6%
1.0%
Total > 10%
1.1%
1.2%
1.9%
* Percent of days
** Percent of next day trades
SoCal Citygate & Border
Time Period
2005-2009
2010-2015
2005-2015
Range
Average higher than prior day average*
Trades higher than prior day average**
> 25%
0.7%
0.8%
0.9%
15% - 25%
0.7%
0.8%
1.5%
10% - 15%
1.9%
2.2%
3.6%
Total > 10%
3.3%
3.8%
6.0%
> 25%
0.2%
0.2%
0.3%
15% - 25%
0.2%
0.3%
0.2%
10% - 15%
0.3%
0.4%
0.7%
Total > 10%
0.7%
0.9%
1.2%
> 25%
0.5%
0.5%
0.6%
15% - 25%
0.4%
0.6%
0.9%
10% - 15%
1.1%
1.4%
2.1%
Total > 10%
2.0%
2.5%
3.5%
* Percent of days
Report on natural gas price volatility
Maximum higher than prior day average*
** Percent of next day trades
10
Department of Market Monitoring – California ISO
September 2015
Table 2.1 shows that the frequency of lagged natural gas index prices exceeding 10 percent would have been greater during the 2005 through 2009 period. For the total period from January 2005 through March 2015, however, only about 1 percent of both the days and trades at the PG&E Citygate fell between 10 percent and 25 percent and up to about 2 percent of trades in the SoCal Citygate/Border were in this range. 19 Thus, the ISO’s current bidding rules allow for covering the vast majority of differences between the next day average price and the lagged average index price used in the dayahead market. The remaining differences could be eliminated altogether by either lowering the price spike threshold to 10 percent or by using the ICE index on all days. Price dispersion within the next day market
Even if the ISO were to lower the threshold of day-to-day price changes to capture more upward price spikes or use the ICE index on all days, some risk still remains. For instance, there may be trades, including the maximum, that differ from the average trade. Table 2.2 shows that for the non-lagged next day index, the amount of risk remaining in the next day market is very small – just 0.1 percent of all next day trades for both periods combined and for both the PG&E and SoCal Citygate hubs. Furthermore, almost all of the risk was below 25 percent, with only 0.1 percent of maximum trades exceeding 25 percent at both hubs. Thus, this further indicates that the next day average is an excellent representation of the range of next day trades and that the dispersion of trades in the next day market is very tight. Appendix A includes figures showing the relationship between the maximum trade and the next day index in more detail. Next day intra-day market trading
After the next day index trading ends, natural gas trading may continue in the next day intra-day market. 20 We analyze to what extent the next day average price is a good representation of prices in the next day intra-day market. While doing so, it is important to first point out that intra-day trading accounts for only a very small number of trades on ICE, averaging less than 1 percent of trades throughout our sample period. Table 2.3 compares prices in the next day intra-day market to the prior day next day average and Table 2.4 provides the corresponding comparison using the next day average for the correct flow date. The columns are defined in the same way as for Table 2.1. Whereas the percent of days with high next day intra-day prices was lower than for the next day market, the percent of trades was higher. This is due to the low level of liquidity in the next day intra-day market, where many days did not have any trades at all. As was the case for the next day market, most of the upward price risk would have been eliminated if the one-day lag was removed. Same day market trading
Finally, we compare prices of trades in the next day market to the same day market prices for the same flow date. This comparison shows the potential difference in the gas price used to calculate
19
As noted above, the ISO automatically adjusts if the day-over-day increase is more than 25 percent.
20
The next day intra-day market represents trades after the next day market on ICE has completed, but before the same day market has commenced. The same day market includes trades for the current trade date, whereas the next day intra-day market occurs on a day preceding the flow date, but after the next day index has been formed. This market can be used to trade for gas on resources that received unanticipated day-ahead market schedules from the ISO.
Report on natural gas price volatility
11
Department of Market Monitoring – California ISO
September 2015
commitment cost and default energy bids for the real-time market to the price of trades made in the same day market to procure some of the gas needed for real-time energy dispatches. As shown in Table 2.5, from 2005 to 2015, only about 1.2 percent of trades in the same day market for PG&E Citygate and 1.6 percent of same day trades for SoCal Citygate and Border were more than 25 percent higher than the next day price used in calculating real-time market commitment costs. About 3.2 percent of trades in the same day market for PG&E Citygate and 4.5 percent of same day trades for SoCal Citygate and Border were more than 10 percent higher than the next day price used in calculating default energy bids used when local market power mitigation is triggered. The proportion of all ICE gas trades taking place in the same day market increased during our sample period, from less than 1 percent of trades in 2005 at both trading hubs to about 5 percent at the PG&E Citygate and 10 percent at SoCal Citygate in 2014. Thus, while trading in the ICE same day market is relatively low, the liquidity of the same day market has increased in recent years. Table 2.5 shows that the proportion of trades that was more than 10 percent higher than the next day average was significantly higher during the 2005 through 2009 period compared to the January 2010 through March 2015 period. This change may have been related to the increase in liquidity in the same day market. Conclusions
Overall, the analysis in this section shows that the 2005 through 2009 period experienced more days with high upward gas price volatility compared to the January 2010 through March 2015 period. However, despite this higher level of volatility, the current commitment cost bidding construct would have sufficiently covered all trades on almost 99 percent of days. Furthermore, the 2005 through 2009 period may be less indicative of future natural gas market conditions compared to later years due to structural changes in gas infrastructure, which should be considered when determining future bidding rules in the ISO markets. Given that most of the trades that exceeded the commitment cost bid cap occurred in the same day market, the ISO could consider updating the commitment cost bid caps used in the real-time markets with same day natural gas price information should sufficient liquidity exist.
Report on natural gas price volatility
12
Department of Market Monitoring – California ISO
Table 2.2
September 2015
Next day prices compared to next day average PG&E Citygate
Time Period
2005-2009
2010-2015
2005-2015
Range
Trades higher than average**
Maximum higher than average*
> 25%
0.0%
0.0%
15% - 25%
0.0%
0.2%
10% - 15%
0.1%
0.3%
Total > 10%
0.1%
0.5%
> 25%
0.0%
0.2%
15% - 25%
0.0%
0.1%
10% - 15%
0.0%
0.5%
Total > 10%
0.1%
0.8%
> 25%
0.0%
0.1%
15% - 25%
0.0%
0.1%
10% - 15%
0.0%
0.4%
Total > 10%
0.1%
0.6%
* Percent of days
** Percent of next day trades
SoCal Citygate & Border
Time Period
2005-2009
2010-2015
2005-2015
Range
Trades higher than average**
> 25%
0.0%
0.0%
15% - 25%
0.0%
0.5%
10% - 15%
0.1%
0.6%
Total > 10%
0.2%
1.2%
> 25%
0.0%
0.1%
15% - 25%
0.0%
0.2%
10% - 15%
0.0%
0.0%
Total > 10%
0.0%
0.3%
> 25%
0.0%
0.1%
15% - 25%
0.0%
0.3%
10% - 15%
0.1%
0.3%
Total > 10%
0.1%
0.7%
* Percent of days
Report on natural gas price volatility
Maximum higher than average*
** Percent of next day trades
13
Department of Market Monitoring – California ISO
Table 2.3
September 2015
Next day intra-day prices compared to prior day average PG&E Citygate
Time Period
2005-2009
2010-2015
2005-2015
Range
Average higher than prior day average*
Trades higher than prior day average**
Maximum higher than prior day average*
> 25%
0.0%
0.0%
0.0%
15% - 25%
0.1%
0.8%
0.1%
10% - 15%
0.2%
3.1%
0.2%
Total > 10%
0.2%
3.8%
0.2%
> 25%
0.3%
5.0%
0.3%
15% - 25%
0.2%
1.6%
0.2%
10% - 15%
0.0%
0.0%
0.0%
Total > 10%
0.4%
6.6%
0.4%
> 25%
0.1%
3.9%
0.1%
15% - 25%
0.1%
1.4%
0.1%
10% - 15%
0.1%
0.7%
0.1%
Total > 10%
0.3%
6.0%
0.3%
* Percent of days
** Percent of next day intra-day trades
SoCal Citygate & Border
Time Period
2005-2009
2010-2015
2005-2015
Range
Average higher than prior day average*
Maximum higher than prior day average*
> 25%
0.1%
1.1%
0.1%
15% - 25%
0.1%
1.6%
0.1%
10% - 15%
0.1%
1.1%
0.1%
Total > 10%
0.2%
3.8%
0.2%
> 25%
0.1%
1.4%
0.1%
15% - 25%
0.2%
2.7%
0.2%
10% - 15%
0.1%
1.4%
0.1%
Total > 10%
0.3%
5.5%
0.4%
> 25%
0.1%
1.3%
0.1%
15% - 25%
0.1%
2.4%
0.1%
10% - 15%
0.1%
1.3%
0.1%
5.1%
0.3%
Total > 10%
0.2% * Percent of days
Report on natural gas price volatility
Trades higher than prior day average**
** Percent of next day intra-day trades
14
Department of Market Monitoring – California ISO
Table 2.4
September 2015
Next day intra-day prices compared to next day average PG&E Citygate
Time Period
2005-2009
2010-2015
2005-2015
Range
Average higher than next day average*
> 25%
0.0%
Trades higher Maximum than next day higher than next average** day average* 0.0%
0.0%
15% - 25%
0.0%
0.0%
0.0%
10% - 15%
0.0%
0.0%
0.0%
Total > 10%
0.0%
0.0%
0.0%
> 25%
0.2%
1.1%
0.2%
15% - 25%
0.0%
0.2%
0.0%
10% - 15%
0.0%
1.1%
0.1%
Total > 10%
0.2%
2.5%
0.3%
> 25%
0.1%
0.9%
0.1%
15% - 25%
0.0%
0.2%
0.0%
10% - 15%
0.0%
0.9%
0.0%
Total > 10%
0.1%
1.9%
0.1%
* Percent of days
** Percent of next day intra-day trades
SoCal Citygate & Border
Time Period
2005-2009
2010-2015
2005-2015
Range
Average higher than next day average*
> 25%
0.0%
0.0%
0.0%
15% - 25%
0.0%
0.0%
0.0%
10% - 15%
0.0%
0.0%
0.0%
Total > 10%
0.0%
0.0%
0.0%
> 25%
0.1%
0.4%
0.1%
15% - 25%
0.0%
0.0%
0.0%
10% - 15%
0.1%
0.2%
0.1%
Total > 10%
0.1%
0.5%
0.1%
> 25%
0.0%
0.3%
0.0%
15% - 25%
0.0%
0.0%
0.0%
10% - 15%
0.0%
0.1%
0.0%
Total > 10%
0.1%
0.4%
0.1%
* Percent of days
Report on natural gas price volatility
Trades higher Maximum than next day higher than next average** day average*
** Percent of next day intra-day trades
15
Department of Market Monitoring – California ISO
Table 2.5
September 2015
Same day prices compared to next day average PG&E Citygate
Time Period
2005-2009
2010-2015
2005-2015
Range
Average higher than next day average*
> 25%
0.2%
Trades higher Maximum than next day higher than next average** day average* 1.6%
0.3%
15% - 25%
0.3%
1.1%
0.3%
10% - 15%
1.0%
3.0%
1.0%
Total > 10%
1.5%
5.6%
1.7%
> 25%
0.2%
1.1%
0.3%
15% - 25%
0.2%
0.8%
0.2%
10% - 15%
0.1%
0.4%
0.3%
Total > 10%
0.4%
2.3%
0.7%
> 25%
0.2%
1.2%
0.3%
15% - 25%
0.2%
0.9%
0.2%
10% - 15%
0.5%
1.1%
0.6%
Total > 10%
1.0%
3.2%
1.2%
* Percent of days
** Percent of same day trades
SoCal Citygate & Border
Time Period
2005-2009
2010-2015
2005-2015
Range
Average higher than next day average*
Trades higher Maximum than next day higher than next average** day average*
> 25%
0.7%
4.9%
0.7%
15% - 25%
0.8%
3.1%
0.8%
10% - 15%
1.3%
4.8%
1.4%
Total > 10%
2.7%
12.8%
2.9%
> 25%
0.2%
0.9%
0.2%
15% - 25%
0.1%
0.3%
0.1%
10% - 15%
0.7%
1.5%
0.8%
Total > 10%
0.9%
2.7%
1.1%
> 25%
0.4%
1.6%
0.5%
15% - 25%
0.4%
0.8%
0.4%
10% - 15%
1.0%
2.1%
1.1%
Total > 10%
1.8%
4.5%
2.0%
* Percent of days
Report on natural gas price volatility
** Percent of same day trades
16
Department of Market Monitoring – California ISO
September 2015
3 Comparison with trading hubs outside California As an extension of the analysis performed in the May report, we here analyze how the natural gas price volatility at California trading hubs compares to hubs in other parts of the country. We compare the results for the PG&E and SoCal Citygate markets reported in the May report to nine additional major trading hubs across the United States. As in the May report, we use data from January 2010 through March 2015. Overall, natural gas prices were much more volatile at Northeastern trading hubs compared to Western hubs during this period. Day-to-day price increases
The first source of risk considered in the May report is the risk associated with the use of a natural gas price index that is lagged by one day. This risk is analyzed by computing a weighted average price of next day trades and looking at the change in this average from one day to the next. Specifically, the May report considered the frequency of days that experienced an increase in the weighted average next day price from one day to the next by more than 10 and 25 percent, respectively. 21 For both the PG&E Citygate and the SoCal Citygate it was found that less than 1 percent of days experienced an increase by more than 10 percent, and only about 0.2 percent of days had an increase of more than 25 percent. Figure 3.1 compares these results to the other nine trading hubs. The frequency of days with significant day-over-day increases is much higher at some of the other trading hubs. For example, at the Algonquin trading hub – which is located in the ISO New England area – the weighted average price increased by more than 10 percent on about 13 percent of days. The trading hubs with the highest frequency of high day-over-day increases are all located in the Northeast where high winter demand and limited transportation capacity contribute to highly volatile prices.
21
The 10 percent and 25 percent cutoffs were chosen to reflect the 10 percent adder incorporated in default energy bids and the 25 percent adder used to construct the commitment cost bid caps as well as the level used in the ISO’s current approach for triggering its special price spike procedures.
Report on natural gas price volatility
17
Department of Market Monitoring – California ISO
Figure 3.1
September 2015
Frequency of large day-over-day increases in the next day average price
14%
10% - 25% increase
Percent of days
12%
> 25% increase
10% 8% 6% 4% 2% PG&E Citygate (CAISO)
Colombia Gas Transm. (PJM)
NGPL-Midcont Pool (SPP)
SoCal Citygate (CAISO)
Opal (PacifiCorp East)
Panhandle (SPP)
NNG-Ventura (MISO)
Transco-Z6 (non-NY) (PJM)
Transco-Z6 (NY) (NYISO)
Tennessee Zone 6 (ISO-NE)
Algonquin (ISO-NE)
0%
Same day and intra-day averages compared to next day averages
After next day trading ends, natural gas trading for a given flow date may continue in the next day intraday and same day markets. This introduces a second source of risk since the gas price index used by the ISO is based on next day prices alone, while a market participant may be trading in the next day intraday or same day markets. In the May report, it was shown that the average price in the next day intra-day market exceeded the next day average by more than 10 percent during the sample period on only 4 days at the PG&E Citygate and 2 days at the SoCal Citygate. The corresponding frequencies for the same day markets were somewhat higher but remained below 1 percent of days. Figure 3.2 compares the frequencies for the same day market to the other trading hubs. 22 We again observe a pattern where the trading hubs in the Northeast experience a significantly higher level of volatility compared to the other hubs.
22
The percent of days where the average price in the next day intra-day market exceeded the average next day price by more than 10 percent was low across all trading hubs, occurring on less than 1 percent of days at all hubs. The next day intra-day market averages are therefore not included in Figure 3.2. The reason for this apparent lack of volatility is likely because trading in the intra-day markets is so infrequent that for most days there were no trades.
Report on natural gas price volatility
18
Department of Market Monitoring – California ISO
Figure 3.2
September 2015
Frequency of high same day average compared to next day average
12% Same day avg. >25% higher
Percent of days
10%
Same day avg. 10% - 25% higher
8% 6% 4% 2%
PG&E Citygate (CAISO)
Opal (PacifiCorp East)
NGPL-Midcont Pool (SPP)
Colombia Gas Transm. (PJM)
SoCal Citygate (CAISO)
NNG-Ventura (MISO)
Panhandle (SPP)
Transco-Z6 (non-NY) (PJM)
Transco-Z6 (NY) (NYISO)
Tennessee Zone 6 (ISO-NE)
Algonquin (ISO-NE)
0%
Maximum price compared to average price
The third and final source of risk considered in the May report concerns the fact that an index price does not reflect the range of prices within a given market for a given flow date. If the within-day price variation is large, then the price for a given trade can be significantly higher than the average price for that day. This source of risk is analyzed by considering the difference between the maximum price and the weighted average price of all trades in a given market. Figure 3.3 shows the percent of days for which the maximum price of any trade was greater than the hub average by 10 and 25 percent, respectively, for both the next day and same day markets. The blue bar considers the maximum trade in either the next day or same day market compared to the next day average, while the other two bars consider the within-market ranges. At all hubs, there were more days with a wide range of prices in the next day market than in the same day market. This is partially a consequence of the fact there were many days with very few trades in the same day market. 23 Again, we can conclude that the frequency of extreme price volatility is much higher at the Northeastern trading hubs compared to the Western hubs.
23
Since the next day intra-day market is even less liquid, most often containing no trades or just one trade on a given hub, the average and maximum trades differed by more than 10 percent on less than 1 percent of days in the next day intra-day market for all trading hubs. The next day intra-day market is therefore not included in Figure 3.3.
Report on natural gas price volatility
19
Department of Market Monitoring – California ISO
Figure 3.3
September 2015
Frequency of large difference between maximum and average price
30%
Next day or same day max >25% higher Next day or same day max 10% -25% higher Next day max >25% higher Next day max 10% -25% higher Same day max >25% higher Same day max 10% - 25% higher
Percent of days
25% 20% 15% 10% 5%
SoCal Citygate (CAISO)
Colombia Gas Transm. (PJM)
NGPL-Midcont Pool (SPP)
Panhandle (SPP)
Opal (PacifiCorp East)
PG&E Citygate (CAISO)
NNG-Ventura (MISO)
Transco-Z6 (non-NY) (PJM)
Tennessee Zone 6 (ISO-NE)
Transco-Z6 (NY) (NYISO)
Algonquin (ISO-NE)
0%
Conclusions
The analysis presented in this section shows that the upward volatility in natural gas prices at trading hubs in the West is very low compared to hubs in other parts of the country. In particular, trading hubs within the ISO New England and New York ISO areas experience levels of volatility that significantly exceed that experienced in the West. DMM therefore believes that it is reasonable that the framework for dealing with natural gas price volatility differ between different ISOs.
Report on natural gas price volatility
20
Department of Market Monitoring – California ISO
September 2015
Conclusion Based on the analysis presented in this report, DMM finds that: •
The ICE price is representative of both the SNL index price and the gas price index used by the ISO.
•
Even though natural gas prices experienced higher volatility between 2005 through 2009 compared to January 2010 through March 2015, the current bidding rules in place for commitment costs would have covered 99 percent of the daily volatility. This finding is similar to what was found in our May report.
•
When looking at natural gas prices at other trading hubs across the country, the trading hubs in California showed significantly less upward volatility compared to Northeastern hubs.
DMM believes that this additional analysis reinforces our main recommendation from the May report: that only incremental changes to the ISO’s current bidding rules may be needed. However, based on this analysis, we provide these further recommendations: •
The ISO should consider using the ICE index price as the sole source of gas price information for the day-ahead market. This would enable the ISO to eliminate the current one-day lag for gas prices used in the day-ahead market.
•
Currently, the ISO is considering the option of allowing the potential for recovery of high real-time gas costs as part of the bid cost recovery process. DMM continues to be supportive of this option as an alternative to any approach similar to that used by Eastern ISOs, which allow participants to submit commitment cost bids and reference energy bids used in market power mitigation. In the Eastern ISO approach, the burden of review is placed on the market monitoring unit to review the reasonableness of these bids on a case-by-case basis in real time or on an ex-post basis. DMM believes this analysis shows that any need for additional cost recovery due to gas cost incurred for real-time commitments and energy dispatches should be very infrequent and limited.
•
We also suggest the ISO consider exploring the possibility of updating the gas price index used in the real-time market with information from the same day market as another approach for dealing with infrequent but extreme price volatility in spot markets used to purchase some gas to support sales in the real-time electricity market. For instance, if actual gas trading data indicate gas prices in the same day market may actually be exceeding the price used by a significant threshold, the ISO could update commitment cost and default energy bids used in the real-time market to reflect the price of trades in the same day market. DMM recognizes that this may require significant changes to the ISO market systems.
Report on natural gas price volatility
21
Department of Market Monitoring – California ISO
September 2015
Appendix A When comparing the maximum price of any trade in any market to the (non-lagged) next day average, the May report found that only a handful of days had a maximum exceeding the average by more than 25 percent. This was also the case during the 2005 to 2009 period, as seen in Figure A.1 and Figure A.2, which reproduce Figures 1 and 2 of the May report. For a more direct comparison between the 2005 to 2009 period and the 2010 to 2015 period, Figure A.3 and Figure A.4 show histograms of the maximum trade on a given flow date as a percent of the next day average on that flow date. From these figures it is clear that the distribution of maximum trades had a similar shape across both time periods, and the overwhelming majority of trades remained below 105 percent of the next day average.
Figure A.1
Next day index price versus maximum trade price (PG&E Citygate)
Maximum trade in either same day or next day market ($/MMBtu)
$18
PG&E Citygate
$16 $14 $12 $10 $8
Max trade v. Next day avg.
$6
100 percent 110 percent
$4
125 percent
$2 $2
$4
$6
$8
$10
$12
$14
$16
$18
Next day average ($/MMBtu)
Report on natural gas price volatility
23
Department of Market Monitoring – California ISO
Maximum trade in either same day or next day market ($/MMBtu)
Figure A.2
September 2015
Next day index price versus maximum trade price (SoCal Border & Citygate) $18
SoCal Citygate and Border
$16 $14 $12 $10 $8
Max trade v. Next day avg.
$6
100 percent 110 percent
$4
125 percent
$2 $2
$4
$6
$8
$10
$12
$14
$16
$18
Next day average ($/MMBtu)
Report on natural gas price volatility
24
Department of Market Monitoring – California ISO
Figure A.3
September 2015
Distribution of daily maximum price (PG&E Citygate)
35%
PG&E Citygate
30%
2005-2009
Percent of days
25%
2010-2015
20%
110 percent
15%
125 percent
10% 5%
>130%
127%
124%
121%
118%
115%
112%
109%
106%
103%
100%
0%
Maximum trade as percent of next day average
Figure A.4
Distribution of daily maximum price (SoCal Citygate & Border)
35%
SoCal Citygate and Border
30%
2005-2009
Percent of days
25%
2010-2015
20%
110 percent
15%
125 percent
10% 5%
>130%
127%
124%
121%
118%
115%
112%
109%
106%
103%
100%
0%
Maximum trade in all markets as percent of next day average
Report on natural gas price volatility
25