MSc in Finance & International Business Thesis
Author: Jakub Kola Academic Advisor: Stefan Hirth
The Influence of the Dividend Policy on the Market Share Price Volatility. Study Based on the Evidence from the Polish Stock Exchange Market.
Aarhus School of Business June 2007
-1-
1.
INTRODUCTION....................................................................................................- 4 -
2.
DIVIDENDS DEFINITIONS AND HISTORICAL BACKGROUND ...............- 6 -
3.
4.
5.
2.1
Problem with the division of the profit ......................................................- 7 -
2.2
Payout policy ................................................................................................- 8 -
2.3
Cash dividends .............................................................................................- 9 -
2.4
Determinants of dividends ........................................................................- 10 -
2.5
Dividend dates ............................................................................................- 13 -
2.6
Dividend ratios ...........................................................................................- 15 -
2.7
Summary.....................................................................................................- 18 -
DIVIDEND THEORIES........................................................................................- 20 3.1
Miller and Modigliani dividend irrelevance theory................................- 21 -
3.2
Transaction cost theory .............................................................................- 24 -
3.3
Gordon and Lintner uncertainty resolution............................................- 25 -
3.4
Tax preference theory................................................................................- 26 -
3.5
Agency cost paradigm................................................................................- 27 -
3.6
Behavioral theory.......................................................................................- 28 -
3.7
Free cash flow hypothesis..........................................................................- 29 -
3.8
Signaling theories .......................................................................................- 29 -
3.9
Literature review on the signaling context of dividend payouts............- 33 -
3.10
Repurchases................................................................................................- 35 -
3.11
Share reactions to dividend announcements ...........................................- 37 -
DIVIDEND POLICY BACKGROUND IN POLAND .......................................- 42 4.1
Organization of Polish Stock Exchange Market .....................................- 42 -
4.2
Beginning of trading on WSE ...................................................................- 42 -
4.3
The evolution of the Exchange Market....................................................- 44 -
4.4
Polish Capital Market................................................................................- 47 -
4.5
Conclusions.................................................................................................- 49 -
EVENT STUDY ON THE POLISH STOCK EXCHANGE MARKET...........- 51 5.1
Introduction................................................................................................- 51 -
5.2
Methodology ...............................................................................................- 51 -
5.3
Data .............................................................................................................- 54 -
-2-
6.
5.5
Descriptive statistics...................................................................................- 62 -
5.6
Results discussion.......................................................................................- 64 -
CONCLUSIONS ....................................................................................................- 67 6.1
Further Research Topics ...........................................................................- 68 -
7.
FIGURES AND TABLES......................................................................................- 69 -
8.
REFERENCES.......................................................................................................- 73 -
-3-
1. INTRODUCTION
Decisions concerning dividend policies are next to investment and capital structure decisions one of the most important issues companies have to consider. Dividends as elements of the division of the net profit are part of the financial strategy of an enterprise. With that in mind, managers have to decide how structured payout policy should they follow considering the aspects of its existence on the market and long term growth. For the investors, the problem lies in their preference between the immediate revenues or possible future profits. The important issue is that the more company decides to pay out today, the less funds it will have for reinvestments, which results are unknown to the investors. Therefore, daily observations of company’s share prices, especially around the days important for the payout policy structure, give clear evidence that any decision about the payout results in abnormal and unexpected changes in its price. Despite years of theoretical and empirical research, including different data and factors, the problem of the relationship between stock prices volatility and dividend payout decisions has not been clearly explained yet, especially in young and developing markets. To address this issue I decided to observe the history of the stock and dividend policy evolution on one of the developing markets. Then to observe the share price volatility connected with dividend decisions was chosen the study of price fluctuations around the dividend announcement day. As a basis for this study was selected the polish market, because of its size and growing position among the other developing markets in the Eastern and Central Europe. The number of listed companies and dividend payers in this market is large enough to perform a research and formulate conclusions. The decision about focusing on the announcement day is based on the fact that information about dividends concerning previous year profit is released together with the information about the last year earnings. Therefore the strongest reaction of investors to such information should be concentrated in days surrounding the announcement day. The technique that will be used in the empirical research in this thesis is the average abnormal returns on the days around the announcement of dividend by companies.
-4-
The research will be divided into 2 parts. First will include dividend changes in the decreasing market, whereas second in the growing market. Such distinction might give interesting evidence of how positive and negative managers’ decisions are interpreted by investors when the whole market is in optimistic or pessimistic mood. Understanding the volatility of share prices should help investors plan their investments and show opportunities for short time abnormal returns in specific moments. I expect to find in the research the support for the signaling theories based on the developed markets. At the same time, I expect the results will be significantly volatile and their statistical significance will not be very high. The reason for choosing this subject in a thesis combines my four year interest and experience in investing on the polish stock exchange with the knowledge I have gained during my studies at Aarhus School of Business. When investing on the stock exchange I have always been searching for strong companies characterized with slow but stable growth rate, and possibly low volatility. During my studies at ASB I’ve learned a lot about the finance theory and factors influencing company’s value. Such knowledge allows to predict to some extent the movements of share prices as a reaction to the information released by managers. However, there was no much evidence of how international finance theory applies to young and still growing markets. Hence I decided to get better understanding of such important factor as dividend policy changes in Poland. Empirical results of this thesis should present more clear view of the situation on such young markets and rise new interesting questions for further researchers studying this topic.
Keywords: Dividend policy, signaling theory, share price volatility, announcement day, polish stock market.
-5-
2. DIVIDEND DEFINITIONS AND HISTORICAL BACKGROUND
The main question in Miller and Modigliani (1958, 1961 and 1963) studies was “how do firms choose their capital structure?”. The capital structure is defined as a long term financing mix for a company. When a firm need financing, it can ask investors for cash in return for a share of future profits, which results in issuing new stocks for them and making them company’s shareholders, or it can promise investors sets of fixed payments, so they become lenders who will be in the future repaid (Brealey and Myers, 2003). Shareholders are the owners of the firm, who fully posses its assets and profits and are the residual claimants. Corporate finance is the part of financial economics, which is a branch of applied micro economics and therefore based on neoclassical utility theory. Accepting standard utility theory, the goal of corporate finance is to maximize the wealth of the shareholders, which is equal to maximizing return on the market value of the equity. Hence Miller and Modigliani question is actually a problem of how to choose the company’s financing policy to maximally increase the value of assets. These researchers showed that with certain assumptions dividend policy does not have any influence on the value of the company. This irrelevance theory holds on the perfect markets. However, the question is how would dividends influence the value of the company on the market in the world were Miller and Modigliani’s assumptions are not completely fulfilled?1
In the early history of stock exchange and investing, income was the only factor that attracted people to buy and keep stocks, like in a case of the railroad companies. But in the 1950s situation started to change and began the downfall of dividends. Before this time dividend yields on stocks were consistently higher than those on bonds. Even though the investors considered shares to be more risky than bonds, they actually ignored the growth component of stocks and basically demanded dividend yields to be higher than bond yields. What has changed in the 50s is that investors
1
Miller and Modigliani thoery is further described in details in charter 3.1.
-6-
started considering shares as a long-term investment, and consequently stopped valuing them only on their dividend yields. In economy when the demand on a particular thing goes down, the expected reaction of the price is to follow it. Similarly in this situation, the diminishing demand on dividends, drove their yields to the low level, lower than bonds yield, where they have remained ever since. It can be consider as a more expected situation than that before 50s, as dividends are not equivalent of profits. However, despite this change, today investors are still interested in dividend paying stocks and noticeably react to their changes. This gives dividends still an important position as a financial strategy factor.
2.1 Problem with the division of the profit
It is said that the goal of one business is to earn profit, which is a positive gain from an investment or business operation after subtracting all expenses connected with it.2 It is also called return on capital or earnings, minus cost of maintaining land, labour, and capital.3 The division of this profit in one company is an element of a firm’s financial strategy, which also includes decisions of where to invest money, possible sources of capital, capital structure and decisions of how to keep the liquidity. Because today companies belong normally to different people or groups of people with individual view on the business, it became difficult to make the most appropriate decision about the payout. In general there are three possibilities of dividing the profit: -
keeping it completely in the company in view to reinvest it. If the owners decide to follow this way, they resign from paying out the dividend for the previous year in hope that the appraisal of the share prices or awaited future dividends will bring higher return than today’s payout;
-
paying out the whole profit the company has earned. This is very narrow solution as the lack of internal capital sources limits the growth of a firm. Hence this possibility is barely used in practice. However, followers of this
2 3
http://www.investorwords.com/3880/profit.html http://www.answers.com/topic/profit
-7-
theory claim that individual investors can better spot investment opportunities and therefore the whole profit earned by companies should go back to them, so they would the find new best solution of its allocation; -
dividing the profit into two parts – one part of it is assigned for the investment requirements and projects of the company and the second is paid out to different groups having some stock in the company. This approach seems to be the most popular among the companies.
In this chapter the most important definitions according to the payout policy will be explained, as well as the main models and the background of dividends. Information included in this part cover the basics of payout policy and some advanced issues related to that topic, to help better understand the problem. This information should be a sufficient introduction to the 3rd chapter, where the dividends theories and controversies are presented. This information is also necessary for the following chapters which cover the empirical part of the thesis, including statistical tests with the description and explanation of results.
2.2 Payout policy The first term that should be explained is the payout policy itself. According to Allen and Michaely (2002) this term refers to the dynamic decisions that firms must take repeatedly on regular basis. The word “policy” implies this consistency over time and that payouts do not simply evolve in an arbitrary and random manner. Payout policy also tries to answer the question how much company should give back to its shareholders and what for should this payment take. The importance of payout policy comes not only from the amount of money involved (according to Allen and Michaely in 1999 corporations spent more than $350 billion on dividend and repurchases) and multiplicity of payout decisions, but also from the fact that payout policy interacts with the majority of financial and investment decisions corporations make. Management has to decide about the dividends, repurchases, investments in real assets, mergers and acquisitions and debt issuance, which are interconnected decisions.
-8-
There are three popular ways companies can set their payout: through cash dividends, stock dividends and repurchasing shares. In this paper we will focus on the first of these, since we will discuss here the dividend situation in Poland, where stock dividends nor share repurchases are not popular ways of payout. In the research we performed we have not encountered any examples of stock dividends in Poland, however share repurchases are already know to polish investors, but still amount to very small percent of the aggregate companies payout. The case of repurchases will be discussed later in chapter 3.10.
2.3 Cash dividends
Paying out cash dividends, according to the Columbia University Encyclopedia, is one of the ways in which companies can share their net earnings generated by the business with its shareholders. Dividends disbursements are based on a percentage of the stock par value or a certain sum per share of non-par-value stocks4. Investors who receive dividends will have to pay tax on capital gains, which is usually lower than the tax rate for the ordinary income. Normally dividends shouldn’t be paid unless the company has accumulated a profit or a surplus in the given period. However, in some countries, Poland included, a company can continue paying dividends in a year when it experienced losses from the retained earnings from previous years. The limitation is that the amount of money destined for the payout to shareholders cannot exceed net profit for the last year, increased by the retained earnings from the previous year and profits from which initial and reserve capitals were created. This amount should be however decreased by the uncovered losses, equity shares and amounts that, according to the law, should be transmitted from the last year’s profit into the reserve and initial capitals5. The accounting mechanism of cash dividends is very simple. When a company announces a dividend, the money for all dividends is transferred to a liability account called dividends payable. This liability is removed in a moment when a company really makes the payment. The retained earnings are reduced by the exact amount of
4
dividend. Answers.com. The Columbia Electronic Encyclopedia, Sixth Edition, Columbia University Press., 2003. http://www.answers.com/topic/dividend, accessed November 25, 2007. 5 Commercial Companies Code under the Polish law, article no. 348.
-9-
money destined for dividend, and this money makes its way from the firm to the shareholders.
2.4 Determinants of dividends
Another important issue is the stability of dividends. Because of economic cycles and normal business activities, profits and investment opportunities vary over time. This might lead to conclusion that variation of company’s payout policy should be understandable and accepted by investors. When a business has large cash inflows, it should increase its dividends, but should lower them in situation of short supply in cash relatively to investment opportunities. The problem is that a sound number of investors would not rely on unstable cash dividends. Even Graham (2006)6 suggested that an intelligent investor, who relays on the value of the company, should place his funds in stocks with the long and stable history of dividend payouts. Moreover, by reducing dividends in view of increasing money available for capital investments, managers might send incorrect signals to the market, which can react by pushing the stock price down. As a result, companies try to balance their dividends. If there was no inflation, companies would have to pay the same amount of dividend a year in the local currency. However, because such situation is almost impossible, companies have different approaches to determine their payout decisions. Three main are presented below:
1. Residual method Companies which are using the residual dividend policy rely on equity generated internally to finance any new investments. Hence dividend payments can result from two sources: the residual or the leftover equity, only after the money for all the objectives of the undertaken projects are met. Companies using this method usually tend to keep their debt/equity ratio balanced before making any dividend distribution, which basically means that such firms make a decision of the payout only if there is enough money left after all planned expenses are met.
6
Book „The Intelligent Investor” - version with the commentary by Jason Zweig and with preface and appendix by Warren E. Buffet, Revised edition published by Harper Business Essentials in 2006. The original version was published in 1949.
- 10 -
2. Stability method This method is quite opposite to the residual dividend policy method, which is characterized by significant fluctuations of dividends. In the stability method there are distinguished two ways. One says that companies may choose a cyclical policy that sets dividends at a fixed fraction of quarterly earnings. Second states that companies may choose a stable policy where quarterly dividends are set at a fraction of yearly earnings. The main point of followers of the stability method is to eliminate the uncertainty for investors about the payout policy. 3. Hybrid method This method is a combination of two previous approaches. Followers of this method consider their company’s debt/equity ratio as a long term rather than a short term goal. This approach is by far the most popular method used by dividend payers. Even though these companies experience, like all other firms, business cycle fluctuations, they generally have one set dividend, which is agreed to be a small portion of yearly income and can be easily maintained.
The problem with dividend payouts becomes even more complicated when including in this discussion goals of the management board. The firm’s cash flows actually belong to shareholders, so the main goal of managers should be to distribute all the cash flows to them, unless the interest rate investors can get individually is higher than the one company can have at the same risk rate. The problem seems to be that retained earnings (internal equity) is cheaper than issuing new common stocks (external equity), because of high cost associated with the issue. Therefore mangers have incentives to retain earnings, which are added to the equity base, and this way decrease chances of being forced to raise external equity. Another matter with a sound influence on the dividend policy of individual company is the maturity of the firm. Relatively young firms need to have funds to grow and therefore they are very seldom sharing their profits with investors. Small companies prefer to reinvest their funds until the time they become big and important market participants with stabilized financial situation. Large businesses would not be able to grow without huge costs accompanying growth. What is more, the larger the business, the more difficult it is to stimulate the growth. Therefore, the main source of dividends on the market are usually companies in their maturity stage, in Boston
- 11 -
Consulting Group growth – share matrix located in a position called “cash cows”. They usually generate high profit margins which result in high operating profits, and do not require high loads of money for investments.7 The view presented in the foregoing paragraph relates to the today’s trends in dividend payouts. However, this theory evolved considerably since the paper of Miller and Modigliani’s about the dividend policy in 1961. Before that time, most of economists believed that on every stage of company’s growth they should always pay as high dividends as possible. This view, where the more dividends a firm pays, the more valuable it is was derived from the formula: ∞
V0 = ∑ t =0
Dt
(1 + rt )t
,
where: V0
– the value of a firm at date 0 (if first dividends are paid by the firm in the
subsequent period at date 1), Dt
– dividends paid by the firm at the end of period t,
rt
– the investors’ opportunity cost of capital for period t.
This formula conditions the value of the company only on dividends paid. However, economists knew that it cannot be the only important factor in measuring the value of a firm. Therefore, the started looking for other reasons that might determine this value and the dividend policies. First to challenge the view presented by the foregoing formula was Gordon in 1959, then Miller and Modigliani in 1961. According to Gordon, the retention of earnings and increased investments would increase the required rate of return. Even though increased investments would result in grow of Dt, required rate of return would grow faster as investments are more risky than dividends. Miller and Modigliani went even further in the view on dividend policy and pointed out that the most important thing for the firms’ value is its investment policy. Hence, their third proposition pointed out that the distribution of dividends changes only the mix of equity and debt, leaving market value of the firm unchanged (Miller and Modigliani, 1961). Their theory raised a sound discussion about the dividend policy issues and has been challenged by many economists, which is in details described in the 3rd chapter. 7
http://www.bcg.com/publications/files/Experience_Curve_IV_Growth_Share_Matrix_1973.pdf
- 12 -
2.5 Dividend dates
In this paper will be considered and observed the reaction of stock prices to dividends. Hence, it is essential to understand when companies make dividend decisions and when possible investors’ activity could be increased. The most important is the date when company announces its dividend for the period, usually simultaneously with its earnings level. Here the market reaction is supposed to be the strongest. There could be also a noticeable reaction in the day when shares are traded for the first time without the dividend attached. Before going any further all important dates should be clearly defined:
1. The Declaration (announcement) Date – This is the date when the board of directors sets the dividend and announces when the stockholders will get their checks. On the same day the liability is created in the company’s books in the amount equal to the sum of all dividends that are going to be paid. At this time also the ex-dividend date is announced to the public. The Commercial Companies Code under the Polish Law restricts the record date to fall within 2 months after the declaration date. However, on the polish stock exchange it is common that it takes only around 2 – 4 weeks from the announcement. Usually investors in advance have information about the board of directors meeting in which the earnings and dividends are announced. Besides, companies tend to announce earnings and dividends in similar periods every year. Depending on how positive or negative results investors are expecting, it is probable that the activity before and after the declaration date is increased. For instance, speculators who expect that company will announce higher dividends than it is expected by the majority of market participants, would collect shares from the market to sell them at a higher price when the official dividend information is revealed. 2. Record Date (D + 3) – This is the date when the list of shareholders, authorized to receive dividends, is set by the company. The important issue is that investors are required to own the stocks of the company before this date to be entitled to the dividend. Hence, for a plain investor more crucial is the exdividend date. The record date is announced on the declaration day by the
- 13 -
board of directors. It is unusual, but possible that the record day falls on the declaration day. This move allows the directors to reward with the dividend investors who already have shares of the company, and at the same time limits the speculative transactions around the record date. In such case the exdividend day falls before the declaration day. 3. Ex-Dividend Date (D + 1), also called the ex-date or reinvestment date – This is the date that usually falls from 2 to 4 days before the record date. It normally takes around 3 days to settle the regular stock sale or buy transactions, therefore this 2 – 4 day period allows for completion of all pending transactions before the record day. The ex-dividend date is also a day after which all shares bought and sold come no longer attached with the right to the announced dividend. If the stock is traded with a right to dividend it is said to be ‘cum dividend’. It is relatively common for stock’s price to decrease on the ex-date, by the amount equal to the dividend paid per share, which reflects the decrease in the company’s assets. However, due to the tax considerations and other happenings in the market the real drop in price might be slightly different than the cash value of dividend. If an investor does not own the stock before the ex dividend date, he would not be entitled to the dividend payout. What is the important on this date is that for all pending transactions that have not been competed by the ex-dividend date, the exchanges automatically reduce the price of the stock by the amount of the dividend. This is performed because, the payout of a dividend means reduction of the value of the company, as it is paid from the company’s cash reserves, and the investor would have to absorb that reduction in value (neither the seller nor the buyer are eligible for the dividend). 4. Payment Date (Distribution Date) – This is the date when the company mails the checks. In US it is usually around 2 weeks after the record date. In Poland it happens usually within a month after the record date. However, when the company pays out a substantive part of its profit, it is sometimes dividend into 2 installments, from which the second is usually paid a couple of months after the first one. Such situation is not common in the US, where more popular method is to pay quarterly dividends by companies, and therefore investors receive checks on average around every 3 months.
- 14 -
The payment date is just an ordinary day when the money is wired to the investors, without any influence on the existing outstanding stocks, hence no unusual investor reaction is expected.
The diagram below presents how the ex-date and the date of record are situated. As explained above, an investor has to be recorded in the company’s books on the day of record (D + 3) to be eligible for the dividend. To ensure that he is at that time in the books, he needs to buy shares at least three days before the date of record (which is called the D day), which happens to be a day before the ex-dividend date. On the other hand, if an investor wants to sell shares and still receive dividends, he shouldn’t make a transaction before the ex-dividend date, so he would still be kept recorded in the company’s books on the date of record. Selling shares before the ex-dividend date means selling away the right to the stock dividend.
Diagram 1. Connection between ex-dividend date and date of Record
Source: http://www.investopedia.com/articles/02/110802.asp
2.6 Dividend ratios
Investors before deciding weather to buy or not shares of a specific company, have to analyze the company and its place in the business. There exists a number of indicators which help assess the situation in the company and compare it with the benchmarks based on various data. In this paper we will focus only on the indicators including dividend ratios. They give information of how company is performing, if managers are willing to share the profits with the investors and how possible it is for the management to sustain the dividends at their current level. What we wish to find in this paper is the volatility of share prices in reaction to changes of dividend policies. Therefore price-dividend indicators should give investors some wider view
- 15 -
on how the relationship between these is changing. Below are presented four most popular ratios: dividend per share, yield, cover and payout ratios.
DPS DPS =
– Dividend per share total dividends paid number of shares in issue
Dividend per share is simply the amount of dividend that shareholders will receive over a year, for each share they own. This ratio is usually disclosed by the company itself, and doesn’t have to be calculated by investors. It is important to remember to include in DPS all regular dividends paid over the year. In the relatively young stock markets, dividends are paid usually only once a year, as it happens in Poland. However, in the well developed markets, where dividend plays a role of a regular cash inflow for investors, they are paid more often. For instance they are paid on quarterly basis in US and biannual basis in UK (Paxson and Wood, 1998). If a company decides to pay a special dividend, it should not be included in this ratio, since it is not a part of a company’s normal dividend policy. In such a case investors should not expect similar dividends in the future so they should be considered separately.8
DYR – Dividend yield ratio DYR =
dividend per share price per share
Dividend yield is often referred to simply as yield. It presents the rate of return that investors get from the shares they hold. In the absence of any capital gains, the dividend yield is the return on investment for a stock. To calculate it, the sum of all dividends over the year, except special dividends, has to be divided by the share price. There is however, no specific instruction what price should be taken. Therefore it is often take the current price of the share, and the historical dividend from the previous year. In the empirical part of this paper we will calculate the dividend yield as a dividend announced by the company, divided by the market price of shares on the announcement day. The dividend yield is typically low during market highs, and high during market lows. In US the ratio for the index Dow Jones Industrial Average (DIJA) was below
8
http://moneyterms.co.uk/dps/
- 16 -
3,0% in 1929, whereas, after the crisis, in 1932 it has exceeded 10%.9 In Poland in the last 10 years the official dividend yield for the market (WIG) fluctuated between 0,6% and 2,6%.10 At the same time the ratio for S&P500 companies was below the 2% level and for Dow Jones Industrial Average has fluctuated from 1,3% to approximately 2,5%.11
CR
– Cover ratio
CR =
earnings per share divdend per share
This ratio is very important for investors since it shows how many times dividends could have been paid out of the company’s profits. It is a measure of the ability of company to maintain the level of dividend paid out. The higher the cover ratio, the better ability of the company to maintain the level of dividends if the profit drops. Companies with stable profits can afford low level of cover ratio, but those with frequent fluctuations of profits should set it at a higher level to not risk decreasing dividends.
DPR – Dividend payout ratio DPR =
dividend per share earnings per share
The dividend payout ratio is the inverse of the cover ratio and shows the percentage of earnings paid to shareholders in form of dividend. It provides investors with the idea of how well earnings support the dividend payments. Usually the more mature a company is, the higher payout ratio it has. On the one hand high payout ratio is expected to be high, as it shows that company is willing to share its profits with the shareholders. On the other hand, low ratio represents relative safety of future dividend payments.12
9
http://www.sharelynx.com/chartstemp/MarksData.php http://www.gpw.pl/zrodla/e_informacje/periodical_statistic/Gpwsen.html 11 http://www.sharelynx.com/chartstemp/MarksData.php 12 http://moneyterms.co.uk/payout_ratio/ 10
- 17 -
2.7 Summary
Before proceeding with the specific theories about dividends in the following chapter, it seems crucial to sum up the main facts about the payout policy and its importance gathered by Allen and Michaely (2002). They have distinguished some empirical observations playing important role in understanding the discussion of payout policies in literature.
1. Large, established corporations pay on average higher percentage of their earnings in forms of dividends and repurchases than small and developing firms, which require high investments to grow. 2. In the historical times dividends used to be the most important way of payout to the shareholders. The situation has been changing since mid-1980s, when repurchases began their still increasing popularity. This trend shouldn’t have any influence for the company if we follow Miller and Modigliani (1961) who implied that share repurchases and dividends are prefect substitutes in perfect capital markets. The irrelevance theory from which it descends will be in detail described in the following chapter. According to the polish stock exchange market, which is still in its early stage, repurchases do not play any important role. 3. The number of companies paying dividends is steadily declining in favour of share repurchases.13, 14 4. Dividends are being smoothed relatively to earnings by the companies. In the observed period 1972 – 1998, as a result of market fluctuations, aggregate earnings fell five times, whereas dividends only twice, and by very small amounts. Smoothing process does not take place in repurchases which are still substantively volatile.
13
Detailed comparison of dividend and repurchase Policy is exlpained in charter 3.10. It is crucial to remember, that Allen and Michaely based their findings on the evidence from the US market. When they report that since the beginning of 1980’s firms have been switching from dividends to repurchases, polish stock exchange market didn’t even exist. This process might probably be observed in Poland in the following years. However, as number of dividend paying companies and the total amount of dividends paid is still growing, it might be concluded that repurchases in the upcoming years will still play a role of secondary importance in companies payout policies. 14
- 18 -
5. Allen and Michealy espouse that markets react positively to dividend announcements and increases, and negatively to their decreases. This phenomenon has been observed and described by many studies which will be mentioned in the following chapter.
The challenge for the economists has been to create a dividend policy framework that would maximize the shareholders wealth. According to the observations presented above, the framework should be consistent with them and should not be easily rejected by the empirical tests. The determinants of payout policies are presented in the following chapter in form of theories developed by various financial economists.
- 19 -
3. DIVIDEND THEORIES
One of the main puzzles in the corporate finance is the influence of the payout policy on a firm’s stock price. Despite years of theoretical and empirical research, including different data and factors, the problem of the relationship between stock prices volatility and dividend payout decisions has not been clearly explained yet. It is even considered by Brealey and Myers (2003) as one of the 10 problems not solved yet in finance. Literature is rich in various theories aiming to explain this so called “dividend controversy”. The main point, around which these arouse, is the discussion of signaling hypothesis, which says that a firm’s manager uses variety of signals to credibly convey information about the value of the firm’s investment opportunities to outside investors. This model has been formalized and presented as a dividend signaling theoretical model in the article of Battacharya (1979). The problem researches have been facing is the question if companies who generously distribute their net income to the shareholders are consistently selling at a premium over those which modest payout policy. One of the first to address this issue was Miller and Modigliani in 1961st in the article in which they presented and proved the irrelevance theory, which has been a subject of the countless debates. The goal of this chapter is to review the existing literature and discuss the results of individual empirical research. To evaluate if the stock price should change because of the payout policy, it is essential to observe first if it has any influence on the value of a company. There are number of theories focused on that problem, which can be grouped to different categories.15 This chapter will present what theories have researchers created to explain why managers pay dividends and why or why not they should influence changes in share prices around the announcement and ex-dividend days. The order in which they will be presented is as follows: first the dividend irrelevance theorem by Merton Miller and Franco Modigliani (MM), who created first consistent theory on that topic, then main arguments and relaxations of the MM 15
In his article, Dong et al. (2005) distinguished 10 different theories explaining investors attitude towards cash dividends. In particular they were: MM irrelevance theory, tansaction costs, uncertainty resolution, accounting manipulations, behavioral finance, free cash flow, agency costs, signaling, taxes and share buybacks versus cash dividends. In this paper first nine theories will be described, however, grouped in a way more consistent with the aim of this thesis. The last theory of the investor’s choice between cash dividends and share buy-backs does not fit in the range of this paper as it mostly focuses on the undervaluation of share buy-back programs.
- 20 -
model, which will lead us eventually to the signaling theory. In the second half of this chapter, different researches observing influence of various factors on the share prices fluctuations around dividend announcements will be presented.
3.1 Miller and Modigliani dividend irrelevance theory Miller and Modigliani (1961) found out that, despite many empirical studies, there was a lack of economic theory of valuation bearing directly on the matter of dividend policy. Some attempts to find an evidence of the correlation of dividends, stock prices and firm’s earnings did not give any clear answer and their authors left space for further research and improvements (Gordon and Shapiro, 1956). Actually, prior to Miller and Modigliani article most of the economists believed that the higher dividends companies pay, the more valuable their firms are. This point of view resulted from the company valuation model based on discounted dividends approach. It values a company based on an assumption that a stock is worth the discounted sum of all its future dividend payments, discounted by an appropriate risk-adjusted rate. The model states that if the first dividend is paid at date 1, then at date 0 the value of the company V0 is derived from the equation: ∞
V0 = ∑ t =1
Dt
(1 + rt )t
,
where: Dt
– the aggregate dividends paid by the firm at the end of period t
rt
– the opportunity cost of capital for the period t.
According to Gordon (1959), along with the retained earnings and investment increase, the required rate of return rt would increase either. Continuing, even though, the expected future stream of dividends would be larger in such a situation, Gordon argued that the effect of lower rt would overcome it. Rt might rise because of greater uncertainty linked with the increased investment. Miller and Modigliani found this way of valuing company incomplete and hence decided to demonstrate how does companies’ value change assuming different dividend payout decisions. The difference between their and Gordon’s model was that they based their theories on the investment policy instead.
- 21 -
Miller and Modigliani wrote in 1958, 1961 and 1963 their papers concerning the issue of the optimal capital structure. In 1958 they presented their first theorem, which states that the decision between debt and equity to finance a given level of investment does not affect the value of the firm (Miller and Modigliani, 1958). The second theorem states that under the same conditions dividend policy is also irrelevant. Investors are financially unaffected by a firm’s decision to reinvest earnings or distribute them as dividends to investors (Miller and Modigliani, 1961). Hence there is no one optimal payout ratio. There is a simple explanation of this statement. Shareholders, who are the owners of the company, receive returns in 2 main forms: dividends and stock price appreciation. When a company decides to share its profits with shareholders in a form of dividends, then, as showed in chapter 2, the stock price falls automatically by the amount of a dividend per share on the exdividend date. Therefore, overall shareholder’s returns are independent of dividend policy in a perfect market. However, to fully elucidate these 2 theorems it is essential to consider assumptions which make the financial world of MM frictionless and free of any informational asymmetry16. In Miller and Modigliani proposition there are 3 possible cases to consider, each proving that dividends do not affect firm’s value. First, when a firm has necessary cash to pay the dividend. The following implications are that the cash balance decreases when the dividend is paid as well as the equity account, which means that only financial asset and liability are changed. However, net operating assets remain constant; therefore the value of a company, including the just paid dividend, is the same as at the beginning. Second case is when company has to issue new shares to finance the payout to the shareholders. Miller and Modigliani argue that the sale of new shares increases the firm’s financial value, but at the same time the payment of dividends decreases this value. As long as shares are sold at their fair market value,
16
Assumptions necessary to hold in Miller and Modigliani world: 1.
Capital markets are frictionless;
2.
Firms can lend at the risk free rate;
3.
Individuals can borrow at the risk free rate;
4.
There are no costs of bankruptcy;
5.
Firms issue only two types of claims: risk-free debt and equity;
6.
All firms are assumed to have the same risk class;
7.
There are no taxes;
- 22 -
these two effects offset each other and the value of a firm remains unchanged. The last case assumes that shareholders require dividends, whereas a firm does not intend to payout its profits. But shareholders through their actions can alter the corporate dividend policy. If they require immediate cash they can sell part of their shares to another investor and this way create homemade dividends. If only the shares are sold at a fair market value, the value of a company remains still unaffected. This implicates that corporation can not do anything for the shareholders that they can not do for themselves. However, the homemade dividends decrease the shareholder right to the company, since he transfers a part of his stocks to another investor. The corporate finance theory concerning influence of dividends on stock prices since 1958 – the publication of the first Miller and Modigliani (MM) article – can be seen as a worldwide discussion and relaxation of MM theorems and their assumptions, to study the effect of every single imperfection on MM results. The driving force of following studies is the gap between the theory and practice. Already in their 1958 article MM encouraged researchers to test their assumptions as they were simplified so drastically in order to “come to grips with the problem at all” (Miller and Modigliani, 1958, p. 196). To give an evidence to the discussion about the controversy which this theory provoked, here are some examples of researchers testing and challenging MM’s position. On the one side, it’s crucial to mention very recent articles of De Angelo and DeAngelo (2006, 2007), who stay in contradiction with MM irrelevance theory. They argue that MM were wrong, because their model constrained firms to choose only among those policies that assumed distribution of 100% of free cash flow in every period. DeAngelo and DeAngelo (DD) in their article in 2006 espouses that relaxing that model to allow to FCF retention, still with the NPV of investment policy fixed, the choice of the payout policy is not irrelevant anymore. Also Ross (2005) is consistent with the De Angelo’s critique, analyzing firm working in an infinite horizon. His point is that if the firm’s value is less than its possible maximum value that could be realized across all feasible dividend streams, the value is left unrealized at infinity. Despite these good articles questioning the MM irrelevance theorem, there are more voices that support the position of MM. Among others are Sadka (2005), Goergen and da Silva (2005), Brennan (1971), Benninga (1978) or Hakansson (1982). Supporting MM view, they criticize models and assumptions developed by MM - 23 -
critiques. For instance, Berlingeri (2006), who claims that DeAngelo and DeAngelo (2006) are wrong saying that with retention allowed, even in the MM world dividend policy is relevant. He claims that when NPV of investment policy is fixed, payout policy is irrelevant in a frictionless world, even with allowed retention. The following parts of this chapter will show more discussion of the MM theory, according to specific dividend theory.
3.2 Transaction cost theory This theory concerns this group of investors who keep their shares in view of obtaining regular income from their investment. This situation is almost identical with the 3rd case considered in the previous subchapter about shareholders selling some part of their portfolio to get cash, if companies are not willing to pay dividends. Investors always have a choice of picking these companies, or those who generously share their profits. This problem was partly explained by Allen and Michaely (2003) who state that for small individual investors cost of selling stocks might be significantly higher than those of cashing in dividends; therefore they would prefer to pick the latter investment. However, Allen and Michaely in the same article argue that the foregoing argument does not seem to be supported by the time series evidence on transaction costs, nor by the stock ownership. They present three reasons to corroborate this statement. First, through the years the transaction costs of buying and selling shares have been substantially reduced. This should have resulted in lower demand for dividends in favor of selling stocks. Notwithstanding, the test conducted by the authors does not give evidence to this statement, as no reduction in dividend payments has been observed in relation to the change in transaction costs. Second, the argument of relatively high transaction costs of selling shares applies particularly to individual small investors. They usually hold small number of shares, and thus cost of transferring them may be higher. Nevertheless, the power of such investors is low and their role in the market has been shirking, whereas the overall amount of dividends in the economy does not follow this downward trend accordingly.
- 24 -
Third argument is that if high transaction costs of selling shares actually has substantial impact on individual investors decisions, then it should lead to an optimal dividend policy at the aggregate level. However, according to Black and Scholes (1974), firms adjust their dividend policies such that demand for dividends by their clientele is fulfilled. This means that in the equilibrium firms should be indifferent about their dividend policy. Summing up, even if this explanation endorses positive payouts despite the adverse tax consequences, it does not explain why in equilibrium firms still care about the level of dividends paid.
3.3 Gordon and Lintner uncertainty resolution Gordon and Lintner’s theory is even older than Miller and Modigliani and has opposing view on the dividend policy in the perfect capital markets. The main idea of it is that even in perfect markets, the uncertainty of future situation is a sufficient reason to change the price of a share (Gordon, 1959). Therefore investors prefer to receive certain money today than to wait for gains from a questionable future investment. In subsequent article Gordon (1962) adds that shareholders want to have hence higher dividends. This point of view is popularly called “the bird in hand” theory. For Gordon dividends represent such an important role in the value of stocks, that in his theory (popularly called Gordon Growth Model) he subordinates it to the discounted flow of future dividends. If dividends are going to grow at the constant rate in the perpetuity , the model can be stated as: P0 =
D1 , k−g
where: P0
– stock value
D1
– expected dividend per share in the upcoming year
k
– required rate of return
g
– growth rate of dividends (in perpetuity)
It is important to realize that dividends are received along with the capital gains from shares and that they can be separated after they are received. Therefore, if one considers dividends safer than returns from common shares, he can treat them as a
- 25 -
protection from possible future losses. Once they have been received, they cannot be lost, unless poorly reinvested. So after the dividends are diverted from their issuer, they should be considered as safe gains. This reasoning leads to a point that dividend paying stocks could be seen as a combination of risk free and risky securities, compared to only risky security like a non-dividend paying stocks. There have been numerous studies considering this model from which the majority strongly criticizes it. Bhattacharya (1979) claims that argument that agents find dividends superior to capital gains is fallacious not only in MM’s perfect markets, but also in the normal marketplace. On the other hand, Brennan (1971) in his article explains differences between MM and Gordon models, concluding, that the issue is too complicated and includes more factors to be considered to find a final solution to this case. Economists focus on the theoretical and mathematical solutions, often criticizing the “bird in hand theory” (among others: Bhattacharya, 1979, partly Brennan, 1971). However, the real world often seems to affirm it. Of course, this might be the effect of signaling theory (discussed later), but still the experience, of for instance late 90’s, validated Gordon and Lintner’s characterization of the riskiness of delayed dividends.
3.4 Tax preference theory The tax preference theory derives from the fact that historically dividends used to be taxed at a higher level, than other capital gains. That obviously was a good reason to prefer non-dividend paying stocks. Kalay (1984) supported this view, noticing that investors with high income brackets prefer to hold non-paying stocks, whereas those with low income tax brackets are more willing to invest in high dividend yield stocks. If investor required some regular income, he could make “homemade dividends”, which were explained in the subchapter 3.1. However, today in most of the countries all capital gains are taxed equally. The last country to pass this solution were USA, where the tax cut package was finally passed in May 2003. Even though today investors have to return in form of tax the same percentage of their gains from the share price increases and dividend gains, there still exists an asymmetry in timing of payment. Investors who receive profit in form of dividend are taxed for these gains in the same year. On the other hand, investors who keep their
- 26 -
shares without selling any part of their growing portfolio will be taxed in the year in which they finally get rid of the shares. That puts them in the favorable situation as this money that should be taxed can stay invested and create additional profits until it’s paid to the Internal Revenue. On the polish financial market all capital gains are taxed equally at 19% at the end of the calendar year.
3.5 Agency cost paradigm The agency problem is one of the oldest problems recognized in the corporate management. Its essence derives from the separation of ownership and management, and says that each agent would make decisions optimal rather for himself than for the good of the enterprise. Modern agency theory tries to explain capital structure of the company as a result of attempts to minimize the problems caused by the division of ownership and management. This basically means that companies where managers are also significant shareholders have low agency costs because there is high probability that they have the same goals as the owners. Even thought asymmetries in information between owners and managers do not facilitate the monitoring of the latter, it can still be mitigated by monitoring managers and their decisions by the market. Easterbrook (1984) espouse that dividends reduce the cash available for the company to invest; therefore it increases the frequency in which companies have to go to the equity market for extra capital. This pushes the firms to conform to the rules being in force in such markets, which is equal to high discipline and transparency of managers’ decisions. Such efficient monitoring holds back non-optimal investment decisions as well as increased consumption. Fama and Jensen (1983a, b) discuss another agency problem between bondholders and shareholders, emphasizing that they can be reduced by special covenants governing claim priority. Large dividend payments can circumvent these orderings; therefore John and Kalay (1982) suggest that debt covenants are necessary to protect the bondholders from loosing wealth in favor of shareholders. However Kalay (1982) proves that the dividend policy is not the major source of bondholders’ wealth reduction, since his research shows that firm’s payout levels are below the maximum level allowed by the constraints, it still works properly as a limitation to of agency costs. However, De Angelo (1990) studying 80 NYSE firms that experienced losses
- 27 -
during 1980 – 85, finds out that debt covenants influences dividend decisions of even the largest firms, which gives support to the agency view of dividends. To conclude these researches about agency problems, it is worth to mention La Porta et al. (2000), who observed that dividend policies differ clearly across the countries with various investor protections.
3.6 Behavioral theory Schiller (1984) indicates that investor’s behavior is influenced by societal norms and attitudes, which is normally ignored by financial researchers and theoreticians. The reason is that human behavior is difficult to be implemented into financial or statistical models. Including these behavioral factors in modeling would definitely strengthen and enrich the corporate dividend policy theory and help to explain many problems. The behavioral theory is mainly build on ideas of Thaler and Shefrin (1981), later developed by Shefrin and Statman (1984), who suggested that investors prefer dividend paying stocks more than home made dividends because of self-control problems. Its idea is that investors want to restrict themselves from consuming too much in the present and therefore allow themselves only to spend resources received from regular income – dividends. The most common example here is older people who do not receive high income, and therefore would prefer any regular payoff possible from their investments. Another motive for investors to prefer dividend paying stocks are prospect theory and regret aversion arguments mentioned by Shefrin and Statman. Their value is based on investor’s perception of capital gains and dividends. In case of low capital gains, dividends pay a significant role as a kind of satisfaction. When, on the other hand, share prices are growing then investor considers them separately as 2 supplementary gifts. The need for a steady stream of cash flows may describe the actions of small retail investors, but may not hold in case of corporate and institutional investors. Therefore the behavioral theory is more persuasive when the individual investors are the dominant force in the market. As Allen and Michaely (2003) showed in their research,
- 28 -
the dividend payout does not decrease with the time, which weakens the behavioral theory.
3.7 Free cash flow hypothesis Free cash flow hypothesis is a link between two theories: already described in 3.5 agency paradigm and the signaling theory, which will be described in details in the second part of this chapter. Free cash flow is basically the amount of cash that would remain after all positive net present value projects are commenced. Hence company’s decision to pay off its income determines amount of funds available further for managers to invest or consume in any other way. The company is run by managers on behalf of its owners and therefore should maximize the value for its shareholders. Therefore prudent managers in the ideal situation should pick only the investment opportunities with the highest NPV. However, in goal to expand the size of the firm, the inefficient use of funds takes place and often negative NPV projects are undertaken. This overinvestment theory has been a subject of paper of Jensen (1986), who linked this assertion with the agency theory, showing that managers of larger firms expect to be paid more, which is obviously not the aim of their company. So there here are two opposing situations. Or managers restrain from paying dividends and go into not always profitable investment opportunities, or pay dividends and in this way reduce the amount of free cash flow available for themselves, reducing overinvestment problem. This theory as a link between signaling and agency theories should explain better the dividend theories than either of those alone. However, according to Myers (1987) free cash flow might be with better results used rather in explaining corporate takeovers in the 80s.
3.8 Signaling theories Signaling hypothesis originates from the information asymmetry between managers and shareholders. This topic has been widely discussed in the literature and includes numerous studies concerning individual factors that might have signaling attributes as well as general studies about the dividend announcements. Signaling
- 29 -
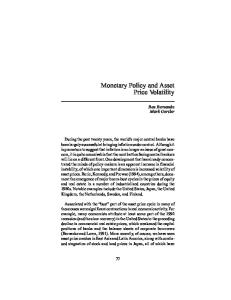
models were developed by Miller and Modigliani (1961), Battacharya (1979), Hakansson (1982), John and Williams ( 1985), Miller and Rock (1985) among many others. Of the significance of this theory might prove the importance that some researchers put on it. Almost all of the financial articles about dividend policies could be divided into two groups: first that suggest signaling effects of such and second that supports view that dividends do not carry any relevant information. Signaling theory assumes that mangers typically have more information about the value of the firm’s assets than outside agents. Managers therefore use dividend changes to communicate to the shareholders the financial situation of the company. Hence some financial economists reckon that it is possible to gain abnormal return when the information of the dividend announcement is published. Asquith and Mullins (1986) demonstrated on their sample that initiating dividend payments generates such strong signal, that it generates positive abnormal return of 5%.
Figure 1. Abnormal Stock Returns for Initial Dividend Announcements.
*Day 0 is (he publication dale in The Wall Street Journal. Since The Wall Street Journal is a morning newspaper, the information in articles is often made public before the end DI' trading on the day before publication. For this reason the abnormal returns for days - 1 and 0 have been aggregated to arrive al the announcement day return reported above.
Source: Asquith and Mullins (1986). Signalling with Dividends, Stock Repurchases, and Equity.
Asquith and Mullins (1986) repeated the same test for a sample of firms, characterized by subsequent dividend increases within the 3 years of the initial
- 30 -
dividend. The results were not as spectacular as in the above-mentioned test, however gave statistically important average abnormal return of 1% on the announcement day. Figure 2. Abnormal Stock Returns for Largest Subsequent Dividend Increase.
*Day 0 is (he publication dale in The Wall Street Journal. Since The Wall Street Journal is a morning newspaper, the information in articles is often made public before the end DI' trading on the day before publication. For this reason the abnormal returns for days - 1 and 0 have been aggregated to arrive al the announcement day return reported above.
Source: Asquith and Mullins (1986). Signalling with Dividends, Stock Repurchases, and Equity.
Signaling suggests that managers, who are expecting abnormal returns in the future, would be more willing to share the earnings with the shareholders, since they expect that in any way they will have enough cash flows to undertake all their projects with expected positive, high NPV. If managers predict to have losses or decreasing profits, they would prefer to keep today’s surplus for the future. Therefore it is not surprising that some of empirical studies strongly support the view that dividend changes are followed by subsequent price reactions. It is however important to notice that investors react more impulsive for reductions in dividends than for increases. Another crucial thing is that investors do not look at the $ amount of dividends, but at the dividend/price ratio, therefore the change in dividend as a percent of a share price is more significant than amount of cash paid out.. Besides shareholders get easily used to the level of dividend, hence they are expected to react stronger to increases in dividends and only slightly or even not react, to dividend payout on the unchanged level.
- 31 -
Baker (2004) proves accuracy of this theory by controlling the nonpayer market to book value and explaining whether dividend premium has residual explanatory power. Nissim and Ziv (2001) used a linear model of earnings expectations and also find evidence of positive correlation of dividend changes with future earnings changes. On the other side is paper of De Angelo (1996) who sampling 145 NYSE firms espouses that dividends are not informative signals because of behavioral bias of managers – overoptimism. Making decisions about dividend payouts they often overestimate company’s future growth and profits. Grullon et al. (2002) shows in his empirical study that firms that increase dividends experience significant decrease in their systematic risk, and vice versa. They show that when a company’s dividend ratio grows, the company does not increase its capital expenditures and experience a decline in profitability (Grullon et al., 2005) in the subsequent years. Therefore the positive market reaction to that decision is believed to be related to the following decline in systematic risk. Some recent studies (e. g. Benartzi et al., 1997) document that dividend changes reflect mostly current and past earnings but are not related to the future performance. Dong et al. (2005) expands the theory, basing on the accounting reasons, saying that the important reason why companies actually pay dividends is resulting from that their positive publicity. Enterprises are considered as honest when pay regularly healthy dividends and therefore are less subjects to any kind of manipulations. Apart from that, low profitable investments and improper accounting emphasize advantages of paying cash to investors over retaining it and reinvesting. Good explanation of basics of this theory gives Barron in the Wall Street Journal article citied by Dong: “Dividends are paid to companies that grow earnings over a longer period of time. [Buying dividend-paying stocks] is a way of getting into growth through the back door, in a lower risk way.” Summing up, researchers following this theory claim that its usefulness comes from the fact that dividend policy seems to be the cheapest way to inform shareholders and market about the situation in the enterprise. There have been a variety of modifications of this theory, focusing of different aspects of dividends and their signals’ importance. In the following parts more researches will be presented, focused on signaling effects and influence of the theories on possible price changes around the announcement days.
- 32 -
3.9 Literature review on the signaling context of dividend payouts Previous parts of this chapter presented theories trying to explain if dividends convey any information, and therefore if they should result in changes of share prices. This part’s goal is to sum up researches about this issue, mostly focusing on extensions of signaling theory which has been widely discussed in the literature. The reason for its popularity lies in the difference between the theoretical discussions and actual price fluctuations. Since investors react more impulsively on dividend ratio changes, researchers try to find out what has the strongest influence on prices. This part should give clear understanding what factors do have significant meaning for investors, and therefore influence their decisions.
From the corporate finance theory it is known that the price of an asset is equal to the expected discounted cash flows that it generates. Following Sadka (2007), there are therefore only 2 factors that might affect prices: expected discount rates and expectations regarding future cash flows. Research by Campbell and Shiller (1998) and Campbell (1991) on stock price volatility documents that variation in expected returns explains most of the variation in the aggregate dividend-price ratio, whereas the variation of expected cash flows does not have such an effect. Similar results obtained Fama and French (1988, 1989) observing that dividend yield predicts returns but not dividends. The study by La Porta et al. (2000) is one of the few studies examining explicitly the correlation between corporate governance and the dividend policy. They studied the dividend policy of 4000 companies in 33 countries to find out that in countries with high shareholder protection, companies pay on average higher dividends than companies in countries with low shareholder protection. Brickley (1983) study focused on special dividends of sample of US firms revealed that in an overwhelming majority of cases these special dividends frequently reflects shifts in dividend policy rather than just transitory increases in dividends or earnings. DeAngelo and DeAngelo (1990) and DeAngelo et al. (1992, 1996) studying US companies, have documented the aversion of managers to cut and omit dividends. Their first article suggests even that managers in order to omit reducing dividends in
- 33 -
the future prefer to reduce them today. Similar results were obtained in the study of UK firms by Edwards and Mayer (1986). They argue that managers would keep paying their dividends unless they face a permanent reduction of profits. This might be a reason of the management style, since Dewenter and Warher (1998) comparing US and Japanese firms came to the conclusion, that Japanese firms more flexible change their dividends ratio in response to earnings changes. The explanation for this difference might be that Japanese firms belong to Keiretsu groups where banks own both debt and equity and therefore carefully monitor all decisions of managers. Also in contradiction to DeAngelo et al. (1992) stays Goergen et al. (2005). They studied German firms and observed that 80% of firms which incurred losses, with at least 5 years of positive earnings and dividend preceding the loss, decided to omit the dividend in that worse year. The second observation was that the same companies quickly reestablish dividends at the level before the omission or cut. This proves higher flexibility of German firms’ dividend policy over US and UK firms. Focusing on the signaling effect, most of the studies on this subject are, according to DeAngelo et al. (1996) focused on dividend payouts in special contexts or, according to Watts (1973), who has examined a sample of dividend changes, have only trivial information content of future earnings. Proving the signaling content in special context DeAngelo et al. (1992) in their study came to conclusion that companies which are in financial troubles and report an annual loss, have superior chances to perform well in future when announce a favorable dividend decision. Miller and Rock (1985) reported that the dividend decisions reflect only current situation in a company and has no or only a little signaling effect about expected future firm earnings. Similar results were achieved in a study of stock market reactions to simultaneous announcements of dividends and earnings by Leftwitch and Zmijewski (1994). Even an argument that dividend increases have signaling effect, because of managerial comparatively higher knowledge about company’s performance and future plans, has already been rejected by some studies. Jensen (1993) stated that managers are naturally overoptimistic, which leads them to a positively biased view of their company performance in the future. According to this study, managers recognize too late the good state of their company and often decide to reward the shareholders when the high prosperity period is coming to an end. This over optimism is also supported
- 34 -
in the article of Roll (1986) who argues that managers overestimate the positive impact of corporate takeovers. Very recent study of Gugler (2003) concentrates, on the other hand, on an influence of the shareholder structure on a dividend payout policy. His research of Austrian firms reveals that state owned companies are more generous in their payout policy than family-controlled firms. Additionally, the latter groups’ dividends ratios are more variable in time, as only the former group practices dividend smoothing.
3.10 Repurchases Corporations in many countries are allowed to buy back their own shares from the market, which is popularly known as stock or share repurchases. This operation is often compared with dividend announcements, and considered that could have similar signaling effect on stock prices (Asquith and Mullins, 1986). Vermaelen (1984) espouses that repurchases lead to significant abnormal returns of approximately 15% on average, after the initial repurchase tender offer announcement. The similarity between dividend payouts and repurchases resides in the distribution of profits to the shareholders. When a company announces a repurchase tender offer, it decides to buy back some fraction of its outstanding equity for the then agreed price per share. The price is usually higher than the actual market price to encourage investors to sell their part of firm’s equity. The main difference between this method and dividend payments is that in case of dividends, every investor who owns shares is entitled to receive part of company’s profit. On the other hand, in repurchase method, only investors who decide to sell part of their shares are rewarded with the higher income. It is therefore interesting if companies and investors view these two methods as substitutes. In works of Bhattacharya (1979) or Miller and Rock (1985), who were addressing the issue of payout policies, there is no distinction between dividends and repurchases, which implies that they are considered by these researches as perfect substitutes. Also Allen and Michaely (2002), mention that the agency theory implies substitution of these, however not perfect. This is because in both cases money is taken from the managers and thus the chance of management abuse is reduced. However, dividends are expected to be regular and hence managers have to take care to maintain them at a stable level over years, so they present a
- 35 -
stronger management commitment. On the other hand, theories based on differential taxation between these methods (John and Williams, 1985) show that these payout policies are distinctly different. For years, US companies preferred to pay out cash in form of dividends rather than share repurchases, despite the tax advantage of capital gains over ordinary income. However, over the last 20 years repurchases have been becoming more and more popular. In the U.S. the value of expenditures on repurchase programs relatively to total earnings, rose from 4,8% in 1980 to 41,8% in 2008 according to Grullon and Michaely (2002). The growth of dividends was in these years much slower, hence in consequence share repurchases as a percentage of total dividends increased from just 13,1% in 1980 to 113% in 2000. Year 1999 was the first in history when corporations in US spent more money on buy back programs than on dividend payouts. This information is important for the purpose of this thesis to show that with the increase of share repurchases, today investors might not pay that much attention to dividend announcements as they used to in historical times. If considering that the signaling theory may hold, this means that the importance of dividends is diminishing, because now management might prefer to communicate with the investors using alternative methods of payout than just dividends. In Poland, as mentioned before, there is no tax preference between these two methods of payout policy, hence here investors should be indifferent considering tax reasons. In 1999 there was no repurchases observed in the polish exchange market, whereas in 2006, 12 companies decided to buy back their shares17. This number is still much lower than number of companies paying dividends, which amounted to 85 in year 2006, therefore it should not have such a significant meaning for the investors as it has in U.S. Thus, it can be assumed that polish market participants reactions to dividend announcements might still be significant. These reactions are discussed in the subsequent part of the thesis.
17
Information from the WSE Fact books available from the WSE official website http://www.gpw.pl/gpw.asp?cel=e_informacje&k=3&i=/publications/publications&sky=1
- 36 -
Figure 3. Distribution of firms by payout method in U.S.
Distribution of firms by payout method. This figure depicts the distribution of firms by payout method for a sample of U.S. firms. We determine the payout policy of a firm by observing the cash disbursements of the firm over a period of a year. The data sample consists of all firm-year observations on Compustat (Full-Coverage, Primary, Secondary, Tertiary, Research, and Back Files) over the period 1972-2000 that have available information on the following variables: REPO, DIV, EARN, and MV. REPO is the expenditure on the purchase of common and preferred stocks (Compustat item #115) minus any reduction in the value (redemption value) of the net number of preferred shares outstanding (Compustat item # 56). DIV is the total dollar amount of dividends declared on the common stock (Compustat item #21). EARN is the earnings before extraordinary items (Compustat item #18). MV is the market value of common stock (Compustat item #24 times Compustat item #25). The data sample contains 136,646 firm-year observations and excludes banks, utilities, and insurance companies. Source: Grullon and Michaely (2002). Dividends, share repurchases and the substitution hypothesis.
3.11 Share reactions to dividend announcements Finally there is an issue of the influence of dividend changes on the stock prices. Market efficiency dictates that excess returns to all dividend announcements should not vary significantly from zero.
- 37 -
However, as was mentioned earlier, there are numerous studies examining influence of dividend changes on the stock prices, presenting the whole range of results and explanations. On the one hand there are studies, for instance of Charest (1978) and Woolridge and Ghosh (1985), to document that decreases in dividends are correlated with substantial share price decrease. On the second hand a lot of studies documenting that dividend increases are associated with share price increases (Charest, 1978, Aharony and Swary, 1980). However the stock price increases in these cases are so marginal, that assuming high level of significance in the statistical tests, they would probably be considered insignificant. Asquith and Mullins (1983) agreed with Aharony and Swary, that dividend announcements convey information stronger than that contained in any other announcement. In their opinion, however, dividend initiations and subsequent announcements do in fact increase the shareholders wealth. Which might be surprising, they espoused that the latter might have even stronger influence than the initial dividend payout decision. Similar results showed Kalay (1982), who re-examined documentations of empirical evidence of the behavior of stock prices around the ex-dividend day. He inferred that the positive correlation of dividend and stock increases might be a result of an incomplete adjustment for the normal daily fluctuations and the use of closing prices on the exdividend days. It is important, though, to notice that this attitude of changing dividend ratio and share prices in the same direction gives support to Gordon’s “bird in hand” theory. Kalay and Loewenstein (1985) observed a three-day period surrounding dividend announcements and came to the conclusion that actual returns in that period distinctly excess returns predicted by the market as well as average daily returns realized over recent periods. The also observed that these excess results persist to up to 4 days after the announcement. However, Eades et al. (1985), testing a sample of events where announcement days were separated clearly from ex-dividend dates, observed that there was no such sluggishness in their subsample. Bajaj and Vijh (1995) confirmed these results, pointing out that the average excess return to dividend announcements increases stronger for firms with the lowest stock prices, than for those with high prices. Researchers explain that phenomena with microstructure based reasons such as: “spillover of tax-related trading around ex-dividend days and trading behavior related to the dissemination of dividend information”. (Bajaj and Vijh, 1995, p. 256). Consistent study performed Eades et al (1994) who distinguished his observation into - 38 -
two groups: high-yield stocks and low-yield and all-taxable stocks and all. They observed higher returns variation for the first group on the ex-dividend days. At the same time, average results of this group were statistically not significantly different from zero, even though sometimes positive and sometimes negative for some periods of time. To the contrast, the sample of low-yield and all-taxable stocks was characterized by positive and significant results. Karpoff and Walking (1988) documented similar effects inspecting tax arbitrage around ex-dividend dates. They point out that excess returns, because of high transaction costs, should be eliminated by the tax-arbitrage trading around exdividend days. Here again small firms and low-priced stocks, for which transactions costs are relatively high, are subject to exceeded returns. This suggests that investors around ex-dividend days tend to change to short-time traders. That tax-motivated trading puts pressure on stock prices to grow and overstate the measured excess returns around the announcement day. Bajaj and Vijh (1995) claim that these overvalued stocks will eventually go back to their fair level, but only after the price pressure disappears after the ex-dividend day. Since a number of studies report the linkage between dividend policy and share price risk, researchers look for different models that might explain the best explanatory power in this issue. Allen and Rachim (1996) in their article mention some variables after Baskin (1989), which should have impact on the stock returns as well as on the dividend yield. One of these factors is the size of the firm. Small firm, which are less diversified than large firms and have fewer investors without extended knowledge about arbitraging price fluctuations, are more unstable and their share price reactions are expected to be more volatile. Another interesting factor is the rate of return. It is suggested that firms with low payout ratios and dividend yields are valued more in terms of their future investment opportunities, whereas companies with high dividend yield are valued based on their “assets in place”. If the company has large investment opportunities, it would probably prefer, to keep its earnings to reinvest them profitably. However, for investors the future return from the investment is not certain, therefore forecasting these returns is subject to error of prediction. Therefore, following this argument, stocks with low dividend yields should experience lower volatility. Allen and Rachim (1996) in their study found support for influence of these two factors: payout and size, to have a negative significant effect on stock price volatility. - 39 -
There is also a group of articles that investigates the so called ‘post-earningsannouncement drift’. The evidence for such found among others Bernard and Thomas (1989), who concluded that this phenomenon occurs because prices do not react immediately after the announcement of earnings, but with a delay. Based on these findings, Michaely et al. (1995) investigated short and long-term effects of dividend initiations and omissions announcements on share prices volatility. The observed short-time effect of dividend omission has negative and that of initiation has positive impact on price. Moreover, the effect on omission is twice as strong in magnitude as one on the initiation. Even though the change in yield is about seven times larger for omission announcements, for a given yield the market reaction to both considered actions is almost the same. In the long-term authors observed drifts following announcements of initiations and omissions of dividends. There are 4 reasons mentioned in the article, which make this drift surprising. First, it works against the efficient market hypothesis, as predictable excess returns are always surprising. Second, firms that omit dividends had experienced losses before, therefore it shouldn’t have such a strong reaction afterwards. Next, the drift is different than that observed by other authors (for instance Bernard and Thomas, 1989), as it does not appear around the earning announcements, and last much longer. The last reason is that there is no change in volume or clientele, which leads to a conclusion that the drift is caused solely by a price pressure. Lee and Yan (2003) found all these theories about dividends and prices confusing and decided to test their accuracy. Because some authors were supporting signaling hypothesis in their empirical studies, and some completely rejected it, stating that dividends signal only current and past earning (Benartzi et al., 1997), Lee and Yan introduced a new model to be tested. The innovation here was to divide the sample of firms into backward looking dividend decisions, that actually signal current and past earnings, and forward looking dividend decisions, which convey superior manager’s information about future earnings. Results are strongly consistent with the signaling model, as the study does not present market reaction to the former group. However, it responds strongly to the latter, forward looking sample. Interesting research was performed by Michaely and Vila (1996) who focused not on the price volatility, but on the trading volume. In their model, some factors were tested with possible impact on the amount of trade. Among others, they found that the trading volume is positively correlated with the dividend yield. Another finding was - 40 -
that stocks characterized with higher transaction costs have also abnormal volume, however lower than those with low transaction costs. This chapter reveals a puzzle that arouse around the dividend problem. Researches have been struggling for the past 50 years trying to explain the actual reason for dividend decisions and then, their direct and indirect influence on the share prices. 8 main theories explained briefly in this part show that, there is still no comprehension in dividend problem. Most of the recent articles focus on declining or proving the existence of signals in managers’ decisions about the payout. However, other theories still hold, as signaling effects existence or its lack can be attached to almost all theories. The problem is that even empirical researches give often contradicting results, like the example of the correlation of dividend changes on changes in profitability (Chapter 3.8). Another important issue is the magnitude of changes of share prices as a reaction to that payout decisions. The last part of this chapter presented a couple of researches of price volatility around the announcement days, exdividend days as well as in a long-term after such payout decisions. Cited authors agree that there exists a higher trading volume at that time. There is also comprehension about the higher volatility of prices, however, without clear agreement for the reasons and significance of such. Proper observation of this phenomenon would help managers predict results of their decisions about dividend payouts. Moreover, it would definitely help short time traders, who increase liquidity at the market, to realize short fall gains or omit fast and unpredicted price reductions. The reaction of share prices after dividend announcements has a sound number of researchers. However, most of them did their examination on the US stock exchange market, which characterizes maturity and experience. Though, there has not been much examination of this kind on comparatively new markets, where companies do not have historical track of dividend payments, and where payout policies are not clearly understood. An example of such a market is definitely the polish stock exchange market, which has came to the existence on the 16th April, 1991. The next chapter will give a short introduction to this stock exchange market and deliver detailed data about companies and their payoff policies.
- 41 -
4. DIVIDEND POLICY BACKGROUND IN POLAND
4.1 Organization of Polish Stock Exchange Market
The polish stock exchange came to existence in 1817 and due to the Second World War and the centrally planned economy after that was closed for more than 50 years. It was then reopened on the 16th of April, 1991st. The organization created to organize trading of financial instruments is Warsaw Stock Exchange (WSE). The WSE is a joint stock company established by the State Treasury (which holds 98,81% stake in its share capital), and controlled by the Polish Financial Supervision Authority (PFSA). Financial Instruments are traded on two markets: the Main List and the NewConnect. Only the first one is a regulated market, which is recognized by the European Commission, thus in this paper we focus only on companies listed in the Main List. The WSE is operating from the very beginning an electronic trading system. Responsibility of handling clearing and settlement of transactions together with safekeeping of financial instruments is held by National Depository of Securities (NDS), and thirdly by brokerage houses, which are intermediaries in market transactions. The National Bank of Poland (NBP) is used by NTS as a clearing bank. The main index on the WSE, representing all the companies listed is called WIG. Other important are: WIG20, which includes 20 companies with the highest market capitalization, TechWIG, representing technological firms, mWIG40 and sWIG80, representing 40 medium and 80 small firms respectively.18
4.2 Beginning of trading on WSE
During the first trading session only 5 former state owned companies were listed. Through initial private offerings (IPOs) and privatization, number of listed firms increased to 9 at the end of the first year, number 100 was exceeded eventually in 1997. Before 1994 trading sessions did take place only couple of times in a month. From 1995, number of trading days a year oscillates between 249 and 251, which 18
All information available on the official website of WSE http://www.gpw.pl/index.asp.
- 42 -
means that companies are quoted on every regular working day. To traders, besides shares of companies, are available also other financial instruments. Bonds are available since 1992, future contracts since 1998, options were introduced eventually in year 2003. Today there are 354 companies listed on the Warsaw Stock Exchange, from which 24 are foreign corporations. The capitalization of polish companies amounts to PLN 443,8 billion and foreign companies to PLN 468,4 billion. The daily turnover in 2007 exceeded PLN 1,9 billion a day. These amounts prove that polish stock exchange market has incredibly strengthened its position during its 17 year history and right now holds a position of a mid-sized European exchange and one of the two largest in Central and Eastern Europe.19
Table 1. WSE main statistics.
Year
Domestic market Listed cap compa (PLN nies mil.)
Share turnover value (PLN mil.)
WIG index change (%)
Number of trading days
Com new of which pani listi foreign es ngs
deli stin gs
03.2008 2007 2006 2005 2004 2003 2002 2001 2000 1999 1998 1997 1996 1995 1994 1993 1992
443 823 509 887 437 719 308 418 214 313 140 001 110 565 103 370 130 085 123 411 72 442 43 766 24 000 11 271 7 450 5 845 351
354 351 284 255 230 203 217 230 225 221 198 143 83 65 44 22 16
103 728 479 480 338 696 197 033 119 518 80 235 63 668 80 599 169 273 89 343 62 382 52 342 29 895 13 671 23 420 7 873 228
-13,72 10,39 41,60 33,66 27,94 44,92 3,19 -21,99 -1,30 41,30 -12,80 2,30 89,10 1,50 -39,90 1095,30 13,20
62 249 251 251 255 251 249 250 250 249 250 249 250 249 188 152 100
354 351 284 255 230 203 217 230 225 221 198 143 83 65 44 22 16
24 23 12 7 5 1 -----------------------
5 81 38 35 36 5 6 9 13 28 57 62 18 21 22 6 7
1991
161
9
30
-8,09
36
9
---
9
P/E
P/ BV
Divide nd yield (%)
2 14 9 10 9 19 19 4 9 5 2 2 0 0 0 0 0
12,8 17,7 13,5 15,5 24,4 79 70,3 15,9 28,5 36,2 16,3 13,2 12,4 7,8 16,4 13,3 3,4
2,08 2,82 1,95 2,06 1,86 1,51 1,35 1,28 1,98 1,91 1,43 1,33 1,96 1,47 3,43 2,14 0,6
1,8 2 2,6 1,8 1,5 1,6 1,3 1,3 0,8 0,6 0,9 1,3 1,2 2,3 0,4 0,4 5,5
0
4,1
0,47
0
Source: Table prepared based on information from the WSE main webpage with the data from : http://www.gpw.pl/zrodla/e_informacje/periodical_statistic/Gpwsen.html
19
All information available on the official website of WSE http://www.gpw.pl/index.asp.
- 43 -
4.3 The evolution of the Exchange Market Since the beginning of the existence of polish stock market could be observed the evolution of the payout policies among the companies listed. The first period lies between 1991st and 1993rd, and is popularly called the experience time. The political and economic situation together with the lack of experience of companies and market traders were not conditions supporting the dividend payout. This time was characterized by high stock prices yield and very high inflation leading to the depreciation of equity capitals, which was an incentive for the managers to keep the profits inside the business. Another important reason for not sharing the profits with the shareholders was lack of experience in sharing the gains on capital with the owners of that capital in Poland. Managers used to consider only two beneficiaries of the payout policy: the budget and the employees. What is more, investors satisfied with the high yield of their shares did not expect gains in form of dividends. The second period started 1994th and was an attempt to create an adequate strategy which would reflect a balance between company’s equity needs and profits required by investors. The companies listed on the polish stock exchange in need of sources for investments started to look for other capital sources than already known new stock issues. At that time, lowering inflation allowed the National Bank of Poland to decrease the interest rate, which resulted in higher propensity of managers to invest using money from bank credits. Some companies where even forced to announce new shares issues to keep their target capital structure. Simultaneously, growing number of new companies listed on the stock exchange in Warsaw quarterly, pushed managers to compete in interesting new investors in the shares they offered, for instance with dividends. At the beginning, investors were not satisfied with its level. However worsening financial condition of public companies starting from 1995 didn’t allow to setting the payout policy on any higher level. Number of companies even decided to suspend paying dividends for some time, informing in advance investors about the situation. In the end of the ‘90s, it was already obvious that simultaneously with the development of the capital markets rose the investors knowledge about the market. Their approach to the gains from the stock exchange started to stabilize as they realized that dividends are easier to predict than always uncertain and fluctuating
- 44 -
capital gains. Investors knowing projected profits for the upcoming years with a prior decided dividend policy, could predict how much can they expect from their investments. It was much easier than to predict capital gains, which are variable depending on the growth level of the enterprise, its financial condition, changes in the market situation and reactions of the stock exchanges abroad to the international flows of capital. Some managers understood the concerns of their shareholders and to limit the risk attached to the investment, tried as much as it was possible, to develop a stable plan of dividend payouts. M. Sierpińska in her work in the 1999th accumulated information about the dividend policies in Poland in various companies, divided into industry sectors. Her research focused on heavy industry, banks, non-bank services and companies offering constructing and building services representatives. From the conducted research it became clear that the characteristics of the industry or special features connected with each do not determine the dividend policies of their companies. Significantly higher importance has the financial condition of firms and their ability to reinvest the retained profits. The second finding was that in the 1998th, when the research was conducted, the majority of the firms listed on the stock exchange have not had their payout policies determined yet. It could be assumed that some companies used to decide to pay dividends from the leftover after all the necessary investments have been covered. There is, however, no clear evidence for that and some more research would be required in this field. The third finding in the book is that the only companies which could be assumed to have a relatively stable dividend policy are companies active on the stock exchange already for a couple of years, which additionally have yet issued new shares to get access to extra funds. There is only a couple of such enterprises which paid a fixed dividend per share in nominal or real terms. In result, in years of lower profit, its high percentage had been transferred to the shareholders. This kind of policy could only be held by entities with guaranteed or growing profits, since their growth would not be delayed because of the payout of funds. Some more companies kept the fixed dividend percentage from the profit and some aimed to do that as emphasized in their annual reports. The last important finding is that no company paid a dividend in a year when it experienced loss, which means that no-one used decreased their reserve capitals for that reason. However, the usage of this source of capital had been observed in a small
- 45 -
group of firms with low profits, which aimed to keep their dividend policy unchanged before the planned share issue. From the year 2000 until now, there could be observed the continuous development of the polish stock exchange. In the first years of WSE operating, there were no market regulations which would require any minimum standards of financial disclosure for firms. The implementation of corporate governance practices by WSE started in the year 2001, following the other countries in the region. The first step was creation of Best Practices Committee, consisting of the government and industry representatives, which goal was to set the Best Practice Code for the companies. This Code has been changed couple of times based on practical experience as well as EU recommendations. In August 2006 there were only 5 companies listed, which did not fill the declaration of best practices. Moreover, today shareholders rights are protected by such institutions as World Bank or Polish Forum for Corporate Governance (PFCG).20 After Poland became the member of European Union in 2004, the market became more available for international investors and companies. The total market capitalization grew from PLN 130 billion in year 2000 to PLN 509 billion in 2007. To more than twice as much amounted the capitalization of foreign corporations listed on the polish stock exchange. Number of local companies listed increased as a result of the IPOs of small and medium sized companies with private origins. Also, from the year 2000 the dividend yield has been significantly higher than in 90s. It has eventually resulted in a great increase in amount of money paid in dividends in the last years, which is presented in the graph below.
20
Wharton Financial Institutions Center Working Paper no. 07-09, issued on April, 2007, “Corporate Governance and Dividend Policy in Poland”. Available at: http://ssrn.com/abstract=986111
- 46 -
Figure 4. Domestic companies – dividends paid and number of payers 14
84 dividend (in billions PLN)
12
90 12,8 80
76
no of companies
70
10 62
54
54
8
60 56
7,99 50
41
6
40 30
4 2,62 2
1,4
20
1,49
1,02
10
0,97
0
0 2000
2001
2002
2003
2004
2005
2006
Source: http://www.gpw.pl/zrodla/gpw/prezentacje/prez2006.ppt
4.4 Polish Capital Market Capital market in Poland since mid 90s could be characterized as a fast growing market in terms of number of companies listed as well as the value of the capitalization. In the middle of year 1999 there were 210 companies listed on the WSE with the capitalization of PLN 100 billion. When discussing the intensity of development of the capital markets in Poland, under consideration have to be taken sudden changes in the trends connected with the internal economic features in Poland (such as growing intensity of IPOs, changes in the currency exchange price), as well as with regional and global features, such as crisis in Asia and Russia in the 90s and atmosphere on the world capital markets (Black et al., 1999). This correlation of behavior of polish investors with the behavior of investors on the foreign markets shows that Poland is gradually entering the international flows of capital, and the frequent changes in this system support its actual status of a young and growing market. This situation on the one hand is connected with higher investment risk, but on the second hand gives more opportunities for higher returns from investments in the long and short terms. Continuous development of polish market will lead shortly to higher liquidity, which decreases its susceptibility to
- 47 -
influence of speculating investments on the market. This, however, leads to lower investment risk. (Black et al., 1999). In the new century privatization has been replaced more by organic growth of polish companies, which in fact consists of raising funds for investments for growth by companies already listed on the stock exchange (increase of equity capital) and new companies which plan to enter the market. Before the year 2000 all the IPOs were appreciated by investors who used to buy all outstanding shares of entering companies, pulling their prices up. In the last couple of years only well established companies which can convince investors about the attractiveness and profitability of their business can count on their funds. Attractiveness here is measured evaluating the business sector and markets on which company exists, its business strategy, its results so far and projected profits. As an example of development of polish stock market in the last years, it should be mentioned that in the year 2007 the new exchange market has been introduced. WSE is still the primary market, but next to it has been created the not regulated NewConnect market (‘NC’), which is mainly for smaller firms which cannot afford the WSE. Capitalization restrictions as well as other legal issues are here low enough to attract not large firms looking for funds on the public market. Even though this market is not regulated in terms of European and polish law, it is suitably transparent to allow investors relatively safely invest their money. Since it’s start last year, the number of companies traded rose form 5 to 35. As these are small growing companies which invest all their profits in growth, there has been observed no dividend or other payouts from its members yet21. It is not surprising that with this proceeding development of the capital market in Poland, the companies started to realize that the fixed dividend policy would be appreciated by the shareholders. It has been observed that some shareholders, like pension and investment funds and the Treasury, have insisted on the companies to keep the dividends at the fixed level as it accounts for an important source of their yearly income. However, it has some negative effects as well, since the institutional shareholders do not take under consideration the situation or investment opportunities of the firms, but rather their individual needs for financial sources.
21
English version of the NewConnect official webpage http://www.newconnect.pl/ang/ang_index.php
- 48 -
4.5 Conclusions To the main idea of this thesis, the above considerations bring two main points. First, it doesn’t seem reasonable to allocate the dividend payout decisions, in the first years of the existence of polish stock exchange market (early and mid 90s), to any of the theories presented in the 3rd chapter of this paper. Payout policies were volatile and depended on the situation of the market and company’s current profits. Managers did not have any planned fixed policies so their payout decisions were not based on trustworthy future predictions. At the same time, there was no strong need of the shareholders to be paid regularly, since the market was in its fast growth stadium, and investors used to earn enough from the stock price appreciations. Therefore, there would not much evidence from testing volatility of prices around dividend announcements in that period. Second finding is that from the late 90s, there seem to be a noticeable trend in setting payout policies by polish companies, which is characterized by the attempts to pay regular dividends, in real or nominal terms. Managers aware of the importance of competition to getting investors started to treat payout policies with a required consideration. This competition could be observed, according to Sierpińska (1999), already from years 1997 – 1998. One of the possible reasons for that was the crisis on Asian, and especially Russian, financial markets, which significantly slowed down flow of the funds to the polish stock market, when at the same time a number of state owned companies received an allowance to join the public stock exchange market. These reasons, led to the long time dividend policies and to new dividend policies announcements. Managers this time tried to find a balance between companies’ reinvestment needs and shareholders requirements for cash. As during these years, dividend announcements were more regular, and according to the above arguments, more sensible, there seems to be enough important data that could be observed and tested for the need of this thesis paper. We can assume that in this period, the majority of paid dividends were not just accidental payouts but, as a whole, were a part of the predefined payout policies. This could prove one or more of the theories from the chapter 3rd. The only theory that could be automatically rejected is the tax preference theory, since according to the polish tax low all capital gains are tax equally at the end of the calendar year at the rate of 19%. The test used in the following chapters
- 49 -
provides us with the information if changes in dividends are followed by the changes of stock prices. The test assesses the extent to which the share price performance around the announcement days are abnormal. This is consistent with the signaling theory explained in the chapter 3.8, which espouses that security prices move in the same direction as changes in year to year dividend ratios for each company. This means that the increase in dividends should be followed by increase in share prices around the announcement day and decrease in dividends should be followed by the subsequent share prices decrease. The empirical test will show if the managers expectations are followed by the reactions of market participants. This will show if investors are treating managers decisions as signals and if for the polish market the signaling theory stands or not.
- 50 -
5. EVENT STUDY ON THE POLISH STOCK EXCHANGE MARKET
5.1 Introduction As showed in the previous chapters, some particular types of firm-specific events, not only dividend announcements, but also for example stock splits or repurchases, have impact on the prices of affected companies’ securities. The main idea of this part of this paper is to asses if the extent to which share prices’ performance around the dividend announcement day, as a representative of a moment when the information of dividend policy changes becomes public, is abnormal. Thus this study should answer the question if the volatility of securities’ prices around this specific event do significantly increase compared to their average everyday performance and if these event is connected with short time abnormal returns. The abnormal performance can be defined only in comparison to a particular benchmark. Therefore, a specific model has to be created, which generates normal (expected) results for a security before the abnormal returns can be measured (Brown and Warner, 1980). The null hypothesis is that there is no average abnormal performance around the announcement day. We test the probability of rejecting this hypothesis in favour of thy hypothesis that dividend policy changes results in abnormal share price changes, and evaluate the power of the test, which means detecting a given level of abnormal performance. Test is performed on the sample of securities listed in Poland in years 2000 – 2007. The following sections outline the methodological issues necessary for the study, data collected to perform the test and test itself. In the next chapter results are discussed and conclusions presented.
5.2 Methodology To verify the hypothesis presented in this research, about the existence of abnormal volatility of share prices as a reaction to the dividend announcements, is
- 51 -
used the event study method. This method has been widely theoretically discussed in the work of Brown and Warner (1980), and then presented in a case study in the subsequent work of these researchers (Brown and Warner, 1985). Usage of this residual analysis method is a good technique to test the signaling models defined among others by Bhattacharaya (1979) and Miller and Rock (1985). To measure the excess return we use one of the methods presented in the foregoing articles. This model allows to calculate the abnormal return for a day t for each security using formula: ARi ,t = Ri ,t − α i − β i Rm ,t ,
where: ARi ,t – excess return for security i for each day in the event window; R i ,t
– observed arithmetic return of security i for each day in the event window;
αi
– intercept term for stock i measured over the estimation period;
βi
– slope term for stock i measured over the estimation period;
R m ,t
– return on the equally weighted market portfolio for each day in the event
window.
The average abnormal return ARt for each day, which will be required in further t-statistic calculations is calculated using the formula: N
ARt =
∑ AR
i ,t
i =1
N
,
where: N
– number of observations in the sample.
In this research for the market portfolio we took the whole main WSE index WIG, which includes all the companies listed in the regular market. Estimation period used in defining parameters α and β included 160 trading days before the event area. The event window includes 4 days before the event and 10 days after it, which including the event day gives us a 15 day time surrounding the announcement day. All days are marked with numbers from -4 to +10, respectively, where the day “0” is the day when the event occurs. If the announcement day occurs on weekends, the day “0” is then the
- 52 -
first trading day after this day. Such period was chosen following researches of Kalay and Loewenstein (1995) who observed that in the 3 day surrounding period around the announcement days the excess returns are significantly different than in other trading days and that this abnormal performance could still be observed on the fourth day after the announcement. For the purpose of this research, which object is still developing and more volatile market, this period is extended to make sure that the whole abnormal performance has been observed. There is a risk that some information about the expected dividend might be know to the market long before the announcement day and therefore anticipated in advance to this day. However, two issues should be considered. First, the annual shareholder meeting does not have to set a dividend at a level awaited by the market participants. Second, if investors receive some information about the future dividend yield, it goes through the unofficial sources and therefore for each company takes place in a different moment. Therefore calculated average abnormal returns would hide this volatility for one company if it would happen for other enterprises on different days. Hence, the only official date when the final decision about the payout is made takes place during the announcement day. This study will give the abnormal returns for each share ( ARi ,t ) for each day of the analysis. Based on these results average cumulated abnormal returns on shares( CARt ) will be calculated for each day of the observation. To verify the statistical significance of these results Brown and Warner (1980) suggest using tstatistics: t stat =
ARt
σ AR
N ,
t
where:
σ AR = t
1 N ∑ ( ARi ,t − ARt ) 2 ; T − 1 i =10
- 53 -
This test is useful in verification of the null hypothesis presented in the introduction to this chapter. Then, based on the t-stat results p-values22 are calculated to measure the probability of observations given the null hypothesis is true.
5.3 Data
Data for the empirical test was derived from couple of sources. Information on dates of the announcement days and record days come from the Fact Books, official yearly publications of WSE.23 Quotes and volume of stocks around the important days are compiled from the WSE database available online.24 Stocks that are selected must have paid a dividend at least once in the period from year 2000 to 2006. The data from the years before this period is not taken into account in this research, since as explained in chapter 4, in the 1990s polish market was still in its early development phase and it could be argued, that investors as well as mangers did not possess enough knowledge to recognize and properly value such information as dividend announcements. Besides, number of dividend payers and total dividend amounts were much lower than after the year 2000. Including data before this year might significantly increase the noises and impair the final result of the test. In the observed period there were 508 cases of dividend announcements by 164 different companies. In the data collected there is only evidence for 495 cases, because some data was not available on the official WSE webpage. One of the reasons for this lack of quotes around the dividend announcement days might be that these companies were in the process of becoming delisted or were later taken over by another company. In the latter example, the official WSE website shows only quotes of the new company. From the collected data there has to be taken a sample to the test. Some companies paid very little dividends of value often below 1% of the stock price. Investors might
22
P-values are calculated using the free online p-value calculator for the Student t-test, based on the tstat results and number of degrees of freedom. Then one tailed probability values are obtained. Calculator available at http://www.danielsoper.com/statcalc/calc08.aspx 23 All available In electronic form on: http://www.gpw.pl/gpw.asp?cel=e_informacje&k=3&i=/publications/publications&sky=1 24 WSE Info Space webpage: http://www.gpwinfostrefa.pl/palio/html.run?_Instance=cms_gpw.pap.pl&_PageID=2&_OID=141&_La ng=en&_CheckSum=304426945
- 54 -
be indifferent to such low dividends, since average daily changes in stock prices in Poland often exceed 1%. On the other hand, the higher the dividend yield, according to the signaling theory, the more important this event should be for investors. Thus initially I decided to chose a sample of companies of higher dividend yield than the average market dividend yield. The individual dividend yield for each company was calculated using formula from Chapter 2.6. Instead of a current share price, was used the closing share price on the day of the announcement, or if the shareholder meeting took place on weekends, the closing price of the stocks on the last trading day before this meeting. That allows investors to realize instantly how much of the company’s today’s market value is going to be paid out in form of dividend. The average dividend yield was calculated simply using formula: t =n
ADY =
∑ DYR
t
t =1
n
,
where: ADY – Average Dividend Yield; DYRt – Dividend Yield Ratio for each company25; n
– number of companies that paid dividend during the year.
This formula gives simple arithmetic mean of dividend yield for the year. Yields calculated using this method give slightly different results than official WSE dividend yield statistics, because WSE calculates this ratio using the weighted mean. In that method the market capitalization of each company is also taken into account. Hence, the larger market capitalization of the firm, the higher importance of its dividend in the average dividend yield. However, for the purpose if this research such calculation is less important than the simple arithmetically calculated mean, since for investors the firm capitalization should have low importance in comparison to the percentage of its value to be paid out. In Poland it could be observed that smaller companies usually pay higher dividend per share than the blue chips, which decreases the official dividend yield. The only exception is the large European copper producer KGHM, which is in general controlled by the state. On the annual shareholder meeting the management is often pushed to pay out the majority of the profit earned in the former 25
in case of foreign companies such as MOL, Baca, Bchem, Cez and Warimpex the dividend in foreign currency was converted into PLN at the National Bank of Poland average rate for the dividend payment date.
- 55 -
year, because high percent of it goes to the Polish budget. There are 180 examples of dividend payouts, with individual dividend yield equal or higher than the average yearly yield calculated by foregoing presented method. In this research we decided to observe the price volatility for the changes in the dividend yields during the bear (decreasing) and bull (growing) market. In the period covering years from 2000 to 2006 only in years 2000 and 2001 the main index was negative, which means that for the test for the bear market there would not be enough examples of dividend changes to perform a test. Hence the median for dividend yield each year was calculated and to the previous 180 examples, were added 83 extra situations, when the company dividend yield was higher than the median, but was not previously included. These 263 events were divided into two periods: the bear and the bull market. As mentioned above the market main index WIG was negative in years 2000 and 2001 therefore the dividends for this period were paid in years 2001 and 2002 respectively. From the year 2003 to 2006 market indexes were giving positive results and hence the reactions during the bull market are observed in this period. In each of these two situations separate tests were performed for decreasing and increasing dividends. To the first test were taken all events from the selected sample, where the dividend yield in year t was lower by at least 1% in nominal terms than dividend yield in the year t-1 for the same company. Besides, if in year t+1 the yield was not included in the sample, but met the condition of being at least 1% lower than yield in year t, which was included, than this even would also be taken to the test. The reason to include these additional events is that if dividend yield in one year is significantly high and in the subsequent year is very low, then this change might result in strong reaction of investors. The second test includes all initially paid dividends and increased dividends compared to the previous year. As initially paid dividends were treated these events, when the company paid a dividend in year t and did not pay in year t-1, regardless of its dividend payout history in previous years. This makes sense since when company decides to not share its earnings with investors in one year, it is treated as 0% dividend yield in this year. In this test only events from the previously selected sample were used. In total the sample for the bear market decreasing dividends consists of 10 events and increasing dividends – 26 events, whereas sample for the bull market consists of - 56 -
55 and 101 events respectively. Some events which met the criteria for the test had to be excluded from the sample. There were three main reasons to exclude one: -
the company has announced dividend payout shortly after it was accepted for the WSE, therefore it was not possible to collect data from the 160 days preceding the announcement and calculate normal (expected) returns in this period;
-
the average daily volume during the observed period was close to 0 (or was equal to 0 during the majority of days);
-
the trading around the announcement day was suspended.
The reason to exclude events that are characterized by low or no trading volume around the announcement day is that it would not picture the real situation around this day since investors have no opportunity to trade their shares in view of obtaining profit. These events would decrease the abnormal returns in the observed period and hence the explanatory power of the model would be diminished.
- 57 -
5.4 Empirical results Table 2. Stock price reactions as a result of the announcement of dividend decrease during the bear market - day 0 represents the day of the announcement, statistic based on 10 observations. day -4 -3 -2 -1 0 1 2 3 4 5 6 7 8 9 10
AR 0,25% 0,70% -0,10% 0,02% -0,01% 0,46% 0,10% -0,38% -1,26% 0,51% 0,41% -0,65% 0,23% -0,23% -0,09%
t-stat 0,67 1,37 -0,41 0,02 -0,01 0,53 0,20 -0,65 -1,54 0,49 1,02 -2,59 0,35 -0,91 -0,10
p-value 51,92% 20,31% 69,14% 98,39% 98,99% 60,76% 84,74% 53,01% 15,70% 63,84% 33,62% 2,92% 73,66% 38,80% 92,10%
CAR 0,25% 0,95% 0,86% 0,87% 0,86% 1,32% 1,42% 1,04% -0,22% 0,29% 0,70% 0,04% 0,28% 0,04% -0,04%
Figure 5. Abnormal returns (AR) as a reaction to the announcement of dividend decrease during the bear market - day 0 represents the day of the announcement.
Figure 6. Cumulative Abnormal Returns (CAR) as a reaction to the announcement of dividend decrease during the bear market - day 0 represents the day of the announcement.
Figure 7. P-values for the days in the observation period.
- 58 -
Table 3. Stock price reactions as a result of the announcement of dividend increase during the bear market - day 0 represents the day of the announcement, statistic based on 26 observations. day -4 -3 -2 -1 0 1 2 3 4 5 6 7 8 9 10
AR 0,49% 0,29% 0,25% 0,72% 0,93% -0,19% -0,24% -0,16% 0,06% 0,63% -1,51% 0,14% 0,34% 0,29% -0,29%
t-stat 1,15 0,74 0,59 1,24 1,49 -0,36 -0,40 -0,43 0,12 2,48 -1,13 0,41 0,81 0,60 -0,92
p-value 26,28% 46,64% 55,81% 22,79% 14,76% 72,19% 69,33% 67,02% 90,22% 2,01% 26,96% 68,18% 42,67% 55,57% 36,53%
CAR 0,49% 0,77% 1,03% 1,74% 2,68% 2,48% 2,25% 2,08% 2,14% 2,77% 1,26% 1,40% 1,74% 2,03% 1,74%
Figure 8. Abnormal returns (AR) as a reaction to the announcement of dividend increase during the bear market - day 0 represents the day of the announcement.
Figure 9. Cumulative Abnormal Returns (CAR) as a reaction to the announcement of dividend increase during the bear market - day 0 represents the day of the announcement.
Figure 10. P-values for the days in the observation period.
- 59 -
Table 4. Stock price reactions as a result of the announcement of dividend decrease during the bull market - day 0 represents the day of the announcement, statistic based on 55 observations. day -4 -3 -2 -1 0 1 2 3 4 5 6 7 8 9 10
AR -0,13% -0,40% -0,66% -0,02% 0,88% -0,45% -0,41% 0,48% -0,84% -0,23% 0,22% -0,62% 0,19% -0,41% -0,26%
t-stat -0,45 -1,38 -1,78 -0,05 2,39 -1,27 -1,14 1,25 -2,44 -0,55 0,59 -2,46 0,69 -1,26 -0,76
p-value 65,38% 17,45% 8,14% 95,71% 2,05% 20,81% 25,93% 21,59% 1,80% 58,19% 55,77% 1,73% 49,14% 21,24% 45,23%
CAR -0,13% -0,53% -1,19% -1,21% -0,33% -0,78% -1,19% -0,71% -1,54% -1,77% -1,56% -2,17% -1,98% -2,39% -2,65%
Figure 11. Abnormal returns (AR) as a reaction to the announcement of dividend decrease during the bull market - day 0 represents the day of the announcement.
Figure 12. Cumulative Abnormal Returns (CAR) as a reaction to the announcement of dividend decrease during the bull market - day 0 represents the day of the announcement.
Figure 13. P-values for the days in the observation period.
- 60 -
Table 5. Stock price reactions as a result of the announcement of dividend increase during the bull market - day 0 represents the day of the announcement, statistic based on 101 observations. day -4 -3 -2 -1 0 1 2 3 4 5 6 7 8 9 10
AR 0,06% 0,22% 0,07% -0,26% 0,50% 0,70% 0,73% 0,43% -0,07% -0,13% -0,08% -0,16% 0,06% 0,27% -0,17%
t-stat 0,20 0,81 0,36 -1,44 2,36 1,62 2,38 1,70 -0,27 -0,58 -0,29 -0,85 0,27 1,32 -0,90
p-value 84,32% 41,86% 72,33% 15,41% 2,01% 10,88% 1,92% 9,28% 78,70% 56,19% 77,01% 39,51% 78,89% 19,04% 37,24%
CAR 0,06% 0,28% 0,34% 0,08% 0,59% 1,29% 2,01% 2,44% 2,38% 2,25% 2,17% 2,01% 2,07% 2,34% 2,17%
Figure 14. Abnormal returns (AR) as a reaction to the announcement of dividend increase during the bull market - day 0 represents the day of the announcement.
Figure 15. Cumulative Abnormal Returns (CAR) as a reaction to the announcement of dividend increase during the bull market - day 0 represents the day of the announcement.
Figure 16. P-values for the days in the observation period.
- 61 -
5.5 Descriptive statistics
Table 2 presents the results for the test based on 10 events of dividend decreases during the bear market for years 2000 and 2001. Average abnormal returns around the announcement day range from -1,26% to +0,7% and appear alternately. It is difficult to observe any trend in these movements, however the cumulative average abnormal returns figure shows that before the announcement and up to the second day after the abnormal returns were positive. On the third day after the event began the two day drop which stopped at the lowest observed cumulative level of -0,22%. Then after a small growth and fall it ended up close to the zero level on the last days. T-statistic results for almost all days are very low, which implies high p-values. On most of the days in the event window it shows values significantly higher than 50%, which shows very low evidence against the null hypothesis. Only on the seventh day after the announcement the average abnormal return of -0,65% is represented by high t-statistic value of -2,59 and p-value of 2,92%. On this day with 97,08% probability the null hypothesis of no abnormal performance can be rejected. Table 3 presents the results for the second test in the decreasing market. It is represented by 26 events of companies increasing their dividend yields for years 2000 and 2001. The daily average abnormal results obtained from the test range between -1,51% and +0,93%. Before and on the announcement day the daily average abnormal returns are all positive. Then is observed a small drop on the figure, which is followed by either small increase. Only on the fifth and sixth day fluctuations are substantive and amount to 0,63% and -1,51% respectively. However, only the increase on the fifth day can be considered as important, since t-statistic of 2,78 allows us to reject the null hypothesis on this day with 97,99% probability. On the other days of the event window p-values are represented by significantly high amounts which means that hypothesis of no abnormal performance cannot be rejected. Figure 9 representing cumulative average abnormal returns is slightly different than the one based on dividend decreases on the bear market. It starts at 0,49% and because of the observed positive abnormal returns at the beginning remains positive till the end. The lowest level of 1,26% is observed on the sixth day when the highest drop in the period took place. The figure ends on the level of 1,74% after small fluctuations in the last days.
- 62 -
In table 4 are presented results from the test of dividend decreases during the growing market in years 2003 – 2007. This test was based on 55 observations. In the 15 day period the lowest daily average abnormal result is -0,84% on the fourth day and the highest is +0,88% on the announcement day. Both these results, as well as result on the seventh day of -0,62% are significant and are characterized by high tstatistic results. The null hypothesis of no abnormal performance on the announcement day can be rejected with 97,95% probability, decrease on the fourth day with 98,2% probability and the decrease on the seventh day with 98,27% probability. Results obtained from the test show negative returns in most of the days in the observation window. Positive returns are only on days marked as 0, 3, 6 and 8. As mentioned above, only average abnormal return on the 0 day can be considered as significant because of high t-statistic value. Negative average abnormal returns on the other 11 days in the event window result in negative cumulative average abnormal return during the whole observation. The figure starts at -0,13% level and steadily drop to the level of -2,65% on the last day. The four days with observed positive results form four peaks on the chart, each next on the lower level. Table 5 presents the test of 101 dividend increases during the growing market on the polish stock exchange. Observed daily abnormal returns fluctuate from the lowest level of -0,26% up to the +0,73%. Before the announcement day the cumulative abnormal returns are close to 0, but the information about the increase in dividend yield generates positive returns on the next 3 days after this event. In total during these four days the abnormal return amounts to 2,36%. The figure presenting p-values in this short period is on a very low level, not exceeding 11%. The lowest values, allowing us to reject the null hypothesis of no abnormal returns on these days are on the announcement day and 2 days after it. Average abnormal return for the announcement day amounted to +0,5%, with t-statistic of 2,36 allowing to reject the null hypothesis with 97,99% probability. On the day number 2 in the event window the average return was +0,73% and t-statistic 2,38, which with the probability of 98,08% also allows to reject the null hypothesis. The figure representing the cumulative average abnormal returns starts from the +0,06% level. Then the high increase in the 4-day period on and after the announcement day and subsequent slight growths and falls until the last day of the observation window result in the cumulative average abnormal returns at 2,17% level. Low t-statistic values for the last days in the
- 63 -
window mean that there is not much evidence against the null hypothesis of no average abnormal returns.
5.6 Results discussion The results from the test in the bear and bull market differ significantly. First two tests based on the events when the whole market was underperforming give observably worse results than 2 subsequent tests. Average abnormal results are very volatile and cumulative average abnormal returns do not present any noticeable trend. When dividend yields are increasing cumulative average returns are higher than when they are decreasing. The difference between them at the end of the event window exceeds 1,75%, but considering very low t-statistic values in both tests, these results cannot be considered statistically important. Overall it should be concluded that there is not enough evidence to declare if in the bear market dividend changes result in abnormal volatility of share prices. There is no evidence to reject the null hypothesis for any day in the 3 day period around the announcement day, which Kalay and Loewenstein (1995) considered to be a period when abnormal returns should be observed. The reason for that might be that in years 2000 and 2001 polish stock exchange still was just leaving its early development phase and companies dividend policies were not considered to be constant or reasonably thought-out. Even if managers started at that time planning company’s dividend policies with view of a long term financial strategy, investors still had little knowledge and experience in this issue to properly validate company’s payout policy decisions. Hence investors might have not reacted to their decreases nor increases by collecting or selling shares, as should be expected according to Ball and Brown (1968), who were first to observe the post announcement drift of share prices compatible with the announcements of good and bad news by companies. In our research information of increasing or decreasing dividend yield might by considered as positive or negative news from the company, however this test does not give reliable evidence to this statement. Slightly different situation is with the third and fourth test concerning the market in the growing phase. In these tests, similarly to the 2 previous tests, daily average abnormal returns are characterized by significant fluctuations. However, in these situations the cumulative average abnormal return graphs show noticeable trends. In
- 64 -
case of dividend yields decreases, the chart is declining, which could be expected in this situation. When the market in general is growing and companies are decreasing their dividend yields, investors might conclude that company’s current earnings are lower than they were in the previous year, or that current projects will not pay off as much as managers expect. It can also be assumed that investors expect decrease in dividend yields for these companies, since during 4 days preceding the announcement day the observed abnormal results are negative, however not statistically important. But on the day of announcement the average abnormal return is positive and statistically important, which might be surprising because drop in dividend yield is followed by the increase of stock price. The reason for that could lie in asymmetric information between shareholders and managers. The decision about the amount of dividend that is going to be paid from the previous year profit might become public on the following day to the announcement if the shareholder meeting finishes after the end of trading day. Therefore investors react to this information not before the first day after the declaration date, which would explain negative average abnormal returns on the next days. Test with the increasing dividends, which result in grow of abnormal average results in the days subsequent to the announcement, is consistent with the results of Kalay and Loewenstein (1995) who observed abnormal fluctuations in the 3 day period around the announcement. In this period the only negative average abnormal result is on the day preceding the announcement. Positive results in the days 1 – 3 after announcement are supported by high values of t-statistic in these days. Moreover, the trend after the increase remains at the high level during the rest of the observed days. Such movements of average abnormal returns are consistent with the signaling theories, which say that lower dividends signal that the firm would do worse, and higher dividends suggest suggests that it will do better in the future. Especially in the world of asymmetric information, where managers can calculate the expected profitability of the projects, but investors cannot. Therefore assuming that firm’s managers act in the best interest of its shareholders, managers would not increase dividends knowing that their projects will not sufficiently pay off in the future. If such situation would take place, they would have to use debt or other source of outside financing to cover all the future spending. This theory presented in the paper of Bhattacharya (1979) is consistent with the results of the tests on the polish
- 65 -
market and could explain the reaction of share prices changes to the dividend policy changes in the growing market. Results in the decreasing market and those from the growing market are only partly consistent with the market reactions observed by Michaely et. al. (1995). They found out that short term price reactions to dividend omissions are much greater than those for the dividend initiations. In this paper initiations were included in a group of dividend increases, and omissions in the group with decreases. Hence, following the study of those researchers it could be expected to await at least similar results from this study. In the bear market we observe that in the 3 day period after the declaration of decrease in dividends, the cumulative abnormal returns are higher than on the 0 day, however finally they drop and remain on much lower level. In the same time reaction to announcement of increased dividends is surprisingly also negative. In the growing market we find more support for this theory as the observed drop of share prices after the decrease in dividends is stronger in the event window than the increase in price after the increase of dividend yield. Also the results from years 2003 – 2007 are statistically more important than those from years 2001 – 2002, which also stays consistent with the findings of Michaely et. al. (1995). The results obtained from the third test about the negative price reactions to the information of the decreasing dividend yields in the growing market are also in line with earlier studies of Charest (1978) and Woolridge and Ghosh (1985). The results from the fourth test are consistent with paperwork of Charest (1978) and Aharony and Swary (1980). Of the importance of the results obtained from the two last tests should prove the number of events included in the test and the period from which these events were selected. Consistency of these results with the results obtained from the American and Western European markets may give evidence of current development phase of polish market. The research shows that as in the first couple of years of this decade polish capital market was still very unstable and volatile, in the last years it evolved to more stabilized level, where financial decisions are more deliberated. The next phase would be probably the current phase of those markets, where fixed dividend policies are being replaced by repurchase policies.
- 66 -
6. CONCLUSIONS The purpose of this paper was to contribute to the researches on the share prices drift as a reaction to the announcement of dividend changes. Most of the finance theory and evidence about this issue bases its results on the highly developed American market with long time dividend history, or on the similarly high developed West European market. The empirical financial literature on this topic provides number of studies about price reactions to dividend policy changes among companies operating on markets with experienced managers and investors and having stabilized payout policies. There was however lack of evidence from the developing markets, with short stock exchange history but high growth rate and expectations to be important financial markets. In this paper I have tried to fill this gap by observing for the first time on the polish market reactions to the changes in dividend decisions. Polish market seemed to be a good field for such a research because it holds position of one of the largest stock exchange markets in the Central and Eastern Europe despite its only 17 year history. Moreover, the recent increase in number of listed companies and internationalization of the market makes it an interesting area for foreign investors who might be interested in the results of such a study for investment purposes. I found different results for observations performed on the decreasing and increasing market. On the decreasing market there was not enough evidence to reject the hypothesis of no significant price fluctuations as reaction to changes in dividend policies by companies. However, on the growing market changes in dividend policies are partly followed by subsequent share price reactions. Nevertheless, it might be incorrect to search for the support in the literature for such different results in both situations. The reason is that the second study was performed in the years following the period observed in the first test, and hence for the failure to find the evidence of no increased share price volatility to dividend changes in the decreasing market could be blamed the small experience of investors on the polish market and their little knowledge about the payout policy. In the second study, performed in more recent period results are more reliable. The research showing the dividend yield increase is followed by subsequent average positive share price reactions, whereas dividend yield decrease by negative share price
- 67 -
reactions is consistent with the researches supporting signaling theories of e. g. Bhattacharya (1979) and Miller and Rock (1985). It also supports the research by Asquith and Mullins (1986) about the average abnormal returns following the dividend increase and initiation. This message might be important for international investors looking for short term gains on the market. However, abnormal returns observed in Poland are lower than in the developed countries, therefore it still seems as a better solution for investors to operate on the developed markets.
6.1 Further Research Topics Further research about the dividend policy on developing markets should be performed to get a clearer view on the information content of dividends and reasons for setting specific payout policies by managers. The literature provides numerous researches about the dividend polices on developed markets, but still very little information is available for international investors interested in markets without large financial market experience. Comparing the available payout policy studies in US and in developing countries, there are some questions that should be of interest for further researches on this topic. There is little evidence of the influence of other than signaling theory on share prices fluctuations. Such research would add to the evidence of weather other factors influence dividend levels and what are they informative meaning. In the world finance literature there is also a number of researches distinguishing their samples into small and big firms or high-yield and low-yield stocks. Since on the polish stock exchange most of large, high-yield stock companies are still partly controlled by the government, such a study might give interesting results. It could be as well observed together with the volume of shares around the announcement day, to find out how much of company’s shares change their owners around this day. It would also be interesting to observe the connections between dividend policies and repurchase policies and their influence on share prices, knowing that in highly developed markets the latter policy has been recently replacing the former.
- 68 -
7. FIGURES AND TABLES Table 6. Polish companies that paid dividends at least once in years 2000 – 2007 and dividend yields for each year.*, ** Company 1 2 3 4 5 6 7 8 9 10 11 12 13 14 15 16 17 18 19 20 21 22 23 24 25 26 27 28 29 30 31 32 33 34 35 36 37 38 39 40 41 42 43 44 45 46 47 48 49 50
06MAGNA 07NFI 09KWIAT 10FOKSAL ABG ACTION AGORA AMBRA APATOR ASSECOPOL (SOFTBANK) ASSECOSLO ATM ATMGRUPA BACA BAKALLAND BAKOMA BANKBPH (BPH PBK) BAUMA BCHEM BEDZIN BETACOM BORYSZEW BOS BRE BUDOPOL BZWBK (BK) CCC CEZ CIECH CLIF COMARCH CSS DEBICA DECORA DGA DOMDEV DUDA DWORY EFEKT EFL ELBUDOWA ELMONTWAR ELZAB EMPERIA (ELDORADO) ENERGOPLD ENERGOPOL EUROCASH EUROFAKTR EUROTEL FAM
Dividend Yield 2007 20,79%
2006 13,30%
2005
2004 2,83%
2003 6,45%
2002
2001 8,97%
2000
39,59% 3,64% 30,40% 1,23% 0,77% 3,56% 1,25% 3,59% 0,48% 2,37% 5,06% 0,52% 0,77% 1,17%
n/a
1,49% 1,23% 2,21% 0,91%
0,72% 1,15% 2,33% 2,17% 1,19%
2,72% 3,39% 2,38%
1,54% 0,89% 2,05% 0,48%
3,72%
4,26%
3,94% 2,11%
5,02% 0,66%
2,24% 6,32% 2,31%
1,86% 6,03% 4,13% 2,16% 0,29% 0,72% 0,30% 0,18%
0,15%
3,47% 2,50%
0,54% 1,25%
3,95% 2,47%
2,56% 0,37%
1,90%
1,13%
n/a
1,43% 2,22% 2,79% 2,95% 5,92% 8,06%
7,50% 5,47% 0,52% 8,26%
2,16% 1,23% 3,76% 1,31%
3,27% n/a
1,10% 0,56%
1,95% 4,17% 5,97% 3,76% 2,45% 3,00%
2,29%
2,28% 0,30% 1,86% 0,09%
5,44% 0,55%
3,60% 2,43% 8,22% 5,74%
1,73% 3,42% 7,27% 0,72%
2,88% 6,20%
1,54% 1,05% 0,37%
1,14%
3,33%
0,96%
2,65%
4,00% 3,40% 3,23% 1,63% 4,02% 1,92%
4,67% 1,22%
11,20% 4,73%
16,99% 1,03% 0,75%
4,97% 4,82% 4,69%
1,65% 8,65% 12,44% 1,96%
14,44% 4,26% 5,83%
2,15%
2,42% 7,95%
3,27%
1,06% 0,99%
- 69 -
Company 51 52 53 54 55 56 57 58 59 60 61 62 63 64 65 66 67 68 69 70 71 72 73 74 75 76 77 78 79 80 81 82 83 84 85 86 87 88 89 90 91 92 93 94 95 96 97 98 99 100 101 102 103
FASING FORTE FORTIS FORTUM (MPECWRO) GRAJEWO GROCLIN HANDLOWY HOOP HYDROBUD HYDROGD HYDROTOR IMPEL IMPEXMET INGBSK INSTAL INSTALKRK INTERCARS IRENA IVMX JCAUTO JELFA JUPITER JUTRZENKA KETY KGHM KOGENERA KOMPAP KOPEX KPBP-BICK KREDYTB KROSNO KRUK KRUSZWICA LENTEX LETA LOTOS LUBAWA LZPS MCLOGIC (MACROSOFT) MENNICA MIESZKO MILLENNIUM (BIG BG) MILMET MOL MOSTALEXP MOSTALPLC MOSTALZAB MUZA NETIA NORTHCOAST NOVITUS NOWAGALA OLAWA
Dividend Yield 2007
2006
2005
2,00%
1,50%
1,83%
1,37%
3,56%
2,13% 6,32%
3,17% 1,48%
5,54% 15,35% 1,23%
0,63% 0,68% 0,76% 3,43%
2,19% 4,21%
0,23% 0,25%
0,80%
3,95%
3,93% 1,53% 4,72% 1,69% 0,49%
2004
2003
2002
2001 4,47%
2000
7,41% 0,90% 6,77% 10,54% 2,96% 0,82%
2,90% 1,28%
3,27%
1,17% 1,74%
1,95% 2,91%
6,90% 2,31% 3,21% 11,71% 7,21% 5,75% 12,24% 4,90%
0,21%
0,81%
0,38%
2,27%
4,12%
2,33%
0,98% 0,38% 1,12% n/a 3,50% 3,75% 2,70% 6,15%
0,75% 1,79%
1,91% 2,82% 14,64% 12,12% 3,05% 1,65%
3,60% 7,17% 2,52%
3,56%
6,47%
4,58%
1,52% 2,33%
0,91% 2,47%
5,47% 2,27%
2,35%
2,27% 1,65%
2,68% 3,98% 7,51% 3,44% 4,44% 5,76% 1,60% 0,19%
3,10%
0,71%
1,31%
2,34%
2,63%
5,66%
12,15% 3,77% n/a 1,06% 2,88% 2,32% 2,33% 3,56% 1,71%
6,29% 3,09%
3,00%
5,22%
4,19%
n/a 4,93% 4,09% 17,14% 10,56% 5,38% 4,36% 2,53% 7,47% 1,56%
6,98%
1,45%
1,43%
0,57% 2,85%
1,65% 8,22%
0,75%
1,28% 2,35%
4,42% 1,79% 5,63%
4,01%
2,23% 1,57% 22,51%
6,84% 7,49% 1,33%
4,85% n/a 3,72%
8,56%
2,22% 5,00% 0,60%
0,97% 4,49% 2,21%
0,78%
17,12%
4,27% 1,81% 11,93%
1,61%
2,74% 2,14% 4,55% 1,25%
2,39%
2,86%
- 70 -
Company 104 105 106 107 108 109 110 111 112 113 114 115 116 117 118 119 120 121 122 123 124 125 126 127 128 129 130 131 132 133 134 135 136 137 138 139 140 141 142 143 144 145 146 147 148 149 150 151 152 153 154 155 156
ORBIS PAGED PEKAES PEKAO PEMUG PEP PERMEDIA PGF PGNIG PKNORLEN PKOBP POLCOLOR POLICE POLIMEXMS (MOSTALSDL) POLLENAE POLMOSBIA POLMOSLBN POLNORD PPWK PROCHEM PROJPRZEM PROKOM PROSPER PULAWY RAFAKO RELPOL RMFFM ROPCZYCE RUCH SANOK SIGMA KALON (POLIFARBC) SKOTAN SNIEZKA SPIN STALPROD STALPROFI STOMIL STORMM (ELMONTWAR) SUWARY SWIECIE SYGNITY (COMPLAND) TALEX TIM TORFARM TPSA TUP TVN UNIMIL VISCO WANDALEX WARIMPEX WARTA WASKO
Dividend Yield 2007 0,40% 1,76%
2006 0,79% 2,13%
3,49%
3,53%
1,64% 2,06% 3,35%
3,85% 6,90% 3,75% 4,40%
0,17%
2,22% 1,46% 3,38% 0,49%
2005 1,48%
2004 1,46%
2003 1,96%
2002 2,03%
6,56% 4,59%
3,31%
4,64%
3,67%
2001
2000
6,60% 7,38% 4,05%
5,84% 3,42%
9,55% 2,73%
9,48%
9,09%
5,54% 1,86%
4,26% 3,75% 1,37%
2,23%
0,75%
0,67%
0,27%
0,23%
2,64%
2,36%
n/a 4,98%
2,97%
2,42%
2,07%
7,14%
2,24% 5,38% 0,67%
n/a 4,84% 3,03% 0,98% 0,67% 0,71% 2,10% n/a
6,13% 3,67% 1,99% 1,21% 2,99% 3,31%
1,39% 3,37% 0,23%
1,40% 3,39%
2,19% 6,52%
3,99%
2,56%
1,75%
1,97%
9,95%
1,38%
1,42%
1,39%
1,49%
1,05%
6,75% 2,50%
2,21% 2,09%
6,78%
6,42%
1,26%
2,42%
2,20% 4,88% 0,82% 1,02% 1,13% 2,14%
1,73% 0,22% 0,69% 0,58%
1,37%
1,36% 6,28% 0,41% 1,49%
0,74% 1,33%
5,15%
3,71%
3,33%
7,54%
5,96% 3,09%
7,60% 4,00% 9,92%
6,67%
3,85% 4,55% 2,24%
1,77% n/a 2,16%
2,27% 9,04%
5,69%
34,22%
3,66% 4,35%
3,52%
1,74%
1,53% 5,34%
12,50%
3,48%
0,68% 0,77% 2,13% 2,24%
4,47% 7,72% 0,99% 0,93% 0,88% 1,47% 4,44% 2,58%
0,80%
2,63% 1,73%
0,74%
0,81%
1,49%
n/a
5,12%
4,16%
1,96%
0,85% 0,71%
- 71 -
4,27% 5,41% 2,16%
1,05%
0,15%
10,94% 2,97% 6,00%
3,52%
1,56% 1,68%
1,00%
4,22%
Dividend Yield
Company 157 158 159 160 161 162 163 164
2007
WISTIL WOLCZANKA WSIP YAWAL ZEG ZELMER ZREW ZYWIEC
2006
2005
2004 1,80%
2003
2002 4,55%
2001
2000 6,13%
7,09% 1,11%
4,04% 1,96% 8,89%
3,43%
5,38%
6,11%
5,70%
6,00%
4,49%
5,90%
calculated WSE dividend yield for the year***
2,34%
3,37%
4,60%
2,42%
official WSE dividend yield****
2,0%
2,6%
1,8%
Median
1,35%
2,62%
2,63%
9,13%
9,13% 1,32%
8,36% 0,82%
4,44%
3,99%
4,81%
3,52%
1,5%
1,6%
1,3%
1,3%
0,8%
2,17%
3,50%
3,35%
3,64%
2,95%
* Dividend yield is calculated as a cash dividend per share to the share price on the day of announcement, ** Numbers in red are diminishing dividends over years, matching criteria of the test explained in the chapter 5.3 *** Calculated as a simple arithmetic mean of all dividends paid in the year **** Official dividend yield calculated based on company’s capitalization and dividend
- 72 -
8. REFERENCES Aharony, J., Swary, I., 1980. Quarterly dividend and earnings announcements and stockholders’ returns: An empirical analysis, Journal of Finance 35, 1 – 12. Allen, F., Michaely, R., 2003. Payout policy. In: Constantinides, G. M., Harris, M., Stulz, R. M. Handbook of the Economics of Finance, Elsevier, Amsterdam, 337 – 429. Allem, D. E., Rachim, V. S., 1996. Dividend policy and stock price volatility: Australian evidence, Applied Financial Economics 6, 175 – 188. Asquith, P., Mullins, D. W. Jr., 1983. The Impact of Initiating Dividend Payments in Shareholders’s Wealth, The Journal of Business, Vol. 56, No. 1, 77 – 96. Asquith, P., Mullins, D. W. Jr., 1986. Signalling with Dividends, Stock Repurchases, and Equity Issues, The Financial Management, Autumn 1986, 27 - 44. Bajaj, M., Vijh, A. M., 1995. Trading Behavior and the Unbiasedness of the Market Reaction to Dividend Announcements, The Journal of Finance, Vol. 50, No. 1, pp. 255 – 279. Baker, M., Wurgler, J., 2004. A Catering theory of Dividends, The Journal of Finance, Vol. 59, No. 3, 1125 – 1165. Baskin, J., 1989. Dividend policy and volatility of common stock, The Journal of Portfolio Management 15, 19 – 25. Benartzi, S., Michaely, R., Thaler, R., 1997. Do changes in dividends signal future or the past?, Journal of Finance 52, 1007 – 1034. Benninga, S., 1979. General Equilibrium with Financial Markets: Existence, Uniqueness, and Implications for Corporate Finance, The Journal of Finance, Vol. 34, No. 2, 325 – 339. Berlingeri, H. O., 2006. Yes, after all, in MM world dividends are irrelevant, Pontificia Universidad Católica Argentina working paper. Bernard, V. L., Thomas, J. K., 1989. Post-Earnings-Announcement Drift: Delayed Price Response or Risk Premium?, Journal of Accounting Research, Vol. 27, 1 – 36. Bhattacharya, S., 1979. Imperfect Information, Dividend Policy, and “The Bird in the Hand” Fallacy, The Bell Journal of Economics, Vol. 10, No. 1, 259 – 270. Black, F., Scholes, M., 1974. The Effects of Dividend Yield and Dividend Policy on Common Stock Prices and Returns”, Journal of Financial Economics 1, 1 – 22. Black, A., Wright, P., Bachman, J. E., 1999. In search of Shareholder value. Managing the drivers of performance, PricewaterhouseCoopers.
- 73 -
Brealey, R. A., Myers, S. C., 2003. Principles of Corporate Finance, 7th edition. McGraw Hill, New York. Brennan, M., 1971. A Note on Dividend Irrelevance and the Gordon Valuation Model, The Journal of Finance, Vol. 26, No. 5, 1115 – 1121. Brickley, J., 1983. Shareholder wealth, information signaling and the specially designated dividend: an empirical study, Journal of Financial Economics 12, 187 209. Brown, S. J., Warner, J. B., 1980. Measuring Security Price Performance, Journal of Financial Economics 8, pp. 205 – 258. Brown, S. J., Warner, J. B., 1985. Using Daily Stock Returns: The Case of Event Studies, Journal of Financial Economics 14, pp. 3 – 31. Campbell, J. Y., Shiller, R. J., 1988. Stock Prices, Earnings, and Expected Dividends, Journal of Finance 43, 661 – 676. Campbell, J. Y., 1991. A Variance Decomposition for Stock Returns, Economic Journal 101, 157 – 179. DeAngelo, H., DeAngelo, L., 1990. Dividend Policy and Financial Distress: An Empirical Investigation of Troubled NYSE Firms, The Journal of Finance, Vol. 45, No. 5, 1415 – 1431. DeAngelo, H., DeAngelo, L., Skinner, D., 1992. Dividends and losses, The Journal of Finance 47, 1837 – 1863. DeAngelo, H., DeAngelo, L., Skinner, D. J., 1996. Reversal of fortune Dividend signaling and the disappearance of sustained earning growth, Journal of Financial Economics 40, 341 – 371. DeAngelo, H., DeAngelo, L., 2006. The irrelevance of MM irrelevance theorem, Journal of Financial Economics 79, 293 – 315. DeAngelo, H., DeAngelo, L., 2007. Payout Policy Pedagogy: What Matters and Why, European Financial Management, Vol. 13, No. 1, 11 – 27. Dewenter, K., Warther, V., 1998. Dividends, asymmetric information, and agency conflicts: evidence from a comparison of the dividend policies of Japanese and US firms, Journal of Finance 53, 879 – 904. Dong, M., Robinson, C., Veld, C., 2005. Why individual investors want dividends, Journal of Corporate Finance, 12, 121 – 158. Eades, K. M., Hess, P. J., Kim, H. E., 1985. Market rationality and dividend announcements, Journal of Financial Economics 14, 581 – 604.
- 74 -
Eades, K. M., Hess, P. J., Kim, H. E., 1994. Time-Series Variation in Dividend Pricing, The Journal of Finance, Vol. 49, No. 5, 1617 – 1638. Easterbrook, F. H. 1984. Two agency-cost explanations of dividends, American Economic Review 74, 650 – 659. Edwards, J., Mayer, C., 1986. An investigation into the dividend and the new equity issue practices of firms: evidence from survey information. Institution of Financial Studies, No. 80. Fama, E. F., French, K. R., 1988. Dividend Yields and Expected Stock Returns, Journal of Financial Economics 22, 3 – 25. Fama, E. F., French, K. R., 1989. Business Conditions and Expected Returns on Stocks and Bonds, Journal of Financial Economics 25, 23 – 49. Fama, E. F., Jensen, M. C., 1983a. Separation of Ownership and Control, Journal of Law & Economics 26, 301 – 325. Fama, E. F., Jensen, M. C., 1983b. Agency Problems and Residual Claims, Journal of Law & Economics, 26, 327 – 349. Goergen, M., Renneboog, L., da Silva, L. C., 2005. When do German firms change their dividends?, Journal of Corporate Finance 11, 375 – 399. Gordon, M. J., Shapiro, E., 1956. Capital Equipment Analysis: The Required Rate of Profit, Management Science, Vol. 3, No. 1, 102 – 110. Gordon, M. J., 1959. Dividends, Earnings and Stock Prices, The Review of Economics and Statistics, Vol. 41, No. 2, 99 – 105. Gordon, M., 1962. The savings, investment and valuation of a corporation. Review of Economics and Statistics 44, 37 – 51. Graham, B., 2003. The Intelligent Investor, HarperBusiness Essentials. Version updated by Jason Zweig. Grullon, G., Michaely, R., Swaminathan, B., 2002. Are Dividend Changes a Sign of Firm Maturity?, Journal of Business, Vol. 75, No. 3, 387 – 424. Grullon, G., Michaely, R., Benartzi, S., Thaler, R. H., 2005. Dividend Changes Do Not Signal Changes in Future Profitability, Journal of Business, Vol. 78, No. 5, 1659 – 1682. Gugler, K., 2003. Corporate governance, dividend payout policy, and the interrelation between dividends, R&D, and capital investment, Journal of Banking and Finance 27, 1297 – 1321. Hakansson, N. H., 1982. To Pay or Not to Pay Dividend, The Journal of Finance, Vol. 37, No. 2, 415 – 428.
- 75 -
Jensen, M. C., 1986. Agency costs of free cash flow, corporate finance and takeovers, American Economic Review 76, 323 – 329. Jensen, M. C., 1993. The modern industrial revolution, exit, and the failure of internal control systems, Journal of Finance 48, 831 – 880. John, K., Kalay, A., 1982. Costly Contracting and Optimal Payout Constraints, The Journal of Finance 37, 457 – 470. John, K., Williams, J., 1985. Dividends, dilution, and taxes: a signaling equilibrium, The Journal of Finance 40, 1053 – 1070. Kalay, A., 1982. Stockholder-Bondholder Conflict and Dividend Constraints. Journal of Financial Economics 10, 211 – 233. Kalay, A, 1984. The Ex-Dividend Day Behavior of Stock Prices: A Re-Examination of the Clientele Effect, The Journal of Finance, Vol. 37, No. 4, 1059 – 1070. Kalay, A., Loewenstein, U., 1985. Predictable events and excess returns: The case of dividend announcements, Journal of Financial Economics 14, 423 – 450. La Porta, R., Lopez de Silanes, F., Shleifer, A., Vishny, R., 2000. Agency problems and dividend policies around the world, Journal of Finance 55, 1 – 33. Lee, B-S., Yan, N. A., 2003. The Market’s Differential Reactions to Forward-looking and Backward-looking Dividend Changes, The Journal of Financial Research, Vol. 26, No. 4, 449 – 468. Leftwitch, R., Zmijewski, M., 1994. Contemporaneous announcements of dividends and earnings. Journal of Accounting, Auditing and Finance 9, 725 – 762. Lintner, J., 1956. Distribution of Incomes of Corporations among Dividends, retained Earnings, and Taxes, American Economic Review 46, 97 – 113. Michaely, R., Thaler, R. H., Womack, K. L., 1995. Price Reactions to Dividend Initiations and Omissions: Overreaction or Drift?, The Journal of Finance, Vol. 50, No. 2, 573 – 608. Michaely, R., Vila, J-L., 1996. Trading Volume with Private Valuation : Evidence from the Ex-Dividend Day, The Review of Financial Studies, Vol. 9, No. 2, 471 – 509. Miller, M. H., Rock, K., 1985. Dividend policy under asymmetric information, The Journal of Finance 40, 1031 – 1051. Modigliani, F., Miller, M. H., 1958. The Cost of Capital, Corporation Finance and the Theory of Investment, The American Economic Review, Vol. 48, No. 3, 261 – 297.
- 76 -
Modigliani, F., Miller, M. H., 1959. The Cost of Capital, Corporation Finance, and the Theory of Investment: Reply, The American Economic Review, Vol. 49, No. 4, 655 – 669. Modigliani, F., Miller, M. H., 1961. Dividend Policy, Growth, and the Valuation of Shares, The Journal of Business, Vol. 34, No. 4, 411 – 433. Modigliani, F., Miller, M. H., 1963. Dividend Policy and Market Valuation: A Reply, The Journal of Business, Vol. 36, No. 1, 116 – 119. Myers, S. C., 1987. Comments on “The Information Content of Dividends, in Macroeconomics: Essays in Honor of Franco Modigliani, John Bosons, Rudiger Dornbusch, and Stanley Fischer, eds., Cambridge, Massachusetts: MIT Press. Nissim, D., Ziv, A., 2001. Dividend changes and future profitability, Journal of Finance 56, 2111 – 2133. Paxson, D., Wood, D., 1998. The Blackwell Encyclopedia of Finance, Blackwell Publishers Ltd. Roll, R., 1986. The hubris hypothesis of corporate takeovers, The Journal of Business 59, 197 – 216. Ross, S., 2005. Dividends matter: Siamese twins successfully separated!, Sloan School of Management, MIT working paper. Sadka, G., 2007. Understanding Stock Price Volatility: The Role of Earnings, Journal of Accounting Research Vol. 45 No. 1, 199 – 228. Schiller, R. J., 1984. Stock Prices and Social Dynamics, Brookings Papers on Economic Activity, 457 – 510. Shefrin, H. M., Statman, M., 1984. Explaining investors preference for cash dividends, Journal of Financial Economics 13, 253 – 282. Sierpińska, M., 1999. Dividend policy (Original title: Polityka dywidend w spółkach kapitałowych), Wydawnictwo Naukowe PWN SA, Warsaw – Krakow. Thaler, R. H., Shefrin, H. M., 1981. An economic theory of self-control. Journal of Political Economy 89, 392 – 406. Watts, Ross L., 1973. The information content of dividends, Journal of Business 46, 191 – 211. Woolridge, J. Randall and Ghosh, C., 1985. Dividend cuts: Do they always signal bad news?, Midland Corporate Finance Journal 3, 20 – 31. Vermaelen, T., 1984. Repurchase Tender Offers, Signaling, and Managerial Incentives, Journal of Financial and Quantitative Analysis, Vol. 19, no. 2, 163 – 181.
- 77 -