PARTISAN GOVERNMENTS, THE INTERNATIONAL ECONOMY, AND MACROECONOMIC POLICIES IN ADVANCED NATIONS, 1960–93 By CARLES BOIX *
W
ITHIN the comparative political economy literature of the determinants of the business cycle, there are several conflicting interpretations about the role that political parties and domestic institutions play in the management of macroeconomic conditions. A first generation of partisan models claimed that different parties could and did maintain different levels of inflation and unemployment over time. For the most part these models used evidence from the prestagflation period and equated social democracy with full employment and conservatism with price stability. Partly as a result of a shift in macroeconomic theory toward rational expectations models but mostly as a consequence of the empirical collapse of a stable Phillips curve across OECD nations, two new lines of research were generated in the early and mid-1980s. On the one hand, several political economists, incorporating rational expectations into their assumptions, predicted that partisanship had only temporary effects. On the other hand, new models stressed the need to develop a better specification of the institutional conditions—particularly the organization of the labor market and the locus of monetary authority—under which parties operate. According to the neoinstitutionalist approach, social democracy could thrive and attain its full-employment goal only in corporatist countries. Conversely, conservative cabinets could behave that way only in decentralized economies. More recently, a fourth wave of analysis, most of it qualitative in nature, has claimed that different partisan governments do not differ at all in regard to macroeconomic policies and out* An earlier version of this paper was presented at the annual meeting of the American Political Science Association, San Francisco, August 28–September 1, 1996. I wish to thank the participants for their comments, four anonymous referees for their suggestions, Bill Clark for making exchange-rate system data available, and Mark Manley and Mark Payne for research assistance.
World Politics 53 (October 2000), 38–73
PARTISAN GOVERNMENTS & MACROECONOMIC POLICIES
39
comes—even when they operate under the proper corporatist or decentralized institutional conditions. According to these studies, increasing economic interdependence, changes in the domestic processes of production, and the emergence of new electoral cleavages have altered the postwar basis of politics and led to the demise of partisan politics. And in a peculiar twist in the literature, some scholars today reject the idea that macroeconomic policies ever—even before the 1980s—distinguished social democrats from conservatives. So far most empirical work to assess the validity of these different models has been done on economic aggregates. By contrast, surprisingly little systematic research has been conducted on the impact of parties and institutions on fiscal and monetary policy instruments. Yet such work has a central place in our research agenda. For if, as part of the literature claims, partisanship and the extent of corporatist institutions affect unemployment and growth rates, it is necessary to determine through which specific policy strategies they act on the economy— that is, whether through loose monetary policies or through human capital formation. This is, in turn, relevant to understanding the nature of partisan politics, as well as to predicting how much autonomy governments will be left with in an increasingly internationalized economy. Accordingly, this articles explores the role of parties, domestic institutions, and the international economy in the evolution of fiscal and monetary policies (measured through the evolution of public deficits and of interest rates) using a sample of nineteen OECD economies from 1960 to the mid-1990s. The article shows that parties, both separately and in interaction with the organization of the labor market, have affected the conduct of fiscal and monetary policies. Still, their impact has been heavily constrained by the extent of capital mobility and the exchange-rate regime in place. The results can be summarized as the following five points: 1. After being stable and relatively similar across countries in the 1960s, monetary policy became much looser in the wake of the first economic shocks of the 1970s. It quickly tightened in the early 1980s. Real interest rates peaked in the mid-1980s and then declined slowly. Fiscal policies became expansionary in the 1970s. Afterward most countries strove for fiscal consolidation. 2. Within these overall trends, conservative governments have generally pursued more restrictive macroeconomic policies. They have kept real interest rates above the average and, except for the mid-1970s and early 1980s and then again in the mid-1990s, maintained roughly balanced budgets. 3. After being strongly committed to stable macroeconomic policies in the 1960s, socialist governments engaged in expansionary strategies in the aftermath of the oil shocks of the 1970s. But the type of policies they relied on to
40
WORLD POLITICS
smooth the business cycle varied with the organization of the domestic labor market. In corporatist countries social democratic cabinets developed strongly countercyclical budgetary measures to overcome the economic slowdown that followed the oil shocks. Yet, contrary to a rather extended view, they pursued very similar monetary policies to those of conservative-led countries. 4. Under socialist administrations in decentralized labor markets in the 1970s both monetary and fiscal policies became sharply expansionary. Keynesian demand management was reversed in the 1980s, however. Real interest rates converged to the average by the mid-1980s. By contrast, it took much longer there than in other countries to achieve fiscal discipline, and it quickly waned with the economic recession of the early 1990s. 5. The substantial cross-national variation of the 1970s—when partisan differences were significant—followed by the rapid convergence of the 1980s has its roots in the evolution of the international economy. Until the early 1980s generalized capital controls and floating exchange rates provided policymakers with considerable autonomy to respond to the stagflation crisis. Yet as international financial markets grew exponentially, capital controls lost their viability, fixed-exchange-rate regimes were reintroduced, and the socialist-led Keynesian expansions of the 1970s were no longer feasible by the mid-1980s, regardless of the labor market organization in place.
The article is organized as follows. Section I briefly reviews the theories on the impact of parties and corporatist regimes on macroeconomic policies. Section II summarizes previous empirical work and points to the empirical gaps in the literature. Section III considers the evidence for monetary policy. Section IV presents the results for fiscal policies. Section V concludes by offering a global interpretation of the results in the context of the literature on comparative political economy. This includes an assessment of the causes behind the process of internationalization, as well as a call to redefine both how we characterize corporatism and which political-economic strategies distinguish leftwing governments. I. PREVIOUS THEORETICAL WORK Several partially conflicting interpretations coexist in the political economy literature on the role of partisan politics and political institutions in the management of the business cycle through fiscal and monetary policies. Assuming a stable Phillips curve and policymakers with different goals as a function of their electoral constituencies, the initial model, or classical partisan theory, predicted permanent differences between different partisan governments in both macroeconomic policies
PARTISAN GOVERNMENTS & MACROECONOMIC POLICIES
41
and aggregates.1 Left-wing governments were predicted to pursue a Keynesian macroeconomic strategy to smooth the business cycle, hold the unemployment rate down, and boost the disposable income of the worst off. Right-wing governments, by contrast, were assumed to provide a stable and certain economic framework to private agents based on fighting inflation and running a balanced budget. Challenging the classical model of partisan politics and relaxing its underlying assumptions in several ways, more recent research, however, has downplayed the importance of parties in the determination of macroeconomic policy choices. Revising the economic assumptions that ground the classical partisan model, parties have been said to affect the economy only temporarily—unless they can count on a specific set of institutions to affect it permanently. Maintaining the political assumptions of the classical partisan model the rational partisan model has incorporated a hybrid model of the economy.2 Economic actors are fully rational in gathering information and making decisions, but they operate in markets where prices and wages do not adjust freely in the short run. In this framework the (unexpected) election of a socialist government, committed to higher growth rates and full employment, induces an economic expansion. Conversely, the electoral victory of a conservative party, geared toward price stability, leads to an economic recession. Over time, however, agents adjust prices and wages to the new conditions, and unemployment and output return to their previous rates. Thus, in the medium run partisan differences disappear.3 The literature on social democratic corporatist regimes holds that partisan differences exist and under the proper institutional arrangements are permanent. Social democratic governments can pursue noninflationary expansionary policies only if economic agents—in particular, the labor movement—agree to moderate wage increases. This requires, in turn, a highly encompassing and centrally organized union, capable both of internalizing the output and unemployment costs of excessive wage aggressiveness and of enforcing wage restraint 1 Douglas A. Hibbs, “Political Parties and Macroeconomic Policy,” American Political Science Review 71 (December 1977); idem, The American Political Economy: Macroeconomics and Electoral Politics (Cambridge: Harvard University Press, 1987). 2 Alberto Alesina, “Politics and Business Cycles in Industrial Democracies,” Economic Policy 8 (April 1989); Alberto Alesina and Howard Rosenthal, Partisan Politics, Divided Governments, and the Economy (New York: Cambridge University Press, 1995). 3 Inflation, however, is likely to remain above its preelection level under a left-wing government, because the latter’s natural preference for expansionary policies erodes its anti-inflationary credibility.
42
WORLD POLITICS
on all workers.4 In the absence of encompassing union movements, socialist parties eventually introduce stabilizing policies to avoid high inflation, a net loss of competitiveness, and electoral defeat.5 Similarly, the autonomy of governments is a function of the independence of central banks: independent central banks controlling monetary policy thwart left-wing expansionary policies.6 More recent work has fundamentally challenged on two counts the hypothesis that parties, even when relying on the appropriate domestic institutions, may ever affect economic policies. First, pointing out that partisan theories have generally been developed for closed-economy models, several scholars have stressed that parties and governments will be strongly constrained by the international economy. On the one hand, under trade openness, which has been increasing over time, a higher portion of domestic demand is satisfied abroad. Hence internally engineered expansionary policies have a small impact on the domestic growth rate. On the other hand, the higher the levels of capital mobility, the lower the autonomy of policymakers to shape fiscal and monetary policies. In a financially open economy interest rates will converge worldwide. With fixed exchange rates (and monetary policy geared toward sustaining the currency), only fiscal policy can affect domestic demand. Still, fiscal policy is constrained by the performance of the current account in the long run. With floating exchange rates monetary expansion is possible via currency depreciations, yet its effects may be quickly outweighed by the increasing cost of imports and a wage push that neutralizes the gains of the depreciation.7 Second, it has been suggested that fundamental changes in the production sphere and new electoral realignments have progressively dissolved the particular class-based coalitions that in the past had led to different unemployment-inflation preferences across political parties.8 4 Mancur Olson, The Rise and Decline of Nations (New Haven: Yale University Press, 1982); John Goldthorpe, ed., Order and Conflict in Contemporary Capitalism (Oxford: Clarendon Press, 1984); Lars Calmfors and John Driffill, “Bargaining Structure, Corporatism and Macroeconomic Performance,” Economic Policy 6 (April 1988). 5 Fritz W. Scharpf, “A Game-Theoretical Interpretation of Inflation and Unemployment in Western Europe,” Journal of Public Policy 7 ( July–September 1987); idem, Crisis and Choice in European Social Democracy (Ithaca, N.Y.: Cornell University Press, 1991). 6 Alberto Alesina and Lawrence Summers, “Central Bank Independence and Macroeconomic Performance,” Journal of Money, Credit and Banking 25 (May 1993). 7 For a review of open economy models of policy-making, see Robert O. Keohane and Helen V. Milner, eds., Internationalization and Domestic Politics (New York: Cambridge University Press, 1996). A good review of the growing internationalization of capital markets can be found in Beth Simmons, “The Internationalization of Capital,” in Herbert Kitschelt et al., eds. Continuity and Change in Contemporary Capitalism (New York: Cambridge University Press, 1999). 8 See, for example, Herbert Kitschelt, The Transformation of European Social Democracy (New York: Cambridge University Press, 1994).
PARTISAN GOVERNMENTS & MACROECONOMIC POLICIES
43
II. REVIEW OF EMPIRICAL RESULTS Most of the empirical studies on partisan business cycles have focused on the variation of economic outcomes, namely, growth rates, unemployment, and inflation, rather than on policy instruments. Initially the literature found evidence supporting the classical partisan theory and the existence of permanent differences between left-wing parties and right-wing parties regarding unemployment and inflation.9 Moreover, an influential strand of work stressed that Keynesianism had been the key basis of social democratic economic policies, which, in turn, ensured the social consensus and political stability of postwar Europe.10 More recent empirical work, based on U.S. data and OECD crossnational cross-temporal samples, shows, however, that the effects of parties tend to conform to the rational partisan model. Growth rates and unemployment vary along partisan lines after a change in government, but any differences wane completely by two years after the last election.11 Still, several problems remained unresolved in the rational partisan model. The methodology employed to test it has been considered unsuited to prove parts of its claims.12 The way in which left-wing cabinets manage fiscal and monetary policy after economic agents have adjusted to the initial shock is not well specified in the model.13 Finally, the rational partisan theory hardly accounts for the hysteretical behavior of European unemployment in the 1980s and for the emergence of learning patterns among governments having different ideological traditions. As for the impact of political institutions, recent research provides empirical confirmation of the favorable impact of social democratic corporatist regimes on growth rates.14 Finally, central bank independence has been found to curtail inflation.15 By contrast, studies on the impact of political parties and corporatist institutions on policy instruments have been fewer in number and less 9
Hibbs (fn. 1, 1977). Adam Przeworski and Michael Wallerstein, “Democratic Capitalism at the Crossroads,” in Przeworski, Capitalism and Social Democracy (New York: Cambridge University Press, 1985). 11 Alberto Alesina and Nouriel Roubini with Gerald Cohen, Political Cycles and the Macroeconomy (Cambridge: MIT Press, 1997). 12 Douglas A. Hibbs, “Partisan Theory after Fifteen Years,” European Journal of Political Economy 8 (1992). 13 Notice, also, that if economic actors are capable of either writing contracts that overcome the uncertainty of future electoral outcomes or renegotiating them immediately after elections, parties will not affect the business cycle at all. 14 R. Michael Álvarez, Geoffrey Garrett, and Peter Lange, “Government Partisanship, Labor Organization and Macroeconomic Performance, 1967–1984,” American Political Science Review 85 ( June 1991); Nathaniel Beck et al., “Government Partisanship, Labor Organization, and Macroeconomic Performance: A Corrigendum,” American Political Science Review 87 (December 1993). 15 Alesina and Summers (fn. 6). 10
44
WORLD POLITICS
systematic.16 The best accounts of macroeconomic policy-making are case studies of the evolution of social democratic corporatism in the 1960s and of several expansionary episodes under socialist governments in the late 1970s and early 1980s, showing that social democratic governments followed tight fiscal policies in the 1960s but engaged in sizable expansions in the 1970s (until the 1980s social democracy governed only in corporatist countries).17 Quantitative analyses of the effects of partisanship on fiscal and monetary instruments have been scarce and have basically focused on the interactive effect of corporatism and social democracy and, to some extent, on the impact of constitutional structures on public deficits. Interestingly, most of the quantitative research tends to depict social democratic corporatist regimes differently from how they are depicted in qualitative research, that is, as having little independent effect on fiscal and monetary policy instruments.18 A recent study of partisan policies in the context of increasing trade and financial integration concludes that as internationalization progresses, social democratic corporatist governments pursue both looser fiscal policies and tighter monetary policies.19 That analysis nevertheless pays little attention to two factors that are shown in this article to be central to the choice of macroeconomic policies: first, the variation in domestic institutions (that is, the degree of central bank independence and the organization of labor markets, especially the impact of uncoordinated wage bargaining systems on socialist strategies) and second, the interaction of the exchangerate regime and capital mobility. III. MONETARY POLICIES Figures 1 and 2 provide a general overview of the evolution of inflation and monetary policy in the advanced world from 1960 to 1994. Figure 16 The impact of electoral cycles on macroeconomic policies has been examined extensively, however. Alesina and Roubini with Cohen (fn. 11) do so in the context of a closed economy model. More recently, in examining how the international economy affects the existence of an electoral business cycle, opportunistic policies have been shown to be less likely in the presence of a fixed-exchange-rate regime and high levels of capital mobility. See William R. Clark and Usha N. Reichert with Sandra L. Lomas and Kevin L. Parker, “International and Domestic Constraints on Political Business Cycles in OECD Economies,” International Organization 52 (Winter 1998). 17 Andrew Martin, “The Dynamics of Change in a Keynesian Political Economy,” in Colin Crouch, ed., State and Economy in Contemporary Capitalism (London: Croom Helm, 1979); Fritz W Scharpf (fn. 5); Jeffrey Sachs and Charles Wyplosz, “The Economic Consequences of President Mitterrand,” Economic Policy 2 (April 1986); Peter A. Hall, Governing the Economy: The Politics of State Intervention in Britain and France (Oxford: Oxford University Press, 1986). 18 Geoffrey Garrett and Peter Lange, “Political Responses to Interdependence: What’s ‘Left’ for the Left?” International Organization 45 (Autumn 1991). For a recent analysis of the interaction of partisan politics and central banks, see Christopher Way, “Central Banks, Partisan Politics, and Macroeconomic Outcomes,” Comparative Political Studies 33 (March 2000). 19 Geoffrey Garrett, Partisan Politics in the Global Economy (New York: Cambridge University Press, 1998).
PARTISAN GOVERNMENTS & MACROECONOMIC POLICIES
45
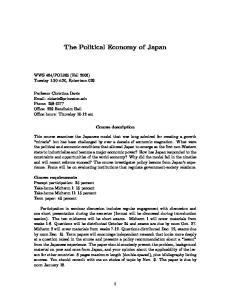
FIGURE 1 EVOLUTION OF INFLATION AND INTEREST RATES (1960–94)
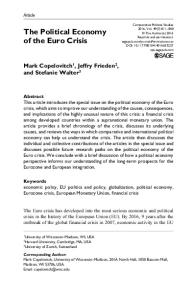
1 displays the evolution of average inflation and real short-term interest rates in the OECD; definitions and sources are listed below, in the text. Figure 2 shows the standard deviation of national interest rates. As is well known, inflation, which averaged 2 percent until the late 1960s, experienced a sharp jump in the wake of two consecutive oil price rises and then declined to pre–oil shock levels in the mid-1980s. Until 1972 real interest rates were low and relatively similar across OECD nations— economic stability and the Bretton Woods system resulted in a considerable alignment of policy in the developed world. Generally speaking, all OECD governments responded to the economic slowdown of the 1970s by first reducing interest rates. The average interest rate became negative in real terms in 1973. Still, the response to the oil shock of 1973 varied widely across nations. The standard deviation of real interest rates jumped to 5 percent; their values spread from –15 percent in Greece to 3.3 percent in Germany. Failing to curb inflation, however, most governments eventually embraced tighter monetary policies. By 1984 short-term interest rates had climbed to over 4 percent in real terms, and cross-national differences had shrunk to prestagflation levels. PARTIES, INSTITUTIONS, AND MONETARY POLICY Against this historical background, I examine the effect of partisanship and corporatist institutions on monetary policy with data for 1960–93
46
WORLD POLITICS
FIGURE 2 CROSS-NATIONAL VARIATION IN SHORT-TERM INTEREST RATES (1960–94)
from all of the OECD countries with over one million inhabitants and for which data are available: Australia, Austria, Belgium, Canada, Denmark, Finland, France, Germany, Greece, Ireland, Italy, Japan, Netherlands, Norway, Spain, Sweden, Switzerland, the United Kingdom, and the United States. The procedure to test the effects of parties, alone and in combination with corporatist structures, takes the following form: IRit
= α + α1 IR it–1 + α2 INFL it–1 + α3 GDP –DECLINE + α4 OPENNESSit + α5 SOC it + α6 d(SOCit*LABORGit) + εt
where: (1) it and it–1 are the short-term real interest rate (government yield bonds)20 in country i at times t and t – 1, respectively. (2) it–1 is the annual change in the consumer price index for country i at time t – 1.21 The coefficient is expected to be positive since governments are likely to raise interest rates in response to high inflation. (3) GDP–DECLINE is the difference between the annual growth rate at time t – 1 and time t (or ∆t–1 – ∆ t ),22 so that the variable is a 20 21 22
IMF, International Financial Statistics. Figures OECD, Main Economic Indicators.
Ibid.
are adjusted for inflation.
PARTISAN GOVERNMENTS & MACROECONOMIC POLICIES
47
positive number whenever there is a decline in the annual growth rate. The coefficient of the variable is expected to be negative since a decline in the growth rate should push governments to cut interest rates. OPENNESS refers to the extent to which the economy is open, and it is measured through two variables: (4) TRADE or the sum of exports and imports as a percentage of GDP. (5) FINANCIAL RESTRICTIONS or the presence of restrictions to capital flows. The presence of restrictions is the reverse of the Quinn’s financial liberalization index of government restrictions on international capital movements (based on the IMF’s coding), normalized to a range from 0 to 1. Increasing openness should be expected to reduce the capacity of governments to pursue expansionary monetary policies.23 The political and institutional variables are (6) SOC or socialist control of government. Since in several countries monetary policy rests in the hands of a monetary authority that is quite independent from the government, and the ability of social democratic governments to pursue expansionary policies should be lower there, the variable socialist control of government is calculated as SC*(1–CBI), where (a) SC is the share of cabinet posts controlled by socialist and communist parties every year. It runs as a continuous variable from 1 (full control of government) to 0 (no ministerial cabinets held by those parties in that given year).24 (b) CBI is the level of central bank independence. The higher the level of central bank independence, the closer the resulting variable SC*(1–CBI) will be to 0. The index of central bank independence, running from 0 (minimum independence) to 1 (maximum independence), is taken from Cukierman.25 From SC*(1–CBI) it follows that the higher the level of central bank independence, the lower the autonomy of a socialist government and the closest the country’s monetary policy will be to the one pursued by a nonsocialist cabinet. (7) LABORG is the organizational power of labor. Following Cameron, this index is calculated as the average of the average propor23 Dennis Quinn, “The Correlates of Change in International Financial Regulation,” American Political Science Review 91 (September 1997). 24 Data on partisan control of office are taken from Lane, McKay, and Newton for the period 1960–88 and, using their criteria, my own calculations based on the data published in the Keesing’s Contemporary Archives for 1989–93. Jan-Erik Lane, David McKay, and Kenneth Newton, Political Data Handbook: OECD Countries (New York: Oxford University Press, 1991). 25 Alex Cukierman, Central Bank Strategy, Credibility and Independence (Cambridge: MIT Press, 1992).
48
WORLD POLITICS
tion of the unionized labor force and the sum of the measures of organizational unity and labor confederation power in collective bargaining.26 Data for the organizational power of labor is based on Cameron for the period before 1980 and modified for the 1980s to take account of recent changes in the organization of the labor movement across OECD countries, following the data presented in Golden and Wallerstein, Lange, Wallerstein and Golden, OECD, and Traxler.27 Using data on levels of unionization it has been expanded to Greece. The index, which is standardized to homogenize results before and after 1980, goes from 0 to 1. The appendix reports the values of this index across countries and time periods. (8) The interactive term SOC*LABORG measures the presence of social democratic corporatist regimes, that is, socialist governments in countries in which there are strong and highly unified labor movements. I estimate the pooled cross-sectional time-series model through the Beck-Katz method of ordinary least squares, adjusting the standard errors for unequal variation within panels, introducing a lagged endogenous variable and correcting for autocorrelation.28 Model 1 in Table 1 displays the regression of the purely economic determinants on the dependent variable, the short-term real interest rate. Confirming the existence of substantial stickiness in monetary policy, the previous interest rate enters strongly into the regression. The positive coefficient of the inflation rate shows that high inflation in the past fuels a contractionary policy among all governments. Each point of inflation translates into an increase of about 0.16 percentage points 26 David Cameron, “Social Democracy, Corporatism, Labor Quiescence and the Representation of Economic Interest in Advanced Capitalist Society,” in Goldthorpe (fn. 4). 27 Cameron (fn. 26); Miriam Golden and Michael Wallerstein, “Trade Union Organization and Industrial Relations in the Postwar Era in Sixteen Nations” (Paper presented at the annual meeting of the American Political Science Association, New York, 1994); Peter Lange, Michael Wallerstein, and Miriam Golden, “The End of Corporatism? Wage Setting in the Nordic and Germanic Countries,” in Sanford M. Jacoby, ed., The Workers of Nations: Industrial Relations in a Global Economy (Oxford: Oxford University Press, 1995); OECD Employment Perspectives 1993 (Paris: OECD 1993); Franz Traxler, The Level and Coverage of Collective Bargaining: A Cross-National Study of Patterns and Trends (Paris: OECD, 1994). 28 All panel regressions have been run with and without fixed effects. Fixed effects imply introducing n – 1 country dummies. In the regressions on monetary policy (Tables 1 and 2), the inclusion of country dummies (to allow for variation across countries’ intercepts) does not change the coefficients of the independent variables. Except for the last model (in Table 2), the country dummies are not statistically significant (even in a joint F-test). In the regressions on fiscal policy (Tables 3 and 4) the inclusion of country dummies partially alters model 5 in Table 3—in fact intensifying the direction of the partisan and labor-market effects found in the non-fixed-effects model. Tables 1, 2, 3, and 4 (those displaying panel regression results) report the results obtained without fixed effects both because of the general lack of statistical significance of fixed effects and for theoretical reasons (the introduction of country dummies simply controls for unexplained factors; see Adam Przeworski and Henry Teune, The Logic of Comparative Social Inquiry [New York: Wiley, 1970]). Results with fixed effects can be obtained from the author.
TABLE 1 MONETARY POLICY AND PARTISAN GOVERNMENTS: A CROSS-NATIONAL T IME-SERIES ANALYSIS OF SHORT-TERM REAL INTEREST RATES (1961–94)
Constant Interest rate t-1 Inflation rate t-1 Decline in the growth rate Level of financial restrictions a
Model 1
Model 2
Model 3
–2.161*** (0.615) 0.851*** (0.039) 0.160*** (0.031) –0.058*** (0.021) –2.117*** (0.671)
–2.148*** (0.626) 0.852*** (0.041) 0.160*** (0.031) –0.058*** (0.021) –2.105*** (0.683) –0.067 (0.381)
–2.003*** (0.679) 0.810*** (0.046) 0.154*** (0.034) –0.058*** (0.020) –2.097*** (0.702)
Socialist control of governmentt a Socialist control of government, 1962–72 a
Model 4
–1.994*** –2.371*** (0.703) (0.840) 0.828*** 0.766*** (0.041) (0.048) 0.156*** 0.170*** (0.032) (0.037) –0.211*** –0.205*** (0.034) (0.034)
0.481 (0.692)
0.480 (0.806)
1.752 (1.873) 1.247* (0.710) –2.917 (2.315)
–0.844 (0.891)
–4.486*** (1.565) –0.534 (0.780) 5.699*** (2.283)
1.196 (0.703)
1.217** (0.587) 1.770*** (0.476) –2.466* (1.372)
Organizational power of labor, 1962–72 Socialist control of government * organizational power of labor, 1962–72 Socialist control of government, 1973–82 a
–1.651** (0.669)
Organizational power of labor, 1973–82 Socialist control of government * organizational power of labor, 1973–82 Socialist control of government, 1983–93 a
0.690 (0.487)
Organizational power of labor, 1983–93 Socialist control of government * organizational power of labor, 1983–93 chi2 Pr > chi2 Number of observations
659.91 0.0000 588
662.77 0.0000 588
685.22 0.0000 588
* p ≤ 0.10; ** p ≤ 0.05; ***p ≤ 0.01. a Index goes from 0 to 1. Standard errors are in parentheses.
Model 5
671.49 0.0000 558
768.75 0.0000 558
50
WORLD POLITICS
in the real interest rate the following year. A fall of one percentage point in the growth rate leads governments to cut real interest rates by 0.06 points. Trade has no statistically significant impact on interest rates and has been dropped from column 1. By contrast, the presence of restrictions in financial flows has a substantial effect on interest rates—they are 2 percentage points lower in a completely closed economy, other things being equal. Model 2 introduces the variable socialist control of office. The coefficient has the expected sign but it is rather small, with real interest rates 0.07 points lower on average under socialist governments. The coefficient is not statistically significant. The regression in model 3 explores the extent to which the response by different parties in power has varied by time period. As discussed above, international conditions, in the form of the collapse of the Bretton Woods system of fixed exchange rates, the oil shocks of the 1970s, and a continuous process of financial liberalization, have altered the environment in which policy has been made. Model 3 adds to the initial model three political variables that measure the share of left-wing ministers in 1962–72, 1973–82, and 1983–93 separately.29 This regression generates a more complex picture than the one presented in model 2. Figure 3 simulates the evolution of real interest rates under social democratic and conservative governments according to the results in Table 1, model 3.30 Within this context social democratic governments ran slightly less expansionary monetary policies in the 1960s and in the 1980s (interest rates were 0.48 and 0.69 points higher, respectively) than did conservative cabinets. But both coefficients are not statistically significant. Socialist governments responded differently than nonsocialist cabinets did in the 1970s: the coefficient is statistically significant and indicates that socialist governments lowered real interest rates by 1.65 points more than conservative governments.31 29 Results do not vary when the last year of the “stagflation” period is modified, that is, when the historical periods are 1973–79 and 1980–93. The closer the divide is to 1982, the less significant in statistical and substantive terms the effect of socialist cabinets in the 1980s. 30 For the simulation I have set all the variables at their mean levels, with the exception of partisanship and the interactive term “partisanship*organizational power of labor.” The annual change of interest rates that results from the regression is added to the world real interest rates at time t-1 to calculate the level of interest rates at time t (which is the result represented in the simulations). The world interest rate is the weighted average (by size of GDP) of the interest rates of the seven largest economies—Canada, France, Germany, Italy, Japan, the U.K., and the U.S. 31 Results not reported here show that central bank independence is an important factor in the management of monetary policy. When socialist control of government (without adjusting for the level of central bank independence) is regressed on interest rates, the size of the coefficient is smaller. For example, socialist control of the government in the 1970s reduces interest rates by 0.99 points (versus 1.65 in Table 1, model 3).
PARTISAN GOVERNMENTS & MACROECONOMIC POLICIES
51
FIGURE 3 POLITICAL PARTIES AND THE EVOLUTION OF INTEREST RATES (1961–93)
Model 4 explores the impact of social democratic corporatism by historical periods.32 Since 1973 social democratic corporatist governments have pursued looser monetary policies than have conservative governments. The coefficients are not statistically significant. The results in models 3 and 4 of Table 1 open the door to an important and not yet solved question. Did monetary policy vary as a result of partisanship alone or did it require the presence of some kind of coordination with trade unions? In other words, were the monetary expansions of the 1970s the work of socialist parties or of social democratic corporatist institutions? Comparing the size and performance of the coefficients in model 3 in Tables 1 and 2, it appears that it was socialist governments governing in decentralized wage systems that pursued loose monetary policies. Still, before answering this question, it is necessary to describe the historical evolution of socialist cabinets and social democratic corporatist regimes over time. Figure 4 plots the proportion of portfolios held by socialist and communist parties in corporatist and noncorporatist countries from 1960 to 1993.33 Except in 32 The variable of social democratic corporatism (alone or controlled by partisanship and organization of the labor market) is not statistically significant. Results are not reported here. 33 Corporatist countries are those that score more than 0.5 in the standardized index of the organizational power of labor (Austria, Belgium, Denmark, Finland, Norway, and Sweden). The noncorporatist countries are those that score less than 0.3 in the standardized index (Australia before 1980, Canada, France, Greece, Ireland, Italy, Japan, Portugal, Spain, Switzerland, the U.K. after 1980, and the U.S.).
TABLE 2 MONETARY POLICY, PARTISAN GOVERNMENTS, FINANCIAL INTEGRATION, AND U.S. I NTEREST RATES : A C ROSS -NATIONAL T IME -S ERIES A NALYSIS OF S HORT-T ERM REAL I NTEREST RATES (1961–94) a Model 1 Constant Interest rate t–1 Inflation rate t–1 Decline in growth rate Presence of restrictions Flexible exchange rate Presence of restrictions * Flexible exchange rate U.S. real interest rates a Socialist control of government Socialist control of government * Decline in growth rate Socialist control of government * Presence of restrictions Socialist control of government * Flexible exchange rate Organizational power of labor
–0.518 (0.335) 0.701*** (0.046) 0.144*** (0.034) –0.026 (0.019) –0.600 (0.869) –0.090 (0.351) –2.382* (1.412) 0.306*** (0.038) 1.575** (0.786) –0.241*** (0.094) –3.888* (2.316) –0.954 (0.787)
Organizational power of labor * Decline in growth rate Organizational power of labor* Presence of restrictions Organizational power of labor* Flexible exchange rate Socialist control of government *Organizational power of labor Socialist control of government * Organizational power of labor * Decline in growth rate Socialist control of government * Organizational power of labor * Presence of restrictions Socialist control of government * Organizational power of labor * Flexible exchange rate Chi2 836.43 Pr > ch2 0.0000 Number of observations 556 * p ≤ 0.10; ** p ≤ 0.05; *** p ≤ 0.01. a Standard errors are in parentheses.
Model 2 –0.757* (0.438) 0.690*** (0.048) 0.149*** (0.035) –0.197*** (0.067) 0.956 (1.629) –0.173 (0.475) –3.418** (1.590) 0.277*** (0.039) 1.825* (1.120) –0.200 (0.252) –4.992 (4.195) –0.190 (1.340) 0.906 (1.115) 0.054 (0.128) –3.599 (3.894) 1.028 (1.197) –1.049 (2.500) 0.300 (0.230) 3.564 (8.009) –1.601 (2.905) 818.97 0.0000 526
53
Percentage of Cabinet Portfolios
PARTISAN GOVERNMENTS & MACROECONOMIC POLICIES
FIGURE 4 ALLOCATION OF SOCIALIST PORTFOLIOS IN CORPORATIST AND NONCORPORATIST COUNTRIES (1960–63)
the mid-1970s, socialist parties controlled less than 10 percent of the cabinet portfolios in noncorporatist economies. By contrast, social democrats in corporatist nations controlled half of the cabinets in the 1960s and two-thirds of them in the 1970s. In short, before 1980 social democracy and corporatism were coterminous, whereas after 1980 they were not. The participation of socialist parties in the governments of corporatist countries declined to 47 percent—its average for the 1960s. Socialist electoral victories in several Southern European countries in the early 1980s raised the level of socialist participation in noncorporatist economies to 38 percent in the first half of the decade and to 27 percent for the 1980s as a whole. Accordingly, whereas before 1975 there were basically only two political-institutional regimes—socialist corporatist polities and nonsocialist noncorporatist regimes—after 1980 we can speak of at least three political outcomes: socialist corporatist regimes, nonsocialist decentralized economies, and socialist cabinets in decentralized wage settings. In model 5 of Table 1 I include partisanship, the organizational power of labor, and its interaction, social democratic corporatism, divided by historical periods. All the coefficients for the 1970s and the 1980s turn out to be significant (separately or, in the case of the orga-
54
WORLD POLITICS
FIGURE 5 POLITICAL PARTIES, CORPORATISM AND THE EVOLUTION OF INTEREST RATES (1961–93)
nizational power of labor in the 1970s, in a joint test). For the 1960s only the organizational power of labor is significant. To facilitate the interpretation of results, Figure 5 plots the values of this regression. Throughout the period under analysis social democratic governments in corporatist countries have maintained interest rates similar to those of conservative governments. In both cases real interest rates averaged slightly below 2 percent until the early 1970s. After dropping sharply to –2 percent in 1975–76, they returned to their historical level and then rose to about 4 percent. The behavior of socialist governments in decentralized economies has been more volatile. In the 1960s and in the 1980s they conducted a tighter monetary policy than conservative governments (by about 1.5 percentage points both before and after 1983). This was due to their incapacity to control inflation through incomes policy, the premium they have to pay to assert their credibility as left-wing governments, and the fact that they ran a looser fiscal policy than all other governments. In the 1970s, however, they reacted by lowering interest rates very sharply to about 4 percent. This exceptional period ended in the early 1980s. By 1983 real interest rates were again higher in left-wing decentralized political economies than in conservative-led countries.
PARTISAN GOVERNMENTS & MACROECONOMIC POLICIES
55
KEYNESIANISM, FINANCIAL OPENNESS, AND MONETARY EXPANSIONS The fluctuating pattern of real interest rates and the different impact of partisan governments across time suggest that two factors have played a fundamental role in shaping monetary policy over time. On the one hand, variation in real interest rates was wide in the aftermath of the oil shock of 1973 and during the ensuing economic slowdown, but not before. It is therefore plausible that partisanship becomes relevant for explaining economic performance only under conditions of economic downturn. Whereas leftist cabinets responded to economic crisis in typical Keynesian fashion, by lowering interest rates, conservative cabinets (as well as countries with fully independent central banks) did not. To explore this hypothesis, I include the variable SOC*GDP-DECLINE (a term interacting socialist control of government and the decline in the growth rate) in the regressions presented in Table 2. On the other hand, as already pointed out in Section I, the level of financial integration has risen over time, leading to a decline in the leverage governments have over monetary policy. Figure 6 shows the level of financial liberalization for four sets of countries over time. Cross-national variation remained wide until the 1970s. The average index of financial liberalization in the 1960s was 0.55 with a standard deviation of 0.23. Starting in the late 1960s there was a gradual decline in capital controls, induced by the growth of international financial markets.34 By 1979 the index of financial liberalization averaged 0.72. In the early and mid-1980s convergence toward financial deregulation sped up, first in the core of the European Community and then, reinforced by the expansion and deepening of the European Union, in both Southern Europe and the Nordic countries. To assess the impact of financial restrictions (alone and in interaction with the exchange-rate regime) on the autonomy of partisan governments, I include in Table 2, model 1: (1) The interactive term SOC*FINANCIAL RESTRICTIONS to determine the extent to which parties differ whenever capital mobility is low and there is potential room for monetary expansions. (2) FLEXIBLE or a variable that measures the exchange-rate regime under which the government operates; this variable takes the value of 1 if the currency is floating, 0.5 if it has been pegged unilaterally to any 34 John B. Goodman and Louis W. Pauly, “The Obsolescence of Capital Controls? Economic Management in an Age of Global Markets,” World Politics 46 (October 1993); Barry Eichengreen, Globalizing Capital: A History of the International Monetary System (Princeton: Princeton University Press, 1996).
WORLD POLITICS
Absence of Restrictions or Capital Flows
56
Year
FIGURE 6 EVOLUTION OF FINANCIAL OPENNESS (1960–93)
other currency (or set of currencies), and 0 if it is part of a multilateral currency agreement (such as the European Monetary System).35 (3) The interactive term FLEXIBLE * FINANCIAL RESTRICTIONS to control for the fact that under conditions of full capital mobility and a fixed exchange rate, monetary policy autonomy disappears. (4) The interactive term SOC*FLEXIBLE to ascertain the extent to which partisanship affects monetary policy under the permissive conditions created by a floating currency. (5) Finally, a term to control for the evolution of real interest rates in the United States. As a consequence, the U.S. is excluded from the regression. In model 2 in Table 2, I add the interactive terms LABORG*FINANCIAL RESTRICTIONS, LABORG*FLEXIBLE, SOC*LABORG*FINANCIAL RESTRICTIONS, and SOC*LABORG*FLEXIBLE to test for the impact of centralized labor markets and social democratic corporatism on monetary policy under different financial and exchange-rate regimes. Results in model 2 are strongly affected by multicollinearity. All interactive terms (with political or institutional variables) are not statistically significant. In a joint F-test, only socialist control of government (alone and in the interactive terms) achieves statistical significance. Accord35 The data is from IMF, Annual Report on Exchange Arrangements and Exchange Restrictions (various years), appendix.
PARTISAN GOVERNMENTS & MACROECONOMIC POLICIES
57
ingly, I discuss the results reported in model 1. They show support for the presence of some moderate Keynesian behavior among left-wing governments. A 1 percent decline in the growth rate prompts a reduction of 0.24 percentage points in the interest rate under a socialist government but hardly any reduction under a nonsocialist cabinet. The most important result, however, relates to the impact of financial liberalization and, to some extent, the exchange-rate regime. Figure 7 simulates how the interaction of different partisan governments with different levels of international integration and types of exchange-rate regimes modifies monetary policy.36 Financial restrictions emerge as a main variable shaping the conduct of monetary policy. In the first place and regardless of which party is in office, real interest rates are lower in a fully regulated economy than under a liberalized financial regime. The presence of capital controls, rather than generating higher interest rates by constraining the supply of capital, clearly allows governments to stimulate the economy. Second, only when there are capital controls do left-wing cabinets run much looser interest-rate policies than conservative cabinets. With high financial restrictions and a fixed exchange rate, the interest rate is 1.65 percent lower under a socialist cabinet than under a conservative government. It is 2.61 percent lower under a flexible exchange rate. In fact, under conditions of full capital mobility, interest rates become higher under a socialist government, especially if the currency is fixed to a multilateral currency agreement (1.58 percent higher). Higher interest rates are the premium that socialist governments had to pay in the 1980s to demonstrate their credibility in fighting inflation. Given the results of Table 2 and Figure 7 and the timing in the liberalization of capital markets (displayed in Figure 6), we must conclude that the reduction in capital controls constituted the fundamental factor behind the waning of partisan differences in the conduct of monetary policy since the mid-1980s. The choice of exchange-rate system has only a moderate effect on monetary policy, conditional on the extent of capital mobility. Under complete capital mobility interest rates do not vary much across different exchange-rate regimes: the variation is minimal under conservative governments (0.09 percent) and very moderate under a socialist cabinet (1.06 percent). The reasons, which fit the Mundell-Fleming framework, are straightforward. Under a fixed exchange regime the interest-rate 36 For the simulation I have set the control variables to their mean level in the period under analysis: Interest Rate t–1 = 2.65%, CPI t–1 = 6.55%, U.S. Interest Rates = 2.77%.
58
WORLD POLITICS
fixed
flexible
high
0.98 (1.23)
–2.04 (1.29)
none
Restrictions to Capital Controls
Exchange-Rate Regime
4.71 (0.69)
3.66 (0.78)
(a) Interest Rates under a Socialist Cabinet
fixed
flexible
high
2.63 (0.56)
0.57 (0.87)
none
Restrictions to Capital Controls
Exchange-Rate Regime
3.13 (0.24)
3.04 (0.31)
(b) Interest Rates under a Conservative Cabinet
none high
Restrictions to Capital Controls
Exchange-Rate Regime fixed
flexible
–1.65
–2.61
1.58
0.62
(c) Differences in Interest Rates between Cabinets (Socialist – Conservative) FIGURE 7 FINANCIAL LIBERALIZATION, EXCHANGE-RATE REGIMES, AND THE CONDUCT OF MONETARY POLICYa SOURCE: Estimations based on Table 2, model 1. a Standard error of the prediction is in parentheses. Restrictions to capital controls: none=0; high=0.83 (highest average yearly value). Control variables set at their mean: Interest Rate t-1=2.65%, CPI t-1=6.55%, U.S. Interest Rates=2.77%.
policy is geared to sustain the value of the currency. Under a flexible arrangement expansion, although possible, occurs via currency depreciations. By contrast, if capital movements are restricted, monetary policy through interest rates becomes sensitive to the exchange-rate regime in place; interest rates are between 2 and 3 percentage points lower (depending on the government in place) under a floating currency regime.
PARTISAN GOVERNMENTS & MACROECONOMIC POLICIES
59
IV. FISCAL POLICIES In this section I consider the effects of parties and corporatist institutions on fiscal policy. The analysis examines the evolution of fiscal deficits of the public sector, measured as the change in the debt-GDP ratio, d(DEBTit). To examine the effects of parties and corporatist institutions on fiscal deficits, I model the economic dimension underlying fiscal policy after the structural model of budget deficits used by Roubini and Sachs and Alesina, Roubini, and Cohen.37 This structural model includes the following independent variables: (1) The lagged deficit, d(DEBTit–1); according to the previous discussion, the coefficient should be positive and smaller than 1, representing the process of slow adjustment and persistence of budget deficits.38 (2) The change in the unemployment rate, d(UNEMit);39 the coefficient should be positive since an increase of the unemployment rate raises public spending on unemployment benefits and social transfers above its average level. (3) The real GDP growth rate, d(Yit); the coefficient should be negative since a decline in the growth rate depresses tax revenues below their average level. (4) The change in the interest rate minus the growth rate, multiplied by the lagged debt–GDP ratio, d(rt–nt)*DEBTit–1; the coefficient should be positive since a rise in the interest rate (over the output rate) should increase the costs of servicing the debt. This baseline economic model provides a reasonable specification of the factors that led to a sharp increase in public deficits both after the oil shock of 1973 and during the economic recession of the early 1990s. It includes the effects of any economic slowdown resulting in higher fiscal deficits due to a fall in revenues, as well as to an increase in several areas of public spending, such as unemployment benefits and active manpower policies, that are inherently countercyclical.40 It also takes into account that the adverse effects of the economic shocks of 1973 37 Nouriel Roubini and Jeffrey D. Sachs, “Political and Economic Determinants of Budget Deficits in the Industrial Democracies,” European Economic Review 33 (May 1989); Alesina and Roubini with Cohen (fn. 11). 38 Data are from Roubini and Sachs (fn. 37) and are completed with material from OECD, Economic Outlook (various years), appendix. 39 From OECD, Economic Outlook (various years). 40 Accordingly, as pointed out in Roubini and Sachs (fn. 37), the specification of the structural model is consistent with both Barro’s “tax smoothing” model and the traditional Keynesian approach to using fiscal deficits to smooth the business cycle. In both theories fiscal deficits are countercyclical. Robert J. Barro, “U.S. Deficits since World War I,” Scandinavian Journal of Economics 88, no. 1 (1986).
60
WORLD POLITICS
and 1979 were aggravated by an increase in real interest rates imposed across the world to quell inflationary expectations. U.S. real interest rates, for example, fell from an average of 2.3 percent in the 1960s to –3.5 percent in 1974 and then rose in the early 1980s to over 8 percent in 1984. This rise increased the costs of debt servicing substantially after 1979. Politics may be then expected to enter in the following way. If the partisan model presented is correct, we should, on the one hand, expect conservative governments to adhere to an equilibrium approach to fiscal policy, that is, one that seeks to minimize the impact of distortionary taxation by keeping tax rates stable and, in the wake of an economic shock that induces a fall in revenues, running a budget deficit. On the other hand, given the effects on unemployment and income distribution of economic recessions, social democratic governments should be expected to follow a Keynesian approach to fiscal policy and intensify the countercyclical nature of fiscal policy. Accordingly, I add the following stack of political variables: (5) Socialist control of government (SCt ), that is, the share of cabinet posts controlled by socialist and communist parties every year. (6) The organizational power of labor, LABORG. (7) The interactive term SCt * LABORG to measure the effect of social democratic regimes. Therefore, the basic structure of the complete political and economic model is the following (i denotes country, t denotes time, and d(x) denotes change in the variable x):41 d(DEBTit ) = α + α 1 d(DEBTit–1 ) + α 2 (UNEMit ) + α 3 d(Yit ) + α 4 d(rt – nt )*DEBTit–1 + α 5 SCit + α 6 (LABORG) + α 7 (SOC*LABORGit ) + ε t Model 1 in Table 3 reproduces the model that includes only the economic variables. The results are in line with the results of Roubini and Sachs, although the coefficient for the impact of interest rates is smaller and the one for unemployment is larger.42 The lagged deficit has a co41 The sample employed is based on Roubini and Sachs (fn. 37), extended with new OECD data when available. The countries (and sample periods) included are Australia (1967–88), Austria (1972–93), Belgium (1962–90), Canada (1962–93), Denmark (1971–93), Finland (1977–93), France (1970–92), Germany (1962–93), Greece (1984–90), Ireland (1962–93), Italy (1966–93), Japan (1971–93), the Netherlands (1972–93), Norway (1972–91), Sweden (1972–93), Spain (1985–93), Switzerland (1972–93), the United Kingdom (1962–93), and the United States (1962–93). 42 Roubini and Sachs (fn. 37). This difference may be related to the sample employed here, which is two times the size of the Roubini and Sachs sample and which corrects for the bias in the latter’s study due to its exclusion of several OECD countries.
TABLE 3 ECONOMIC AND PARTISAN DETERMINANTS OF FISCAL POLICY: A CROSSNATIONAL T IME-SERIES ANALYSIS OF CHANGE IN PUBLIC DEBT AS A P ERCENTAGE OF GROSS D OMESTIC PRODUCT (1962–93)
Constant Change in public debt t-1 Change in unemployment Annual rate of growth
Model 1
Model 2
Model 3
0.946*** (0.299) 0.514*** (0.050) 0.754*** (0.166) –0.079*** (0.033) –0.001 (0.002)
0.851*** (0.301) 0.520*** (0.050) 0.751*** (0.165) –0.081*** (0.033) –0.000 (0.002) 0.325 (0.415)
1.024*** (0.307) 0.502*** (0.040) 0.734*** (0.166) –0.089*** (0.034) –0.000 (0.002)
0.881*** 1.252*** (0.279) (0.356) 0.585*** 0.586*** (0.045) (0.039) 0.802*** 0.722*** (0.133) (0.144) –0.078*** –0.088*** (0.030) (0.027) –0.000 0.000 (0.002) (0.002)
–1.528** (0.723)
–1.419 (1.147) –3.831*** (1.309) –2.035 4.634** (1.350) (2.462) –0.279 (1.148) –0.106 (0.909) 1.221* 1.254 (0.725) (1.699) 0.777 (0.780) –1.618*** (0.740) –0.600 0.265 (0.716) (1.413) 284.97 415.35 0.0000 0.0000 417 417
Change in cost of servicing debt Socialist control of governmentta
Socialist control of government, 1962–72a Organizational power of labor, 1962–72 Socialist control of government * organizational power of labor, 1962–72 Socialist control of government, 1973–82a
1.012* (0.595)
Organizational power of labor, 1973–82 Socialist control of government * organizational power of labor, 1973–82 Socialist control of government, 1983–93 a
–0.185 (0.613)
Organizational power of labor, 1983–93 Socialist control of government * organizational power of labor, 1983–93 Chi2 176.48 182.05 Pr > Chi2 0.0000 0.0000 Number of observations 436 435
205.09 0.0000 435
* p ≤ 0.10; ** p ≤ 0.05; *** p ≤ 0.01. a Index goes from 0 to 1; standard errors are in parentheses.
Model 4
Model 5
62
WORLD POLITICS
efficient of 0.514, suggesting that about 51 percent of the lagged budget persists in the following year. A rise of 1 percentage point in the unemployment rate increases the budget deficit by 0.75 percent of GDP. The change in service debt costs does not enter significantly into the results. By contrast, high growth rates lower the public deficit substantially. Each percentage point of output growth reduces the budget deficit by 0.08 percent of GDP. Notice that this result, taken jointly with the impact of unemployment, partly explains the evolution of the public deficit before and after the stagflation crisis. Before 1973 the OECD average annual budget balance was slightly in surplus. After 1973 it experienced an average deficit of 2.8 percent of GDP. The jump in the level of unemployment from about 3 percent in the 1960s to over 7 percent in the 1980s led to an increase in the public deficit of more than 3 points of GDP on average. The fall of the average growth rate from over 5 percent before 1973 to about 2.5 percent after 1973 in turn translated into a permanent increase in the average public deficit of 0.2 percent of GDP. Model 2 introduces the variable partisan control of office to test for the impact of different parties in power. The coefficient is not significant, although it suggests that socialist governments tend to run a looser fiscal policy. After controlling for the economic determinants of fiscal balances, public debt is higher under a socialist government by about 0.325 percent of GDP—a moderate effect given that the OECD budget balance has averaged –1.37 percent of GDP with a standard deviation of 1.74 points from 1960 to 1990. Model 3 considers how partisanship has differed over time. The coefficient for left-wing cabinets is significant in the first two periods. During the 1960s they engaged in tighter policies. After 1973 they promoted instead rather substantial expansionary policies: the public deficit was on average 1 percent of GDP higher than under conservative cabinets. After 1982 (that is, when world interest rates peaked and Mitterrand’s France abandoned its expansionary package) all previous differences between parties on countercyclical fiscal policies disappeared. Model 4 examines the impact of corporatist institutions. Although not significant, the coefficient for the 1960s indicates a strongly orthodox fiscal policy. This is in line with previous historical analyses underlining the importance that socialist governments attributed to public savings as a means of increasing the rate of domestic investment. Fiscal policy became expansionary in the 1970s and differences disappeared in the following decade.
63
Fiscal Imbalance as Percentage of
PARTISAN GOVERNMENTS & MACROECONOMIC POLICIES
Year
FIGURE 8 POLITICAL PARTIES, CORPORATISM, AND THE EVOLUTION OF THE PUBLIC DEFICIT (1962–94)
Model 5 examines the joint impact of socialist cabinets and labor market organization by historical periods. The results are simulated in Figure 8.43 Before 1973 all governments ran a balanced budget. All the coefficients for the period 1962–72 are statistically significant in a joint F-test. Social democratic cabinets—all of them governing in corporatist (or semicorporatist ) economies—pursued a tighter fiscal policy than did conservative cabinets. The budget surplus was about 0.6 percent of GDP higher in those cases. This fits well with historical descriptions of the Swedish Rehn-Meidner model, which was partly directed to maintain a fiscal surplus in order to expand the level of public savings.44 After 1973 all OECD countries experienced a general trend of fiscal deterioration. In the wake of the first oil shock social democratic cabinets, particularly in corporatist countries, engaged in more expansionary policies: the public deficit was on average 1.5 percent of GDP higher than under conservative cabinets. Still a cautionary note is needed here: since coefficients for that period are not statistically significant (even in 43 44
For the simulation I have set all the variables except partisanship at their mean levels. Martin (fn. 17).
64
WORLD POLITICS
a joint test), we cannot conclude that partisan strategies were divergent in the 1970s. In the early 1980s fiscal consolidation was common across OECD countries. In 1988 the average OECD public debt declined as a proportion of the GDP for the first time in a decade and a half. The coefficients for the period 1983–93 are statistically significant in a joint F-test. They indicate that both social democratic cabinets in corporatist countries and all nonsocialist governments tightened their fiscal policy, although the recession of the early 1990s again eroded the balance of the budget. By contrast, socialist cabinets in noncentralized labor markets ran much looser fiscal policies, falling behind in the containment of public debt—the public deficit was about 1.5 percent higher than in corporatist polities.45 Table 4 explores the impact of capital mobility and different exchange-rate regimes, alone and in interaction with political variables, on the evolution of fiscal policies. Model 1 explores the impact of partisanship. Figure 9 simulates how the combination of partisanship, capital controls, and exchange-rate regime affects the size of the public deficit.46 In the presence of financial restrictions there are substantial partisan differences in the conduct of fiscal policy. Socialist cabinets run public deficits between 1.2 and 2.8 percentage points larger than those run by conservative governments. Under conditions of full capital mobility, partisan governments tend to converge in their fiscal policy, but, in line with the Mundell-Fleming model, the latter’s sign is conditional on the exchange-rate regime. A regime of capital mobility and fixed exchange rates, which allows fiscal policy to affect output, leads both types of partisan cabinets to relax their fiscal policy: in the simulation the public deficit stands at 1.39 percent of GDP under a socialist government and at 1.24 percent of GDP under a conservative cabinet. By contrast, the combination of complete capital mobility and flexible exchange rates, under which a loose fiscal policy results in the appreciation of the domestic currency, is met by both partisan governments (and especially the socialist cabinets) with an approximately balanced budget. Model 2 in Table 4 tests as well the impact of centralized labor markets and of social democratic corporatism on fiscal policy under differ45 I find no empirical evidence to support the claim that public deficits rise both with cabinet fragmentation (Roubini and Sachs [fn. 37]) and under minority governments (Per-Anders Edin and Henry Ohlsson, “Political Determinants of Budget Deficits: Coalition Effects versus Minority Effects,” European Economic Review 35 [December 1991]). The results are not reported in this article. 46 For the simulation I have set the control variables to their mean level in the period under analysis: Deficit t–1 = 0.738, Change in Unemployment Rate = 0.246, Change in Cost of Servicing Debt (DBR) = –1.78
TABLE 4 FISCAL POLICY, PARTISAN GOVERNMENTS, AND ECONOMIC INTEGRATION: A CROSS-NATIONAL T IME-SERIES ANALYSIS OF CHANGE IN PUBLIC DEBT AS P ERCENTAGE OF G ROSS D OMESTIC P RODUCT (1961–94)a Model 1 Constant Change in public debt t-1 Change in unemployment Decline in growth rate Change of servicing debt Presence of restrictions Flexible exchange rate Presence of restrictions * Flexible exchange rate Socialist control of government Socialist control of government * Decline in growth rate Socialist control of government * Presence of restrictions Socialist control of government * Flexible exchange rate Organizational power of labor
0.644 (0.364) 0.592*** (0.040) 0.649*** (0.147) 0.276*** (0.059) –0.002 (0.001) –3.349*** (1.555) –0.864** (0.475) 6.011*** (1.978) 0.145 (0.715) –0.324*** (0.112) 3.158 (2.367) –1.590** (0.909)
Organizational power of labor * Decline in growth rate Organizational power of labor * Presence of restrictions Organizational power of labor * Flexible exchange rate Socialist control of government *Organizational power of labor Socialist control of government * Organizational power of labor* Decline in growth rate Socialist control of government * Organizational power of labor* Presence of restrictions Socialist control of government * Organizational power of labor* Flexible exchange rate Chi2 303.39 Pr > ch2 0.0000 Number of observations 433 * p ≤ 0.10; ** p ≤ 0.05; *** p ≤ 0.01 a Standard errors are in parentheses.
Model 2 0.284 (0.436) 0.688*** (0.041) 0.725*** (0.122) 0.455*** (0.084) –0.001 (0.002) –3.192 (2.586) –0.423 (0.478) 4.551** (2.293) 0.282 (0.708) –0.757*** (0.290) 1.690 (2.954) –0.275 (0.976) –0.069 (1.272) –0.304 (0.191) 3.090 (5.630) –0.591 (1.678) 1.192 (1.467) 1.012** (0.484) –3.669 (7.317) –5.107 (3.718) 467.88 0.0000 411
66
WORLD POLITICS
fixed
flexible
high
–1.23 (1.16)
–3.37 (1.40)
none
Restrictions to Capital Controls
Exchange-Rate Regime
–1.39 (0.58)
1.06 (0.89)
(a) Fiscal Balance as Percentage of GDP under a Socialist Cabinet (Positive Value: Surplus; Negative Value: Deficit)
fixed
flexible
high
1.54 (1.10)
–2.59 (0.98)
none
Restrictions to Capital Controls
Exchange-Rate Regime
–1.24 (0.36)
–0.38 (0.39)
(b) Fiscal Balance as Percentage of GDP under a Conservative Cabinet (Positive Value: Surplus; Negative Value: Deficit)
none high
Restrictions to Capital Controls
Exchange-Rate Regime fixed
flexible
–2.77
–1.18
–0.14
1.44
(c) Differences in Fiscal Balance between Cabinets (Socialist vs. Conservative) FIGURE 9 FINANCIAL LIBERALIZATION, EXCHANGE-RATE REGIMES, AND THE CONDUCT OF FISCAL POLICYa SOURCE: Estimations based on Table 5, column 1. a Standard error of the prediction is in parentheses. Restrictions to capital controls: none=0; high=0.83 (highest average yearly value). Control variables set at their mean: Deficit t–1 =0.738, Change in Unemployment Rate = 0.246, Change in Cost of Servicing Debt (DBR) = –1.78.
ent financial and exchange-rate regimes. Partially due to multicollinearity, all interactive terms with political or institutional variables in model 2 are not statistically significant. A joint F-test indicates that only those interactions with the variable indicating the type of ex-
PARTISAN GOVERNMENTS & MACROECONOMIC POLICIES
67
change-rate regime are significant from a statistical point of view. With the caveat that the coefficients are not statistically robust, the following results arise from model 2 in Table 4: first, the differences between socialist governments in noncentralized economies and conservative governments are extremely similar to the differences reported in Figure 9; second, socialist governments in centralized labor markets systematically run much tighter fiscal policies than either conservative or noncorporatist socialist cabinets under flexible-exchange-rate regimes (regardless of the level of capital controls) as well as under fixedexchange-rate regimes combined with high capital controls. V. INTERPRETING RESULTS This article has looked at the impact of partisan, institutional, and international variables on fiscal and monetary policies from 1960 to the mid-1990s for a sample of nineteen OECD countries. The results can be put in simple terms: partisan and institutional differences have mattered in the conduct of macroeconomic policies but are also heavily constrained by the international context in which they are embedded. Until the early 1970s policy was conducted under conditions of rapid growth, such that policymakers, who had considerable autonomy, hardly had to exercise it. Cross-national variation in the conduct of policy instruments was low. Real interest rates were relatively similar and fiscal surpluses common. The oil shocks of the 1970s and the general economic slowdown that followed triggered a period of wide experimentation. The collapse of the Bretton Woods system led to a period of floating exchange rates (or rather flexible currency agreements, such as the European snake). With substantial legal restrictions on capital controls still in place, policymakers enjoyed considerable policy autonomy. Partisan preferences and institutional arrangement led to notable differences across countries. Even when they initially played with countercyclical policies, conservative governments quickly corrected themselves and imposed tight policies to choke off inflation. By contrast, socialist cabinets embraced Keynesianism in a more systematic fashion. The response varied, however, in accordance with the domestic institutions in place. Relying on encompassing and well-organized labor organizations willing to sustain income pacts, social democratic governments subdued inflationary shocks without resorting to drastic changes in monetary policy. In exchange for the wage moderation shown by unions and to weather the recession of the 1970s, social democratic corporatist governments ran a
68
WORLD POLITICS
much more expansionary fiscal policy than before. Socialist governments in decentralized economies relied on both sharp cuts in interest rates and very loose fiscal policies. The experimental period of the 1970s ended with the rise of U.S. rates in 1980–82 and the political fiascoes of British Labor, German social democracy, and Mitterrand’s first government. International conditions had changed in the meantime. As is apparent from Figure 6, capital controls were relatively widespread in many OECD nations in the 1960s.47 From the early 1970s onward OECD countries embarked on a gradual process of financial deregulation that peaked in the early 1990s, encouraged by the project of European monetary integration. Although the purpose of this article is not to develop an exhaustive explanation of the causes of the process of financial liberalization, the erosion of capital controls in the advanced world can be seen as the sequential combination of three factors. The growth of capital markets and technological changes, which generated important opportunity costs for those maintaining a system of capital controls, and the early adoption of liberal policies by several key countries, which heightened the costs of financial closure to the remaining states, explain the generalized movement toward financial deregulation in the OECD world. In turn, domestic conditions, mainly partisanship, explain why the pace at which capital controls were abandoned differed across countries. The process of financial liberalization had its origin in the rapid growth of capital flows that started in the 1960s. Both the expansion of the pool of international capital and parallel technological innovations in financial markets that reduced transaction costs imposed (or were perceived to impose) considerable opportunity costs on those countries that persisted in maintaining capital controls.48 The growth of capital flows did not mechanically result in the deregulation of financial markets across the OECD area, however. Rather, it combined with a process of competitive liberalization that led in due time to complete capital mobility. In a process resembling a tipping model, the relaxation of controls at first in a small set of countries triggered accelerating pressures to deregulate elsewhere over time. In the early 1970s the United States moved close to abolishing its remaining regulatory mechanisms. 47 The presence of capital controls was initially negatively correlated to the independence of the central bank. This result confirms the findings of Alberto Alesina, Vittorio Grilli, and Gian-Maria MilesiFerretti, “The Political Economy of Capital Controls,” in Leonardo Leiderman and Assaf Razin, eds., Capital Mobility: The Impact on Consumption, Investment and Growth (New York: Cambridge University Press, 1994). The degree of financial restrictions and of central bank independence in 1970 shows a Pearson’s coefficient of –0.53. For 1993 this coefficient falls to –0.05. 48 Goodman and Pauly (fn. 34); Eichengreen (fn. 34).
PARTISAN GOVERNMENTS & MACROECONOMIC POLICIES
69
Several small countries in Europe, such as Austria, Denmark, Finland, Ireland, and the Netherlands, and also Japan approved substantial reductions in their systems of capital controls throughout the 1970s. Above all, in one dramatic move in 1979 the United Kingdom abolished its full set of financial restrictions.49 As the number of countries that had embraced a liberal regime in the financial arena grew, the opportunity costs of maintaining a system of capital controls escalated for those that had not yet deregulated. There was a generalized expectation that those countries that had chosen to exclude themselves from the (expanding) zone of full capital mobility would find themselves at an increasing disadvantage in the economic arena in two ways. First, they would fail to attract foreign investment. Second, they would be perceived as unreliable in their fight against inflation. The European Single Market project, built mainly around the idea of free factor mobility, would intensify the race toward financial deregulation. To avoid forfeiting the advantages of capital mobility and a single market, both the Southern European and Scandinavian countries embraced the liberalization strategy in the late 1980s and early 1990s—including even Norway, a country that was not a member of the European Union.50 Fostered by technological changes and a shift in the expectations of policymakers, the process of financial liberalization would eventually take place in all OECD nations, though at a different pace from country to country. Nonsocialist cabinets quickly liberalized capital markets. By 49
Simmons (fn. 7). This interpretation borrows heavily from Gruber’s concept of “go-it-alone power” to explain the formation of international institutions. In Gruber’s account international institutions need not be the result of straightforward Pareto-improving cooperative agreements among equal partners. Instead, they may emerge as a set of core countries that establish agreements or embark on strategies that, modifying the status quo, force the remaining countries to join the same institution or engage in the same pattern of behavior to minimize the losses that may occur from not doing so. The process of capital deregulation (and, in particular, its institutionalization in continental Europe through the European Union project) fits this explanation particularly well. See Lloyd Gruber, “Rationalist Approaches to International Cooperation: A Call for Theoretical Reorientation,” Working Paper Series 14 (Irving B. Harris Graduate School of Public Policy Studies, August 1999); idem, “Interstate Cooperation and the Hidden Face of Power: The Case of European Money,” Working Paper Series 16 (Irving B. Harris Graduate School of Public Policy Studies, September 1999). Notice then that this account differs equally from two other interpretations. First, it differs from those that directly link the process of deregulation to changes in international financial markets. See Richard B. McKenzie and Dwight R. Lee, Quicksilver Capital: How the Rapid Movement of Wealth Has Changed the World (New York: Free Press, 1991); Richard O’Brien, Global Financial Integration: The End of Geography (London: Pinter, 1992); and Goodman and Pauly (fn. 34). Second, it is also distinct from those that attribute the decision to liberalize to purely domestic conditions, such as the hegemony of center-to-right governments in Ton Notermans, “The Abdication from National Policy Autonomy: Why the Macroeconomic Policy Regime Has Become So Unfavorable to Labor,” Politics and Society 21 ( June 1993); or such as the internal balance of power among sectoral interests in Jeffry A. Frieden, “Invested Interested: The Politics of National Economic Policies in a World of Global Finance,” International Organization 45 (Autumn 1991). 50
70
WORLD POLITICS
contrast, socialist governments, anticipating the constraining effects of dismantling capital controls on their own policy choices, retarded the process of financial deregulation. France and Spain abolished capital controls only in the late 1980s. Greece did it in the 1990s.51 The correlation coefficient between the average level of capital controls in 1980–90 and socialist control of government in that decade is 0.41. With complete capital mobility, an autonomous monetary policy became extremely hard to pursue. Socialist governments of all stripes bet on high interest rates. The importance of financial markets becomes clearer when we consider the socialist governments’ much weaker commitment to budgetary discipline. It is true that social democratic governments strove to balance the budget, but the pace of fiscal consolidation (less affected by capital mobility) and the overall rate of success varied substantially. Whereas social democratic countries made quick progress in balancing the budget, fiscal policy remained loose in decentralized economies. The Swedish net public debt was 4.2 percent of GDP in 1982, when the SAP came into power, and –5.2 percent of GDP, when it was defeated at the polls in 1991. By contrast, the Spanish net public debt grew under the PSOE government from 13 percent of GDP in 1982 to 33.4 percent in 1991.52 The role of the international environment in the shift of macroeconomic policies in the 1980s contrasts with the minor weight of two other explanatory variables that have been frequently invoked to account for the collapse of Keynesianism in the early and mid-1980s: the role of ideas and the change in the social basis of the socialist electorate.53 A purely ideational explanation, such as the diffusion of mon51 For a discussion of how several European socialist governments perceived (and justified) the deregulation of financial markets as the only possible response to a change in the external environment brought about by the policies of other (key) countries, see Carles Boix, Political Parties, Growth and Equality: Conservative and Social Democratic Economic Strategies in the World Economy (New York: Cambridge University Press, 1999). 52 This combination of loose fiscal policies and tight monetary policies was not coincidental. It was related to the structure of electoral incentives confronted by socialist parties in rather different political and institutional environments. Socialist governments in noncorporatist countries could not count on organized labor movements to achieve wage moderation and also carry over broad electoral coalitions. Without a labor movement holding blue-collar workers together and delivering their votes to the Socialist Party, social democratic governments could hardly attract simultaneously both pro-highspending left-wing voters and moderate middle-class voters concerned with taxes. A natural (and in the short term politically not costly) way to reconcile their competing claims involved running a higher budget deficit. In countries where unions are strong and parties are well-organized political machines, those political dilemmas were less pressing. For a historical account of the Spanish case, see Boix (fn. 51), 105–55. 53 For an analysis of the impact of ideas, see Peter A. Hall, “Policy Paradigms, Social Learning, and the State: The Case of Economic Policymaking in Britain,” Comparative Politics 25 (April 1993).
PARTISAN GOVERNMENTS & MACROECONOMIC POLICIES
71
etarism among elites, discounts the standard calculations politicians make about the electoral benefits of alternative economic strategies. Politicians do not abandon their ideal policies unless they anticipate (rightly or not) the negative consequences of sticking to their partisan promises. The adoption of monetarist policies by socialist cabinets followed the realization that the strategy of Keynesian demand management (and closed capital markets) was heavily punished by financial markets and, as a result, by the electorate. Similarly, it is hard to correlate the demise of Keynesian expansions with any significant change in the electoral socialist coalition. First, whereas the reduction of the working-class electorate had been a gradual process, policy shifted rather quickly (tracking changes in the extent of financial regulation). Second, it was as purely working-class-based parties that socialist cabinets actually pursued neutral or even procyclical policies in the 1960s. Finally, the growing support for socialist parties among public employees—and thus among a nontradable economic sector less sensitive to the trade effects of higher inflation—should have led the left to a stronger commitment to Keynesianism over time, yet it did not.54 Two concluding remarks are worth making in the light of the results of the article. First, the results belie the extended notion that social democratic corporatism is characterized by a particular pattern of macroeconomic policy. For several scholars the 1970s were the heyday of social democratic corporatism, that is, of expansionary macroeconomic management.55 Accordingly, the 1980s have been its tomb. In turn, for other researchers, social democracy amounts to a policy mix of income pacts plus fiscal conservatism of the kind that was found in the 1960s.56 Both policy regimes define social democratic corporatism equally well. In the 1960s democratic corporatism developed a budgetary policy in consonance with the Swedish Rehn-Meidner model: fiscal policy was tied to long-term structural policies (to build capital) that had little to do with smoothing the business cycle. In the 1970s it resorted to budget deficits in a way that minimized the employment costs of adjusting to the new conditions of the 1980s. To put it differently, more than being the equivalent of a particular policy pattern, such as Keynesianism, social democratic corporatism may be better de54 Robert J. Franzese,“Monetary Policy and Wage/Price Bargaining: Macro-Institutional Interactions in the Traded, Public, and Sheltered Sectors,” in Peter Hall and David Soskice, eds., Varieties of Capitalism: The Institutional Foundations of Comparative Advantage (forthcoming). 55 Scharpf (fn. 5, 1987 and 1991). 56 Martin (fn. 17)
72
WORLD POLITICS
scribed as an institutional regime (encompassing labor movements and a socialist government) capable of adjusting reasonably well to fluctuations in the economic cycle. For this reason, the results of this article actually serve as a cautionary note to the common interpretation of the effects of corporatism. It is standard to claim that social democratic corporatist countries avoided the high rates of unemployment that noncorporatist economies were forced to endure in order to overcome the inflationary shocks of the mid- and late 1970s because they could count on a pattern of coordination between workers and the state. But wage moderation and macroeconomic adjustment are short-term remedies that require a corresponding loss in real income that cannot be imposed permanently. The policies that have characterized corporatist social democratic countries (and differentiated them from noncorporatist conservative cases) and that have led to their low levels of unemployment lie beyond the area of macroeconomic policy-making (or, at most, complement it): rather, they consist in a long-term commitment to human capital formation and fixed investment.57 Finally, the results of this article on the impact of unrestricted capital flows on monetary policy shed light as well on the ultimate causes of the process of European integration. Conforming to the MundellFleming framework, the empirical results show that, in the presence of capital controls, countries could pursue an autonomous monetary policy and maintain relatively stable exchange rates until the early 1980s. Yet as capital mobility increased (and the opportunity costs of hindering it went up), monetary authorities could engage in expansionary policies only if they accepted corresponding currency depreciations. The benefits of an accommodating monetary policy probably outmatch the costs of having a volatile exchange rate for large economies with low levels of trade openness, such as one finds in the United States. But divergent monetary policies and differential levels of currency volatility simply become too costly for highly integrated trading partners. In the highly interwoven economies of Europe, the rapid erosion of onecountry expansions via higher import prices and domestic wage pressures disuaded politicians from adopting the Keynesian recipes of the 1970s. In the context of deregulated international markets, the introduction of a multilateral currency area or even a monetary union became a rational response in optimal or quasi-optimal currency areas. Since interest-rate differentials were washed out by the threat of capi57 At this point, it is not difficult to see, however, that a policy of public investment is not restricted to the domain of corporatism. It is an economic strategy that any social democratic government will pursue regardless of how coordinated the domestic labor market is. See Boix (fn. 51).
PARTISAN GOVERNMENTS & MACROECONOMIC POLICIES
73
tal flows, exchange-rate stability became a strictly Pareto-improving decision. In other words, the creation of the euro was the natural last step to be taken by European countries on the historical path toward powerful international financial markets, the decline of capital controls, and the demise of one-country Keynesian policies.
APPENDIX: DATA ON LABOR MARKETS AND CENTRAL BANK INDEPENDENCE Organizational Power of Labor a
Australia Austria Belgium Canada Denmark Finland France Germany Greece Ireland Italy Japan Netherlands New Zealand Norway Portugal Spain Sweden Switzerland U.K. U.S.
Central Bank Independence b
1960s
1970s
1980s
1960s
1970s
1980s
0.27 0.86 0.63 0.10 0.62 0.63 0.05 0.30 0.17 0.18 0.16 0.03 0.32 n.a. 0.93 0.22 0.03 1.00 0.23 0.30 0.08
0.27 0.86 0.63 0.10 0.62 0.63 0.05 0.30 0.17 0.18 0.16 0.03 0.32 n.a. 0.93 0.19 0.03 1.00 0.23 0.30 0.08
0.45 0.91 0.77 0.12 0.66 1.00 0.03 0.35 0.17 0.30 0.20 0.14 0.34 n.a. 0.81 0.19 0.03 0.92 0.27 0.15 0.06
0.305 0.675 0.176 0.457 0.471 0.269 0.398 0.657 0.499 0.386 0.218 0.157 0.423 0.269 0.228 n.a. 0.101 0.273 0.553 0.476 0.502
0.305 0.581 0.189 0.457 0.471 0.269 0.279 0.657 0.510 0.386 0.218 0.157 0.423 0.269 0.137 n.a. 0.101 0.273 0.553 0.309 0.502
0.305 0.581 0.189 0.457 0.471 0.269 0.279 0.657 0.510 0.386 0.218 0.157 0.423 0.269 0.137 n.a. 0.207 0.273 0.680 0.309 0.502
a Average of the average proportion of the unionized labor force and the sum of the measures of organizational unity and labor confederation power in collective bargaining. For the period before 1980, data are based on Cameron (fn. 26). For the period after 1980 data are based on Golden and Wallerstein (fn. 27); Lange, Wallerstein, and Golden (fn. 27); (fn. 27); and Traxler (fn. 27). Standardized index from 0 to 1. b Cukierman’s Legal Variables Unweighted Index; Cukierman (fn. 25), chaps. 19–21.