5.
The Political Economy of Livelihoods in India
The political economy of livelihoods has perhaps been the most underexplained yet critical aspect that people/organizations engaged in promoting livelihoods should understand and integrate into the livelihood interventions of the poor. “Political economy was the original term used for studying production, buying and selling, and their relations with law, custom, and government, as well as with the distribution of national income and wealth. Political economy originated in moral philosophy. It was developed in the 18th century as the study of the economies of states, or polities, hence the term political economy”.96 Another definition of political economy was, “the study and use of how economic theory and methods influence political ideology. Political economy was the interplay between economics, law and politics, and how institutions develop in different social and economic systems, such as capitalism, socialism and communism. Political economy analyzes how public policy was created and implemented”.97 For the purposes of this Resource Book, we define political economy as “the pattern of control over resources, the reasons thereof and the dynamics of change in the pattern over time”. Resources – land, water, forests, and capital are not evenly distributed. Some persons control significant parts of these scarce resources and by that token, acquire power over those who do not have these but need them, to make a living. The control over resources may be customary, as in the case of all land in the village being owned by hereditary chiefs in Meghalaya, or may be law-based as ‘forest land’ belonging to Forest Department is, or may be illegally acquired, as in the case of urban land controlled by a slumlord. To the extent livelihoods have been examined from the point of view of political economy, the focus had largely been on land as a resource which was unequally distributed. 96
http://en.wikipedia.org/wiki/Political_economy
97
http://www.investopedia.com/terms/p/political-economy.asp
124
Resource Book for Livelihood Promotion - Fourth Edition
Thus, agrarian relations and the problems of farmers, tenants and landless agricultural laborers, have been viewed through this lens. But there are a large number of others, such as tribals, pastoralists, and forest produce gatherers, whose livelihoods are threatened and yet it takes a lot for this to come into the ‘political’ view. To actually understand the situation, it is necessary to look at the ground situation pertaining to the key resource bases of livelihoods, namely land, water, forests and capital. We examine them one by one.
5.1 Land Land is the major basis of livelihoods for cultivators, landless laborers, livestock rearers and forest dwellers, in rural areas and for industry and habitation-based services in urban areas. India has a total land mass of 320 million ha and of this, data for 305. 6 mn ha was reported in 2009-10.98 In that year, 140 mn ha Table 27: Population and Agricultural Workers (1951-2011) (in millions) Year
Rural Agricultural Workers Population Cultivators Agricultural Total Laborers
Total Population
Average Annual Exponential Growth Rate (%)
2
3
4
5
1951
361.1
1.25
298.6 (82.7)
69.9 (71.9)
27.3 (28.1)
97.2
1961
439.2
1.96
360.3 (82.0)
99.6 (76.0)
31.5 (24.0)
131.1
1971
548.2
2.22
439.0 (80.1)
78.2 (62.2)
47.5 (37.8)
125.7
1981
683.3
2.2
523.9 (76.7)
92.5 (62.5)
55.5 (37.5)
148
1991
846.4
2.14
628.9 (74.3)
110.7 (59.7)
74.6 (40.3)
185.3
2001
1028.7
1.95
742.6 (72.2)
127.3 (54.4)
106.8 (45.6)
234.1
2011*
1210.2
1.64
833.1 (68.8)
na
na
na
1
6
7
Figures within parentheses in column 4 are percentages to the total population. Figures within parentheses in columns 5 and 6 are percentages to column 7. Source: Agricultural Statistics at a Glance, 201299
98
http://data.gov.in/dataset/pattern-land-utilization
99
Agricultural Statistics at a Glance, 2012. Govt. of India. Ministry of Agriculture. Directorate of Economics and Statistics.
The Political Economy of Livelihoods in India
125
was cultivated, 15.7 mn ha was currently fallow; 70 mn ha was under the Forest Department (though not all of it forest covered); 10.1 mn ha was permanent pastures and grazing land; 3.3 mn ha was under tree crops; 12.8 mn ha was cultivable waste; and 42.9 mn ha was barren and uncultivable land or under urban and industrial uses. According to data from the Ministry of Environment and Forests, nearly 47 percent of India’s land is used for agriculture, followed by 22.6 percent as forested and 13.6 percent as non-cultivable (roughly 41 million ha). The Central Statistical Organization (CSO) data also puts the percentage distribution of the country’s total land area at nearly the same (46.3% net sown area, 22.2% forests, 13.3% uncultivable; 3.3% as permanent pastures and other grazing land, 1.2% under tree crops included in net sown area, 5.1% cultivable wasteland and 8.2% fallow-land). According to the India Rural Development Report of 1992, nearly half of the country’s rural population was absolutely or near landless. Landlessness has been steadily rising among the SC and ST. According to NSSO data (2003-04), about 41.63 percent of HHs do not own land other than their homesteads. The data also shows that while one third of the HHs are landless, those near to landlessness add up to one third more. The next 20 percent hold less than one hectare. In other words, 60 percent of the country’s population has right over only five percent of country’s land; whereas 10 percent of the population has control over 55 percent of the land.100 Table 28: Distribution of Ownership Holdings of Land, India Category
Households (%)
Landless
31.12
0
Less than 0.4 ha
29.82
5.11
0.4-1 ha
18.97
16.89
1 -2 ha
10.68
20.47
2-3 ha
4.22
13.94
3-5 ha
3.06
16.59
1.6
15.21
0.52
11.77
5-10 ha More than 10 ha
Area Owned (%)
Source: (NSSO 2003-04)
100
Draft National Land Reforms Policy, 24th July, 2013, Department of Land Resources, Ministry of Rural Development, Government of India. Accessible at: http://dolr.nic.in/dolr/downloads/pdfs/ Draft_National_Land_Reforms_Policy_July_2013.pdf
126
Resource Book for Livelihood Promotion - Fourth Edition
The situation gets worse as we socially disaggregate the land-ownership pattern. As Table 29 below shows, between 1980 and 2000 for STs and STs in Odisha,101 a process of dispossession drove a larger number into the landless category. Table 29: Decadal Change in Landholding among Scheduled Tribes and Scheduled Castes (1980-2000) Type of holding
Scheduled Tribe Increase (%)
Scheduled Caste
Decrease (%)
Increase (%)
Decrease (%)
Marginal
64
-
95.55
-
Small
40
-
38
-
Semi-medium
-
10.25
-
0.6
Medium
-
37.22
-
28.42
Large
-
55.25
-
71
Source: Analysis Table 12, Report on Agriculture Census 1981, 1985/Agriculture Census Commissioner, Board of Revenue, Cuttack, Odisha
The stark implication of landlessness can be inferred from Table 30.112 About half of the landless reported going hungry some days of the year (1993-94) and the proportion was one-third for those with less than half a hectare of land. Of course, numerous State and Central food security and employment guarantee programs have since then corrected the hunger situation to a large extent, but it still does not address the question of livelihoods on a sustainable basis, particularly for the next generation, as they would suffer the effects of malnutrition and most likely would also be educationally disadvantaged. Another important aspect of social development— health and nutrition—has, despite its importance, received very low public spending and attention. Child and maternal mortality rates in rural areas are high and the alarming malnutrition levels have shown little improvement. There is also large social stratification, with STs and SCs having much higher rates of malnourishment, child mortality, and lower healthcare access.103
101
Status Report: Land Rights and Ownership: Orissa, 2008. UNDP, New Delhi. Accessible at http://www.undp.org/content/dam/india/docs/land_rights_ownership_in_orissa.pdf
102
Status Report: Land Rights and Ownership: Orissa, 2008. UNDP, New Delhi. Accessible at http://www.undp.org/content/dam/india/docs/land_rights_ownership_in_orissa.pdf
103
India Rural Development Report 2012-13, IDFC Rural Development Network, (IDFC Foundation, IRMA, CESS, IGIDR)
The Political Economy of Livelihoods in India
127
Table 30: Hunger and Poverty by Farm Size in Rural India Land Class
% of population Hungry
Poor
Land less
49
54
4 hectares
12
13
Source: IARI FAD/RAP study based on 50th NSS Round (1993-94)
To bring home the consequence of landlessness, we cite just one case study.
Box 10: Consequences of Landlessness
Grazing Land Dispute Turns Violent, 15 Hurt104 AURANGABAD: The long-standing dispute between villagers of Sindhi Sirajgaon on Aurangabad-Mumbai highway and the Pardhi community settlers over the possession of grazing land turned violent on Sunday night. Eight people arrested on early Monday, for assaulting and setting the huts inhabited by the Pardhi community on fire on Sunday, were sent to police custody till Thursday. The village is around 18 km from Aurangabad. At least 15 people of the Pardhi community including women and children were injured in the assault. One of them identified as Sunil Rajat Kale (30) sustained serious injuries and is struggling for life, the police said. The Pardhi community and the villagers have had a long-standing dispute over gairan land (grazing ground owned by the Government). The area is spread over 110 acres of which 60 acres fall under the jurisdiction of Sindhi Sirajgaon, while the remaining 50 acres fall in adjoining Fatulabad. The Pardhi community has been visiting and staying on a portion of the 60 acres of grazing land for generations, said police sources. The State Government had regularized 29 acres of the grazing land, following which the community began to occupy it for grazing. During their absence, some villagers who had been eyeing the land, tried to illegally take possession of the land. 104
http://articles.timesofindia.indiatimes.com/2012-12-11/aurangabad/35750365_1_police-custodyvillagers-huts
128
Resource Book for Livelihood Promotion - Fourth Edition
There are, of course, thousands of such cases of dispossession of the weak by the strong, irrespective of customary or conferred rights to use of land. Indeed, only in states or regions, where the marginal and small farmers and the landless became militant and took to violence, has this tendency been curbed to a large extent, as in the Telangana region of Andhra Pradesh, the Marathwada region of Maharashtra and the central districts of Bihar, like Gaya. In Kerala and West Bengal, the elected Communist governments took steps to recognize the rights of tenants. ‘Operation Barga’105 was carried out between 1978 and 1980 in West Bengal to recognize the rights of ‘bargadars’ or tenants and benefited millions. Unrecorded tenancies, in particular, leave tenant farmers exposed to eviction and without institutional support such as credit or subsidies. To date, the process of land acquisition based on the 1894 Land Acquisition Act, has been fraught with difficulties, with many HHs losing access to lands and livelihoods as a result of poor compensation and inadequate resettlement. The new Right to Fair Compensation and Transparency in Land Acquisition, Rehabilitation and Resettlement Act is also trying to redress the power imbalance by providing the displaced with better compensation and, in addition, resettlement and reallowance in the form of land-for-land, housing and employment or annuity payments. The Act also provides for those who may not own the acquired land but depend on it for their livelihoods. This is indeed a ‘land’mark Act!106
5.2 Water After land, water is the next important resource affecting livelihoods. Since in India, the main use of water is for agriculture which is tied up with land issues, we will not discuss the numerous conflicts related to irrigation water.107 Instead, we will focus on other livelihood uses for water, such as fisheries, and also the conflict between water for traditional livelihoods (agriculture, livestock-rearing and fisheries) and the demands of the modern sectors – industrial and urban use.
105
Bandyopadhyaya, Nripen (1981). ‘Operation Barga’ and Land Reforms Perspective in West Bengal: A Discursive Review. Economic and Political Weekly. Vol. 16, No. 25/26 (Jun. 20-27, 1981)
106
Excerpt from India Rural Development Report (ibid)
107
For an excellent overview on this, visit www.waterconflictforum.org
The Political Economy of Livelihoods in India
129
Box 11: Draft National Water Policy (2012)108
India has more than 17 percent of the world’s population, but has only four percent of the world’s renewable water resources with 2.6 percent of the world’s land area. There are further limits on utilizable quantities of water owing to uneven distribution over time and space. Public policies on water resources need to be governed by certain basic principles, so that there is some commonality in approaches in dealing with planning, development and management of water resources. These basic principles are: (i)
Planning, development and management of water resources need to be governed by a common integrated perspective considering local, regional, state and national context, having an environmentally sound basis, keeping in view human, social and economic needs.
(ii)
Principle of equity and social justice must inform use and allocation of water.
(iii)
Good governance through transparent informed decision making is crucial to the objectives of equity, social justice and sustainability. Meaningful intensive participation, transparency and accountability should guide decision making and regulation of water resources.
(iv)
Water needs to be managed as a common pool community resource held by the state, under public trust doctrine to achieve food security, support livelihood and ensure equitable and sustainable development for all.
(v)
Water is essential for sustenance of the ecosystem, and therefore, minimum ecological needs should be given due consideration.
(vi)
Water, after meeting the pre-emptive needs for safe drinking water, sanitation and high priority allocation for other domestic needs (including needs of animals), achieving food security, supporting sustenance agriculture and minimum eco-system needs may be treated as economic good so as to promote its conservation and efficient use.
(vii) All the elements of the water cycle, i.e., evapo-transpiration, precipitation, runoff, river, lakes, soil moisture, and ground water, sea, etc., are interdependent and the basic hydrological unit is the river basin, which should be considered as the basic hydrological unit for planning.
108
Draft National Water Policy (2012), Ministry of Water Resources, Government of India. Accessible at http://mowr.gov.in/writereaddata/linkimages/DraftNWP2012_English9353289094.pdf
130
Resource Book for Livelihood Promotion - Fourth Edition
(viii) Given the limits on enhancing the availability of utilizable water resources and increased variability in supplies due to climate change, meeting the future needs will depend more on demand management, and hence, this needs to be given priority, especially through (a) evolving an agricultural system which economizes on water use and maximizes value from water, and (b) bringing in maximum efficiency in use of water and avoiding wastages. (ix)
Water quality and quantity are interlinked and need to be managed in an integrated manner, consistent with broader environmental management approaches inter-alia including the use of economic incentives and penalties to reduce pollution and wastage.
(x)
The impact of climate change on water resources availability must be factored into water management related decisions. Water using activities need to be regulated keeping in mind the local geo climatic and hydrological situation.
5.2.1 Fishery as a Livelihood Table 31: Fishery as a Livelihood Option Fishermen population (as per Livestock Census, 2003) a) Number of family members Total
14,485,354
Males
4,696,158
Females
4,033,963
Children
5,755,233
b) Engaged in fishing operations Full time
933,124
Part time
1,072,079
c) Engaged in fishing related activities other than actual fishing Marketing of fish
391,000
Repair of fishing nets
245,100
Processing of fish Other activities
46,200 334,700
The Political Economy of Livelihoods in India
131
As can be seen from Table 31,109 in 2003, around three million people were engaged in fishery related livelihoods: fishing, processing, marketing and support services. In 2003, around 14.5 million people (including family members), were dependent on this livelihood. The case study below illustrates how the elegantly articulated precepts of the National Water Policy actually plays out. These include the ‘need for safe drinking water, sanitation and high priority allocation for other domestic needs (including needs of animals), achieving food security, supporting sustenance agriculture and minimum ecosystem needs’, (principle vi).
Box 12: Water Conflict: Case of Kolleru Lake
Conflict between traditional and ‘modern’ livelihoods: Kolleru Lake, Andhra Pradesh110 Kolleru, one of Asia’s largest fresh water lakes, is located in Andhra Pradesh and is a famous habitat for a number of resident and migratory birds. Situated between the Godavari and the Krishna river basins, it is an invaluable wetland ecosystem. The lake spans 90 to 100 ha and the water shrinks or expands depending on the rains; many rivulets drain into the Kolleru and surplus waters runs off into the Bay of Bengal. Abutting the lake, there are about 75 villages spread over nine mandals in Krishna and West Godavari districts with a population of 3.5 lakh as per 1991 Census. Twenty-five years ago, the water surface of the lake was 918 sq km. At the Ramsar Convention held in Spain in November 2002, Kolleru was designated one of the 11 new Indian wetlands of international importance. Rich in aquatic life, Kolleru has for a long time, provided a habitat where there is a harmonious coexistence of birds, people and life-supporting water. The resources of the lake – many rivulets such as Tammileru, Ramileru and Budameru – that brought in the floodwaters necessary to sustain it were being used by the local communities for fishing, agriculture, catching birds and so on. Records of fishing licences exist since 1956. People from Odisha and other nearby places used to migrate to the region to make a living. The government had assigned lands in the lake area to scheduled and backward castes (SCs and BCs respectively); while the BCs, who are mostly fishermen converted their lands to fish tanks, the SCs used their lands for agriculture. 109
Handbook of Fisheries Statistics, 2008, Department of Animal Husbandry, Dairying and Fisheries, Ministry of Agriculture, Government Of India, New Delhi
110
J Rama Rao, Jasveen Jairath, P Umesh, Pollution through Aqua Culture: Kolleru Wildlife Sanctuary, Economic and Political Weekly February 18, 2006
132
Resource Book for Livelihood Promotion - Fourth Edition
There are various small islands in the lake that were inhabited by fisher folk from lower castes. The fishermen would fish during the rains and take up seasonal cultivation of paddy on the land vacated by receding waters around the islands and the edge of the lake during the winter and the summer seasons. During the late 1970s, under the chief ministership of J. Vengal Rao, the fishermen were encouraged to form registered cooperative societies and loans were sanctioned to members for seasonal cultivation of one ha dry land per family. There were repeated floods and the banks and government encouraged them to convert agricultural land into fishponds and tanks. The beneficiaries were to practice collective cultivation and their remuneration was in proportion to their share. At this point, the better-off sections of the community entered the scene and took the land or water area on lease from the society members for periods ranging up to five years. This continues till date. It means that the land is actually in the name of the poor ‘beneficiaries’ – but is in fact used by the well- off sections of society while the real fishermen work for a salary of Rs 20 a day for women and Rs 40 for men. Ironically, those legally entitled to the benefit have been reduced to wage earners on their own land and water. The rich have not only taken over all the cooperative societies but have also started illegal encroachments. Till 1990, this influential class, also comprising political leaders and policy-makers who successfully did away with the real beneficiaries, were only involved in fishing – an activity that requires sweet water. Aqua Boom, Induced Death The fishermen, who were dependent on traditional fish capture until the lands were assigned, were encouraged by the government to go in for aquaculture. Some rich enterprising farmers, taking advantage of the government policy, reaped rich harvests through the scheme and their success and prosperity in the 1990s encouraged the outsiders to invest in fish tanks leading to an aquaculture boom and overexploitation of the lake. From 1992-93, aquaculture has been practiced in a big way. The problem is, it needs saline water to flourish and borewells have been sunk in the lake bed to pump out saline water for the aqua ponds; the lake bed level has sunk, the tides bring in more and more saline water into the lake since the banks have also sunk. Prawn seed is cultivated for one month in small ponds and then transferred to larger ponds with saline water. Both fish and prawn cultivation require use of chemical fertilizers, farmyard manure, chicken waste, etc. Once the harvest is over, this water stagnates and pollutes the surrounding water.
The Political Economy of Livelihoods in India
133
Unscientific and illegal aquaculture coupled with agricultural runoff from the area that also contains chemical residue, untreated water from neighboring industries and domestic sewage from areas like Vuyyuru, Hanuman Junction, Gudivada, Eluru, and Tadepalli Gudem, etc., flow into the lake and contribute to its pollution. At present, aquaculture is carried out in over 80,000 ha producing more than seven lakh tons of products with an annual turnover of Rs 4,000 crore. When Water Is Poison The degradation of the Kolleru has many implications for the weaker sections of the community. It is ironic that the main problem is to do with dearth of drinking water in the neighborhood of the largest fresh water lake in the country! It has been found that: (a)
The government does not supply drinking water to the island villages and no investments have been undertaken to rectify this situation. The few taps that exist supply polluted water. Till almost 15 years ago the villagers used to drink only lake water and now they walk three to six kilometers to get water for domestic use. Many buy sachets of water – a thriving local industry – but there are no quality checks; there is no expiry date on the packets and no treatment of water before packaging. But the illiterate villagers have no idea about the risk they incur and suffer from various water-related diseases such as diarrhea, typhoid, amoebiasis, etc.
(b)
During the last two years, prawn and fish became prone to diseases and some farms have been abandoned. These lands are useless for agriculture as well since the soil and water have been contaminated.
(c)
Young men from the area have migrated elsewhere in search of jobs while old people have taken to begging. This when ‘prawn dons’ earn up to Rs 22.5 lakh per ha in four months.
According a World Bank report,111 the total fish production in India was about 7.6 million tons, of which 61 percent was from inland fisheries and the rest was from marine sources. The situation of livelihoods in the marine fishery sector is no different. As ‘modernization’ has brought in the need to induct more and more capital, the traditional fishermen are reduced to mere wage laborers, eking out a more and more uncertain living as can be seen from the excerpts of the report: 111
India Marine Fisheries: Issues, Opportunities and Transitions for Sustainable Development. August 2010, Agriculture and Rural Development Sector Unit South Asia Region, The World Bank. Report No. 54259-IN. Accessible at https://openknowledge.worldbank.org/bitstream/handle/10986/3002/ 542590ESW0whit0ries0Report00PUBLIC0.pdf?sequence=1
134
Resource Book for Livelihood Promotion - Fourth Edition
Box 13: The Lives and Livelihoods of Marine Fishermen
The current condition of marine fishing is affecting fisher folk in the form of declining catches, reduced incomes, and increasing conflicts. This is particularly true for smaller boat owners and their crew who are unable to protect access to their resources effectively, or shift to newer and more distant fishing waters in the Indian EEZ. The rapid growth of the mechanized trawler fleet, often buoyed by the benefit of public subsidies, has increased competition for those fishing with smaller inshore vessels. Trawlers now account for an estimated 20 percent of the fishing labor force but haul in 60 percent of the catch. These issues appear to trap the poor inshore fisher folk and processors into a cycle of perpetual low profits and debt. Rising world fuel prices (until recently) put even more pressure on the viability of motorized vessels and increased calls for further subsidies from the government. Small-scale fisher folk have few points of entry into the broader state or national policy debate on marine fisheries, nor do they have easy access to programs that could sustain their livelihoods both from fishing and non-fishing sources. Education levels tend to be low, making it difficult for fisher folk to take advantage of alternative employment opportunities in the expanding national economy. Fishing communities are characterized by high levels of illiteracy, and only six percent of the fisher folk have education above secondary level. There is poor access to piped water and efficient sanitation services. Since fishing (as well as processing and trade) are labor intensive, age is an important criterion for carrying out the activity. Factors such as hard working conditions, poor living conditions, early marriages and child birth, alienation, lack of insurance and healthcare, force these people out of productive work at a relatively early age (about 50 years). The absence of old age insurance and pension adds to their problems. On the other hand, poverty and the fact that the resource can be openly and easily accessed forces children to take to fishing at a very early age, reducing opportunities for education and/or diversification. In general, all laborers without assets, working in motorized and non-motorized sectors (constituting about 60 percent of the producer’s workforce as fishing crew) are poor. The boat owners, by virtue of their assets are relatively better off, but face more risks than their workers. The crew can always move on to another activity (where these exist) or a different boat, which the boat owners cannot do so easily.
The Political Economy of Livelihoods in India
135
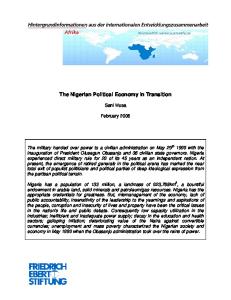
There is a heavy dependence on the informal money market for almost all stakeholders in the fisheries sector, except the large boat owners and traders who often double as money lenders to other stakeholders further down the supply chain. Smaller fisher folk rely on informal money markets to meet almost all of their consumption and life cycle needs. This dependence on the ‘informal’ and ‘internal’ money market is largely on account of cumbersome procedures of taking loans from the formal money market. The Three Phases of Development of Indian Fisheries 3
Total catch (million tonnes) Motorisation Expansion Diversification
2.5
2 Mechanisation Start of motorisation
1.5 Non Non-motorised traditional boats
Mot
1
Mec Non Mot
0.5
Mec
Non Mot Mec
0 1950
1960
1970
1980
1990
2000
Source: CMFRI 2003. Note: Non=non-motorized; Mot=motorized; Mec=mechanized
The phenomenal growth of the fisheries economy in the modernization phase was accompanied by the entry of new fishing methods, players, and trading systems that have had long-lasting impact on the life and livelihoods of the fisher folk, especially the small-scale fishermen. Mechanized trawlers now account for 20 percent of the labor force in primary fishing, yet they corner 60 percent of the catch. Smaller scale vessels (motorized and non-motorized) account for 80 percent of the labor and account for 40 percent of the catch. These changes have affected the terms of access to resources for the poor, the focus and organization of production, new systems of preservation, new market intermediaries, altered terms of trade and access to markets.
136
Resource Book for Livelihood Promotion - Fourth Edition
An FAO study in Tamil Nadu (Neiland et al 2006) indicated that of 212 small scale fisherfolk surveyed, 59 percent indicated that the viability of their principal livelihood had declined from the previous year. Of these individuals, 85 percent said that it was a matter of concern because of a greater risk of starving. Major reasons for the downturn in livelihoods were decreased fish catches and scarcity of fish during poor fishing seasons; low fish prices, especially during supply gluts, increased input costs and poor access to more distant and lucrative markets. Field results suggest that the options chosen by men under pressure from poor catches, weather patterns, etc., frequently stem from the nature of their occupation. The options chosen include shifting to another location or shifting from fishing to shore-based trade activities related to fishing and so on. One conclusion that can be drawn is that many of the alternative activities that these people take up may be no more sustainable than the ones they have left behind. This is because, the availability of alternative options as well as improving access to credit requires concerted efforts by the Government, private sector links, and long-term strategic thinking to assure the viability of the options promoted. One possible strategy to improve fisheries and non-fisheries-based livelihoods is to consider coastal dwellers within the wider economy. Salagrama and Koriya (2008) suggest that programs need to address vertical diversification (move the producer higher up the fisheries value chain) and horizontal diversification (invest in livelihood alternatives outside fishing). The new livelihood opportunities could of course be created either within the sector (e.g., new fish processing and value-added product development) or outside the sector (e.g., fisher folk developing new skills and trades in small business development, coastal forestry, agriculture, or handicrafts), or some combination of the two.
5.2.2 Alternate Demand for Water – from Industry Fisheries are not the only place where there is conflict over water as a resource for livelihoods. Increasingly, the demand from industry is becoming an important competitor to the traditional uses of water – mainly subsistence agriculture. There are hundreds of cases where water is being drawn from rivers for industrial use and this has been privileged by more recent contractual arrangements than the traditional uses. The case study below of the Sheonath River water from Chhattisgarh illustrates this conflict.112 112
Binayak Das, Ganesh Pangare: In Chhattisgarh, a River Becomes Private Property. Economic and Political Weekly, February 18, 2006
The Political Economy of Livelihoods in India
137
Box 14: Water for Traditional Livelihoods or Industries? Sheonath River flows through Borai in Durg district, Chhattisgarh. This case is about the handing over of a stretch of the river near Borai to a private firm for supplying water to the region lying between two district headquarters, Durg and Rajnandgaon. Borai is a newly developed industrial hub, promoted by the Chhattisgarh State Industrial Development Corporation (CSIDC). It is 45 km from the Raipur airport, on the National Highway 6 and the main Mumbai-Howrah railway line. The region is rich in natural minerals and Borai is at a reasonable distance of 10 km from the Bhilai Steel Plant (BSP). Surplus power is available at a reasonable cost. Surrounding the Borai region is a cluster of villages that traditionally used river water for irrigation and fishing. Sheonath River, a semi-perennial tributary of the Mahanadi had been contracted to Radius Water, a division of Kailash Engineering, for a period of 22 years. Radius Water is based in Rajnandgaon near Borai and had been managing the water distribution from the river. The build-own-operate-transfer (BOOT) project was commissioned in 2001 by the Chhattisgarh government. Under the scheme, water from the river was supplied to the industries in bulk as part of an agreement with the CSIDC. Most of the industries located here are water-intensive– distilleries, sponge iron units and thermal power plants – and CSIDC attempted to make it the hub for all water-based industries. Radius was not only responsible for supplying water but also for operating a common effluent treatment plant (CETP). Radius Water built a 4 m high dam through a technique called the Flood Regulating Barrier System along a 3.5 km stretch of the Sheonath river at a cost of Rs 4 crore. The total cost for the project was Rs 9 crore for 30 million litres per day (mld). The conflict did not start immediately. Initially, the locals were not aware that a private firm managed the new barrage that had sprung up across the river. No prior information was provided about this contract. After a few months, however, Radius Water informed the local fishermen that they were no longer permitted to fish in the 200 m zone from the barrage (on both sides) for safety reasons. There were a few skirmishes and employees of Radius Water allegedly destroyed some of the fishermen’s nets. The latter complained that their catch had dwindled after the construction of the barrage. Farmers who owned land near the river were also barred from lifting water from the river with motor pumps. This ban had the endorsement of the district administration, which also banned the installation of tube wells.
138
Resource Book for Livelihood Promotion - Fourth Edition
Many villagers from Pipalcheda, one of the surrounding hamlets, insisted that the water level in their wells had plunged since the construction of the barrage. A huge rally took place on November 1, 2003 under the banner of the Sheonath Nadi Mukti Andolan. The protesters have been questioning the very concept of the privatization of the river. They wonder how the industries department signed a contract for a river that legally falls in the purview of the irrigation department. Activists and lawyers argue that the deal violates the Madhya Pradesh Irrigation Act of 1931 and the National Water Policy, which prioritizes agriculture over industries. Natural resources cannot be signed over to individuals without taking all the stakeholders into confidence. Radius Water on the other hand insists that the upcoming industries at Borai will boost the state’s economy and that they were merely ensuring that water was supplied to them at a low price. According to them the industrial water tariff in Borai is the lowest in the country.
5.3 Forests Starting with the Indian Forests Act, 1865, the colonial government began to stake to its monopoly claim over forests, recognizing only meagre customary (‘nistar’) rights of prior use such as grazing, collection of head loads of firewood, a little bit of timber and some minor forest produce. This Act was substantially amended with a much more repressive Indian Forest Act 1879, which among other provisions, permitted arrest without warrant of those seen to be encroaching on or stealing from forests. This converted what was a symbiotic relationship between communities living on the periphery of forests and the forest ecosystem, to an adversarial one. The Forest Act, though amended several times, basically continued in the spirit of the 1879 Act. To get an idea of how this panned out after Independence, let us look at the excerpts of a report from Andhra Pradesh.113
113
V. Ratna Reddy et al Participatory Forest Management in Andhra Pradesh: A Review. Working Paper No. 62, October 2004. Center for Economic and Social Studies, Hyderabad. Accessible at http:// www.cess.ac.in/cesshome/wp percent5Cwp-62.pdf
The Political Economy of Livelihoods in India
139
Box 15: Evolution of Forest Policy – A Case Study of Andhra Pradesh About 19 percent of the 26,586 villages in Andhra Pradesh have ‘forest’ as land use. The forest area in these villages is 2.57 mha. With a total population of 10.67 million, they represent about 22 percent of the total rural population. Villages having less than 100 ha, between 100-500 ha and more than 500 ha forest area in each village, constitute 35 percent, 39 percent and 26 percent of the total villages respectively. The mean forest area per village is 506 ha. There are a number of ways land under Forest Department (FD) management may be reallocated to another use. For instance, area allotted for those rehabilitated due to projects, area occupied for different Government projects, area ‘alienated’ or ‘encroached’ by local people, irrigation projects, and so on. These kinds of activities increased over the post-independence period. For example, between 1950s and 1983-84, 2.07 lakh hectares of forestland were lost, of which, two-thirds were diverted for rehabilitation and agricultural purposes. Much of the forest area lies in Schedule V areas of the state, in which the Constitution requires the protection of tribal rights, identity and culture through a different form of administration. However, the FD has not yet acknowledged the need to subordinate forest management practices to these constitutionally more important objectives. Neither has it acknowledged that much of what it classifies as ‘encroached land’ is actually land under customary tribal podu forest fallows management. Podu cultivation involves the clearance of small patches of hill forests for subsistence cultivation (e.g., various crops including sorghum, millet). After a few years, the cultivators move on to another area. A cultivator HH may have customary tenure to a long rotation cycle of plots over perhaps 10 years or more, and move between them. A particularly significant change for local forest-dependent communities was the introduction of the AP Minor Forest Produce (MFP) (Regulation of Trade) Act, 1971, introduced with regard to Tendu leaves (used for making beedis) to ensure revenue to the government, creating a state monopoly in trading of forest produce in the state. Under this regulation, the government or an officer or an agent appointed for a unit was identified for sale, purchase , cure or otherwise process, collect, restore or transport any MFP. Penalty was to be imposed for the violation of the Act. The Andhra Pradesh Scheduled Areas MFP (Regulation of Trade) Regulations, 1979, was introduced to make provisions for the trade of certain MFP by creation of a state monopoly in such trade in the scheduled areas of the state – the Girijan Co-operative Corporation (GCC). In a major change in policy, Joint Forest Management (JFM) was implemented in Andhra Pradesh from 1992, consequent to the issuance of the first Government Order (GO).
140
Resource Book for Livelihood Promotion - Fourth Edition
Later, this Order was changed several times to incorporate pro-people measures, resulting in the GO No. 173 of December 1996. In consonance with the National Policy, the Government of Andhra Pradesh framed a revised State Forest Policy in 1993. Under this, Vana Samarakshana Samithis (VSS) were established to protect the forest resources, mainly in the hill areas. Although JFM was introduced in early 1990s, the growth in numbers was very slow till 1995-96. SD Mukherji, previously the Principal Chief Conservator in Andhra Pradesh, and an enthusiast for JFM, describes the initial scenario: “The most difficult part of JFM was to change the mindset of the foresters and restore trust between them and the people. Most foresters genuinely believed that due to their protection, JFM would bring an end to whatever little forest was left. They were also of the strong view that people’s need of forest produce, if any, should be met from Social Forestry (SF) plantations of fuelwood and fodder outside the reserved forest (RF) area. They were also afraid of losing their power and authority over the people. On the other hand, the people refused to come to the foresters even for a discussion. They would not believe the foresters because of their past experiences, where the latter mainly visited villages to book cases against the people for ‘forest offences’ such as collection of fuelwood, bamboo and timber and grazing of cattle.” From a mere 133 VSS during 1994-95, the numbers had gone up to 6,726 VSS in 2001-02, managing 16.89 lakh ha of forest area, of which about 7.85 lakh ha of degraded forests had been treated through these VSS. Around 13 lakh people, including six lakh women were involved. By 2004, the official number stands at 7,245 VSS, managing 1,886,764 ha, (or over 29% of state forest land) and involving 611,095 families. Andhra Pradesh’s benefit sharing policy is apparently the most liberal, thanks to the effective lobbying of the networks. Under the revised order of 1996, the VSS is entitled to 100 percent of the ‘net incremental value’ of timber and bamboo harvested after deducting costs. The VSS is entitled to all non-nationalized NTFP. This was further revised in January 2004 (G.O. Ms No. 4) to bring clarity into the ‘net incremental value’. According to this, the VSS shall be entitled to the following forest produce obtained from forests managed by them. i) All NTFPs, ii) all intermediate yields obtained from silvicultural operations in natural forests, iii) all timber and bamboo (including bamboo plantations) except in case of plantations, iv) in the case of teak plantations within the VSS area, whose age is known, twice the proportionate yield harvested (including yield from thinning) with reference to age of the plantation and the period of maintenance by the VSS. The Political Economy of Livelihoods in India
141
There is, however, a total absence of mechanisms for addressing and resolving the serious conflicts related to people’s rights over lands declared as state forests. A study undertaken by Samata (an NGO) in 1999 in North Coastal Andhra on the impact of JFM found that of the 1,500 acres of podu lands in 29 VSS, only 520 acres are with the people after the formation of VSS. The rest of the podu lands have been taken away under the JFM program, which some say exposes the government’s hollow claims. Struggles in many parts of rural India over forest rights are now redefining rural politics and the ‘left-wing extremism’ is partly a manifestation of this tension. These various conflicts have brought issues of resettlement of, and compensation for, people affected by development projects to the fore. Their challenges have slowly been recognized and their rights have been provided some legislative support. Recent legislation—such as the Panchayats (Extension to Scheduled Areas) Act (PESA) and Scheduled Tribes and Other Traditional Forest Dwellers (Recognition of Forest Rights) Act (FRA)—has granted communities rights to live in forests and collect and use minor forest produce, and prevent alienation of land in Scheduled Areas. But the actual implementation of these Acts has been hesitant and incomplete. Yet, the success of tribal protests against bauxite mining in the Niyamagiri hills in Odisha, with all twelve Gram Sabhas (GSs) rejecting the mining proposal in August–September 2013 under PESA, is a sign of their empowerment.114
5.4 Capital We saw in the earlier sections how lack of access to capital is a source of lasting weakness for the poor. The Indian banking sector is supposed to have been a developmental instrument, which while mobilizing savings from all HHs, would offer credit to those HHs with creditworthy projects. In 1967, Indira Gandhi put banks under ‘social control’ and then in 1969, nationalized the twenty largest private banks to ensure that banks served the needs of all-round socioeconomic growth. Following the economic reforms introduced in the 1990s, banks tried to veer away from the social banking mandate.115 But within a few years, it became clear that for reforms to work, growth must be inclusive. The realization that financial inclusion is a necessary though not a sufficient condition for inclusive growth, dawned soon. 114
India Rural Development Report 2012-13
115
This section is largely taken from a recent paper by Mahajan, Vijay 2013. Call for an Inclusive Banking Structure for India by 2019, Fifty Years after Bank Nationalization. DFID and SIDBI, New Delhi.
142
Resource Book for Livelihood Promotion - Fourth Edition
5.4.1 Four Dimensions of Financial Exclusion Data released by the RBI indicates that 58.7 percent of HHs in India avail of banking (savings) services, with the figure being 54.4 percent for rural areas and 67.8 percent for urban areas.116 The number is much lower, at 21 percent, if one talks of credit. For over a century, the Indian state has tried to address the financial needs of the masses – both credit and savings. The RBI claims that, “The banking structure played a major role in the mobilization of savings and promoting economic development.” Yet, data shows that this is far from the facts. One of the peculiar characteristics of the Indian economy is that while the savings rate is high as a percentage of GDP, running at well above 30 percent since 2000, the extent of savings in financial terms (bank deposits, bonds, insurance, mutual funds, pensions, etc.,) is usually only about half of the savings rate. The rest is saved in the form of physical assets such as gold and silver jewelery, land and buildings, livestock, durable goods and just hard cash. This dramatically reduces the possibility of utilizing the surplus of one HH or enterprise to meet the investment needs of another and, therefore, the growth prospects of the economy. To make matters worse, the banking system is able to attract only about 50 percent of the financial savings, the rest going into ‘contractual savings’ (like insurance and pensions and non-bank recurring deposits) and shares and debentures (very small proportion). Thus, we cannot conclude that the banking sector has played a major role in the mobilization of rural savings. In fact, the Post Office with 96.5 million savings clients and Rs 34,068 crore of deposits in March 2012, as also many so-called residuary non-bank finance companies were the mainstay of savings made by the lower income groups and the rural HHs, till they were barred a few years ago. Had the banks been more pro-active, a larger share of savings would have come to them. We have identified at least four dimensions to financial exclusion and we will present data on each of them.
• • • • 116
Spatial – metro-urban-rural and across regions, states and districts Sectoral – agriculture, industry, services and sub-sectors within Segmental – sections of population – women, scheduled tribes, scheduled castes, minorities and the disabled Size and status – large and formal/organized vs small and informal
http://rbi.org.in/Scripts/BS_SpeechesView.aspx?Id=813 consulted on 14 Jun 2013
The Political Economy of Livelihoods in India
143
The most obvious spatial inequality is across the rural-urban spectrum. Before we go into the detail of this, we hasten to add that ‘urban’ does not mean ‘included’ and indeed, there is a sizeable lower-income population in metropolitan areas that endures financial exclusion as much as the rural populace. Unfortunately, urban exclusion is not measured since urban data gets aggregated across wards. Generally, policy makers think of exclusion in terms of lack of access to credit but as can be seen from Table 32, even on the issue of savings, where the rural-urban differences should not be as stark, there is much lower deposit mobilization in rural areas. Thus, rural areas account for only 9.2 percent of the deposit amount, while metropolitan areas account for 56.9 percent of the deposit amount as on 31st March 2011. A similar situation exists for credit – rural areas account for 9.6 percent of the outstanding loan amount, while metropolitan areas account for 60.4 percent of the loan amount as on 31st March 2011. The share of semiurban credit was about 11.1 percent the share of urban areas was 19.1 percent, while metropolitan credit was about 60.2 percent. In terms of the number of loan accounts, again the inequality is less, with rural areas having 33.1 percent of the accounts, whereas all the others have 66.9 percent as on 31st March 2011. The CD ratio for rural areas at 79.6 percent is better than the system average of 75.6 percent in 2011. This is due to the expansion of rural bank branches and setting up of Regional Rural Banks (RRB) network. There is a lot of inter-state disparity in availability of credit. Maharashtra, which accounts for more than one-fourth of gross credit by banks in the country, has one of the lowest shares of rural credit to total credit. The gross bank credit by banks in Maharashtra as on September 2012 was Rs 14,109 billion which is about 29 percent of India’s gross credit. However, the share of rural credit in the credit given by banks in the state was Rs 289 billion or just two percent of the state’s gross bank credit. In fact, it appears, the less urbanized a state, the lower is this inequality. Given is data on rural credit as a proportion of the total in the major states of India.
144
Resource Book for Livelihood Promotion - Fourth Edition
Table 32: State-wise Share of Rural and Semi-urban Credit to Total Credit State
Percentage of rural credit of total credit
Percentage of semi-urban credit of total credit
Bihar
33
25
Uttar Pradesh
23
14
Madhya Pradesh
17
19
Rajasthan
15
16
Andhra Pradesh
13
14
Karnataka
11
10
Tamil Nadu
9
17
Gujarat
8
10
West Bengal
7
3
Maharashtra
2
2
0.87
0.07
New Delhi
Source: http://www.business-standard.com/article/finance/only-8-of-gross-bank-credit-of-allscheduled-commercial-banks-go-rural-areas-113061200564_1.html
As can be seen from Table 33 below, the industrial sector gets more than its proportion of the sectoral GDP, while agriculture gets less. Yet, agriculture is getting credit more or less in proportion to its GDP share (about 14% each). The share of credit to the services sector is far below the share of GDP. This is partly because a large part of the services sector, particularly health, education, public administration and defence services is government funded and does not use any bank credit. Also, the larger share of services is in the informal sector, where again credit, though needed, is not available. Table 33: Sectoral GDP and Credit Availability Sector
Agriculture
Availability of Credit
Sectoral credit as % of total
Sectoral GDP
(in billions) (2011-12) Sectoral GDP as % of total
Credit as a percentage of GDP
5,225
14.9
7,395
14.1
70.7
Industry
19,675
56.1
14,425
27.5
136.4
Services
10,168
29.0
30,616
58.4
33.2
Total
35,068
100.0
52,436
100.0
66.8
Source: 1. Planning Commission 2. Central Statistics Office (CSO)
The Political Economy of Livelihoods in India
145
Within each sector, there is further inequality. The Micro and Small Industry (mainly small) accounts for only six percent of the 46 percent share of credit availed by industry. Within services, trade (wholesale and retail) and financial services account for a lion’s share of the credit. Inequality of access to credit in agriculture is well-known. While large farmers grab a lion’s share of the agricultural credit given by banks, marginal farmers, who constitute over 80 percent of the farmers by number, got less than 42 percent of the total agricultural credit in 2001-02. Until recently, sharecroppers and oral (unrecorded) tenants had no recourse to formal credit. Table 34: Percentage Distribution of Number of Accounts from Institutional Sources across Size and Class, 2001-02 Size and Class of Holding (hectare) Marginal,