Goldstream Willa Gold Project
Willa Deposit Slocan Mining District, British Columbia
Preliminary Assessment
Technical Report For
Orphan Boy Resources Inc. Suite 410, 325 Howe Street, Vancouver, BC V6C 1Z7 By David K. Makepeace, P.Eng. Geospectrum Engineering 2588 Birch Street Abbotsford, British Columbia
March 28, 2003
Table of Contents TABLE OF CONTENTS ........................................................................................................... 2 SUMMARY ................................................................................................................................... 4 INTRODUCTION......................................................................................................................... 5 TERMS OF REFERENCE ................................................................................................................. 5 PROPERTY DESCRIPTION...................................................................................................... 5 LOCATION .................................................................................................................................... 5 ACCESSIBILITY............................................................................................................................. 5 PHYSIOLOGY ................................................................................................................................ 7 CLAIMS ........................................................................................................................................ 7 PRESENT INFRASTRUCTURE ......................................................................................................... 9 HISTORY .................................................................................................................................... 11 GEOPHYSICS .............................................................................................................................. 13 GEOCHEMISTRY ......................................................................................................................... 13 DIAMOND DRILLING .................................................................................................................. 15 HISTORIC MINERAL RESOURCES ................................................................................................. 16 HISTORICAL SAMPLING, PREPARATION, ANALYSIS, SECURITY ................................................... 18 GEOLOGY.................................................................................................................................. 19 REGIONAL GEOLOGY ................................................................................................................. 19 PROPERTY GEOLOGY ................................................................................................................. 19 Rossland Group Volcanics.................................................................................................... 20 Quartz Latite Porphyry ......................................................................................................... 20 Feldspar Porphyry ................................................................................................................ 21 Heterolithic Breccia.............................................................................................................. 21 Nelson Granite ...................................................................................................................... 21 Lamprophyre Dykes .............................................................................................................. 21 Structure................................................................................................................................ 23 DEPOSIT TYPE ......................................................................................................................... 23 MINERALIZATION....................................................................................................................... 23 West Zone.............................................................................................................................. 23 Main Zone ............................................................................................................................. 24 East Zone .............................................................................................................................. 24 MINERAL RESOURCE ESTIMATE...................................................................................... 24 DATA VERIFICATION .................................................................................................................. 24 DIGITAL DATA COMPILATION .................................................................................................... 27 Drill Hole Data ..................................................................................................................... 27 Muck/Chip Sample Data ....................................................................................................... 28
Topography ........................................................................................................................... 28 Underground Workings ........................................................................................................ 29 Geological Assay 3D Model ................................................................................................. 29 BLOCK MODEL ........................................................................................................................ 30 ASSUMPTIONS ............................................................................................................................ 30 Units...................................................................................................................................... 30 Cutoff Parameters................................................................................................................. 30 Raw Data .............................................................................................................................. 30 Composite ............................................................................................................................. 31 Variables ............................................................................................................................... 31 Model .................................................................................................................................... 32 Block Model Interpolation .................................................................................................... 32 Block Model Report .............................................................................................................. 33 CLASSIFICATION ........................................................................................................................ 33 Measured Mineral Resource................................................................................................. 34 Indicated Mineral Resource.................................................................................................. 34 Inferred Mineral Resource.................................................................................................... 35 DISCUSSION .............................................................................................................................. 35 MINING OPERATION ................................................................................................................... 36 EXPLORATION RECOMMENDATIONS............................................................................. 37 UNDERGROUND EXPLORATION .................................................................................................. 37 Area A ................................................................................................................................... 37 Area B ................................................................................................................................... 41 Area C ................................................................................................................................... 41 Area D................................................................................................................................... 41 Area E ................................................................................................................................... 41 Area F ................................................................................................................................... 42 Underground Drill Summary................................................................................................ 42 SURFACE EXPLORATION ............................................................................................................ 43 EXPLORATION COSTS ................................................................................................................. 45 CONCLUSIONS ......................................................................................................................... 46 REFERENCES............................................................................................................................ 47 CERTIFICATION OF AUTHOR............................................................................................. 48 VALIDATION ASSAY SHEETS.............................................................................................. 50 DETAILED MINERAL RESOURCE SHEETS ..................................................................... 56
Summary Orphan Boy Resources Inc. has acquired 100 % interest in the Willa Deposit which is situated in the Slocan Valley of southeastern British Columbia, Canada. It is a large gold-copper-silver breccia pipe deposit within a volcanic roof pendant which is surrounded by a granitic batholith. The Willa Deposit has been known of for over one hundred years. There has been roughly $12 million dollars spent on underground development and drilling since 1980. It has a known mineral resource, last up-dated in 1988. Substantial additional work has been completed on the deposit since that time, including mine planning, metallurgical analysis and environmental baseline studies. All known drill hole data has now been converted to digital format and for the first time the deposit can be viewed in three-dimensional space (3D). A detailed block model has been developed and filled using an ID3 estimation method. Using the most recent mineral resource calculations (1988) assumptions and constraining the block model to conform to National Instrument 43-101, a new mineral resource calculation has been derived. The new Mineral Resource for the Willa Deposit is: Category
Tonnes (mt) Measured 487,989 Indicated 292,457 Inferred 216,177 996,623 Total Note: Cutoff is 3.5 g/mt Au
Gold (g/mt Au) 6.77 5.31 6.55 6.30
Copper (%) 0.97 0.65 0.57 0.79
Silver (g/mt Ag) 11.59 11.94 7.32 10.77
Each of the previous operators on the property stated, in relatively general terms, that there was potential to expand the mineral resources. Using the 3D model, several areas have been identified immediately adjacent to the known mineralized zones which have either been under-drilled or not drilled at all. A series of strong geochemical anomalies within a kilometer and a half of the deposit have identical signatures to the Willa Deposit anomaly. These anomalies have had limited exploration work completed on them due to the rugged terrain in the area. A success-contingent exploration program has been developed for both underground and surface targets with the intent of delineating additional mineralization that could substantially increase the present mine life. There is sufficient justification, coupled with the known Mineral Resource of the deposit, to advance this project to a feasibility decision.
Introduction The Willa deposit is an intrusive breccia hosted gold-copper-silver mineralized orebody located near Silverton, B.C. in the Slocan Mining Division, southeastern British Columbia, Canada.
Terms of Reference The purpose of this Study is to examine the Willa Deposit on a preliminary assessment basis, utilizing current industry operating practices to determine if there are the potential mineral resources to undertake further technical feasibility and economic viability studies of the project. It conforms to National Instrument 43-101 F1 requirements. With the aid of 3D computer modeling, this mineral resource potential can be quantified. New exploration targets can be identified and subsequently explored. Under-explored areas around the boundaries of the present mineral resource can also be identified for further exploration. Mr. Toshiaki Suyama (Dowa Mining Co. Limited representative), Mr. Ernst Binder (Procon Mining and Tunnelling Ltd. representative, Mr. Steve Phillips (local geologist) and Mr. Dave Makepeace (Technical Report author) visited the underground and surface workings on November 26 and 27, 2002. Both Mr. Phillips and Mr. Makepeace also visited the property in the 1980’s on several occasions.
Property Description Location The Willa deposit is located in the Slocan Valley of southeastern British Columbia. The deposit is in the northwest portion of NTS map sheet is 082F14W at 5525724 mN (49° 53’ 00” N) and 473579 (117° 22’ 04” W) [NAD 83]. The Willa property has an elevation range between 800 and 2400 meters msl. The MINFILE number for the deposit is 082FNW071. The National Mineral Inventory number of the deposit is 082F14Cu1. The property is 2 kilometers east of Slocan Lake and approximately midway along this major body of water.
Accessibility The property is located approximately 7.5 kilometers south of the town of Silverton, 12 kilometers south of the town of New Denver and 15 kilometers north of the town of Slocan. The major communities of Nelson, Castelgar, Trail and Revelstoke are easily accessible from the property. The major airport for the region is at Castelgar.
Highway 31A Carpenter
Creek
BRITISH COLUMBIA
NEW DENVER
h Hig y6 wa
Goldstream Idaho Revelstoke Peak Kamloops 2,280 Willa Vancouver
LA KE
N
CA N
Silve rto
n
Cr
0
SCALE 1000
2000
Meters
ee k
1025 Level 1100 Level Creek
Creek
untai n Ro ad k
Wi ld
Maurie r
Ve ve
Red M o Cree k
Willa Gold-Copper-Silver Little Daisy Cre Deposit e
Aylwin 6
nd Creek gla
C on go
H ig hw ay
Mount Twigg
Fin
y
Cr ee k
S LO
Vahalla Provincial Park
SILVERTON
Cree
ORPHAN BOY RESOURCES INC. Goldstream Willa Gold Project
k
Slocan Mining Division British Columbia, Canada Aylwin Lake
Location Map Date : February, 2003
Geospectrum Engineering
The all-weather paved Provincial Highway 6 runs along the western claim boundary while the all-weather gravel Red Mountain Forest Service Road traverses the northern boundary of the claims. The entrance to the property is 800 meters east of Highway 6 along the southern entrance of Red Mountain Road. A four-wheel drive road connects all the underground workings.
Presently the upper, old (Willa No. 1, Willa No. 2, Rockland and Little Daisy) adits are inaccessible by vehicles due to two major washouts on the road network at Little Daisy Creek and Aylwin Creek.
Physiology The Willa property is in forested, rugged terrain with elevations ranging from 825 meters to 2442 meters at the ridge top separating Aylwin/Congo/Levey Creeks in the north from Enterprise Creek in the south. Slopes are frequently greater than 35°. At low elevations the undergrowth can be quite thick with Devel’s Club, Stinging Nettles and slide Alder. The forest is predominantly Poplar and Birch. The main portion of the property is Western Hemlock, Western Red Cedar, Douglas Fir and Larch. At the higher elevations the forest grades into Englemann Spruce and Alpine Fir and then into alpine meadows and windswept ridges (Heather, 1985). The climate consists of cool winters and warm summers. A maximum temperature range of between –34° and +40° C (Heather, 1985) has been recorded but many years the range is –5° and +30°. The annual precipitation can be quite high (1205 mm/year, Heather, 1985).
Claims Orphan Boy Resources Inc. by way of an Option to Purchase Agreement, acquired a 100% interest in the Willa property from Mr. P. Leontowicz, Mr. B Wingert and Mr. M. Huddock on June 17, 2003. The company paid the three Willa property owners $15,000 cash prior to July 1, 2002 and issued 20,001 common shares of the Company, valued at $15,000 on July 24, 2002. The total compensation to the Willa property owners is $300,000 (50% may be paid in Orphan Boy’s shares at the Company’s sole option). It is to be paid on or before July 1, 2004. The Willa property owners retain a 1% NSR royalty up to $500,000 and then is reduced to 0.5% afterwards. Orphan Boy has the option to purchase the entire royalty at any time prior to July 2015 for a fixed price. On July 18, 2002, the TSX Venture Exchange approved the Option to Purchase of the Willa Deposit.
High way 6
N
LA
KE
5529000 mN
OB 1 394300 Con go
AN
OB 2
SL OC
394301 Ay l
5527000 mN
Cree k
w in
Rush 1
OB 3
390104
394302
Willa Au-Cu-Ag Deposit
Cre ek 5525000 mN
Mt. Scenery (ML) En te rp
257280
Willa 3 367869
rise
5523000 mN
C re
ek
Willa 4
Willa 5
367870
Hi gh wa y6
367911
SCALE 1
475000 mE
0
477000 mE
5521000 mN
2
Kilometers
ORPHAN BOY RESOURCES INC. 5519000 mN
Goldstream Willa Gold Project
473000 mE
471000 mE
469000 mE
Slocan Mining Division British Columbia, Canada
Claim Map Date : February, 2003
Geospectrum Engineering
The Willa property is composed of 7 mineral claims and one mineral lease that cover 2,242.28 ha. The claim locations are illustrated on the following map and the claims and their status are listed on the following table.
Willa Property Claims Claim Name
No. Units
Tenure No.
WILLA 3 WILLA 4 WILLA 5 OB 1 OB 2 OB 3 Mt Scenery (ML) RUSH 1 Total
20 18 12 12 9 12
367869 367870 367911 394300 394301 394302 257280 390104
16 99
Expiry Date September 30, 2003 September 30, 2003 September 30, 2003 September 30, 2003 September 30, 2003 September 30, 2003 July 6, 2003 September 30, 2003
There are no liabilities on the property to the best of the author’s knowledge. Environmental liability in the form of acid rock drainage (ARD) was a concern to government agencies but long-term water sampling as well as ore and waste rock analysis has proved that this is not an issue for this deposit due to the significant buffering capacity of the lithologic package. The deposit is close to production due to the present underground workings and the extensive environmental baseline studies and assessment reports. The company is proceeding rapidly to obtain a waiver under the new British Columbia Environmental Assessment Process. All permits required to proceed to production will be obtained once the Environmental Assessment approval has been obtained.
Present Infrastructure The 1025 Level Portal was the main access to the deposit historically. The portal area had a surface repair shop, charging station, compressor house, generator house and dry/office. These structures have all been removed. The wood in the cribbed ore dump area is rotten and will need to be replaced or removed. Mine water from the 1025 Level is flowing at approximately 100 liters per second. The water is channeled in a spiral-lock 200 mm culvert that runs under the waste dump close to the ore dump. It exits out the culvert beyond the dump area and freely flows through the flats below the portal. It has created a small swampy area (500 m2) 150 m below the culvert. The sixty-pound rail is still in place and in good shape. There is approximately 1 kilometer of rail. There is good air right to the back of the 1025 Level due to both the 1100 Level and 1100 Raise being open. The waste dump created at the 1025 Portal is the largest man-made footprint on the property. It is visible from Highway No. 6. The dump is stable and is becoming naturally overgrown. The 1100 Level Portal is partially collapsed and will require rehabilitation to provide necessary ventilation and an emergency escapeway for the operation. The portal is on the immediate west side of Aylwin Creek and is serviced by a wooden bridge. This bridge and upstream reach of the creek will need to be improved to lessen the impact caused by avalanches and spring floods.
A new adit located on the east side of Aylwin Creek should be considered rather than relying on the present portal for safety and stability reasons. The new adit could be driven to connect with the present level, but developed close to the known mineralization in the upper portions of the deposit. This level was driven trackless. Only the portal was inspected in November 2002 so the underground conditions are unknown. The waste dump created at the 1100 Portal is on the east side of Aylwin Creek. It is the second largest man-made footprint on the property although it is not visible from any other location. The dump is stable and starting to become naturally overgrown.
DKM
November, 2002
November, 2002 DKM
1025 Level Portal
1100 Level Portal
A decline (1013 and 993) was driven from the 1025 Level. An internal diamond drill platform (1013 Level) was established with the decline. A raise was driven from the bottom of the 993 Decline to the 1025 Level. It was driven in ore and used as a bulk sample for metallurgical purposes. All these internal workings are flooded to the 1025 Level. There are four old adits at approximately the 1184-meter elevation that were dug in 1893 (Willa No. 1, Willa No. 2, Rockland and Little Daisy Adits). All but the Willa No. 2 Adit have collapsed. The respective dumps have been reclaimed naturally. There is one low-grade stockpile immediately west of the road access to the property and approximately 100 meters from its entrance at Red Mountain Road. This has been sampled on numerous occasions and has been a concern to local environmental groups and government agencies due to the perceived acid rock drainage (ARD) potential. There has been no ARD from this or any other dump on the property. The closest single-phase power runs along Red Mountain Road. Three-phase power would probably require a new 7.5 kilometer line from Silverton. Telephone lines also run along Red Mountain Road. There are no high-speed data lines in the Slocan Valley. Cellular phones do not have coverage in this area. Potable water is not available on the property.
History The property has been explored off and on since 1893. However, the majority of the work to develop the property has occurred only recently. In the mid-1960’s Cominco, Amax Exploration and Western Mining Company identified possible economic copper and molybdenum mineralization. During the early 1980's the Willa property was explored on surface by a joint venture between Rio Algom Exploration Inc. and BP Minerals Ltd. In April 1985 Northair Mines Limited joined the joint venture. They completed the majority of the present underground workings. Treminco Resources Ltd. optioned the property in 1990. Exploration work consisted of resampling and re-mapping portions of the 1100 and 1025 level drifts, and some environmental and prefeasibility studies and designs were completed. A brief summary of the history follows. 1893
- 3 adits driven by prospectors: Willa No.1 - 80 meters, Willa No.2 - 10 meters, Rockland - 70 meters.
1899
- crown granted claims known as the Rockland owned by Willow Gold Mining Co. produced 300 tons in 1899.
1900
- Rockland claim was then owned by W. Spinks, Graves and Watson. They completed 91 meters of drift in three adits (one on the north side and 2 on the south side of Aylwin Creek).
1901
- Granby Consolidated inspected the property and chip sampled Willa #1, #2 and Rockland adits.
1912
- Granby Consolidated inspected the property and again turned it down (low grade).
1930’s
- claims were transferred to W. J. Nicholls.
1936
- optioned to Slocan Lake Gold Mining Company Inc.. They completed another 32 meters of drifting and 3.6 meters of raising.
1955
- Egil Lorntzsen sampled the Rockland adit and found only trace gold.
1964
- the Rockland and adjoining claims (17 crown granted claims) were purchased by Northlode Exploration Ltd. from D.H. Hawkings with S.A. Millican’s recommendations.
1964 - 1965 - Cominco optioned the property and completed 4 diamond drill holes. Minor copper and gold mineralization was found.
1964 - 1967 - D.H. Hawkings property was optioned to Rockland Mining Ltd. They carried out a small surface diamond drilling program near the mineralized occurrences. 1967 - 1969 - Amax Exploration completed trenching and geochemical sampling of the surface. Gold-silver-copper and copper-molybdenum anomalies (1968) were discovered leading to a surface diamond drill program. Good mineralization was intersected. 1970
- Western Mining Company and Amax Mining Company completed a joint venture on the claims. An underground diamond drilling program for MoS2 was completed using some of the old workings as setups.
1971 - 1975 - Crown grants lapse. 1978 - 1979 - Pete Leontowicz and Bill Wingert acquired the property. 1979
- Rio Algom optioned the property and staked more claims. BP Minerals Ltd. staked the adjoining properties. Lithogeochemistry survey started.
1980 - 1984 - the Aylwin Joint Venture (Riocanex Inc. 50%, BP Canada 50%) explored the property with geochemical survey and drilling. 1981
- Hudson Bay Oil and Gas completed a geochemical survey on the LH Property.
1984
- BP Canada had acquired 72 % interest in the property.
1985
- Northair Mines Ltd. optioned the property for 50 % ownership (BP Canada 36%, Riocanex 14%).
1986 - 1987 - Northair drove the 1025 Level drift and the associated crosscuts. 1987
- Northair completed the declines and the intermediate 1013 Drift. - The 1025 Level drifts and crosscuts were extended. - The 1100 Level and the 1100 Raise were completed. - Rib, face and muck sampling program was completed. - Transport of Brandywine Mill to the Willa started. - Environmental baseline studies started.
1988
- Northair started the Environmental Assessment process, but met with considerable local opposition. Northair stopped all exploration and underground development.
1990
- Treminco Mining Ltd. optioned the property and studied the deposit but did no development work or diamond drilling.
Geophysics In 1982, surface magnetic and gamma-ray orientation surveys were run on a north-south line centered on the breccia pipe and also on an east-west line west of the breccia pipe. The results were of limited effectiveness and could not assist in mapping or structural interpretation. Drill core was run unsuccessfully for magnetic signatures. The gamma-ray spectrometer indicated that the volcanics were low in potassium while the Feldspar Porphyry was elevated. The Heterolithic Breccia was difficult to interpret.
Geochemistry The Willa property has been covered by geochemical surveys by both BP Minerals and Riocanex. A lithogeochemistry survey was done on the core from 1980 to 1984 to identify the dispersion haloes of the deposit(s) analyzing for Cu, F, Mn, Mo, Sn and W. Two anomalous areas were discovered. In 1979 and 1980 a soil geochemical survey was completed on a 100-meter grid over the Aylwin Basin. The survey analyzed for Cu, F, Mn, Mo, Sn and W and identified two large anomalies. The first anomaly delineated the Willa Deposit (Cu, Mo and W). The second anomaly straddled the ridge separating Congo and Aylwin Creeks (Mo and W). In 1983 and 1984 a more detailed soil sampling program delineated several other (Ag, As, Cu and Au) anomalies on the ridge separating Congo and Aylwin Creeks and close to the adjoining LH Property boundary (see following map). Meanwhile, Hudson Bay Oil and Gas (HBOG) completed a soil geochemical survey on the LH Property in 1981. The HBOG survey discovered additional anomalies (Au, As and Cu) on the LH Property side of the claims that correlate with the BP Minerals and Riocanex anomalies on the Willa side. Noranda Exploration Company Limited completed an exploration program on the LH Property in 1987. They reduced the original geochem grid spacing to 50 meters over the ridge (Ridge Grid, Mitchell, 1988). Soil geochemical results returned up to 1600 ppb Au in this grid. Mapping revealed intensely altered pyroclastics and volcanics. Mitchell stated: “pervasive silicification throughout a wide central zone forms the steep ridge running north-south through the center of the grid. This zone is of chief importance as it is the primary host to sulphides associated with the anomalous gold values occurring in rock and soil geochemistry on the grid. Smaller discrete silicified zones occur locally, particularly on the west half of the grid” (close to the LH – Willa border) (pg. 8).
ROAD
CO N G O
MOUNTAIN D RE
CR EE
LH Wil la
1025 Level
K
Approximate Location of The Noranda Ridge Grid Pro
Pr o
pe r ty
IN LW AY
pe r ty
Little
1100 Level
Daisy Cr ee k
N
WILLA DEPOSIT
CR
EE
K
AYLWIN LAKE
LEGEND
Orphan Boy Resources March, Inc. 2001 Geospectrum Engineering
Gold Geochem > 100 ppb Copper Geochem > 100 ppm
0
SCALE 200
400
Tungsten Geochem > 12 ppm
Meters
Arsenic Geochem > 150 ppm
Source : 1984 BP Mineral Geochem Survey 1981 HBOG Geochem Survey
Willa Property Slocan Mining Division British Columbia
Soil Geochemical Map Date : February, 2003
Drawn By : DKM
“The gradational increase in metamorphic alteration towards the west across the Ridge Grid infers that this side may be closer to a large subsurface intrusive complex which could be the source for mineralization on the LH Property. This
system may have been integral in the formation of the ore deposits on the adjacent Willa [Aylwin] Creek discovery”(pg. 25) Rock (chip) samples on the Ridge Grid returned assays ranging up to 15.40 g/mt Au over 1 meter. A single drill hole (DDH-LH-87-11) below the Ridge Grid (380 m) intersected a mineralized zone approximately 1 meter true width that assayed 15.02 g/mt Au.
Diamond Drilling There was over 50,000 meters of drilling completed between 1965 and 1988 from 556 drill holes. Below is a table of diamond drill programs completed on the Willa property. Date Company Type 1965 Cominco Surface 1968 Amax Expl. Surface 1970 Rockland Underground 1980 Aylwin JV Surface 1981 Aylwin JV Surface 1982 Aylwin JV Surface 1983 Aylwin JV Surface 1984 Aylwin JV Surface 1985 Aylwin JV Underground 1986 Northair Underground 1987 Northair Underground 1988 Northair Underground Total Note: Aylwin JV - Riocanex Inc. 50%, BP Canada 50%
No. of Holes 4 5 6 8 13 3 6 17 6 56 220 212 556
Meterage 296.5 656.7 1,195.6 2,626.1 3,129.7 1,297.8 1,748.5 5,496.6 1,274.1 6,868.9 11,375.8 14,925.1 50,861.4
The core was stored in several locations over the past 23 years both on the property and in Silverton. The majority of the core was never stored in a secure location. It has been exposed to the elements during this time. Large sections of core have been removed from exposed boxes. The core was never properly piled (i.e. crisscross) to stabilize the weight of the core. Therefore several of the core stacks have fallen over spilling their valuable contents out onto the ground. No methodical cataloging of the core has been found to identify the piles of core. Aluminum tags were not used to label the runs or the boxes. Many of the wooden run blocks are missing. The footage on the blocks and core box labels have been either bleached out and/or rotted off. There is virtually no way to identify which core belongs to which hole or where the core is located within a hole.
Therefore, the entire 50,000 meters of core has been lost. The pictures illustrate the condition of the remaining core as of the fall of 2002.
Although the core is lost, the author believes that the logging and assaying of this core is still valid data on which to complete a mineral resource calculation for the following reasons: • • • •
The author knew many of the geologists who logged the core at the Willa and considers them to be very competent. Their work was professionally done. The exploration companies and personnel who worked on this property were highly qualified and did excellent work Quality control and quality assurance of the core was carried out throughout the 1980’s by using check assays, blanks and different labs (see Historic Sampling section). Muck, face and channel samples were compared with the mineralized sections of the underground workings by several different companies including the author’s samples (see Data Validation section) and were found to be consistent.
Historic mineral resources The most recent historical mineral resource estimate was completed in 1988 (Petersen, 1988a, b). Initial undiluted and weighted geological ore reserves were calculated for the West Zone as follows: •
East-West sections blocks were measured by a planimeter and multiplied by their NorthSouth projection to obtain a volume.
• • • • • • • •
Block volumes were multiplied by the specific gravity (2.90) to obtain metric tones. The tonnage and grade were converted to short tons and ounce per ton. Block tonnage was summed and the average grade of gold and copper calculated by weight averaging. Silver grade was considered to low to add into the calculations. All blocks were measured East-West and North-South and were projected 6.26 meters (halfway to the adjoining section) or to dislocation faults. Reserve blocks had to be at least 10 meters high, 25 meters long and 4 meters thick. Neither internal waste nor external waste were included in the calculation. Two cutoff grades were used (3.429 and 2.571 g/mt Au) to calculate the undiluted, weighted geological ore reserve of the West Zone. At a cutoff of 3.429 g/mt Au, the West Zone has 455,794 mt grading 6.79 g/mt Au and 0.95 % Cu (undiluted, weighted geological ore reserve). At a cutoff of 2.571 g/mt Au, the West Zone has 558,989 mt grading 6.07 g/mt Au and 0.88 % Cu (undiluted, weighted geological ore reserve).
A diluted, weighted mining reserve for the West Zone was completed using stoping and mining layouts, designed by Cominco Engineering Services Ltd. The mining ore reserves for the West Zone were calculated as follows: • • •
• •
The tonnage of each block (ore or low-grade) was calculated as in the geological reserve calculations. The weighted grade and tonnage of internal waste blocks in each stope were calculated and included with the ore and low-grade blocks. External dilution for each section was calculated by measuring the perimeter of each stope to obtain the area. The area was then multiplied by the length of the adjacent section projection (12.5 meters) to obtain a volume. An external dilution factor was then applied to the volume. If the stope was less than 6.0 meters in width the external dilution was 0.3 meters while greater than or equal to 6.0 meters width the external dilution was 0.5 meters. The average grade of the internal waste for the West Zone was assigned to the average grade of the external dilution. The resultant tonnage and grade was then added to the overall calculation. The diluted mineable ore reserve calculation then included tonnage and grade for ore blocks, low-grade blocks, internal waste blocks and calculated external waste blocks. At a cutoff of 3.429 g/mt Au, the West Zone diluted, mining ore reserve has 414,334 mt grading 5.93 g/mt Au and 0.91 % Cu. External dilution was calculated to be 9.9 % or 41,219 mt grading 1.44 g/mt Au and 0.49 % Cu.
The East Zone was calculated as an undiluted, weighted geological reserve only. The calculations were identical to the West Zone undiluted, weighted geological reserve estimate with the following results: • •
At a cutoff of 3.429 g/mt Au, the East Zone has 40,017 mt grading 6.34 g/mt Au and 0.74 % Cu (undiluted, weighted geological ore reserve). At a cutoff of 2.571 g/mt Au, the East Zone has 47,670 mt grading 5.55 g/mt Au and 0.65 % Cu (undiluted, weighted geological ore reserve).
The Main Zone was also calculated as an undiluted, weighted geological reserve. Lack of drill information and drilling lowered the geological confidence in this zone. A probable and a possible category were used to estimate tonnage and grade. The probable category was calculated by blocking out the following: • • •
The tonnage was obtained from East-West sections 5525568 mN to 5525643 mN [20 meters true height x 10 meters true width x 75 meters dip length x 2.90 specific gravity x 1.1 (probability factor)]. The average grade was obtained by averaging all the gold and copper assay intersections in the above block. At a cutoff of 3.429 g/mt the probable ore in the Main Zone has 40,823 mt grading 5.14 g/mt Au and 0.74 % Cu (undiluted, weighted geological probable ore reserve).
The area between 5525605.5 mN and 5525568 mN was considered possible ore but was not backed up by drill information. This area was calculated as follows: • • •
Tonnage was obtained by 20 meters true height x 10 meters true width x 25 meters dip length x 2.90 specific gravity x 1.03 (possibility factor). The average grade was obtained by using the gold and copper assay grades of the probable block mentioned above. At a cutoff of 3.429 g/mt the possible ore in the Main Zone has 13,608 mt grading 5.14 g/mt Au and 0.74 % Cu (undiluted, weighted geological possible ore reserve).
The following table summarizes the different ore reserve categories at a cutoff of 3.429 g/mt Au. Zone
Reserve Type
West
Mining
Category Proven
Diluted
Tonnes (mt)
Au (g/mt)
Cu (%)
414,334
5.93
0.91
West Geological Proven Undiluted 455,794 East Geological Proven Undiluted 40,017 Main Geological Probable Undiluted 40,823 Main Geological Possible Undiluted 13,608 Total 550,242 Note: Source - (Petersen, 1988a, b) Numbers converted to metric from the report This mineral resource may not comply with National Instrument 43-101.
6.79 6.34 5.14 5.14 6.59
0.95 0.74 0.57 0.57 0.90
Historical Sampling, preparation, analysis, security Throughout the 1980’s numerous types of assays were analyzed and checked. The BP Minerals Riocanex Joint Venture and later Northair Mines used at least 2 professional labs for check assays (i.e. Chemex Labs, Vangeochem Labs, Riocanex Labs, Acme Analytical Labs, Midland Earth Science Associates) during each exploration program. Different analytical methods (i.e. Fine Assay/Gravimetric, Atomic Absoption, Fire Assay, ICP) were used to analyze the same sample. Blank samples and replicate samples were used in each program.
In 1986, Mr. L. Werner, P.Eng. noted that “reproducibility of assays from individual samples was very poor although the averages of assays from large numbers of samples agreed well when assayed by different labs.” An analysis program showed that “extensive mixing both from crushing and following pulverizing” was essential to achieve assay precision. This procedure was immediately followed and “since this modification to procedure all duplicate assays have agreed within acceptable limits”. “As a coarse-particle (nugget) effect sample inhomogeneity could not have been removed by mechanical mixing, it is now believed that a nugget effect does not exist in a form that will bias results”. (Werner, 1986)
Geology Regional Geology The Willa deposit is situated in the southern portion of the Selkirk Mountains within the Omineca Crystalline Belt. The deposit is within a roof pendant composed of basic volcanic and volcaniclastic rocks, which was intruded by felsic dykes. The volcanics have been correlated to the Lower Jurassic Rossland Group rocks. The pendant is enclosed and intruded by the Middle Jurassic Nelson Batholith which is predominately composed of coarse-grained granodiorite to quartz monzonite rocks. Immediately to the north of the pendant is the Upper Triassic Slocan group metasedimentary sequence of rocks that contain numerous silver-lead-zinc deposits. Structurally adjacent to the west of the volcanics is the Precambrian Valhalla Gneissic Complex, which is a highly metamorphosed terrain of remobilized granites and granitic gneisses. The Slocan Lake Fault is the major structure in the area. This north-trending fault has a dip of 35° to 40° to the east and is of Eocene age. Generally, the roof pendant rocks have been weakly metamorphosed to lower greenschist facies.
Property Geology The property geology has been described in great detail by Heather (1985) and Wong et. al.1995). The lithologic units are illustrated in the table below with corresponding rock codes. The present digital geological database has maintained the lithology and the code numbers with the exception of White Feldspar Porphyry (5) and the Hornblende Feldspar Porphyry (3). These units have been reclassified as Feldspar Porphyry (4) due to their similarity to Feldspar Porphyry. The digital database also includes a rock code for faults/shears and gouge (9) and overburden (10).
Willa Original Rock Code Age Middle Jurassic Lower Jurassic
Description Lamprophyre Dykes Nelson Granite Heterogeneous Breccia Feldspar Porphyry Quartz Latite Porphyry Rossland Group Volcanics
White Feldspar Porphyry Feldspar Porphyry Hornblende Feldspar Porphyry Pyroclastics Augite Porphyry Volcanic Siltstone Biotite Schists
Code 8 7 6 5 4 3 2 1
Source: Heather, 1985
The Rossland Group Volcanics are the oldest rocks on the property and make up approximately 75% of the roof pendant. The rocks in this group range from volcanic siltstone and tuff to coarse breccias and flows. The metavolcanic roof pendant is cut by two felsic porphyritic intrusions. The first intrusion is a Quartz Latite Porphyry ring-dyke and two radial dykes that have a central core of Feldspar Porphyry and a crosscutting breccia pipe. The second intrusive consists of two subparallel igneous bodies consisting of White Feldspar Porphyry and Hornblende Feldspar Porphyry. A Heterolithic Breccia intrudes the previous intrusions and volcanics. Lamporphyre Dykes and faults crosscut and sometimes displace the previous lithologies.
Rossland Group Volcanics Fragmental pyroclastic rocks make up roughly 70 % of the Rossland Group Volcanics. They range from volcanic agglomerates and conglomerates to fine-grained crystal and lithic tuffs (Heather, 1985). Augite Porphyry sills or flows are present around the known Willa mineralization. The unit ranges from dark green to black-green and yellow-green and is usually altered (iron-stained or bleached). The augite and plagioclase phenocrysts are euhedral to subhedral and range in size from 0.5 to 4.0 mm. The matrix is composed of augite, feldspars and biotite. Volcanic Siltstone (Hornfels) is usually interbedded with the Augite Porphyry and makeup only a small portion of the Rossland Group Volcanics. The siltstone varies from green (actinolitequartz-plagioclase-orthoclase) to grey to pink (biotite- plagioclase-orthoclase). The Biotite Schist is predominantly to the south and southeast of the Heterolithic Breccia. This black biotite schist has been found in core and in outcrops and is believed to be related to the Augite Porphyry unit.
Quartz Latite Porphyry The Quartz Latite Porphyry unit forms a ring and radial dyke complex within the Rossland Volcanics. Its composition ranges from quartz monzonite to granodiorite with large phenocrysts
of plagioclase. The ring dyke structure is elliptical in shape trending 050° Az with a 5-kilometer by 1-kilometer size. The radial dyke radiates both inward and outward from the ring structure. There is up to 7 % pyrite in the Quartz Latite Porphyry and when it is exposed on surface, the blocky fractured outcrop has a limonitic stain.
Feldspar Porphyry The Feldspar Porphyry intrusive stock is centered within the Quartz Latite Porphyry. It has an elliptical shape that trends 000° Az. This unit has phenocysts of plagioclase and quartz with minor pyrite, apatite, titanite and magnetite. Outcrops are oxidized with skins of limonite and manganese oxide. The White Feldspar Porphyry intrusive has been identified in 2 elongated bodies 1 kilometer north of the Quartz Latite Porphyry ring dyke. This highly altered units have large plagioclase and small quartz phenocrysts with minor pyrite and hornblende. The Hornblende Feldspar Porphyry forms small intrusive bodies and dykes within the Quartz Latite Porphyry and the Feldspar Porphyry. The large plagioclase and small hornblende phenocrysts are within a groundmass of orthoclase and quartz.
Heterolithic Breccia The Heterolithic Breccia lies within the core of the Quartz Latite Porphyry ring dyke and is roughly cylindrical in shape. The cross-section of this pipe is 350 meters (north-south) by 200 meters. The outer portions of the breccia pipe form a crackle breccia texture. All the above lithologies other than the White Feldspar Porphyry have been identified as angular to rounded fragments of the pipe. The fragments normally show propylitic or potassic alteration. The matrix of the pipe is altered iron-rich rock flour composed of plagioclase, quartz and orthoclase with minor actinolite and biotite.
Nelson Granite The Nelson Granite is composed of a variety of granitic rocks ranging from porphyritic granite, quartz monzonite, syenite to granodiorite. The batholith encircles the volcanic roof pendant and does not outcrop near the Willa Deposit. Granitic pegmatite dykes have been intersected in some of the deep diamond drill holes but the main Nelson Batholith has not been intersected.
Lamprophyre Dykes Mafic dykes have been intersected by many drill holes within the intrusive complex and are usually less than one meter thick. They normally trend north-south and are steeply dipping. These dark green to black dykes are composed of plagioclase and/or pyroxene and biotite. There are varying amounts of orthoclase, quartz, amphibole, chlorite and olivine with minor apatite, titanite, zircon and magnetite.
Little
Da i s y
in
Le 1025
w Ayl
Cr ee k
vel Cree k
Willa Deposit
d Wil
C r ee
LEGEND Lower Jurassic
0
Heterolithic Breccia
SCALE 200
k
400
Meters
Feldspar Porphyry
Orphan Boy Resources March, Inc. 2001 Geospectrum Engineering
White Feldspar Porphyry
Willa Property
Quartz Latite Porphyry
Slocan Mining Division British Columbia
Rossland Volcanic Group
Local Geology Map Source : Wong and Spence, 1995
Date : March, 2003
Drawn By : DKM
Structure There are several types of faults which have been thought to localize the gold-copper-silver mineralization (Petersen, 1988). ‘Paleo-faults’ are north striking, vertically dipping faults that have been active throughout the mineral emplacement. They are thought to control the Lamprophyre Dykes. ‘Flat faults’ strike easterly and dip 15° to the north and may have reacted with the ‘Paleo-faults’ to create vertical conduits for the mineral emplacement. ‘Dislocation faults’ strike northeast and dip 45° SE to vertical. They offset the ‘Paleo-faults’. The ‘Willa Fault’, which has a strike of 040° Az and dips vertically, has no apparent offset. Contact faults follow the contact of the Heterolithic Breccia and probably serve as conduits for gold-coppersilver mineralization, but are narrow.
Deposit Type Mineralization There are two types of mineralization at the Willa Deposit. The first is a calc-alkali quartzmolybdenite stockwork and the second is the gold-copper-silver emplacement. The quartz-molybdenite stockwork is weak but extensive in the Quartz Latite Porphyry and Volcanics north and west of the Heterolithic Breccia. Molybdenite occurs within the quartz and along the quartz vein boundaries. Due to the low grade of the molybdenium and the relatively small tonnage, this deposit is uneconomic to mine. The gold-copper-silver mineralization is concentrated in three large zones (Main, West and East). The mineralization occurs in zones of weakness in fault zones and fault junctions. The mineralization is predominately chalcopyrite with varying amounts of pyrite and pyrrhotite. Propylitic alteration occurred during mineralization, as did zones of intense silicification and minor pyritization. There are three known mineralized zones that make up the Willa Deposit (West, Main and East Zones).
West Zone The West Zone is the most defined portion of the Willa Deposit. It has also been exposed on the 1025 Level (1000 X-Cut, 950 South Drift, 950 North Drift, 950 X-Cut and the 1025 Raise). The majority of the known mineralization is centered around 1025 meters and is the reason for the main 1025 Level Adit location. It has a crude north-south strike and a vertical dip and is approximately 200 meters in depth. The Zone is predominantly within the Heterolithic Breccia. It has been documented that the ore is cut off to the north by the Willa Fault and has been displaced to the south by cross-cutting faults. Drill hole data seem to indicate that mineralization continues beyond these faults and into other lithologies. This is the only zone that has had a historic ore reserve estimate.
Main Zone The Main Zone lies overtop and to the north of the other zones. It appears to have been offset at several locations along its crude north-south strike. This zone is exposed on surface by Aylwin Creek. The Willa No. 1 and Willa No. 2 Adits were collared in the Main Zone on either side of the creek. The exposed portion of the Main Zone is stained with limonite and chlorite. The Zone is partially composed of Heterolithic Breccia as well as Feldspar Porphyry, Quartz Latite Porphyry and Rossland Volcanics. The offsets of the Main Zone can be subdivided into Main Zone and Upper Main Zone.
East Zone The East Zone is presently the smallest of the three zones. This may be due only to the lack of drilling in this area. The majority of the zone is underneath the 1013 Decline, 1013 Level and 993 Decline. This zone is situated partially in Heterolithic Breccia and partially in Rossland Volcanics. Further exploration is required to better define this zone. Petersen recognized several small and isolated zones while compiling his mineral resource estimation (Petersen, 1988). Further exploration is required to better define these areas.
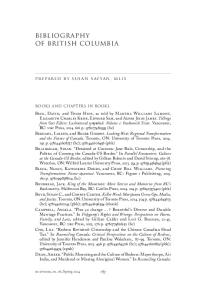
Mineral Resource Estimate Data verification On November 26, 2002, a team [Mr. Toshiaki Suyama (Dowa Mining geologist), Mr. Ernst Binder (Procon Mining superintendent), Mr. Steve Phillips (geological consultant) and Mr. David Makepeace (geological engineer and report author) toured the underground 1025 Level. One of the objectives of the visit was to take underground rib samples at approximately the same locations as the April 1993 Treminco rib samples for comparison purposes. Treminco wanted to check Northair’s assay face samples at the junction of the 1000 X-Cut / 950 East Drift and the 950 X-Cut / 950 East Drift South. Eight two-meter samples were collected at the various locations identified on the figure below. It should be noted that all November 2002 samples were chip samples. There was no indication that continuous channel samples had been taken by Treminco at any of these locations so it must be assumed that the Treminco sample assays are from chip samples as well. Chip samples normally do not represent as accurate an assay of total mineralization as does a continuous channel sample at the same sample location. Therefore, there may be more variations in assay values from chip sample programs at the same location. To improve a representative assay being taken at each location, chips were taken within an area of 2 meters by 1.5 meters (see sample location pictures). The samples were all Heterolithic Breccia. The rock was very hard to chip off the ribs in all locations signifying the high silica content of the rock. The sample locations had several fractures but rock was still difficult to extract for sampling. The breccia is medium-grey with limonitic-staining in places. Breccia fragments included Quartz Latite Porphyry and Feldspar
Porphyry. The matrix was a grey very fine-grained groundmass. The breccia was very silicified. Visible mineralization included chalcopyrite (0 % to 8 % of the sample) and pyrite (0 % to 4 % of the sample). There was a minor amount of calcite and quartz veins in some of the samples. Limonite formed a thin skin on exposed rib surfaces. Samples averaged 5 to 8 kilograms. The samples were tagged, recorded and transported by the author to Vancouver. Acme Analytical Labs of Vancouver analyzed the 8 samples. Sample locations are shown below in the photograph mosaic and accompanying map. 2 meters
Sample 179403
(4.58 g/t Au, 0.58 % Cu)
Sample 179402
Sample 179401
(8.67 g/t Au, 0.93 % Cu)
(11.29 g/t Au, 1.49 % Cu)
Willa 1025 Level, 1000 X-Cut, North Rib, 6 - 12 m mark 2 meters
Sample 179406
(30.91 g/t Au, 2.44 % Cu)
Sample 179404
(15.84 g/t Au, 2.06 % Cu)
Sample 179405
(2.56 g/t Au, 0.57 % Cu)
Willa 1025 Level, 1000 X-Cut, South Rib, 12 - 8 m mark 2 meters
Sample 179408
(1.83 g/t Au, 0.32 % Cu)
Sample 179407
(4.33 g/t Au, 0.46 % Cu)
Willa 1025 Level, 950 East Drift South, East Rib, 84 - 88 m mark
179402
179401
950 East Drift North
179403
Willa 1025 Level
1 2 10,000 mN
1000 X-Cut
179405 179404 179406
3 4
CHIP SAMPLE COMPARISON Northair
Treminco
Average Face Sample
Sample No.
Au g/t
Cu %
7.06 26.13 8.67 11.76 8.91 20.85 5.28 4.05 4.05 19.75
0.86 1.82 1.51 1.51 0.78 3.21 1.04 0.78 0.78 2.15
1 2 3 4 5 6
Orphan Boy
Wall Sample
Sample No.
Au g/t
Cu %
7.78 20.43 9.74 9.33 3.05 12.45
1.51 2.39 0.94 1.03 0.41 1.31
Wall Sample Au g/t
Cu %
179401 11.29 1.49 179404 15.84 2.06 179408 179407 179402 179403 179405 179406
1.83 4.33 8.67 4.58 2.56 30.91
0.32 0.46 0.93 0.58 0.57 2.44
9,975 mN
95 0
Ea st D
rif t
So ut
h
9,950 mE
179407
Orphan Boy Resources March, Inc. 2001 Geospectrum Engineering Willa Property
9,950 mN
U/G Sample Location Map Date : January, 2003
Drawn By : DKM
Scale 1:250
Assay laboratory results are in Appendix.
950 X-Cut
9,975 mE
Slocan Mining Division British Columbia
179408
5 6
Digital Data Compilation Drill Hole Data There were 541 drill holes documented to have been undertaken between 1980 and 1988. The majority of the drill holes were diamond drilled and the majority of these were drilled from underground. There were a number of holes in the sequence that were abandoned and never logged. There were also 15 additional drill holes completed in the mid-1960’s. Some of this drill data was not available to the companies working the property in the 1980’s. Summary Drill Logs have been completed for all known drill holes on the property (see Summary Drill Log Appendix). This data was entered into Surpac International Inc.’s Vision mining software package. This software is a three dimensional graphical database used in the exploration and mining industry. The hardcopy data was entered into Surpac by CSV-format files. An attempt to convert the hardcopy drill logs into a digital drill database was undertaken by 4th year mining engineering students from University of British Columbia in 1996. All UBC digital data was checked with the original logs and integrated into the final ‘csv’ files. The files include: 1. 2. 3. 4.
Collar - collar location, bearing dip and type of hole Survey - down-the-hole survey data Assay - all sample intervals and subsequent assay results Geology - all major lithologic units.
The Geology file was the most difficult to complete due to the large number of geologists who have logged and interpreted the Willa core. The hardcopy logs show a large variation in the detail description of the various lithologies intersected by the core. It was decided that a simplified rock code similar to the legend used in most of the geological plan and section maps would provide the necessary data needed in the computer model. The rock code which was adopted is as follows: New Rock Code Description Pegmatite Dyke Shear/Fault/Gouge Lamprophyre Dykes Nelson Granite Heterogeneous Breccia Feldspar Porphyry Quartz Latite Porphyry Rossland Group Volcanics Overburden
P Sfg L NG HBx Fp Qlp V O
Code 10 9 8 7 6 4 2 1 0
White Feldspar Porphyry (3) and Hornblende Feldspar Porphyry (5) were not used because they are thought to be a subset of the Feldspar Porphyry (4). Shear/Fault/Gouge (9) were added to account for large faults that were intersected in the underground workings. Pegmatite Dykes (10) were added to account for their intersection in deep drill holes. Data from the Collar, Survey, Geology and Assay files was entered into Surpac. The underground workings were input separately as a series of string files. A generic underground heading provided the 3D wireframe of the workings. A solid of the workings was then generated. The topography was inserted. Due to the fact that the topography is in UTM NAD 83 coordinates, it required conversion of the mine grid data to UTM NAD 83. Sections were digitally constructed through the drill holes from south to north. Mineralization from the drill holes in each section was digitized. The resulting digitized assay sections were wireframed and then turned into a solid (assay model). At this point, areas around the deposit that either had not been drilled or were under-drilled could be identified and an exploration drill program could be developed to fill in those areas.
Muck/Chip Sample Data Muck and/or face chip samples were taken during drift, raise and cross-cut advance. Some of the data was available, although the accuracy of this data is suspect for the following reasons: 1. There is an incomplete sample record available. 2. If the face samples were not statistically taken (channel versus chip) then the assay would not be representative of that face. 3. Muck samples tend not to be an accurate representative assay of a mine heading although it may represent an average grade of the development round. 4. There is no underground survey data available and so the actual face may not be properly identified. 5. Too many assays in a confined space may inflate or reduce the block model mineral resource estimate in those areas. Therefore, no muck or chip samples were added to the digital database.
Topography Digital TRIM data was acquired from the Online System of the British Columbia government. The data was converted and cleaned up from Microstation ‘dgn’ format into AutoCAD ‘dwg’ format. The data was transferred to Surpac via a ‘dxf’ format. A digital terrain model (DTM) was generated. This was the main constraint within the geology and block models. Due to the fact that the topography is in UTM NAD 83 coordinates, it was necessary to convert all other data (drill holes, geological plans, geochemical plans, underground workings, etc.) from the original mine grid coordinates to UTM NAD 83. The mine grid coordinates were originally
based on 10,000 mE and 10,000 mN. A soft conversion was made based on all map data as well as GPS data. The translation is as follows: Mine Grid 10,000 mN 10,000 mE
UTM (NAD 83, Zone 11N) 5525518.55 473716.50
There was no rotation translation necessary.
Underground Workings The underground workings were input as a series of centerline string files. A generic underground heading profile was used to create 3D wireframes of the workings. A DTM of the workings was then generated. After validation of the DTM a 3D void was created for each of the workings.
Geological Assay 3D Model East-West sections were digitally constructed through the drill holes from north to south to correspond to the original cross-sections. The table below compares the section numbers. Section No. 1 2 3 4 5 6 7 8 9 10 11 12 13 14 15 16 17 18 19 20 21 22 23 24 25 26 27
Mine Grid Section 10212.5 10200.0 10187.5 10175.0 10162.5 10150.0 10137.5 10125.0 10112.5 10100.0 10087.5 10075.0 10062.5 10050.0 10037.5 10025.0 10012.5 10000.0 9987.5 9975.0 9962.5 9950.0 9937.5 9925.0 9912.5 9900.0 9887.5
UTM Section 5525730.5 5525718.0 5525705.5 5525693.0 5525680.5 5525668.0 5525655.5 5525643.0 5525630.5 5525618.0 5525605.5 5525593.0 5525580.5 5525568.0 5525555.5 5525543.0 5525530.5 5525518.0 5525505.5 5525493.0 5525480.5 5525468.0 5525455.5 5525443.0 5525430.5 5525418.0 5525405.5
Section No. Mine Grid Section 28 9875.0 29 9862.5 30 9850.0 31 9837.5 32 9825.0 33 9812.5 34 9800.0 35 9787.5 36 9775.0 37 9762.5 38 9750.0 Note: Original hand drawn sections New sections with grade intersections
UTM Section 5525393.0 5525380.5 5525368.0 5525355.5 5525343.0 5525330.5 5525318.0 5525305.5 5525293.0 5525280.5 5525268.0
Mineralized drill intersections within each 12.5-meter cross-section were digitized. The resulting digitized assay strings were wireframed and then turned into a three dimensional solid (assay model). This model did not include geological constrains. At this point, areas near the known mineralization that have not been drilled or are under-drilled can be identified (see Underground Exploration section).
Block Model Assumptions Units • • • •
Metric (grams per metric tonne [g/mt], meters [m] Significant decimal places: 2 - gold, copper and silver, 0 - tonnage Y = Northing, X = Easting, Z = Elevation The West, Main and East Zones were not broken out separately
Cutoff Parameters • • •
Maximum gold grade (raw): 346.77 g/mt [DH87-125, 20.0m to 21.0m] High-grade cutoff: 34.286 g/mt Gold cutoff: 3.5 g/mt, 2.5 g/mt and 1.5 g/mt
Raw Data Collar: Survey: Assay: Geology:
Surpaccollar.txt Surpacsurvey.txt Surpacassay.txt Surpacgeology.txt
Database Extent Minimum Northing Maximum Northing Minimum Easting Maximum Easting Minimum Elevation Maximum Elevation Minimum Depth Maximum Depth
Hole Id DH81-17 DH70-1 DH82-23 DH88-538 DH87-316 DH81-17 DH87-170 DH80-1
Northing 5525269.48 5525904.00 5525718.87 5525573.00 5525443.07 5525269.48 5525492.86 5525518.00
Easting 473879.28 473760.00 473492.14 473888.60 473725.51 473879.28 473748.93 473716.00
Elevation 1393.23 1220.00 1170.30 1029.10 993.81 1393.23 1026.25 1242.90
Depth 313.90 1220.00 524.40 252.60 29.01 313.90 0.00 812.50
Composite Length: 2 meters Gold file: composite_au_cut1.str Copper file: composite_cu_cut1.str Silver file: composite_ag_cut1.str
Variables Gold:
Number of samples:
15,332
Composite Stats Minimum value Maximum value Mean Variance Standard deviation Coefficient of variation Skewness Kurtosis Median Copper: Number of samples:
Gold – Cut (x) 0.00 34.28 1.23 6.77 2.60 2.11 5.67 49.89 0.34
Gold – Cut ln(x+1) 0.00 3.56 0.54 0.38 0.62 1.15 1.53 5.33 0.29
Copper (x) 0.00 27.92 0.27 0.20 0.45 1.64 17.74 957.08 0.13
Copper ln(x+1) 0.00 3.36 0.21 0.05 0.23 1.11 2.19 10.51 0.12
15,468
Composite Stats Minimum value Maximum value Mean Variance Standard deviation Coefficient of variation Skewness Kurtosis Median
Silver:
Number of samples:
13,977
Composite Stats Minimum value Maximum value Mean Variance Standard deviation Coefficient of variation Skewness Kurtosis Median
Silver (x) 0.00 1,876.47 3.65 356.58 18.88 5.17 79.07 7,368.37 1.37
Silver ln(x+1) 0.00 7.54 1.06 0.70 0.83 0.78 0.91 3.78 0.86
Model Block size: Block model origin: Block model extent: Block rotation: Block resolution: Total number of blocks:
Y = 2.0 m, X = 2.0 m, Z = 2.0 m Y = 5525250 mN, X = 473500 mE, Z = 800 mEl Y = 1024 m, X = 1024 m, Z = 1024 m Bearing = 0.0°, Dip = 0.0°, Plunge = 0.0° 512 2,972,602
Block Model Interpolation Search method: Inverse distance to the third power [ID3] Search type: Octant Minimum number of samples to select: 1 Maximum number of samples to select: 8 Maximum vertical search distance: 99 Maximum number of adjacent octants with no samples: 7 Search ellipsoid major axis: 6; 12; 24 Search ellipsoid Orientation: Bearing of major axis: 90° Plunge of major axis: 90° Dip of semi-major axis: 0° Anisotropy Ratio: Major/semi-major: 0.66 Major/minor: 3.00 Number of descretisation points: X = –1, Y = –1, Z = –1 Constrain interpolation: not above willatopo2.dtm Resource Dimensions:
Measured: 6 meters True North-South (000° Az) 4 meters True Vertical 2 meters True East-West (090° Az) Indicated: 12 meters True North-South (000° Az) 8 meters True Vertical
Inferred:
4 meters True East-West (090° Az) 24 meters True North-South (000° Az) 16 meters True Vertical 8 meters True East-West (090° Az)
Block Model Report Constraints:
- Z [vertical] = 800 to1350 mEl at 10 meter intervals - Report all blocks equal to or greater than the cutoff grade (3.5, 2.5, 1.5) Specific gravity (in-situ): 2.90 mt/m3 Block volume: 8 m3 Block weight: 23.20 mt
Classification A new classification of mineral resources has been enacted in Canada since the 1988 Mineral Resources were estimated. National Instrument 43-101 and its companion policy 43-101CP and technical report requirements 43-101F1 were put inplace as of February 1, 2001. The mineral resource definitions are based on the Canadian Institute of Mining, Metallurgy and Petroleum’s (CIM) definitions which were adopted on August 20, 2000. Under these definitions: A Mineral Resource is a concentration or occurrence of natural, solid, inorganic or fossilized organic material in or on the Earth's crust in such form and quantity and of such a grade or quality that it has reasonable prospects for economic extraction. The location, quantity, grade, geological characteristics and continuity of a Mineral Resource are known, estimated or interpreted from specific geological evidence and knowledge. The term Mineral Resource covers mineralization and natural material of intrinsic economic interest which has been identified and estimated through exploration and sampling and within which Mineral Reserves may subsequently be defined by the consideration and application of technical, economic, legal, environmental, socioeconomic and governmental factors. The phrase 'reasonable prospects for economic extraction' implies a judgement by the Qualified Person in respect of the technical and economic factors likely to influence the prospect of economic extraction. A Mineral Resource is an inventory of mineralization that under realistically assumed and justifiable technical and economic conditions, might become economically extractable. These assumptions must be presented explicitly in both public and technical reports. (43-101CP, CIM, 2001) There are three subdivision within the mineral resource category which are based on decreasing geological confidence (Measured, Indicated and Inferred).
Measured Mineral Resource A 'Measured Mineral Resource' is that part of a Mineral Resource for which quantity, grade or quality, densities, shape, physical characteristics are so well established that they can be estimated with confidence sufficient to allow the appropriate application of technical and economic parameters, to support production planning and evaluation of the economic viability of the deposit. The estimate is based on detailed and reliable exploration, sampling and testing information gathered through appropriate techniques from locations such as outcrops, trenches, pits, workings and drill holes that are spaced closely enough to confirm both geological and grade continuity (43-101CP, CIM, 2001). The Measured Mineral Resources at the Willa Deposit have been estimated at three cutoff grades for gold (3.5, 2.5 and 1.5 g/mt Au). The results are shown in the following table: Measured Mineral Resource Cutoff (g/mt Au) 3.5 2.5 1.5
Volume (m3) 168,272 273,360 470,648
Tonnes (mt) 487,989 792,744 1,364,879
Gold (g/mt Au) 6.77 5.30 3.89
Copper (%) 0.97 0.83 0.68
Silver (g/mt Ag) 11.59 9.95 8.80
Indicated Mineral Resource An 'Indicated Mineral Resource' is that part of a Mineral Resource for which quantity, grade or quality, densities, shape and physical characteristics, can be estimated with a level of confidence sufficient to allow the appropriate application of technical and economic parameters, to support mine planning and evaluation of the economic viability of the deposit. The estimate is based on detailed and reliable exploration and testing information gathered through appropriate techniques from locations such as outcrops, trenches, pits, workings and drill holes that are spaced closely enough for geological and grade continuity to be reasonably assumed (43101CP, CIM, 2001). The Indicated Mineral Resources at the Willa Deposit have also been estimated at three cutoff grades for gold (3.5, 2.5 and 1.5 g/mt Au). The results are shown in the following table: Indicated Mineral Resource Cutoff (g/mt Au) 3.5 2.5 1.5
Volume (m3) 100,848 203,712 454,056
Tonnes (mt) 292,457 590,765 1,316,763
Gold (g/mt Au) 5.31 4.11 2.91
Copper (%) 0.65 0.62 0.51
Silver (g/mt Ag) 11.94 9.79 7.05
Inferred Mineral Resource An 'Inferred Mineral Resource' is that part of a Mineral Resource for which quantity and grade or quality can be estimated on the basis of geological evidence and limited sampling and reasonably assumed, but not verified, geological and grade continuity. The estimate is based on limited information and sampling gathered through appropriate techniques from locations such as outcrops, trenches, pits, workings and drill holes. Due to the uncertainty which may attach to Inferred Mineral Resources, it cannot be assumed that all or any part of an Inferred Mineral Resource will be upgraded to an Indicated or Measured Mineral Resource as a result of continued exploration. Confidence in the estimate is insufficient to allow the meaningful application of technical and economic parameters or to enable an evaluation of economic viability worthy of public disclosure. Inferred Mineral Resources must be excluded from estimates forming the basis of feasibility or other economic studies (43-101CP, CIM, 2001). The Inferred Mineral Resources at the Willa Deposit have also been estimated at three cutoff grades for gold (3.5, 2.5 and 1.5 g/mt Au). The results are shown in the following table: Inferred Mineral Resource Cutoff (g/mt Au) 3.5 2.5 1.5
Volume (m3) 74,544 154,192 450,984
Tonnes (mt) 216,177 447,157 1,307,852
Gold (g/mt Au) 6.55 4.71 2.86
Copper (%) 0.57 0.49 0.39
Silver (g/mt Ag) 7.32 7.14 5.56
Discussion A comparison of the current Mineral Resources at the Willa with Northair Mines Ltd. 1988 estimate is shown below using similar gold cutoffs (3.5 g/mt Au for the 2003 estimate and 3.4286 g/mt Au [0.10 ounces per short ton] for the 1988 estimate). The two estimates are very similar in the Measured Resource category in both tonnage and grade. This indicates that although the estimation methods are very different they can be compared favourably to one another using the same data.
Orphan Boy Resources Inc. – Cutoff 3.5 g/mt Au Category Measured Indicated Inferred Total
Tonnes (mt) 487,989 292,457 216,177 996,623
Gold Copper Silver (g/mt Au) (%) (g/mt Ag) 6.77 0.97 11.59 5.31 0.65 11.94 6.55 0.57 7.32 6.30 0.79 10.77 (Makepeace, D.K., 2003)
Northair Mines Ltd. – Cutoff 3.4286 g/mt Au Zone
Category
West East Main Main
Measured Measured Indicated Inferred Total
Tonnes (mt) 455,794 40,017 40,823 13,608 550,242
Gold (g/mt Au) 6.79 6.34 5.14 5.14 6.59
Copper Silver (%) (g/mt Ag) 0.95 0.74 0.57 0.57 0.90 (Petersen, D.B., 1988)
The low tonnage in the other categories can be explained as follows: •
•
•
The 1988 Indicated and Inferred Resources are from the Main Zone only. o Petersen only used 5 sections (5525568 mN to 5525643 mN [10,050 N – 10,125 N]) to establish the Indicated Resources. His report stated that “the area between sections 5525568 mN and 5525605.5 mN [10,050 N – 10,087.5 N] has not been drilled” (Peterson, 1988, pg. 10). The lack of drilling in this area is not explained in the report. It may be partially due to the absence of early drill hole data which has recently been retrieved by Orphan Boy Resources Inc. o This area became the Inferred Resources. Petersen also commented, “the [Main] Zone has been traced by drilling from the 1,180 m elevation, just below surface, to 1,050 m elevation”. An examination of the block model cross-sections, longsections and plans indicate far more tonnage and grade than previously identified in the Main Zone area, as noted in the 2003 estimate. The 1988 East Zone estimate was calculated from five 10-meter spaced sections oriented on a bearing of 210° Az. The volume and tonnage would therefore be small. The East Zone, in the present block model, has twelve continuous 12.5-meter spaced East-West (090° Az) sections. The volume would naturally be larger than in the 1988 estimate in this area. The different orientation of sections in the 1988 East Zone estimate is not explained in the report. The Northair report suggests that not all the drilling in the last 1988 program was completed before Peterson completed his calculations. If this assumption is correct, a lower tonnage may have been estimated and reported.
Mining Operation In May 2002 the Orphan Boy Resources Inc. acquired 100% of Bethlehem Resources (1996) Corporation. Bethlehem’s principal assets include the Goldstream mill and rail-siding industrial land in Revelstoke, B.C. The 1,000 metric ton per day Goldstream mill and related
infrastructure, which is on care and maintenance, is located approximately 75 kilometres north of Revelstoke. The original integrated Goldstream mine and mill complex operated until January 1996 when low metal prices and diminishing copper-zinc ore reserves from the underground mine and surface pit forced a closure of the operations. The Orphan Boy Resources Inc.’s mineral exploration strategy has focused on identifying alternative sources of ore in the region which would be amenable to processing in the Goldstream mill, with minimal modifications to the plant. The Willa Deposit will be the initial source feed for this mill. The deposit is 220 kilometers south of the mill, connected by predominantly paved provincial highways (see regional map). Tri-axle, side-dump, tandem highway trucks will be used to transfer the Willa ore to the Goldstream mill. The company intends to start mining the Willa using retreat longhole and/or shrinkage stoping methods. The ore will be transferred from the stopes via trackless equipment to bin(s) above the 1025 Level. This will enable large rail cars to be loaded from chutes and hence trammed outside. The ground conditions in the underground workings are very good, especially in the re-healed Heterolithic Breccia. Few ground control problems are anticipated and pillars may not be required in stopes. Initial excavation and blasting will determine whether or not pillars are required. The proposed mining rate will be 500 tonnes per day. This rate may increase as more stopes are developed or as new ore blocks are discovered from the recommended exploration program detailed in the next section. Mine plans and schedule are being developed and will be completed by the end of March 2003. An Ore Reserve estimate may be developed after the completion of the mine plan and schedule using the mine numbers and other economic factors in the estimate.
Exploration Recommendations The completion of the Mineral Resource estimate indicates that the Willa Deposit has approximately 2 years of mine life at 500 tonnes per day. To increase the mine life before full production is achieved, an underground and surface exploration program is recommended.
Underground Exploration The underground exploration program would entail only diamond drilling in strategic locations that have either not been drilled or are under-drilled. It is much easier to identify these areas now that all the drill holes have been put into Surpac. The following three figures (Plan Section, E-W Cross-section and N-S Long Section) identify 6 areas which are close to the present workings as well as the ore blocks and require minimal drilling.
Area A This area is immediately south and along strike of the East Zone. There are several high-grade (> 0.35 g/mt Au) blocks at the south end of the Zone. Area A has not been drilled for the East Zone extension.
5525450 mN
5525500 mN
5525550 mN
5525600 mN
Area
Adi t land
473500 mE
E
Date : March, 2003
Geospectrum Engineering
5525350 mN
WEST ZONE
F
MAIN ZONE
C
3 99
D
lin ec
e
1013 Decline
el ev
Block Model Plan
Slocan Mining Division British Columbia, Canada
Goldstream Willa Gold Project
ORPHAN BOY RESOURCES INC. 5525400 mN
Roc k
A
473550 mE
A Exploration
Potential
Drillhole
> 3.5 g/mt Au
2.5 - 3.5 g/mt Au
Le vel
473650 mE
5525650 mN
473450 mE
110 0
473700 mE
LEGEND 1.5 - 2.5 g/mt Au
473800 mE
5525700 mN
A
101 3
Le vel
473850 mE
el Lev
EAST ZONE
B
473900 mE
5 102
473600 mE
L 00 11
473750 mE
l eve 5L 2 0 1
473950 mE
1000 mEl
1025 Level 473550 mE
473500 mE
1100 Level
Date : March, 2003
Geospectrum Engineering
Looking North
Block Model E-W Cross-Section
Slocan Mining Division British Columbia, Canada
Goldstream Willa Gold Project
ORPHAN BOY RESOURCES INC.
473450 mE
1050 mEl
1100 mEl
1150 mEl
950 mEl
E
WEST ZONE
473650 mE
Rockland Adit
F
lin Dec 993
e
1013 D ecline
C
MAIN ZONE
Willa No. 1 Adit
473750 mE
1200 mEl
473800 mE
1250 mEl
473850 mE
A
1013 Level
EAST ZONE
B
Area
A Exploration
Potential
Drillhole
> 3.5 g/mt Au
2.5 - 3.5 g/mt Au
LEGEND 1.5 - 2.5 g/mt Au
473900 mE 473700 mE
473600 mE
EAST ZONE
Geospectrum Engineering Date : March, 2003
Looking West
Block Model N-S Long-Section
Slocan Mining Division British Columbia, Canada
5525600 mN
F Rockland Adit
Goldstream Willa Gold Project
1013 Level
B
5525650 mN
ORPHAN BOY RESOURCES INC.
1025 Level
1100 Level
C
MAIN ZONE
Area
5525700 mN
Willa No. 1 Adit
Potential
A Exploration
> 3.5 g/mt Au
Drillhole
2.5 - 3.5 g/mt Au
LEGEND 1.5 - 2.5 g/mt Au
5525750 mN
aise 0R 110
5525550 mN
ecline 993 D
5525500 mN
D
WEST ZONE
A
5525450 mN
5525400 mN
5525350 mN
5525300 mN
900 mEl
950 mEl
1000 mEl
1050 mEl
1100 mEl
1150 mEl
1200 mEl
1250 mEl
5525250 mN
5525200 mN
It is recommended that three wide-spaced drill holes (approximately 450 meters total length) would be required to explore this area. The most appropriate drill station location would be in the 933 Decline. The alternative drill station would be at the end of the 1025 Level (950 South Drift) but this would require long holes to compensate for the more distant location. Further drilling
would be required to delineate the East Zone extension if the drill holes are successful in intersecting mineralization.
Area B Area B is immediately north and along strike of the East Zone. The 1013 Level was established as a drill station to explore this Zone. Drill holes on the 1013 Level North Cross-cut were drilled to the south and intersected the Zone. No vertical or north trending holes were ever drilled from this platform. It is recommended that five drill holes be drilled in this area (approximately 600 meters total length). The 1013 Level North Cross-cut should be used as the drill station. Further drilling would be required to delineate the East Zone extension if the drill holes are successful in intersecting mineralization.
Area C This area is northeast and along strike of the Main Zone. This area has not been drilled even though the 1100 Level East Cross-cut was driven to its boundary. It is recommended that three drill holes be drilled in this area (approximately 300 meters total length). The 1100 Level East Cross-cut should be used as the drill station. Further drilling would be required to delineate the North Zone extension if the drill holes are successful in intersecting mineralization.
Area D Area D is south and along strike of the West Zone. The past drilling from the end of the 1025 Level 950 South Drift appears to have been short holes. It is recommended that three drill holes be drilled in this area to explore a possible extension of this zone (approximately 600 meters total length). The original last drill station on 1025 Level 950 South Drift could be used for these holes. If the drill holes were successful in intersecting mineralization, further drilling would be required. Depending on the location(s) of the intersections, there is the possibility that an extension of either the 1100 Level South Drift and/or the 1025 Level 950 South Drift would be required to create drill station(s) better located to continue delineating the mineralization in this area.
Area E This western area of the West Zone had a large volume of high-grade (> 0.35 g/mt Au) blocks from one drill hole. It is recommended that two drill holes be drilled in this area to explore this high-grade (> 0.35 g/mt Au) portion of the West Zone (approximately 250 meters total length). The west end of the
1025 Level 950 Cross-cut could be used as a drill station. Some additional drilling may be required to delineate this area if the drill holes are successful in intersecting mineralization.
Area F From a detailed 3D examination of the Surpac block model and drill hole database, there are several drill intersection gaps and therefore possibly an absence of estimated blocks within the southern portion of the Main Zone. The gaps are: • • •
5525570 mN to 5525600 mN 5525510 mN to 5525540 mN 5525440 mN to 5525480 mN
Each gap would require at least one drill hole to intersect that area. Unfortunately, due to the plunge of the Main Zone, only the first gap could be effectively reached with a 150-meter hole from the 1100 Level. All other gaps would require 250 + meter holes to achieve their targets. The alternative would be to use a surface drill to intersect all three gaps with three 100 + meter holes (approximately 400 meters). If the mineralization continues to the south further drilling would be necessary to delineate this extension of the Main Zone.
Underground Drill Summary The table below summarizes the recommended drilling that would be required to explore all of the areas mentioned above. None of this drilling would require additional underground development work other than the de-watering of the 1013 Decline, 1013 Level and 933 Decline/1025 Raise workings. The portal of the 1100 Level will need to be rehabilitated to provide ventilation and escapeway access before work can proceed. Other than the portal, the condition of the 1100 Level is unknown at this time. If it is in a state similar to the 1025 Level, there should be little work required to gain complete access to this level. The largest mobilization cost will be air, water and possibly power lines to the various drill setups. Completing this underground drill program will expose new ore faster than the surface exploration program would. Success in the surface exploration program, however, could provide a much longer mine life for the property.
Proposed Underground Exploration Drill Program Meterage Area A
Zone EAST (south)
B
EAST (north)
C
MAIN (north)
D
WEST (south)
E
WEST
F
MAIN (south)
Grand Total
Drill Hole No. 1 2 3 Total 1 2 3 4 5 Total 1 2 3 Total 1 2 3 Total 1 2 Total 1 2* 3* Total 19
Total Depth (m) 100 150 200 450 100 100 100 150 150 600 100 100 100 300 150 200 250 600 125 125 250 150 250 300 700 2,900
Surface Exploration Surface exploration should initially consist of combining all surface exploration work data in the area of Congo and Aylwin Creeks from both the Willa and LH Properties into a single database. This has been partially completed. Access to this area will be the single largest problem and expense due to the fact that most of the anomalies are near the top of the main ridge separating Congo and Aylwin Creeks. Several of the anomalies are straddling sharp side-ridges on the Congo side of the main ridge. The figure below identifies the area of surface exploration, the present roads and proposed haul road from the 1025 Level Portal. At this time the use of helicopters is warranted until the zone(s) of mineralization can be partially delineated. Initially, a helicopter-assisted reconnaissance geological survey should be completed to pin-point the various soil grids and historical rock sample locations. A short soil geochem program should be undertaken to confirm these anomalies.
ROAD
MOUNTAIN
CO N G O
D RE
CR EE
Proposed Surface Exploration Area
LH P Wil la
1025 Level
K
Approximate Location of The Noranda Ridge Grid rop e
Pro
IN LW AY
p er
rt y
ty
Little
1100 Level
Daisy Cr ee k
N
WILLA DEPOSIT
CR
EE
K
AYLWIN LAKE
LEGEND Gold Geochem > 100 ppb Copper Geochem > 100 ppm Tungsten Geochem > 12 ppm Arsenic Geochem > 150 ppm
Orphan Boy Resources March, Inc. 2001 Geospectrum Engineering
Present Road Proposed Haul Road 0
Proposed Surface Exploration Area
SCALE 200
400
Meters
Source : 1984 BP Mineral Geochem Survey 1981 HBOG Geochem Survey
Willa Property Slocan Mining Division British Columbia
Surface Exploration Map Date : March, 2003
Drawn By : DKM
Helicopter-assisted hand trenching should then be undertaken to cross-cut all anomalies. All data locations will be GPS’ed and entered into the computer database. Success with the above programs would lead to a surface helicopter-assisted drill program. The feasibility of developing a series of tote roads should be addressed if the drilling is successful. The roads should be placed so that they intersect and traverse as many of the anomalies as possible. Roads could become trenches if mineralization is discovered. If the drill results indicate that the mineralized zones continue at depth it may be warranted to drive a cross-cut from the 1025 Level rather than developing these tote roads. The cross-cut could serve initially as an underground drill platform and later as a haulway for newly discovered ore blocks.
Exploration Costs It is recommended that the underground drilling begin as soon as possible. After spring breakup the initial reconnaissance of the surface can start. The underground drilling program will be approximately $400,000. This includes the drilling costs ($100/meter), geologist, assays and mobilization costs. Success with these holes would indicate additional drilling and hence additional costs. The surface work can be roughly broken down by phases. Phase 1
2
3
4
Description Compilation and planning Reconnaissance geochem Contingency (10%) Subtotal Helicopter trenching Contingency (20%) Subtotal Helicopter drilling (8,000 m) Contingency (20%) Subtotal Grand Total Road building (~ 5,000 m) U/G 1025 Level crosscut (~ 500 – 700 m)
Cost 10,000 70,000 8,000 88,000 150,000 30,000 180,000 1,200,000 240,000 1,440,000 1,708,000 NA NA
Conclusions All known drill hole data has been converted to digital format and, for the first time, the deposit can be viewed in three-dimensional space (3D). This data has been used to define the quality and quantity of the existing mineral resource at the Willa property. It has also been used to identify underground exploration drill targets that may increase the quantity of the mineral resource and thereby extend the mine life. A detailed block model was developed and filled using an ID3 estimation method. Using the most recent mineral resource calculation (1988) assumptions and constraining the block model to conform to National Instrument 43-101, a new mineral resource calculation was derived. The new Mineral Resource for the Willa Deposit is: Category
Tonnes (mt) Measured 487,989 Indicated 292,457 Inferred 216,177 996,623 Total Note: Cutoff is 3.5 g/mt Au
Gold (g/mt Au) 6.77 5.31 6.55 6.30
Copper (%) 0.97 0.65 0.57 0.79
Silver (g/mt Ag) 11.59 11.94 7.32 10.77
A comparison of the new Measured Mineral Resource calculation to the 1988 Measured Mineral Resource showed little variation between the two. Several under-drilled areas immediately around the known Zones have been identified with the aid of real-time 3D viewing of the deposit. Several other areas immediately along strike and adjacent to the known Zones have also been under-drilled. A series of strong geochemical anomalies within a kilometer and a half have identical signatures to the Willa Deposit. These anomalies have had limited exploration work completed on them due to the rugged terrain in the area. Rough exploration costs have been developed for a success-contingent underground and surface exploration program aimed at discovering more mineralization which could substantially increase the present mine life. There is sufficient justification, coupled with the known Mineral Resource of the deposit, to advance this project to a feasibility decision.
References Barker, D.J.,
1991. Preliminary Approach to Mining and Grade Evaluation Willa Project., January 17.
CIM,
2001. CIM Standards on Mineral Resources and Reserves, Definitions and Guidelines, CIM Standing Committee on Ore Reserve Definitions, August 20. 1985. The Aylwin Creek Gold-Copper-Silver Deposit, Southeastern British Columbia, MSc Thesis, Queen’s University, Department of Geological Sciences, Kingston, Ontario, March.
Heather, K.B.,
McLatchy, R.,
1988. Proposed Mining Plan for the Development of the Willa Orebody, Silverton, B.C., Tonto Group of Companies for Northair Mines Ltd., June 21.
Miller, D.C.,
1990. Geological Report on the Willa Property, Slocan Mining Division, for Treminco Resources Ltd., June 12.
Mitchell, I.
1988. Report on Field Activities, June – September, 1987, LH Property, Slocan Mining Division, Volume 1, Assessment Report 16,738.
Murray, I.,
1988. Northair Mines Ltd., Willa Project, 1988 Status Report, New Denver, B.C., December.
Petersen, D.B.,
1988a. Northair Mines Limited, Willa Project, 1988 Summary Report, December.
Petersen, D.B.,
1988b. Northair Mines Limited, Willa Project, 1988 Report on Ore Reserves, December.
Trenaman, R.T., 1991. The Willa Project, Treminco Resources Ltd., Information Related to Proceeding to Production., April 26. Werner, L.J.,
1986. Summary Report – Geology, Drilling and Drifting, May 1986 – June 1986, Northair Mines Ltd., Willa Project.
Wong, R.H. and Spence, C.D., 1995. Copper-gold mineralization in the Willa Breccia Pipe, Southeastern British Columbia, In CIM Special Volume 46, Porphyry Deposits of the Northwestern Cordillera of North America, Paper 25, pp 401-409.
Certification of Author
David K. Makepeace, M.Eng.,P.Eng. 2588 Birch Street Abbotsford, British Columbia, V2S 4H8 Phone: 604-853-9226 E-mail:
[email protected] I, David K. Makepeace, M.Eng., P.Eng., am a Professional Engineer and Principal of Geospectrum Engineering of 2588 Birch Street, in the City of Abbotsford, in the Province of British Columbia. I am: • •
A member of the Association of Professional Engineers and Geoscientists of British Columbia; A member of the Association of Professional Engineers, Geologists and Geophysicists of Alberta;
I graduated from Queen's University in Kingston, Ontario with a Bachelor of Applied Science honours degree in Geological Engineering in 1976. I subsequently obtained a Master of Engineering degree in Environmental Engineering from the University of Alberta in 1993. I have practiced my profession continuously since 1976. I have been involved in and/or directed: • Mineral exploration for gold, silver, copper, lead, zinc, platinum, palladium, and uranium and industrial minerals in Canada, the USA, and West Africa, between 1974 and 2001; • Oil exploration in Canada between 1977 and 1979; • Mineral project development for gold, silver, copper, lead, zinc, PGE, magnesium and uranium in Canada and the USA, between 1979 and 2003; • Operation of producing mines for gold, silver, copper, lead and zinc, both underground and open pit, of more than 100 tonnes per day from 1979 to 1992 in Canada and the USA, where I was Chief Geologist for several mining companies; • Mineral resource estimates of gold, silver, copper, lead and zinc deposits utilizing graphical and computerized geological modeling techniques for numerous mineral deposits between 1979 and 2003. By virtue of my education and experience, I am a Qualified Person as defined in National Instrument 43-101. I am presently a Consulting Geological Engineer and have been so since January, 1996. I am independent of Orphan Boy Resources Inc. in accordance with the application of Section 1.5 of National Instrument 43-101. I have visited the Willa deposit several times, most recently in November, 2002. I have reviewed all diamond drill data and other geological data available from Orphan Boy Resources Inc. This report was prepared by myself. The source of all geological information for this report is the geological database available at Orphan Boy Resources Inc.’s head office in Vancouver, British Columbia. The information provided by Orphan Boy Resources Inc. is to the best of my knowledge and experience correct. I am not aware of any material fact or material change with respect to the subject matter of this technical report that is not reflected in this report. I have read National Instrument 43-101, Companion Policy 43-101CP and Form 43-101FI. The mineral resource estimation section of the Preliminary Report has been prepared in compliance with NI 43-101, Companion Policy 43-101CP, Form 43-101FI and CIM mineral resource definitions (August 20, 2000). Dated at Abbotsford, British Columbia, this 28 day of March, 2003.
David K. Makepeace, M.Eng., P.Eng.
Validation Assay Sheets
Detailed Mineral Resource Sheets (Constrained to Cutoff Grades – 3.5, 2.5 and 1.5 g/mt Au) (Constrained to 10 meter lifts)
Willa Deposit Mineral Resource Estimate Summary
Cutoff - 3.5 g/t Au Measured Indicated Inferred Grand Total
Volume 168,272 100,848 74,544 343,664
Measured Indicated Inferred Grand Total
Volume 273,360 203,712 154,192 631,264
Measured Indicated Inferred Grand Total
Volume 470,648 454,056 450,984 1,375,688
Tonnes 487,989 292,457 216,177 996,623
Au (g/mt) 6.77 5.31 6.55 6.30
Cu (%) 0.97 0.65 0.57 0.79
Ag (g/mt) 11.59 11.94 7.32 10.77
0.83 0.62 0.49 0.68
Ag (g/mt) 9.95 9.79 7.14 9.21
0.68 0.51 0.39 0.53
Ag (g/mt) 8.80 7.05 5.56 7.16
Cutoff - 2.5 g/t Au Tonnes 792,744 590,765 447,157 1,830,666
Au (g/mt) 5.30 4.11 4.71 4.77
Cu (%)
Cutoff - 1.5 g/t Au Tonnes 1,364,879 1,316,763 1,307,852 3,989,494
Au (g/mt) 3.89 2.91 2.86 3.23
Cu (%)
Northair 1988 Mineral Reserve Estimate, Cutoff - 3.4286 g/t Au Tonnes 414,334
West Zone - Proven - Mining (Diluted)
Au (g/mt) 5.93
Cu (%) 0.91
Ag (g/mt) 0.00
Northair 1988 Mineral Resource Estimate, Cutoff - 3.4286 g/t Au West Zone - Measured (Undiluted) East Zone - Measured (Undiluted) Main Zone - Indicated (Undiluted) Main Zone - Inferred (Undiluted) Total
455,794 40,017 40,823 13,608 550,242
6.79 6.34 5.14 5.14 6.59
0.95 0.74 0.57 0.57 0.90
0.00 0.00 0.00 0.00 0.00
0.97 0.83 0.68
Ag (g/mt) 11.59 9.95 8.80
0.65 0.62 0.51
Ag (g/mt) 11.94 9.79 7.05
0.57 0.49 0.39
Ag (g/mt) 7.32 7.14 5.56
Measured Mineral Resource Cutoff 3.5 2.5 1.5
Volume 168,272 273,360 470,648
Cutoff 3.5 2.5 1.5
Volume 100,848 203,712 454,056
Cutoff 3.5 2.5 1.5
Volume 74,544 154,192 450,984
Tonnes 487,989 792,744 1,364,879
Au (g/mt) 6.77 5.30 3.89
Cu (%)
Indicated Mineral Resource Tonnes 292,457 590,765 1,316,763
Au (g/mt) 5.31 4.11 2.91
Cu (%)
Inferred Mineral Resource
Willa_BM_MR_Report
Tonnes 216,177 447,157 1,307,852
Au (g/mt) 6.55 4.71 2.86
Cu (%)
3/27/2003
Willa Deposit Measured Mineral Resource Estimate Cutoff - 3.5 g/t Au
Z 800-810 810-820 820-830 830-840 840-850 850-860 860-870 870-880 880-890 890-900 900-910 910-920 920-930 930-940 940-950 950-960 960-970 970-980 980-990 990-1000 1000-1010 1010-1020 1020-1030 1030-1040 1040-1050 1050-1060 1060-1070 1070-1080 1080-1090 1090-1100 1100-1110 1110-1120 1120-1130 1130-1140 1140-1150 1150-1160 1160-1170 1170-1180 1180-1190 1190-1200 1200-1210 1210-1220 1220-1230 1230-1240 1240-1250 1250-1260 1260-1270 1270-1280 1280-1290 1290-1300 1300-1310 1310-1320 1320-1330 1330-1340 1340-1350 Grand Total
Willa_BM_MR_Report
Volume 0 0 0 0 0 0 0 0 0 0 0 0 0 0 480 2,072 2,728 3,080 3,608 7,744 18,216 24,648 20,536 18,328 14,768 9,720 9,040 7,664 5,792 4,384 3,000 2,712 1,944 1,984 1,408 1,248 1,664 528 152 112 448 112 152 0 0 0 0 0 0 0 0 0 0 0 0 168,272
Tonnes 0 0 0 0 0 0 0 0 0 0 0 0 0 0 1,392 6,009 7,911 8,932 10,463 22,458 52,826 71,479 59,554 53,151 42,827 28,188 26,216 22,226 16,797 12,714 8,700 7,865 5,638 5,754 4,083 3,619 4,826 1,531 441 325 1,299 325 441 0 0 0 0 0 0 0 0 0 0 0 0 487,989
Au Mea
Cu Mea 0.00 0.00 0.00 0.00 0.00 0.00 0.00 0.00 0.00 0.00 0.00 0.00 0.00 0.00 9.21 6.02 5.48 6.44 6.52 7.30 8.12 7.21 7.04 6.49 6.23 6.18 6.45 7.25 5.80 6.83 6.81 4.78 5.58 6.13 5.16 6.66 5.96 5.25 5.04 3.66 4.15 4.98 3.99 0.00 0.00 0.00 0.00 0.00 0.00 0.00 0.00 0.00 0.00 0.00 0.00 6.77
Ag Mea 0.00 0.00 0.00 0.00 0.00 0.00 0.00 0.00 0.00 0.00 0.00 0.00 0.00 0.00 0.47 0.53 0.64 0.56 0.48 0.76 1.04 1.20 0.89 0.99 0.99 1.12 1.08 1.11 0.98 0.99 1.03 0.92 0.61 0.65 0.76 0.57 0.84 0.84 0.87 0.67 0.87 1.17 0.54 0.00 0.00 0.00 0.00 0.00 0.00 0.00 0.00 0.00 0.00 0.00 0.00 0.97
0.00 0.00 0.00 0.00 0.00 0.00 0.00 0.00 0.00 0.00 0.00 0.00 0.00 0.00 5.97 6.03 6.54 7.90 5.59 9.24 10.97 10.03 9.38 14.45 13.06 14.52 14.83 15.32 15.13 19.15 12.52 12.15 6.81 4.01 6.39 7.74 6.53 10.03 12.00 12.90 12.91 13.68 10.37 0.00 0.00 0.00 0.00 0.00 0.00 0.00 0.00 0.00 0.00 0.00 0.00 11.59
Tonnes 0 0 0 0 0 0 0 0 0 0 0 0 0 0 1,392 7,401 15,312 24,244 34,707 57,165 109,991 181,470 241,024 294,175 337,002 365,190 391,406 413,632 430,429 443,143 451,843 459,708 465,346 471,100 475,183 478,802 483,628 485,159 485,600 485,925 487,224 487,549 487,990 487,990 487,990 487,990 487,990 487,990 487,990 487,990 487,990 487,990 487,990 487,990 487,990
Cummulative (ascending) Au Mea Cu Mea 0.00 0.00 0.00 0.00 0.00 0.00 0.00 0.00 0.00 0.00 0.00 0.00 0.00 0.00 0.00 0.00 0.00 0.00 0.00 0.00 0.00 0.00 0.00 0.00 0.00 0.00 0.00 0.00 9.21 0.47 6.62 0.52 6.03 0.58 6.18 0.58 6.28 0.55 6.68 0.63 7.37 0.82 7.31 0.97 7.24 0.95 7.11 0.96 7.00 0.96 6.93 0.97 6.90 0.98 6.92 0.99 6.88 0.99 6.87 0.99 6.87 0.99 6.84 0.99 6.82 0.98 6.81 0.98 6.80 0.98 6.80 0.97 6.79 0.97 6.78 0.97 6.78 0.97 6.78 0.97 6.77 0.97 6.77 0.97 6.77 0.97 6.77 0.97 6.77 0.97 6.77 0.97 6.77 0.97 6.77 0.97 6.77 0.97 6.77 0.97 6.77 0.97 6.77 0.97 6.77 0.97 6.77 0.97 6.77 0.97
Ag Mea 0.00 0.00 0.00 0.00 0.00 0.00 0.00 0.00 0.00 0.00 0.00 0.00 0.00 0.00 5.97 6.02 6.29 6.88 6.49 7.57 9.20 9.53 9.49 10.39 10.73 11.02 11.28 11.49 11.63 11.85 11.86 11.87 11.81 11.71 11.67 11.64 11.59 11.58 11.58 11.58 11.59 11.59 11.59 11.59 11.59 11.59 11.59 11.59 11.59 11.59 11.59 11.59 11.59 11.59 11.59
Tonnes 487,990 487,990 487,990 487,990 487,990 487,990 487,990 487,990 487,990 487,990 487,990 487,990 487,990 487,990 487,990 486,598 480,589 472,678 463,746 453,283 430,825 377,999 306,520 246,966 193,815 150,988 122,800 96,584 74,358 57,561 44,847 36,147 28,282 22,644 16,890 12,807 9,188 4,362 2,831 2,390 2,065 766 441 0 0 0 0 0 0 0 0 0 0 0 0
Cummulative (descending) Au Mea Cu Mea 6.77 0.97 6.77 0.97 6.77 0.97 6.77 0.97 6.77 0.97 6.77 0.97 6.77 0.97 6.77 0.97 6.77 0.97 6.77 0.97 6.77 0.97 6.77 0.97 6.77 0.97 6.77 0.97 6.77 0.97 6.76 0.97 6.77 0.98 6.79 0.98 6.80 0.99 6.81 1.00 6.78 1.02 6.59 1.01 6.45 0.97 6.31 0.99 6.26 0.99 6.27 0.99 6.29 0.96 6.24 0.93 5.94 0.88 5.99 0.85 5.75 0.81 5.49 0.75 5.69 0.71 5.72 0.73 5.57 0.76 5.71 0.76 5.33 0.83 4.64 0.83 4.30 0.83 4.17 0.82 4.25 0.85 4.41 0.80 3.99 0.54 0.00 0.00 0.00 0.00 0.00 0.00 0.00 0.00 0.00 0.00 0.00 0.00 0.00 0.00 0.00 0.00 0.00 0.00 0.00 0.00 0.00 0.00 0.00 0.00
Ag Mea 11.59 11.59 11.59 11.59 11.59 11.59 11.59 11.59 11.59 11.59 11.59 11.59 11.59 11.59 11.59 11.60 11.67 11.76 11.83 11.98 12.12 12.28 12.80 13.63 13.40 13.50 13.27 12.84 12.10 11.22 8.97 8.11 6.99 7.04 8.07 8.60 8.94 11.61 12.46 12.54 12.49 11.77 10.37 0.00 0.00 0.00 0.00 0.00 0.00 0.00 0.00 0.00 0.00 0.00 0.00
3/27/2003
Willa Deposit Measured Mineral Resource Estimate Cutoff - 2.5 g/t Au
Z 800-810 810-820 820-830 830-840 840-850 850-860 860-870 870-880 880-890 890-900 900-910 910-920 920-930 930-940 940-950 950-960 960-970 970-980 980-990 990-1000 1000-1010 1010-1020 1020-1030 1030-1040 1040-1050 1050-1060 1060-1070 1070-1080 1080-1090 1090-1100 1100-1110 1110-1120 1120-1130 1130-1140 1140-1150 1150-1160 1160-1170 1170-1180 1180-1190 1190-1200 1200-1210 1210-1220 1220-1230 1230-1240 1240-1250 1250-1260 1260-1270 1270-1280 1280-1290 1290-1300 1300-1310 1310-1320 1320-1330 1330-1340 1340-1350 Grand Total
Willa_BM_MR_Report
Volume 0 0 0 0 0 0 0 0 0 0 0 0 8 248 1,528 3,632 4,792 5,080 6,064 13,400 25,000 35,040 33,952 28,288 24,248 18,936 15,128 12,728 10,488 7,072 5,208 5,400 4,056 3,360 2,648 1,400 2,040 2,048 504 128 520 128 288 0 0 0 0 0 0 0 0 0 0 0 0 273,360
Tonnes 0 0 0 0 0 0 0 0 0 0 0 0 23 719 4,431 10,533 13,897 14,732 17,586 38,860 72,500 101,616 98,461 82,035 70,319 54,914 43,871 36,911 30,415 20,509 15,103 15,660 11,762 9,744 7,679 4,060 5,916 5,939 1,462 371 1,508 371 835 0 0 0 0 0 0 0 0 0 0 0 0 792,744
Au Mea
Cu Mea 0.00 0.00 0.00 0.00 0.00 0.00 0.00 0.00 0.00 0.00 0.00 0.00 2.88 2.72 4.84 4.71 4.40 5.05 5.06 5.44 6.74 5.95 5.42 5.24 4.96 4.61 5.05 5.56 4.51 5.32 5.15 3.89 4.23 4.87 4.14 6.24 5.41 3.54 3.47 3.57 3.96 4.68 3.64 0.00 0.00 0.00 0.00 0.00 0.00 0.00 0.00 0.00 0.00 0.00 0.00 5.30
Ag Mea 0.00 0.00 0.00 0.00 0.00 0.00 0.00 0.00 0.00 0.00 0.00 0.00 0.02 0.14 0.47 0.50 0.56 0.55 0.47 0.64 0.91 1.03 0.77 0.86 0.85 0.88 0.92 0.93 0.87 0.86 0.84 0.91 0.57 0.64 0.70 0.60 0.78 0.61 0.71 0.66 0.83 1.08 0.52 0.00 0.00 0.00 0.00 0.00 0.00 0.00 0.00 0.00 0.00 0.00 0.00 0.83
0.00 0.00 0.00 0.00 0.00 0.00 0.00 0.00 0.00 0.00 0.00 0.00 0.69 2.52 5.31 5.20 5.53 6.94 5.49 7.37 9.58 8.90 8.08 13.01 10.84 11.62 12.61 12.65 13.20 16.19 11.18 12.42 5.19 3.10 5.65 6.93 5.93 4.39 4.97 12.63 12.51 13.19 9.78 0.00 0.00 0.00 0.00 0.00 0.00 0.00 0.00 0.00 0.00 0.00 0.00 9.95
Tonnes 0 0 0 0 0 0 0 0 0 0 0 0 23 742 5,173 15,706 29,603 44,335 61,921 100,781 173,281 274,897 373,358 455,393 525,712 580,626 624,497 661,408 691,823 712,332 727,435 743,095 754,857 764,601 772,280 776,340 782,256 788,195 789,657 790,028 791,536 791,907 792,742 792,742 792,742 792,742 792,742 792,742 792,742 792,742 792,742 792,742 792,742 792,742 792,742
Cummulative (ascending) Au Mea Cu Mea 0.00 0.00 0.00 0.00 0.00 0.00 0.00 0.00 0.00 0.00 0.00 0.00 0.00 0.00 0.00 0.00 0.00 0.00 0.00 0.00 0.00 0.00 0.00 0.00 2.88 0.02 2.72 0.14 4.54 0.42 4.65 0.47 4.53 0.51 4.71 0.53 4.81 0.51 5.05 0.56 5.76 0.71 5.83 0.83 5.72 0.81 5.63 0.82 5.54 0.83 5.46 0.83 5.43 0.84 5.43 0.84 5.39 0.84 5.39 0.84 5.39 0.84 5.36 0.84 5.34 0.84 5.33 0.84 5.32 0.84 5.32 0.84 5.33 0.83 5.31 0.83 5.31 0.83 5.31 0.83 5.31 0.83 5.30 0.83 5.30 0.83 5.30 0.83 5.30 0.83 5.30 0.83 5.30 0.83 5.30 0.83 5.30 0.83 5.30 0.83 5.30 0.83 5.30 0.83 5.30 0.83 5.30 0.83 5.30 0.83
Ag Mea 0.00 0.00 0.00 0.00 0.00 0.00 0.00 0.00 0.00 0.00 0.00 0.00 0.69 2.46 4.90 5.10 5.30 5.85 5.75 6.37 7.71 8.15 8.13 9.01 9.26 9.48 9.70 9.86 10.01 10.19 10.21 10.26 10.18 10.09 10.04 10.03 10.00 9.95 9.94 9.95 9.95 9.95 9.95 9.95 9.95 9.95 9.95 9.95 9.95 9.95 9.95 9.95 9.95 9.95 9.95
Tonnes 792,742 792,742 792,742 792,742 792,742 792,742 792,742 792,742 792,742 792,742 792,742 792,742 792,742 792,719 792,000 787,569 777,036 763,139 748,407 730,821 691,961 619,461 517,845 419,384 337,349 267,030 212,116 168,245 131,334 100,919 80,410 65,307 49,647 37,885 28,141 20,462 16,402 10,486 4,547 3,085 2,714 1,206 835 0 0 0 0 0 0 0 0 0 0 0 0
Cummulative (descending) Au Mea Cu Mea 5.30 0.83 5.30 0.83 5.30 0.83 5.30 0.83 5.30 0.83 5.30 0.83 5.30 0.83 5.30 0.83 5.30 0.83 5.30 0.83 5.30 0.83 5.30 0.83 5.30 0.83 5.30 0.83 5.31 0.83 5.31 0.84 5.32 0.84 5.33 0.85 5.34 0.85 5.35 0.86 5.34 0.87 5.18 0.87 5.02 0.84 4.93 0.85 4.86 0.85 4.83 0.85 4.89 0.84 4.84 0.82 4.64 0.79 4.68 0.76 4.52 0.74 4.37 0.71 4.52 0.65 4.61 0.68 4.52 0.69 4.67 0.68 4.28 0.71 3.64 0.67 3.77 0.74 3.91 0.76 3.96 0.77 3.96 0.69 3.64 0.52 0.00 0.00 0.00 0.00 0.00 0.00 0.00 0.00 0.00 0.00 0.00 0.00 0.00 0.00 0.00 0.00 0.00 0.00 0.00 0.00 0.00 0.00 0.00 0.00
Ag Mea 9.95 9.95 9.95 9.95 9.95 9.95 9.95 9.95 9.95 9.95 9.95 9.95 9.95 9.95 9.96 9.98 10.05 10.13 10.19 10.31 10.47 10.58 10.91 11.57 11.22 11.32 11.24 10.89 10.39 9.54 7.85 7.08 5.39 5.46 6.27 6.51 6.40 6.67 9.65 11.87 11.76 10.83 9.78 0.00 0.00 0.00 0.00 0.00 0.00 0.00 0.00 0.00 0.00 0.00 0.00
3/27/2003
Willa Deposit Measured Mineral Resource Estimate Cutoff - 1.5 g/t Au
Z 800-810 810-820 820-830 830-840 840-850 850-860 860-870 870-880 880-890 890-900 900-910 910-920 920-930 930-940 940-950 950-960 960-970 970-980 980-990 990-1000 1000-1010 1010-1020 1020-1030 1030-1040 1040-1050 1050-1060 1060-1070 1070-1080 1080-1090 1090-1100 1100-1110 1110-1120 1120-1130 1130-1140 1140-1150 1150-1160 1160-1170 1170-1180 1180-1190 1190-1200 1200-1210 1210-1220 1220-1230 1230-1240 1240-1250 1250-1260 1260-1270 1270-1280 1280-1290 1290-1300 1300-1310 1310-1320 1320-1330 1330-1340 1340-1350 Grand Total
Willa_BM_MR_Report
Volume 0 0 0 0 0 0 0 0 0 96 0 0 544 1,760 4,480 7,384 8,248 10,224 15,256 25,976 33,152 49,240 54,688 44,832 39,072 32,648 26,216 22,088 20,280 13,824 11,048 11,016 8,904 7,440 6,664 2,912 3,632 3,920 1,456 808 1,176 904 720 32 8 0 0 0 0 0 0 0 0 0 0 470,648
Tonnes 0 0 0 0 0 0 0 0 0 278 0 0 1,578 5,104 12,992 21,414 23,919 29,650 44,242 75,330 96,141 142,796 158,595 130,013 113,309 94,679 76,026 64,055 58,812 40,090 32,039 31,946 25,822 21,576 19,326 8,445 10,533 11,368 4,222 2,343 3,410 2,622 2,088 93 23 0 0 0 0 0 0 0 0 0 0 1,364,879
Au Mea
Cu Mea 0.00 0.00 0.00 0.00 0.00 0.00 0.00 0.00 0.00 1.90 0.00 0.00 1.75 1.99 2.92 3.30 3.36 3.45 3.13 3.73 5.56 4.80 4.11 4.04 3.82 3.49 3.74 4.02 3.27 3.66 3.43 2.87 2.98 3.24 2.77 3.95 3.87 2.79 2.53 2.28 2.84 2.08 2.56 1.87 2.00 0.00 0.00 0.00 0.00 0.00 0.00 0.00 0.00 0.00 0.00 3.89
Ag Mea 0.00 0.00 0.00 0.00 0.00 0.00 0.00 0.00 0.00 0.33 0.00 0.00 0.19 0.22 0.41 0.37 0.45 0.46 0.43 0.56 0.81 0.87 0.65 0.72 0.71 0.70 0.79 0.75 0.70 0.65 0.62 0.71 0.48 0.52 0.52 0.53 0.59 0.48 0.59 0.78 0.62 0.70 0.31 0.32 0.00 0.00 0.00 0.00 0.00 0.00 0.00 0.00 0.00 0.00 0.00 0.68
0.00 0.00 0.00 0.00 0.00 0.00 0.00 0.00 0.00 10.40 0.00 0.00 1.40 2.39 4.29 3.76 4.40 5.18 4.48 5.36 8.26 16.03 6.88 10.13 8.73 9.38 10.82 10.16 10.67 11.71 8.98 9.72 3.96 1.95 3.61 7.07 4.45 2.57 2.54 5.97 9.92 11.91 10.96 5.84 2.00 0.00 0.00 0.00 0.00 0.00 0.00 0.00 0.00 0.00 0.00 8.80
Tonnes 0 0 0 0 0 0 0 0 0 278 278 278 1,856 6,960 19,952 41,366 65,285 94,935 139,177 214,507 310,648 453,444 612,039 742,052 855,361 950,040 1,026,066 1,090,121 1,148,933 1,189,023 1,221,062 1,253,008 1,278,830 1,300,406 1,319,732 1,328,177 1,338,710 1,350,078 1,354,300 1,356,643 1,360,053 1,362,675 1,364,763 1,364,856 1,364,879 1,364,879 1,364,879 1,364,879 1,364,879 1,364,879 1,364,879 1,364,879 1,364,879 1,364,879 1,364,879
Cummulative (ascending) Au Mea Cu Mea 0.00 0.00 0.00 0.00 0.00 0.00 0.00 0.00 0.00 0.00 0.00 0.00 0.00 0.00 0.00 0.00 0.00 0.00 1.90 0.33 1.90 0.33 1.90 0.33 1.77 0.21 1.93 0.22 2.58 0.35 2.95 0.36 3.10 0.40 3.21 0.42 3.18 0.42 3.38 0.47 4.05 0.57 4.29 0.67 4.24 0.66 4.21 0.67 4.16 0.68 4.09 0.68 4.06 0.69 4.06 0.69 4.02 0.69 4.01 0.69 3.99 0.69 3.96 0.69 3.94 0.69 3.93 0.68 3.92 0.68 3.92 0.68 3.92 0.68 3.91 0.68 3.90 0.68 3.90 0.68 3.90 0.68 3.89 0.68 3.89 0.68 3.89 0.68 3.89 0.68 3.89 0.68 3.89 0.68 3.89 0.68 3.89 0.68 3.89 0.68 3.89 0.68 3.89 0.68 3.89 0.68 3.89 0.68 3.89 0.68
Ag Mea 0.00 0.00 0.00 0.00 0.00 0.00 0.00 0.00 0.00 10.40 10.40 10.40 2.75 2.49 3.66 3.71 3.96 4.34 4.39 4.73 5.82 9.04 8.48 8.77 8.76 8.82 8.97 9.04 9.12 9.21 9.21 9.22 9.11 8.99 8.92 8.90 8.87 8.82 8.80 8.79 8.79 8.80 8.80 8.80 8.80 8.80 8.80 8.80 8.80 8.80 8.80 8.80 8.80 8.80 8.80
Tonnes 1,364,879 1,364,879 1,364,879 1,364,879 1,364,879 1,364,879 1,364,879 1,364,879 1,364,879 1,364,879 1,364,601 1,364,601 1,364,601 1,363,023 1,357,919 1,344,927 1,323,513 1,299,594 1,269,944 1,225,702 1,150,372 1,054,231 911,435 752,840 622,827 509,518 414,839 338,813 274,758 215,946 175,856 143,817 111,871 86,049 64,473 45,147 36,702 26,169 14,801 10,579 8,236 4,826 2,204 116 23 0 0 0 0 0 0 0 0 0 0
Cummulative (descending) Au Mea Cu Mea 3.89 0.68 3.89 0.68 3.89 0.68 3.89 0.68 3.89 0.68 3.89 0.68 3.89 0.68 3.89 0.68 3.89 0.68 3.89 0.68 3.89 0.68 3.89 0.68 3.89 0.68 3.89 0.68 3.90 0.68 3.91 0.68 3.92 0.69 3.93 0.69 3.94 0.70 3.97 0.71 3.99 0.71 3.84 0.71 3.69 0.68 3.60 0.69 3.51 0.68 3.45 0.67 3.44 0.67 3.37 0.64 3.22 0.61 3.20 0.59 3.10 0.58 3.02 0.56 3.07 0.52 3.09 0.54 3.04 0.54 3.16 0.55 2.98 0.56 2.62 0.55 2.48 0.60 2.46 0.61 2.51 0.56 2.28 0.52 2.53 0.31 1.90 0.26 2.00 0.00 0.00 0.00 0.00 0.00 0.00 0.00 0.00 0.00 0.00 0.00 0.00 0.00 0.00 0.00 0.00 0.00 0.00 0.00 0.00 0.00
Ag Mea 8.80 8.80 8.80 8.80 8.80 8.80 8.80 8.80 8.80 8.80 8.80 8.80 8.80 8.81 8.84 8.88 8.96 9.05 9.14 9.30 9.56 9.68 8.69 9.07 8.85 8.87 8.75 8.29 7.86 7.09 6.04 5.38 4.14 4.19 4.94 5.52 5.16 5.44 7.65 9.69 10.75 11.33 10.65 5.08 2.00 0.00 0.00 0.00 0.00 0.00 0.00 0.00 0.00 0.00 0.00
3/27/2003
Willa Deposit Indicated Mineral Resource Estimate Cutoff - 3.5 g/t Au
Total Z 800-810 810-820 820-830 830-840 840-850 850-860 860-870 870-880 880-890 890-900 900-910 910-920 920-930 930-940 940-950 950-960 960-970 970-980 980-990 990-1000 1000-1010 1010-1020 1020-1030 1030-1040 1040-1050 1050-1060 1060-1070 1070-1080 1080-1090 1090-1100 1100-1110 1110-1120 1120-1130 1130-1140 1140-1150 1150-1160 1160-1170 1170-1180 1180-1190 1190-1200 1200-1210 1210-1220 1220-1230 1230-1240 1240-1250 1250-1260 1260-1270 1270-1280 1280-1290 1290-1300 1300-1310 1310-1320 1320-1330 1330-1340 1340-1350 Grand Total
Willa_BM_MR_Report
Volume 0 0 0 0 0 0 0 0 0 0 0 0 0 0 1,544 5,080 6,880 6,480 7,224 13,016 30,152 35,520 26,160 27,232 22,040 15,104 14,992 11,096 9,216 7,856 4,544 2,472 1,976 3,376 3,352 3,608 4,520 2,232 808 448 936 488 480 48 0 0 0 0 0 0 0 0 0 0 0 268,880
Tonnes 0 0 0 0 0 0 0 0 0 0 0 0 0 0 4,478 14,732 19,952 18,792 20,950 37,746 87,441 103,008 75,864 78,973 63,916 43,802 43,477 32,178 26,726 22,782 13,178 7,169 5,730 9,790 9,721 10,463 13,108 6,473 2,343 1,299 2,714 1,415 1,392 139 0 0 0 0 0 0 0 0 0 0 0 779,752
Au Ind Total 0.00 0.00 0.00 0.00 0.00 0.00 0.00 0.00 0.00 0.00 0.00 0.00 0.00 0.00 6.41 5.69 5.45 6.24 6.05 7.07 7.08 6.60 6.91 6.20 5.72 5.65 5.66 6.08 5.37 6.71 5.81 4.62 4.98 5.23 4.83 6.01 6.15 6.26 4.83 3.86 3.99 4.16 3.75 3.93 0.00 0.00 0.00 0.00 0.00 0.00 0.00 0.00 0.00 0.00 0.00 6.23
Indicated Cu Ind Total 0.00 0.00 0.00 0.00 0.00 0.00 0.00 0.00 0.00 0.00 0.00 0.00 0.00 0.00 0.50 0.47 0.61 0.45 0.45 0.76 0.92 0.95 0.84 0.87 0.89 1.02 1.00 0.99 0.86 0.98 0.89 0.82 0.54 0.68 0.70 0.65 0.75 0.92 0.89 0.73 0.85 0.82 0.52 0.54 0.00 0.00 0.00 0.00 0.00 0.00 0.00 0.00 0.00 0.00 0.00 0.85
Ag Ind Total 0.00 0.00 0.00 0.00 0.00 0.00 0.00 0.00 0.00 0.00 0.00 0.00 0.00 0.00 6.43 5.82 6.62 5.91 5.75 9.60 13.36 13.05 10.39 11.87 12.04 14.96 15.76 14.72 13.80 17.65 11.76 11.26 7.76 3.54 3.89 7.83 7.81 10.30 11.75 12.24 12.58 12.22 9.91 10.28 0.00 0.00 0.00 0.00 0.00 0.00 0.00 0.00 0.00 0.00 0.00 11.73
Volume 0 0 0 0 0 0 0 0 0 0 0 0 0 0 1,064 3,008 4,152 3,400 3,616 5,272 11,936 10,872 5,624 8,904 7,272 5,384 5,952 3,432 3,424 3,472 1,544 0 32 1,392 1,944 2,360 2,856 1,704 656 336 488 376 328 48 0 0 0 0 0 0 0 0 0 0 0 100,848
Tonnes 0 0 0 0 0 0 0 0 0 0 0 0 0 0 3,086 8,723 12,041 9,860 10,487 15,288 34,615 31,529 16,310 25,822 21,089 15,614 17,261 9,952 9,929 10,068 4,478 0 92 4,036 5,638 6,844 8,282 4,942 1,902 974 1,415 1,090 951 139 0 0 0 0 0 0 0 0 0 0 0 292,457
Au Ind
Cu Ind 0.00 0.00 0.00 0.00 0.00 0.00 0.00 0.00 0.00 0.00 0.00 0.00 0.00 0.00 5.15 5.46 5.43 6.06 5.58 6.73 5.49 5.22 6.44 5.60 4.68 4.69 4.46 3.47 4.64 6.56 3.87 0.00 5.28 3.95 4.59 5.67 6.26 6.57 4.78 3.93 3.84 3.92 3.64 3.93 0.00 0.00 0.00 0.00 0.00 0.00 0.00 0.00 0.00 0.00 0.00 5.31
Ag Ind 0.00 0.00 0.00 0.00 0.00 0.00 0.00 0.00 0.00 0.00 0.00 0.00 0.00 0.00 0.51 0.43 0.58 0.36 0.42 0.75 0.75 0.40 0.65 0.63 0.68 0.84 0.89 0.71 0.66 0.96 0.63 0.00 0.58 0.73 0.65 0.69 0.71 0.95 0.90 0.75 0.83 0.72 0.50 0.54 0.00 0.00 0.00 0.00 0.00 0.00 0.00 0.00 0.00 0.00 0.00 0.65
0.00 0.00 0.00 0.00 0.00 0.00 0.00 0.00 0.00 0.00 0.00 0.00 0.00 0.00 6.64 5.68 6.67 4.11 5.91 10.13 17.01 19.90 14.08 6.56 9.97 15.75 17.17 13.38 11.55 15.76 10.28 0.00 65.98 2.87 2.08 7.88 8.56 10.38 11.69 12.02 12.28 11.78 9.70 10.28 0.00 0.00 0.00 0.00 0.00 0.00 0.00 0.00 0.00 0.00 0.00 11.94
Tonnes 0 0 0 0 0 0 0 0 0 0 0 0 0 0 3,086 11,809 23,850 33,710 44,197 59,485 94,100 125,629 141,939 167,761 188,850 204,464 221,725 231,677 241,606 251,674 256,152 256,152 256,244 260,280 265,918 272,762 281,044 285,986 287,888 288,862 290,277 291,367 292,318 292,457 292,457 292,457 292,457 292,457 292,457 292,457 292,457 292,457 292,457 292,457 292,457
Cummulative (ascending) Au Mea Cu Mea 0.00 0.00 0.00 0.00 0.00 0.00 0.00 0.00 0.00 0.00 0.00 0.00 0.00 0.00 0.00 0.00 0.00 0.00 0.00 0.00 0.00 0.00 0.00 0.00 0.00 0.00 0.00 0.00 5.15 0.51 5.38 0.45 5.41 0.52 5.60 0.47 5.59 0.46 5.89 0.53 5.74 0.61 5.61 0.56 5.70 0.57 5.69 0.58 5.58 0.59 5.51 0.61 5.43 0.63 5.34 0.64 5.31 0.64 5.36 0.65 5.34 0.65 5.34 0.65 5.34 0.65 5.32 0.65 5.30 0.65 5.31 0.65 5.34 0.65 5.36 0.66 5.36 0.66 5.35 0.66 5.34 0.66 5.34 0.66 5.33 0.66 5.33 0.66 5.33 0.66 5.33 0.66 5.33 0.66 5.33 0.66 5.33 0.66 5.33 0.66 5.33 0.66 5.33 0.66 5.33 0.66 5.33 0.66 5.33 0.66
Ag Mea 0.00 0.00 0.00 0.00 0.00 0.00 0.00 0.00 0.00 0.00 0.00 0.00 0.00 0.00 6.64 5.93 6.30 5.66 5.72 6.85 10.59 12.92 13.06 12.06 11.82 12.12 12.52 12.55 12.51 12.64 12.60 12.60 12.62 12.47 12.25 12.14 12.03 12.01 12.00 12.00 12.00 12.00 12.00 12.00 12.00 12.00 12.00 12.00 12.00 12.00 12.00 12.00 12.00 12.00 12.00
Tonnes 292,457 292,457 292,457 292,457 292,457 292,457 292,457 292,457 292,457 292,457 292,457 292,457 292,457 292,457 292,457 289,371 280,648 268,607 258,747 248,260 232,972 198,357 166,828 150,518 124,696 103,607 87,993 70,732 60,780 50,851 40,783 36,305 36,305 36,213 32,177 26,539 19,695 11,413 6,471 4,569 3,595 2,180 1,090 139 0 0 0 0 0 0 0 0 0 0 0
Cummulative (descending) Au Mea Cu Mea 5.33 0.66 5.33 0.66 5.33 0.66 5.33 0.66 5.33 0.66 5.33 0.66 5.33 0.66 5.33 0.66 5.33 0.66 5.33 0.66 5.33 0.66 5.33 0.66 5.33 0.66 5.33 0.66 5.33 0.66 5.33 0.66 5.33 0.67 5.33 0.67 5.30 0.68 5.29 0.70 5.19 0.69 5.14 0.68 5.12 0.74 4.98 0.74 4.85 0.77 4.89 0.79 4.92 0.78 5.03 0.75 5.29 0.75 5.42 0.77 5.13 0.73 5.29 0.74 5.29 0.74 5.29 0.74 5.46 0.74 5.64 0.76 5.63 0.79 5.18 0.84 4.12 0.76 3.84 0.71 3.81 0.70 3.80 0.61 3.68 0.51 3.93 0.54 0.00 0.00 0.00 0.00 0.00 0.00 0.00 0.00 0.00 0.00 0.00 0.00 0.00 0.00 0.00 0.00 0.00 0.00 0.00 0.00 0.00 0.00
Ag Mea 12.00 12.00 12.00 12.00 12.00 12.00 12.00 12.00 12.00 12.00 12.00 12.00 12.00 12.00 12.00 12.05 12.25 12.50 12.82 13.11 13.31 12.66 11.30 10.99 11.91 12.31 11.70 10.36 9.87 9.54 8.00 7.72 7.72 7.57 8.16 9.45 10.00 11.05 11.56 11.51 11.37 10.78 9.77 10.28 0.00 0.00 0.00 0.00 0.00 0.00 0.00 0.00 0.00 0.00 0.00
3/27/2003
Willa Deposit Indicated Mineral Resource Estimate Cutoff - 2.5 g/t Au
Total Z 800-810 810-820 820-830 830-840 840-850 850-860 860-870 870-880 880-890 890-900 900-910 910-920 920-930 930-940 940-950 950-960 960-970 970-980 980-990 990-1000 1000-1010 1010-1020 1020-1030 1030-1040 1040-1050 1050-1060 1060-1070 1070-1080 1080-1090 1090-1100 1100-1110 1110-1120 1120-1130 1130-1140 1140-1150 1150-1160 1160-1170 1170-1180 1180-1190 1190-1200 1200-1210 1210-1220 1220-1230 1230-1240 1240-1250 1250-1260 1260-1270 1270-1280 1280-1290 1290-1300 1300-1310 1310-1320 1320-1330 1330-1340 1340-1350 Grand Total
Willa_BM_MR_Report
Volume 0 0 0 0 0 0 0 0 0 0 0 0 48 760 5192 10256 13080 12072 13840 24120 44120 51976 44960 44048 37304 31104 29632 22440 18592 13336 8856 7776 6360 6928 6544 4880 6352 6392 2424 768 1400 816 648 48 0 0 0 0 0 0 0 0 0 0 0 477072
Tonnes 0 0 0 0 0 0 0 0 0 0 0 0 139 2204 15057 29742 37932 35009 40136 69948 127948 150730 130384 127739 108182 90202 85933 65076 53917 38674 25682 22550 18444 20091 18978 14152 18421 18537 7030 2227 4060 2366 1879 139 0 0 0 0 0 0 0 0 0 0 0 1383509
Au Ind Total 0.00 0.00 0.00 0.00 0.00 0.00 0.00 0.00 0.00 0.00 0.00 0.00 2.88 2.71 3.89 4.30 4.25 4.70 4.58 5.17 5.79 5.45 5.25 4.96 4.59 4.25 4.31 4.51 4.15 5.15 4.41 3.50 3.58 4.06 3.90 5.21 5.23 4.05 3.40 3.47 3.63 3.68 3.58 3.93 0.00 0.00 0.00 0.00 0.00 0.00 0.00 0.00 0.00 0.00 0.00 4.79
Indicated Cu Ind Total 0.00 0.00 0.00 0.00 0.00 0.00 0.00 0.00 0.00 0.00 0.00 0.00 0.02 0.21 0.48 0.48 0.56 0.48 0.46 0.63 0.83 0.90 0.74 0.76 0.77 0.81 0.82 0.79 0.75 0.81 0.71 0.72 0.52 0.62 0.68 0.64 0.68 0.65 0.72 0.66 0.78 0.72 0.50 0.54 0.00 0.00 0.00 0.00 0.00 0.00 0.00 0.00 0.00 0.00 0.00 0.74
Ag Ind Total 0.00 0.00 0.00 0.00 0.00 0.00 0.00 0.00 0.00 0.00 0.00 0.00 0.69 3.33 5.55 5.20 5.72 6.08 6.02 7.41 11.20 11.86 8.98 10.86 10.61 11.71 12.34 11.66 11.93 14.70 9.90 9.72 5.47 3.72 5.09 6.87 6.75 5.94 4.43 10.16 11.75 11.23 9.56 10.28 0.00 0.00 0.00 0.00 0.00 0.00 0.00 0.00 0.00 0.00 0.00 9.88
Volume 0 0 0 0 0 0 0 0 0 0 0 0 40 512 3,664 6,624 8,288 6,992 7,776 10,720 19,120 16,936 11,008 15,760 13,056 12,168 14,504 9,712 8,104 6,264 3,648 2,376 2,304 3,568 3,896 3,480 4,312 4,344 1,920 640 880 688 360 48 0 0 0 0 0 0 0 0 0 0 0 203,712
Tonnes 0 0 0 0 0 0 0 0 0 0 0 0 116 1,485 10,626 19,209 24,035 20,277 22,550 31,088 55,448 49,114 31,923 45,704 37,863 35,288 42,062 28,165 23,502 18,165 10,579 6,890 6,682 10,347 11,299 10,092 12,505 12,598 5,568 1,856 2,552 1,995 1,044 139 0 0 0 0 0 0 0 0 0 0 0 590,765
Au Ind
Cu Ind 0.00 0.00 0.00 0.00 0.00 0.00 0.00 0.00 0.00 0.00 0.00 0.00 2.88 2.71 3.49 4.08 4.16 4.45 4.21 4.83 4.55 4.42 4.73 4.46 3.90 3.69 3.54 3.13 3.68 4.96 3.35 2.61 2.44 3.30 3.74 4.80 5.14 4.29 3.38 3.45 3.44 3.49 3.53 3.93 0.00 0.00 0.00 0.00 0.00 0.00 0.00 0.00 0.00 0.00 0.00 4.11
Ag Ind 0.00 0.00 0.00 0.00 0.00 0.00 0.00 0.00 0.00 0.00 0.00 0.00 0.02 0.25 0.48 0.46 0.56 0.43 0.46 0.61 0.73 0.64 0.63 0.57 0.62 0.71 0.72 0.60 0.59 0.76 0.53 0.26 0.42 0.60 0.67 0.66 0.63 0.67 0.72 0.66 0.74 0.65 0.49 0.54 0.00 0.00 0.00 0.00 0.00 0.00 0.00 0.00 0.00 0.00 0.00 0.62
0.00 0.00 0.00 0.00 0.00 0.00 0.00 0.00 0.00 0.00 0.00 0.00 0.69 3.72 5.65 5.20 5.83 5.46 6.43 7.46 13.32 17.98 11.76 7.00 10.18 11.85 12.06 10.36 10.29 13.02 8.07 3.58 5.96 4.30 4.71 6.85 7.14 6.67 4.29 9.67 11.30 10.87 9.38 10.28 0.00 0.00 0.00 0.00 0.00 0.00 0.00 0.00 0.00 0.00 0.00 9.79
Tonnes 0 0 0 0 0 0 0 0 0 0 0 0 116 1,601 12,227 31,436 55,471 75,748 98,298 129,386 184,834 233,948 265,871 311,575 349,438 384,726 426,788 454,953 478,455 496,620 507,199 514,089 520,771 531,118 542,417 552,509 565,014 577,612 583,180 585,036 587,588 589,583 590,627 590,766 590,766 590,766 590,766 590,766 590,766 590,766 590,766 590,766 590,766 590,766 590,766
Cummulative (ascending) Au Mea Cu Mea 0.00 0.00 0.00 0.00 0.00 0.00 0.00 0.00 0.00 0.00 0.00 0.00 0.00 0.00 0.00 0.00 0.00 0.00 0.00 0.00 0.00 0.00 0.00 0.00 2.88 0.02 2.72 0.23 3.39 0.45 3.81 0.46 3.96 0.50 4.09 0.48 4.12 0.48 4.29 0.51 4.37 0.58 4.38 0.59 4.42 0.59 4.42 0.59 4.37 0.59 4.31 0.60 4.23 0.62 4.16 0.61 4.14 0.61 4.17 0.62 4.15 0.62 4.13 0.61 4.11 0.61 4.09 0.61 4.09 0.61 4.10 0.61 4.12 0.61 4.13 0.61 4.12 0.61 4.12 0.61 4.11 0.62 4.11 0.62 4.11 0.62 4.11 0.62 4.11 0.62 4.11 0.62 4.11 0.62 4.11 0.62 4.11 0.62 4.11 0.62 4.11 0.62 4.11 0.62 4.11 0.62 4.11 0.62 4.11 0.62
Ag Mea 0.00 0.00 0.00 0.00 0.00 0.00 0.00 0.00 0.00 0.00 0.00 0.00 0.69 3.50 5.37 5.27 5.51 5.50 5.71 6.13 8.29 10.32 10.49 9.98 10.00 10.17 10.36 10.36 10.36 10.45 10.40 10.31 10.26 10.14 10.03 9.97 9.91 9.84 9.78 9.78 9.79 9.79 9.79 9.79 9.79 9.79 9.79 9.79 9.79 9.79 9.79 9.79 9.79 9.79 9.79
Tonnes 590,766 590,766 590,766 590,766 590,766 590,766 590,766 590,766 590,766 590,766 590,766 590,766 590,766 590,650 589,165 578,539 559,330 535,295 515,018 492,468 461,380 405,932 356,818 324,895 279,191 241,328 206,040 163,978 135,813 112,311 94,146 83,567 76,677 69,995 59,648 48,349 38,257 25,752 13,154 7,586 5,730 3,178 1,183 139 0 0 0 0 0 0 0 0 0 0 0
Cummulative (descending) Au Mea Cu Mea 4.11 0.62 4.11 0.62 4.11 0.62 4.11 0.62 4.11 0.62 4.11 0.62 4.11 0.62 4.11 0.62 4.11 0.62 4.11 0.62 4.11 0.62 4.11 0.62 4.11 0.62 4.11 0.62 4.11 0.62 4.13 0.62 4.13 0.62 4.13 0.63 4.11 0.63 4.11 0.64 4.06 0.64 3.99 0.63 3.94 0.63 3.86 0.63 3.76 0.64 3.74 0.65 3.75 0.64 3.80 0.61 3.94 0.62 3.99 0.62 3.80 0.60 3.86 0.60 3.97 0.63 4.12 0.66 4.26 0.67 4.38 0.66 4.28 0.66 3.85 0.68 3.44 0.68 3.48 0.66 3.49 0.66 3.53 0.59 3.58 0.49 3.93 0.54 0.00 0.00 0.00 0.00 0.00 0.00 0.00 0.00 0.00 0.00 0.00 0.00 0.00 0.00 0.00 0.00 0.00 0.00 0.00 0.00 0.00 0.00
Ag Mea 9.79 9.79 9.79 9.79 9.79 9.79 9.79 9.79 9.79 9.79 9.79 9.79 9.79 9.79 9.81 9.89 10.05 10.24 10.42 10.61 10.82 10.48 9.44 9.22 9.58 9.49 9.08 8.32 7.89 7.39 6.31 6.08 6.31 6.34 6.69 7.16 7.24 7.28 7.87 10.50 10.78 10.35 9.49 10.28 0.00 0.00 0.00 0.00 0.00 0.00 0.00 0.00 0.00 0.00 0.00
3/27/2003
Willa Deposit Indicated Mineral Resource Estimate Cutoff - 1.5 g/t Au
Total Z 800-810 810-820 820-830 830-840 840-850 850-860 860-870 870-880 880-890 890-900 900-910 910-920 920-930 930-940 940-950 950-960 960-970 970-980 980-990 990-1000 1000-1010 1010-1020 1020-1030 1030-1040 1040-1050 1050-1060 1060-1070 1070-1080 1080-1090 1090-1100 1100-1110 1110-1120 1120-1130 1130-1140 1140-1150 1150-1160 1160-1170 1170-1180 1180-1190 1190-1200 1200-1210 1210-1220 1220-1230 1230-1240 1240-1250 1250-1260 1260-1270 1270-1280 1280-1290 1290-1300 1300-1310 1310-1320 1320-1330 1330-1340 1340-1350 Grand Total
Willa_BM_MR_Report
Volume 0 0 0 0 0 0 0 0 0 400 0 32 3,440 6,512 15,424 23,048 24,928 27,600 35,608 50,568 62,824 75,720 76,888 72,096 65,464 60,480 57,152 46,616 39,088 27,392 19,800 18,552 18,832 20,544 18,640 10,128 12,128 13,208 7,080 3,712 3,656 3,568 2,592 552 288 144 0 0 0 0 0 0 0 0 0 924,704
Tonnes 0 0 0 0 0 0 0 0 0 1,160 0 93 9,976 18,885 44,730 66,839 72,291 80,040 103,263 146,647 182,190 219,588 222,975 209,078 189,846 175,392 165,741 135,186 113,355 79,437 57,420 53,801 54,613 59,578 54,056 29,371 35,171 38,303 20,532 10,765 10,602 10,347 7,517 1,601 835 418 0 0 0 0 0 0 0 0 0 2,681,642
Au Ind Total 0.00 0.00 0.00 0.00 0.00 0.00 0.00 0.00 0.00 1.90 0.00 1.78 1.74 1.94 2.59 2.98 3.14 3.12 2.93 3.46 4.65 4.35 3.89 3.80 3.46 3.13 3.19 3.18 2.99 3.49 3.03 2.58 2.49 2.64 2.61 3.45 3.65 2.98 2.53 2.37 2.59 2.24 2.25 1.91 1.96 2.00 0.00 0.00 0.00 0.00 0.00 0.00 0.00 0.00 0.00 3.41
Indicated Cu Ind Total 0.00 0.00 0.00 0.00 0.00 0.00 0.00 0.00 0.00 0.33 0.00 0.18 0.20 0.26 0.38 0.36 0.44 0.42 0.41 0.51 0.74 0.82 0.62 0.64 0.64 0.63 0.67 0.62 0.61 0.63 0.57 0.59 0.44 0.48 0.52 0.53 0.53 0.49 0.62 0.78 0.66 0.55 0.28 0.22 0.00 0.00 0.00 0.00 0.00 0.00 0.00 0.00 0.00 0.00 0.00 0.60
Ag Ind Total 0.00 0.00 0.00 0.00 0.00 0.00 0.00 0.00 0.00 10.40 0.00 1.03 1.71 2.83 4.24 3.82 4.41 4.90 4.67 5.43 9.41 13.50 7.53 8.93 8.92 9.17 9.87 8.93 9.69 11.03 8.76 8.45 4.05 2.72 3.35 6.00 5.16 3.53 2.54 5.33 9.33 9.86 9.41 12.09 1.97 2.00 0.00 0.00 0.00 0.00 0.00 0.00 0.00 0.00 0.00 7.94
Volume 0 0 0 0 0 0 0 0 0 304 0 32 2,896 4,752 10,944 15,664 16,680 17,376 20,352 24,592 29,672 26,480 22,200 27,264 26,392 27,832 30,936 24,528 18,808 13,568 8,752 7,536 9,928 13,104 11,976 7,216 8,496 9,288 5,624 2,904 2,480 2,664 1,872 520 280 144 0 0 0 0 0 0 0 0 0 454,056
Tonnes 0 0 0 0 0 0 0 0 0 882 0 93 8,398 13,781 31,738 45,425 48,372 50,390 59,021 71,317 86,049 76,792 64,380 79,065 76,537 80,713 89,715 71,131 54,543 39,347 25,381 21,855 28,791 38,002 34,730 20,926 24,638 26,935 16,310 8,422 7,192 7,725 5,429 1,508 812 418 0 0 0 0 0 0 0 0 0 1,316,763
Au Ind
Cu Ind 0.00 0.00 0.00 0.00 0.00 0.00 0.00 0.00 0.00 1.90 0.00 1.78 1.74 1.92 2.45 2.83 3.03 2.93 2.78 3.17 3.63 3.51 3.35 3.41 2.93 2.71 2.72 2.42 2.69 3.32 2.53 2.16 2.05 2.30 2.52 3.25 3.56 3.06 2.53 2.40 2.47 2.29 2.13 1.91 1.96 2.00 0.00 0.00 0.00 0.00 0.00 0.00 0.00 0.00 0.00 2.91
Ag Ind 0.00 0.00 0.00 0.00 0.00 0.00 0.00 0.00 0.00 0.33 0.00 0.18 0.20 0.27 0.36 0.36 0.43 0.40 0.40 0.47 0.65 0.71 0.53 0.51 0.53 0.56 0.57 0.50 0.52 0.60 0.50 0.41 0.40 0.45 0.52 0.53 0.50 0.50 0.63 0.78 0.68 0.50 0.27 0.22 0.00 0.00 0.00 0.00 0.00 0.00 0.00 0.00 0.00 0.00 0.00 0.51
0.00 0.00 0.00 0.00 0.00 0.00 0.00 0.00 0.00 10.40 0.00 1.03 1.77 2.99 4.22 3.85 4.41 4.74 4.81 5.50 10.69 8.80 9.13 6.96 9.20 8.92 9.06 7.82 8.63 10.34 8.48 6.59 4.13 3.16 3.21 5.57 5.46 3.94 2.54 5.15 9.05 9.16 8.81 12.48 1.97 2.00 0.00 0.00 0.00 0.00 0.00 0.00 0.00 0.00 0.00 7.05
Tonnes 0 0 0 0 0 0 0 0 0 882 882 975 9,373 23,154 54,892 100,317 148,689 199,079 258,100 329,417 415,466 492,258 556,638 635,703 712,240 792,953 882,668 953,799 1,008,342 1,047,689 1,073,070 1,094,925 1,123,716 1,161,718 1,196,448 1,217,374 1,242,012 1,268,947 1,285,257 1,293,679 1,300,871 1,308,596 1,314,025 1,315,533 1,316,345 1,316,763 1,316,763 1,316,763 1,316,763 1,316,763 1,316,763 1,316,763 1,316,763 1,316,763 1,316,763
Cummulative (ascending) Au Mea Cu Mea 0.00 0.00 0.00 0.00 0.00 0.00 0.00 0.00 0.00 0.00 0.00 0.00 0.00 0.00 0.00 0.00 0.00 0.00 1.90 0.33 1.90 0.33 1.89 0.32 1.75 0.21 1.85 0.25 2.20 0.31 2.49 0.33 2.66 0.37 2.73 0.38 2.74 0.38 2.84 0.40 3.00 0.45 3.08 0.49 3.11 0.50 3.15 0.50 3.12 0.50 3.08 0.51 3.05 0.51 3.00 0.51 2.98 0.51 2.99 0.52 2.98 0.51 2.97 0.51 2.94 0.51 2.92 0.51 2.91 0.51 2.92 0.51 2.93 0.51 2.93 0.51 2.93 0.51 2.92 0.51 2.92 0.51 2.92 0.51 2.91 0.51 2.91 0.51 2.91 0.51 2.91 0.51 2.91 0.51 2.91 0.51 2.91 0.51 2.91 0.51 2.91 0.51 2.91 0.51 2.91 0.51 2.91 0.51 2.91 0.51
Ag Mea 0.00 0.00 0.00 0.00 0.00 0.00 0.00 0.00 0.00 10.40 10.40 9.51 2.57 2.82 3.63 3.73 3.95 4.15 4.30 4.56 5.83 6.29 6.62 6.66 6.94 7.14 7.33 7.37 7.44 7.55 7.57 7.55 7.46 7.32 7.20 7.17 7.14 7.07 7.02 7.00 7.01 7.03 7.03 7.04 7.04 7.04 7.04 7.04 7.04 7.04 7.04 7.04 7.04 7.04 7.04
Tonnes 1,316,763 1,316,763 1,316,763 1,316,763 1,316,763 1,316,763 1,316,763 1,316,763 1,316,763 1,316,763 1,315,881 1,315,881 1,315,788 1,307,390 1,293,609 1,261,871 1,216,446 1,168,074 1,117,684 1,058,663 987,346 901,297 824,505 760,125 681,060 604,523 523,810 434,095 362,964 308,421 269,074 243,693 221,838 193,047 155,045 120,315 99,389 74,751 47,816 31,506 23,084 15,892 8,167 2,738 1,230 418 0 0 0 0 0 0 0 0 0
Cummulative (descending) Au Mea Cu Mea 2.91 0.51 2.91 0.51 2.91 0.51 2.91 0.51 2.91 0.51 2.91 0.51 2.91 0.51 2.91 0.51 2.91 0.51 2.91 0.51 2.91 0.51 2.91 0.51 2.91 0.51 2.92 0.51 2.93 0.52 2.94 0.52 2.95 0.53 2.94 0.53 2.94 0.53 2.95 0.54 2.94 0.55 2.87 0.54 2.81 0.52 2.77 0.52 2.69 0.52 2.66 0.52 2.66 0.52 2.64 0.51 2.68 0.51 2.68 0.51 2.59 0.49 2.60 0.49 2.64 0.50 2.73 0.52 2.83 0.53 2.92 0.54 2.86 0.54 2.63 0.55 2.38 0.57 2.30 0.54 2.27 0.46 2.18 0.36 2.07 0.22 1.94 0.12 1.97 0.00 2.00 0.00 0.00 0.00 0.00 0.00 0.00 0.00 0.00 0.00 0.00 0.00 0.00 0.00 0.00 0.00 0.00 0.00 0.00 0.00
Ag Mea 7.04 7.04 7.04 7.04 7.04 7.04 7.04 7.04 7.04 7.04 7.03 7.03 7.03 7.07 7.11 7.18 7.31 7.43 7.55 7.70 7.86 7.59 7.48 7.34 7.38 7.15 6.88 6.43 6.16 5.72 5.04 4.68 4.49 4.55 4.89 5.38 5.34 5.29 6.06 7.88 8.88 8.80 8.46 7.76 1.98 2.00 0.00 0.00 0.00 0.00 0.00 0.00 0.00 0.00 0.00
3/27/2003
Willa Deposit Inferred Mineral Resource Estimate Cutoff - 3.5 g/t Au
Total Z 800-810 810-820 820-830 830-840 840-850 850-860 860-870 870-880 880-890 890-900 900-910 910-920 920-930 930-940 940-950 950-960 960-970 970-980 980-990 990-1000 1000-1010 1010-1020 1020-1030 1030-1040 1040-1050 1050-1060 1060-1070 1070-1080 1080-1090 1090-1100 1100-1110 1110-1120 1120-1130 1130-1140 1140-1150 1150-1160 1160-1170 1170-1180 1180-1190 1190-1200 1200-1210 1210-1220 1220-1230 1230-1240 1240-1250 1250-1260 1260-1270 1270-1280 1280-1290 1290-1300 1300-1310 1310-1320 1320-1330 1330-1340 1340-1350 Grand Total
Willa_BM_MR_Report
Volume 0 0 0 0 0 0 0 0 0 0 0 0 0 848 1,952 7,992 10,976 7,800 7,984 14,624 33,128 42,448 35,968 34,624 30,976 21,928 15,920 12,088 11,720 10,816 5,232 2,288 2,512 3,368 3,136 4,648 7,952 6,408 2,488 656 848 464 904 208 0 0 0 0 0 0 0 0 0 0 0 342,904
Tonnes 0 0 0 0 0 0 0 0 0 0 0 0 0 2,459 5,661 23,177 31,830 22,620 23,154 42,410 96,071 123,099 104,307 100,410 89,830 63,591 46,168 35,055 33,988 31,366 15,173 6,635 7,285 9,767 9,094 13,479 23,061 18,583 7,215 1,902 2,459 1,346 2,622 603 0 0 0 0 0 0 0 0 0 0 0 994,422
Au Inf Calc 0.00 0.00 0.00 0.00 0.00 0.00 0.00 0.00 0.00 0.00 0.00 0.00 0.00 5.58 5.74 5.30 5.20 5.88 5.89 6.53 6.93 7.25 7.61 6.77 6.01 5.58 5.66 5.77 5.16 5.77 5.46 4.61 4.74 5.16 4.64 5.71 6.02 6.23 5.36 3.90 3.87 3.87 3.86 3.83 0.00 0.00 0.00 0.00 0.00 0.00 0.00 0.00 0.00 0.00 0.00 6.31
Inferred Cu Inf Calc 0.00 0.00 0.00 0.00 0.00 0.00 0.00 0.00 0.00 0.00 0.00 0.00 0.00 0.27 0.51 0.49 0.49 0.38 0.46 0.70 0.87 0.91 0.82 0.84 0.83 0.88 0.99 0.94 0.76 0.80 0.87 0.83 0.64 0.67 0.57 0.52 0.63 0.77 0.84 0.78 0.72 0.83 0.67 0.53 0.00 0.00 0.00 0.00 0.00 0.00 0.00 0.00 0.00 0.00 0.00 0.79
Ag Inf Calc 0.00 0.00 0.00 0.00 0.00 0.00 0.00 0.00 0.00 0.00 0.00 0.00 0.00 3.00 5.87 5.49 5.04 5.08 6.33 9.42 12.61 11.40 8.93 10.16 11.42 13.77 16.85 14.22 12.18 14.76 12.35 11.16 9.13 4.34 3.67 7.11 9.88 11.59 10.43 11.88 11.90 12.61 10.80 10.14 0.00 0.00 0.00 0.00 0.00 0.00 0.00 0.00 0.00 0.00 0.00 10.79
Volume 0 0 0 0 0 0 0 0 0 0 0 0 0 848 408 2,912 4,096 1,320 760 1,608 2,976 6,928 9,808 7,392 8,936 6,824 928 992 2,504 2,960 688 0 536 0 0 1,040 3,432 4,176 1,680 208 0 0 424 160 0 0 0 0 0 0 0 0 0 0 0 74,544
Tonnes 0 0 0 0 0 0 0 0 0 0 0 0 0 2,459 1,183 8,445 11,878 3,828 2,204 4,664 8,630 20,091 28,443 21,437 25,914 19,789 2,691 2,877 7,262 8,584 1,995 0 1,555 0 0 3,016 9,953 12,110 4,872 603 0 0 1,230 464 0 0 0 0 0 0 0 0 0 0 0 216,177
Au Inf 0.00 0.00 0.00 0.00 0.00 0.00 0.00 0.00 0.00 0.00 0.00 0.00 0.00 5.58 3.20 4.62 4.78 4.11 4.37 2.16 5.41 10.58 9.48 8.87 6.73 5.43 5.66 2.30 4.39 3.28 3.15 0.00 3.86 0.00 0.00 4.67 5.85 6.21 5.61 3.99 0.00 0.00 3.98 3.80 0.00 0.00 0.00 0.00 0.00 0.00 0.00 0.00 0.00 0.00 0.00 6.55
Cu Inf
Ag Inf 0.00 0.00 0.00 0.00 0.00 0.00 0.00 0.00 0.00 0.00 0.00 0.00 0.00 0.27 0.55 0.51 0.30 0.04 0.59 0.25 0.37 0.67 0.79 0.72 0.67 0.55 0.73 0.40 0.38 0.31 0.71 0.00 1.02 0.00 0.00 0.09 0.46 0.68 0.81 0.89 0.00 0.00 0.84 0.53 0.00 0.00 0.00 0.00 0.00 0.00 0.00 0.00 0.00 0.00 0.00 0.57
0.00 0.00 0.00 0.00 0.00 0.00 0.00 0.00 0.00 0.00 0.00 0.00 0.00 3.00 3.75 4.91 2.39 1.01 11.84 7.96 5.01 2.94 5.04 3.86 9.89 11.14 34.46 8.63 6.22 7.09 16.25 0.00 14.18 0.00 0.00 4.61 12.61 12.28 9.80 11.10 0.00 0.00 11.81 10.10 0.00 0.00 0.00 0.00 0.00 0.00 0.00 0.00 0.00 0.00 0.00 7.32
Tonnes 0 0 0 0 0 0 0 0 0 0 0 0 0 2,459 3,642 12,087 23,965 27,793 29,997 34,661 43,291 63,382 91,825 113,262 139,176 158,965 161,656 164,533 171,795 180,379 182,374 182,374 183,929 183,929 183,929 186,945 196,898 209,008 213,880 214,483 214,483 214,483 215,713 216,177 216,177 216,177 216,177 216,177 216,177 216,177 216,177 216,177 216,177 216,177 216,177
Cummulative (ascending) Au Mea Cu Mea 0.00 0.00 0.00 0.00 0.00 0.00 0.00 0.00 0.00 0.00 0.00 0.00 0.00 0.00 0.00 0.00 0.00 0.00 0.00 0.00 0.00 0.00 0.00 0.00 0.00 0.00 5.58 0.27 4.81 0.36 4.68 0.47 4.73 0.38 4.64 0.34 4.62 0.35 4.29 0.34 4.51 0.35 6.44 0.45 7.38 0.55 7.66 0.59 7.49 0.60 7.23 0.60 7.20 0.60 7.12 0.59 7.00 0.59 6.83 0.57 6.79 0.57 6.79 0.57 6.76 0.58 6.76 0.58 6.76 0.58 6.73 0.57 6.68 0.56 6.66 0.57 6.63 0.58 6.62 0.58 6.62 0.58 6.62 0.58 6.61 0.58 6.60 0.58 6.60 0.58 6.60 0.58 6.60 0.58 6.60 0.58 6.60 0.58 6.60 0.58 6.60 0.58 6.60 0.58 6.60 0.58 6.60 0.58 6.60 0.58
Ag Mea 0.00 0.00 0.00 0.00 0.00 0.00 0.00 0.00 0.00 0.00 0.00 0.00 0.00 3.00 3.24 4.41 3.41 3.08 3.72 4.29 4.43 3.96 4.29 4.21 5.27 6.00 6.47 6.51 6.50 6.53 6.63 6.63 6.70 6.70 6.70 6.66 6.96 7.27 7.33 7.34 7.34 7.34 7.37 7.37 7.37 7.37 7.37 7.37 7.37 7.37 7.37 7.37 7.37 7.37 7.37
Tonnes 216,177 216,177 216,177 216,177 216,177 216,177 216,177 216,177 216,177 216,177 216,177 216,177 216,177 216,177 213,718 212,535 204,090 192,212 188,384 186,180 181,516 172,886 152,795 124,352 102,915 77,001 57,212 54,521 51,644 44,382 35,798 33,803 33,803 32,248 32,248 32,248 29,232 19,279 7,169 2,297 1,694 1,694 1,694 464 0 0 0 0 0 0 0 0 0 0 0
Cummulative (descending) Au Mea Cu Mea 6.60 0.58 6.60 0.58 6.60 0.58 6.60 0.58 6.60 0.58 6.60 0.58 6.60 0.58 6.60 0.58 6.60 0.58 6.60 0.58 6.60 0.58 6.60 0.58 6.60 0.58 6.60 0.58 6.61 0.58 6.63 0.58 6.72 0.59 6.84 0.60 6.89 0.61 6.92 0.61 7.04 0.62 7.13 0.64 6.67 0.63 6.03 0.60 5.44 0.57 5.01 0.54 4.86 0.53 4.82 0.52 4.96 0.53 5.06 0.55 5.48 0.61 5.62 0.60 5.62 0.60 5.70 0.58 5.70 0.58 5.70 0.58 5.81 0.64 5.79 0.73 5.08 0.80 3.95 0.79 3.93 0.75 3.93 0.75 3.93 0.75 3.80 0.53 0.00 0.00 0.00 0.00 0.00 0.00 0.00 0.00 0.00 0.00 0.00 0.00 0.00 0.00 0.00 0.00 0.00 0.00 0.00 0.00 0.00 0.00
Ag Mea 7.37 7.37 7.37 7.37 7.37 7.37 7.37 7.37 7.37 7.37 7.37 7.37 7.37 7.37 7.42 7.44 7.55 7.87 8.00 7.96 7.96 8.11 8.79 9.64 10.85 11.17 11.18 10.03 10.11 10.75 11.63 11.35 11.35 11.22 11.22 11.22 11.90 11.53 10.27 11.28 11.34 11.34 11.34 10.10 0.00 0.00 0.00 0.00 0.00 0.00 0.00 0.00 0.00 0.00 0.00
3/27/2003
Willa Deposit Inferred Mineral Resource Estimate Cutoff - 2.5 g/t Au
Total Z 800-810 810-820 820-830 830-840 840-850 850-860 860-870 870-880 880-890 890-900 900-910 910-920 920-930 930-940 940-950 950-960 960-970 970-980 980-990 990-1000 1000-1010 1010-1020 1020-1030 1030-1040 1040-1050 1050-1060 1060-1070 1070-1080 1080-1090 1090-1100 1100-1110 1110-1120 1120-1130 1130-1140 1140-1150 1150-1160 1160-1170 1170-1180 1180-1190 1190-1200 1200-1210 1210-1220 1220-1230 1230-1240 1240-1250 1250-1260 1260-1270 1270-1280 1280-1290 1290-1300 1300-1310 1310-1320 1320-1330 1330-1340 1340-1350 Grand Total
Willa_BM_MR_Report
Volume 0 0 0 0 0 0 0 0 0 0 0 0 16 2,224 9,664 16,088 20,520 15,336 17,760 29,176 51,208 64,224 56,240 53,208 49,752 39,952 33,384 27,560 26,040 22,168 13,104 9,536 8,680 9,392 8,776 9,688 12,296 12,784 4,992 2,056 1,856 1,664 1,656 232 0 0 0 0 0 0 0 0 0 0 0 631,232
Tonnes 0 0 0 0 0 0 0 0 0 0 0 0 46 6,450 28,026 46,655 59,508 44,474 51,504 84,610 148,503 186,250 163,096 154,303 144,281 115,861 96,814 79,924 75,516 64,287 38,002 27,654 25,172 27,237 25,450 28,095 35,658 37,074 14,477 5,962 5,382 4,826 4,802 673 0 0 0 0 0 0 0 0 0 0 0 1,830,573
Au Inf Calc 0.00 0.00 0.00 0.00 0.00 0.00 0.00 0.00 0.00 0.00 0.00 0.00 2.74 3.78 3.42 4.10 4.14 4.44 4.29 4.74 5.53 5.79 5.92 5.44 4.85 4.38 4.23 4.19 3.95 4.32 3.95 3.34 3.45 3.72 3.53 4.24 4.93 4.55 4.04 3.21 3.36 3.20 3.48 3.78 0.00 0.00 0.00 0.00 0.00 0.00 0.00 0.00 0.00 0.00 0.00 4.77
Inferred Cu Inf Calc 0.00 0.00 0.00 0.00 0.00 0.00 0.00 0.00 0.00 0.00 0.00 0.00 0.24 0.27 0.51 0.46 0.50 0.44 0.46 0.58 0.75 0.82 0.72 0.74 0.73 0.75 0.79 0.72 0.66 0.65 0.65 0.66 0.57 0.60 0.59 0.56 0.59 0.63 0.70 0.68 0.67 0.66 0.62 0.53 0.00 0.00 0.00 0.00 0.00 0.00 0.00 0.00 0.00 0.00 0.00 0.68
Ag Inf Calc 0.00 0.00 0.00 0.00 0.00 0.00 0.00 0.00 0.00 0.00 0.00 0.00 2.40 3.63 5.64 4.99 5.14 5.82 6.31 7.19 10.41 10.34 8.10 9.65 10.16 11.57 12.96 11.06 10.60 12.22 9.39 9.67 7.50 4.41 4.53 5.67 8.19 8.35 7.77 7.01 10.82 10.35 10.19 10.06 0.00 0.00 0.00 0.00 0.00 0.00 0.00 0.00 0.00 0.00 0.00 9.21
Volume 0 0 0 0 0 0 0 0 0 0 0 0 0 1,464 4,472 5,832 7,440 3,264 3,920 5,056 7,088 12,248 11,280 9,160 12,448 8,848 3,752 5,120 7,448 8,832 4,248 1,760 2,320 2,464 2,232 4,808 5,944 6,392 2,568 1,288 456 848 1,008 184 0 0 0 0 0 0 0 0 0 0 0 154,192
Tonnes 0 0 0 0 0 0 0 0 0 0 0 0 0 4,246 12,969 16,913 21,576 9,465 11,368 14,662 20,555 35,520 32,712 26,564 36,099 25,659 10,881 14,848 21,599 25,613 12,320 5,104 6,728 7,146 6,472 13,943 17,237 18,537 7,447 3,735 1,322 2,460 2,923 534 0 0 0 0 0 0 0 0 0 0 0 447,157
Au Inf
Cu Inf 0.00 0.00 0.00 0.00 0.00 0.00 0.00 0.00 0.00 0.00 0.00 0.00 0.00 4.34 2.87 3.75 3.95 3.48 3.27 2.69 3.91 7.23 8.59 7.75 5.63 4.84 3.60 2.79 3.45 3.07 2.99 2.63 3.09 2.76 2.45 3.26 4.61 5.05 4.64 3.05 2.53 2.74 3.42 3.74 0.00 0.00 0.00 0.00 0.00 0.00 0.00 0.00 0.00 0.00 0.00 4.71
Ag Inf 0.00 0.00 0.00 0.00 0.00 0.00 0.00 0.00 0.00 0.00 0.00 0.00 0.00 0.29 0.54 0.43 0.40 0.26 0.46 0.32 0.19 0.47 0.67 0.64 0.60 0.55 0.48 0.43 0.44 0.40 0.51 0.43 0.70 0.56 0.32 0.47 0.49 0.61 0.68 0.68 0.34 0.60 0.69 0.53 0.00 0.00 0.00 0.00 0.00 0.00 0.00 0.00 0.00 0.00 0.00 0.49
0.00 0.00 0.00 0.00 0.00 0.00 0.00 0.00 0.00 0.00 0.00 0.00 0.00 3.79 5.74 4.62 4.12 4.86 7.33 6.14 5.49 3.89 4.59 3.83 8.81 11.08 17.86 8.43 7.28 8.48 8.33 9.45 13.07 6.35 2.89 4.45 9.73 10.76 10.92 5.13 7.96 9.50 10.59 10.00 0.00 0.00 0.00 0.00 0.00 0.00 0.00 0.00 0.00 0.00 0.00 7.14
Tonnes 0 0 0 0 0 0 0 0 0 0 0 0 0 4,246 17,215 34,128 55,704 65,169 76,537 91,199 111,754 147,274 179,986 206,550 242,649 268,308 279,189 294,037 315,636 341,249 353,569 358,673 365,401 372,547 379,019 392,962 410,199 428,736 436,183 439,918 441,240 443,700 446,623 447,157 447,157 447,157 447,157 447,157 447,157 447,157 447,157 447,157 447,157 447,157 447,157
Cummulative (ascending) Au Mea Cu Mea 0.00 0.00 0.00 0.00 0.00 0.00 0.00 0.00 0.00 0.00 0.00 0.00 0.00 0.00 0.00 0.00 0.00 0.00 0.00 0.00 0.00 0.00 0.00 0.00 0.00 0.00 4.34 0.29 3.23 0.48 3.49 0.45 3.67 0.43 3.64 0.41 3.58 0.42 3.44 0.40 3.53 0.36 4.42 0.39 5.18 0.44 5.51 0.46 5.53 0.48 5.46 0.49 5.39 0.49 5.26 0.49 5.13 0.48 4.98 0.48 4.91 0.48 4.88 0.48 4.84 0.48 4.80 0.48 4.76 0.48 4.71 0.48 4.71 0.48 4.72 0.49 4.72 0.49 4.71 0.49 4.70 0.49 4.69 0.49 4.68 0.49 4.68 0.49 4.68 0.49 4.68 0.49 4.68 0.49 4.68 0.49 4.68 0.49 4.68 0.49 4.68 0.49 4.68 0.49 4.68 0.49 4.68 0.49 4.68 0.49
Ag Mea 0.00 0.00 0.00 0.00 0.00 0.00 0.00 0.00 0.00 0.00 0.00 0.00 0.00 3.79 5.26 4.94 4.62 4.66 5.06 5.23 5.28 4.94 4.88 4.75 5.35 5.90 6.36 6.47 6.52 6.67 6.73 6.77 6.88 6.87 6.80 6.72 6.85 7.02 7.08 7.07 7.07 7.08 7.11 7.11 7.11 7.11 7.11 7.11 7.11 7.11 7.11 7.11 7.11 7.11 7.11
Tonnes 447,157 447,157 447,157 447,157 447,157 447,157 447,157 447,157 447,157 447,157 447,157 447,157 447,157 447,157 442,911 429,942 413,029 391,453 381,988 370,620 355,958 335,403 299,883 267,171 240,607 204,508 178,849 167,968 153,120 131,521 105,908 93,588 88,484 81,756 74,610 68,138 54,195 36,958 18,421 10,974 7,239 5,917 3,457 534 0 0 0 0 0 0 0 0 0 0 0
Cummulative (descending) Au Mea Cu Mea 4.68 0.49 4.68 0.49 4.68 0.49 4.68 0.49 4.68 0.49 4.68 0.49 4.68 0.49 4.68 0.49 4.68 0.49 4.68 0.49 4.68 0.49 4.68 0.49 4.68 0.49 4.68 0.49 4.68 0.49 4.74 0.49 4.78 0.50 4.82 0.50 4.86 0.51 4.90 0.51 5.00 0.52 5.06 0.54 4.81 0.54 4.34 0.53 3.97 0.52 3.67 0.50 3.50 0.50 3.50 0.50 3.57 0.50 3.59 0.51 3.71 0.54 3.81 0.55 3.88 0.55 3.94 0.54 4.05 0.54 4.20 0.56 4.45 0.58 4.37 0.62 3.69 0.64 3.05 0.62 3.05 0.58 3.16 0.64 3.47 0.67 3.74 0.53 0.00 0.00 0.00 0.00 0.00 0.00 0.00 0.00 0.00 0.00 0.00 0.00 0.00 0.00 0.00 0.00 0.00 0.00 0.00 0.00 0.00 0.00
Ag Mea 7.11 7.11 7.11 7.11 7.11 7.11 7.11 7.11 7.11 7.11 7.11 7.11 7.11 7.11 7.14 7.18 7.29 7.46 7.53 7.53 7.59 7.72 8.17 8.61 9.14 9.20 8.93 8.35 8.34 8.51 8.52 8.55 8.50 8.12 8.29 8.81 9.92 10.02 9.27 8.15 9.70 10.09 10.50 10.00 0.00 0.00 0.00 0.00 0.00 0.00 0.00 0.00 0.00 0.00 0.00
3/27/2003
Willa Deposit Inferred Mineral Resource Estimate Cutoff - 1.5 g/t Au
Total Z 800-810 810-820 820-830 830-840 840-850 850-860 860-870 870-880 880-890 890-900 900-910 910-920 920-930 930-940 940-950 950-960 960-970 970-980 980-990 990-1000 1000-1010 1010-1020 1020-1030 1030-1040 1040-1050 1050-1060 1060-1070 1070-1080 1080-1090 1090-1100 1100-1110 1110-1120 1120-1130 1130-1140 1140-1150 1150-1160 1160-1170 1170-1180 1180-1190 1190-1200 1200-1210 1210-1220 1220-1230 1230-1240 1240-1250 1250-1260 1260-1270 1270-1280 1280-1290 1290-1300 1300-1310 1310-1320 1320-1330 1330-1340 1340-1350 Grand Total
Willa_BM_MR_Report
Volume 0 0 0 0 0 0 0 0 40 992 384 4,640 9,696 17,848 30,056 40,912 44,912 41,712 52,408 67,408 80,272 95,816 94,368 86,216 86,352 79,408 77,360 71,952 62,256 48,024 31,488 27,008 28,512 34,728 28,616 25,184 25,952 27,160 17,104 9,768 8,168 7,776 4,856 2,824 1,920 1,352 240 0 0 0 0 0 0 0 0 1,375,688
Tonnes 0 0 0 0 0 0 0 0 116 2,877 1,114 13,456 28,118 51,759 87,162 118,645 130,245 120,965 151,983 195,483 232,789 277,866 273,667 250,026 250,421 230,283 224,344 208,661 180,542 139,270 91,315 78,323 82,685 100,711 82,986 73,034 75,261 78,764 49,602 28,327 23,687 22,550 14,082 8,190 5,568 3,921 696 0 0 0 0 0 0 0 0 3,989,495
Au Inf Calc 0.00 0.00 0.00 0.00 0.00 0.00 0.00 0.00 1.90 1.85 1.67 1.63 1.72 2.14 2.42 2.77 2.93 2.82 2.69 3.13 4.22 4.53 4.32 4.10 3.62 3.16 2.93 2.79 2.77 3.05 2.77 2.43 2.38 2.41 2.41 2.82 3.31 3.17 2.61 2.24 2.19 2.11 2.38 1.98 1.93 1.98 2.00 0.00 0.00 0.00 0.00 0.00 0.00 0.00 0.00 3.23
Inferred Cu Inf Calc 0.00 0.00 0.00 0.00 0.00 0.00 0.00 0.00 0.33 0.32 0.23 0.19 0.23 0.30 0.38 0.35 0.41 0.40 0.39 0.45 0.62 0.73 0.60 0.62 0.61 0.59 0.59 0.53 0.51 0.54 0.53 0.52 0.44 0.45 0.48 0.48 0.46 0.48 0.54 0.60 0.51 0.48 0.47 0.21 0.02 0.00 0.00 0.00 0.00 0.00 0.00 0.00 0.00 0.00 0.00 0.53
Ag Inf Calc 0.00 0.00 0.00 0.00 0.00 0.00 0.00 0.00 10.40 10.18 3.91 1.85 2.29 3.31 4.30 3.83 4.21 4.59 4.58 5.11 8.26 11.59 6.96 8.12 8.69 9.02 9.39 7.88 7.93 9.66 8.44 7.92 5.47 3.74 4.54 4.32 5.73 5.82 4.91 4.85 8.22 8.73 9.55 5.59 3.19 1.99 2.00 0.00 0.00 0.00 0.00 0.00 0.00 0.00 0.00 7.16
Volume 0 0 0 0 0 0 0 0 40 592 384 4,608 6,256 11,336 14,632 17,864 19,984 14,112 16,800 16,840 17,448 20,096 17,480 14,120 20,888 18,928 20,208 25,336 23,168 20,632 11,688 8,456 9,680 14,184 9,976 15,056 13,824 13,952 10,024 6,056 4,512 4,208 2,264 2,272 1,632 1,208 240 0 0 0 0 0 0 0 0 450,984
Tonnes 0 0 0 0 0 0 0 0 116 1,717 1,114 13,363 18,142 32,874 42,432 51,806 57,954 40,925 48,720 48,836 50,599 58,278 50,692 40,948 60,575 54,891 58,603 73,475 67,187 59,833 33,895 24,522 28,072 41,133 28,930 43,663 40,090 40,461 29,070 17,562 13,085 12,203 6,565 6,589 4,733 3,503 696 0 0 0 0 0 0 0 0 1,307,852
Au Inf
Cu Inf 0.00 0.00 0.00 0.00 0.00 0.00 0.00 0.00 1.90 1.82 1.67 1.63 1.71 2.25 2.24 2.50 2.67 2.23 2.18 2.14 2.67 5.21 6.21 5.63 4.12 3.26 2.19 2.07 2.40 2.47 2.33 2.10 2.17 2.08 2.04 2.40 3.01 3.35 2.67 2.16 1.87 2.00 2.53 2.00 1.92 1.98 2.00 0.00 0.00 0.00 0.00 0.00 0.00 0.00 0.00 2.86
Ag Inf 0.00 0.00 0.00 0.00 0.00 0.00 0.00 0.00 0.33 0.32 0.23 0.19 0.25 0.32 0.37 0.34 0.37 0.34 0.34 0.27 0.19 0.41 0.54 0.54 0.52 0.46 0.36 0.35 0.34 0.42 0.46 0.38 0.44 0.42 0.40 0.44 0.40 0.47 0.47 0.49 0.40 0.43 0.67 0.20 0.02 0.00 0.00 0.00 0.00 0.00 0.00 0.00 0.00 0.00 0.00 0.39
0.00 0.00 0.00 0.00 0.00 0.00 0.00 0.00 10.40 10.03 3.91 1.86 2.61 3.59 4.36 3.84 3.96 3.98 4.39 4.15 4.12 4.39 4.45 3.98 7.97 8.54 8.03 5.95 4.96 7.84 7.90 6.76 8.23 5.22 6.76 3.19 6.23 7.99 6.58 4.56 7.32 7.77 9.71 4.01 3.41 1.99 2.00 0.00 0.00 0.00 0.00 0.00 0.00 0.00 0.00 5.56
Tonnes 0 0 0 0 0 0 0 0 116 1,833 2,947 16,310 34,452 67,326 109,758 161,564 219,518 260,443 309,163 357,999 408,598 466,876 517,568 558,516 619,091 673,982 732,585 806,060 873,247 933,080 966,975 991,497 1,019,569 1,060,702 1,089,632 1,133,295 1,173,385 1,213,846 1,242,916 1,260,478 1,273,563 1,285,766 1,292,331 1,298,920 1,303,653 1,307,156 1,307,852 1,307,852 1,307,852 1,307,852 1,307,852 1,307,852 1,307,852 1,307,852 1,307,852
Cummulative (ascending) Au Mea Cu Mea 0.00 0.00 0.00 0.00 0.00 0.00 0.00 0.00 0.00 0.00 0.00 0.00 0.00 0.00 0.00 0.00 1.90 0.33 1.82 0.32 1.76 0.28 1.65 0.21 1.68 0.23 1.96 0.27 2.07 0.31 2.21 0.32 2.33 0.33 2.31 0.33 2.29 0.34 2.27 0.33 2.32 0.31 2.68 0.32 3.03 0.34 3.22 0.36 3.31 0.37 3.30 0.38 3.21 0.38 3.11 0.38 3.06 0.37 3.02 0.38 2.99 0.38 2.97 0.38 2.95 0.38 2.92 0.38 2.89 0.38 2.87 0.39 2.88 0.39 2.89 0.39 2.89 0.39 2.88 0.39 2.87 0.39 2.86 0.39 2.86 0.39 2.85 0.39 2.85 0.39 2.85 0.39 2.85 0.39 2.85 0.39 2.85 0.39 2.85 0.39 2.85 0.39 2.85 0.39 2.85 0.39 2.85 0.39 2.85 0.39
Ag Mea 0.00 0.00 0.00 0.00 0.00 0.00 0.00 0.00 10.40 10.05 7.73 2.92 2.75 3.16 3.63 3.70 3.77 3.80 3.89 3.93 3.95 4.01 4.05 4.05 4.43 4.76 5.03 5.11 5.10 5.27 5.37 5.40 5.48 5.47 5.50 5.41 5.44 5.53 5.55 5.54 5.56 5.58 5.60 5.59 5.58 5.57 5.57 5.57 5.57 5.57 5.57 5.57 5.57 5.57 5.57
Tonnes 1,307,852 1,307,852 1,307,852 1,307,852 1,307,852 1,307,852 1,307,852 1,307,852 1,307,852 1,307,736 1,306,019 1,304,905 1,291,542 1,273,400 1,240,526 1,198,094 1,146,288 1,088,334 1,047,409 998,689 949,853 899,254 840,976 790,284 749,336 688,761 633,870 575,267 501,792 434,605 374,772 340,877 316,355 288,283 247,150 218,220 174,557 134,467 94,006 64,936 47,374 34,289 22,086 15,521 8,932 4,199 696 0 0 0 0 0 0 0 0
Cummulative (descending) Au Mea Cu Mea 2.85 0.39 2.85 0.39 2.85 0.39 2.85 0.39 2.85 0.39 2.85 0.39 2.85 0.39 2.85 0.39 2.85 0.39 2.85 0.39 2.85 0.39 2.85 0.39 2.86 0.39 2.88 0.39 2.90 0.40 2.92 0.40 2.94 0.40 2.95 0.40 2.98 0.40 3.02 0.41 3.06 0.41 3.09 0.43 2.94 0.43 2.73 0.42 2.57 0.41 2.43 0.41 2.36 0.40 2.38 0.41 2.42 0.41 2.43 0.42 2.42 0.42 2.43 0.42 2.46 0.42 2.49 0.42 2.55 0.42 2.62 0.43 2.68 0.42 2.58 0.43 2.25 0.41 2.06 0.38 2.03 0.34 2.09 0.32 2.14 0.27 1.97 0.09 1.95 0.01 1.98 0.00 2.00 0.00 0.00 0.00 0.00 0.00 0.00 0.00 0.00 0.00 0.00 0.00 0.00 0.00 0.00 0.00 0.00 0.00
Ag Mea 5.57 5.57 5.57 5.57 5.57 5.57 5.57 5.57 5.57 5.57 5.56 5.57 5.60 5.65 5.70 5.75 5.83 5.93 6.01 6.09 6.19 6.31 6.44 6.57 6.71 6.60 6.43 6.26 6.31 6.52 6.31 6.15 6.10 5.89 6.01 5.91 6.59 6.69 6.13 5.93 6.44 6.11 5.19 3.28 2.74 1.99 2.00 0.00 0.00 0.00 0.00 0.00 0.00 0.00 0.00
3/27/2003