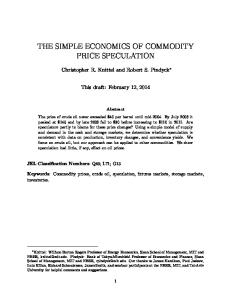
INTERNATIONAL FOOD POLICY RESEARCH INSTITUTE sustainable solutions for ending hunger and poverty Supported by the CGIAR
When Speculation matters Miguel Robles, Maximo Torero, and Joachim von Braun
IFPRI Issue Brief 57 • February 2009
T
he food price crisis of 2007–08 had several causes—rising demand for food, the change in the food equation through biofuels, climate change, high oil prices—but there is substantial evidence that the crisis was made worse by the malfunctioning of world grain markets. Dozens of countries imposed restrictions on grain exports that resulted in significant price increases, given the thinness of markets for major cereals. A number of countries adopted retail price controls, creating perverse incentives for producers. Speculative price spikes built up, and the gap between spot and futures prices widened, stimulating overregulation and trader policing in some countries and causing some commodity exchanges in Africa and Asia to halt grain futures trading. Some food aid donors defaulted on food aid contracts. The World Food Programme (WFP) had difficulty getting access to enough grain quickly for its humanitarian operations. Developing countries began urgently rebuilding their national stocks and reexamining the “merits” of self-sufficiency policies for food security.
This brief analyzes the role of financial speculation in the behavior of agricultural prices in recent years.
These reactions began as consequences, not causes, of the price crisis, but they exacerbated the crisis and increased the risks posed by high prices. By creating a positive feedback loop with high food prices, they took on a life of their own, increasing price levels and price volatility even more, with adverse consequences for the poor and for long-term incentives for agricultural production. Because they impeded the free flow of food to where it is most needed and the free flow of price signals to farmers, these market failures imposed enormous efficiency losses on the global food system, hitting the poorest countries hardest. Changes in supply and demand fundamentals cannot fully explain the recent drastic increase in food prices. Rising expectations, speculation, hoarding, and hysteria also played a role in the increasing level and volatility of food prices. The flow of speculative capital from financial investors into agricultural commodity markets has been drastic, and the number of future traded contracts is increasing over time. From May 2007 to May 2008, the volume of globally traded grain futures and options rose significantly. Excessive speculation in the commodity futures market could, in principle, push up futures prices and— through arbitrage opportunities—spot prices above levels justified by supply and demand fundamentals. The supposed impact of speculation is sometimes confused, however, with the impact of hedging, which reflects consumers’ genuine concerns about future fundamentals and desire to hedge against risks.
What is speculation? Speculation is the assumption of the risk of loss in return for the uncertain possibility of a reward. It is ordinarily understood to mean the purchase of a good for later resale rather than for use, or the temporary sale of a good with the intention of later repurchase in the hope of profiting from an intervening price change. (A broader definition of speculation could even include hoarding by consumers in times of perceived market risk, but that definition is not used here.) Only if a particular position involves no risk can it be called, strictly speaking, an “investment.” Financial speculation involves the buying, holding, selling, and short-selling of stocks, bonds, commodities, or any valuable financial instrument to profit from fluctuations in its price as opposed to buying it for use or for dividend or interest income. Speculation is one of four market activities in financial markets, along with hedging, long- or short-term investing, and arbitrage. In the context of food markets, speculators are relatively risk-tolerant individuals who are rewarded for accepting price risks from more risk-adverse hedgers. A risk-adverse trader who is or anticipates holding the commodity (such as a farmer with a crop of wheat
2
approaching harvest) may hedge by selling now, in a forward or “futures” market, for future delivery at a currently determined price. An individual who is or anticipates being short the commodity (such as a miller of wheat) may hedge by buying now for future delivery at such a known price. Speculators in the futures market may be on the long and short side of any single such transaction, but in the aggregate their commitments must offset any net imbalances in the long and short hedgers’ positions. (A short position is the sale of a borrowed commodity with the expectation that the asset will fall in value. A long position is the buying of a commodity with the expectation that the asset will rise in value.)
behavior in agricultural commodity markets, we analyze four indicators: (1) volume of futures contracts, (2) open interest in futures contracts, (3) the ratio of volume to open interest in futures contracts, and (4) positions in futures contracts by noncommercial traders. Monthly volume of futures contracts. This indicator captures the total number of trades in commodity futures contracts in the CBOT on a monthly basis, aggregating contracts with different maturities. Typically, contracts with maturities of 24 months or less are traded. The data show that traded volumes of agricultural commodity futures have increased significantly in recent years (Figure 1). From 2005 to 2006, the average monthly volume of futures for wheat and maize grew by more than 60 percent and those for rice by 40 percent. In 2007, traded volumes again rose significantly for all four commodities, especially soybeans, whose monthly average was 40 percent larger than in 2006. During the first five months of 2008, only the volumes for maize seem to have stabilized, whereas the volumes for rice and soybeans were still growing at very high rates—47 percent and 40 percent, respectively. One reason for this increase in volumes and the subsequent impact on prices in recent years may be more active participation in these markets by speculators, especially short-term speculators, who open and close positions in a relatively short period of time.
Data and Proxies for
Speculation This analysis of the role of financial speculation in the behavior of agricultural prices in recent years focuses on trading activities in agricultural commodity futures markets, drawing on information about trading activities in the Chicago Board of Trade (CBOT), a leading agricultural futures exchange. The analysis encompasses four major commodities: maize, wheat, soybeans, and rice. To capture the size of and change in speculative
Figure 1—Monthly volume of futures contracts and open interest in futures contracts, February 2002–February 2008 Monthly traded volumes
Monthly open interest
Open interest index
500 (1st quarter 2002 = 100)
500 400 300 200 100
0
450 400 350 300 250 200 150 100 50
Wheat
Maize
Soybeans
Wheat
Rough rice
Source: Chicago Board of Trade (CBOT). Note: The volume index is a 3-month moving average.
Maize
Oct-04 Feb-05 Jun-05 Oct-05 Feb-06 Jun-06 Oct-06 Feb-07 Jun-07 Oct-07 Feb-08
Oct-03 Feb-04 Jun-04
Feb-03 Jun-03
Oct-02
Feb-02 Jun-02
Feb-07 Jun-07 Oct-07 Feb-08
Feb-03 Jun-03 Oct-03 Feb-04 Jun-04 Oct-04 Feb-05 Jun-05 Oct-05 Feb-06 Jun-06 Oct-06
0
Feb-02 Jun-02 Oct-02
Volume index
(1st quarter 2002 = 100)
600
Soybeans
Rough rice
Source: Chicago Board of Trade (CBOT). Note: The open interest index is a 3-month moving average.
3
Monthly open interest in futures contracts. Open interest describes the total number of futures contracts for a given commodity that have not yet been offset by an opposite futures position or fulfilled by delivery of the commodity. Every time a trader takes a position in the futures market (either long or short), it immediately generates an open position until this trader takes the opposite position or the contract expires. Open interest has been growing over the past five years (Figure 1), but the average growth rates for each commodity vary over time. From 2005 to 2006, the average monthly open interest in futures for wheat and maize grew by about 75 percent and that for rice by more than 90 percent. In 2007, however, open interest in maize and wheat declined slightly, and open interest in rice grew moderately, at 21 percent. Soybeans, meanwhile, increased by 40 percent on average in 2007, grew at a rate below 10 percent in early 2008, and started declining in February 2008. Furthermore, wheat experienced further decline in early 2008, and maize grew at a rate of only 3 percent. These data on open interest may reflect the entry of medium- and long-term speculators into commodity futures markets, which may have played a role in the recent food price crisis. Ratio of volume to open interest in futures contracts. The ratio of volume to open interest captures speculative market activity under the assumption that the majority of speculators prefer to get in and out of the market in a
short period of time, in contrast to futures traders who are not engaging in speculation. Hence a speculator taking opposite positions (buying and selling contracts) in the market within days or weeks will generate an increase in monthly registered volumes but little change in monthly open interest. Therefore, changes in this ratio would potentially capture changes in speculative activity. In fact, this ratio has grown little over the past few years (Figure 2). In 2006, for instance, the ratio was declining across all four commodities. In 2007, the results were mixed, with 31 percent growth in the ratio for wheat and 17 percent growth in that for maize, but declining ratios for soybeans and rice. In 2008, however, both soybean and rice ratios were increasing, at 27 percent and 19 percent respectively, as wheat ratios continued to grow at 19 percent and maize declined slightly. Comparing this recent growth with 2005 and 2006, when ratios for at least three commodities were declining on average, suggests that this ratio is a potential instrument to capture speculative behavior. Ratio of noncommercial positions to total positions in futures contracts. The U.S. Commodity Futures Trading Commission (CFTC) classifies all of a reportable trader’s futures positions as either “commercial” or “noncommercial.” (Reportable traders are those who hold positions in futures and options at or above specific reporting levels set by the CFTC. It is estimated that the aggregate of all traders’ positions reported accounts
Figure 2—Ratio of volume to open interest in futures contracts and positions in futures contracts by noncommercial traders, 2002–08 Ratio of noncommercial long positions to total reportable long positions
10 9 8 7 6 5 4 3 2 1 0
1.0 0.9 0.8
Ratio
0.7 0.6 0.5 0.4 0.3 0.2 0.1
Wheat
Maize
Soybeans
Jan-02 Apr-02 Jul-02 Oct-02 Jan-03 Apr-03 Jul-03 Oct-03 Jan-04 Apr-04 Jul-04 Oct-04 Jan-05 Apr-05 Jul-05 Oct-05 Jan-06 Apr-06 Jul-06 Oct-06 Jan-07 Apr-07 Jul-07 Oct-07 Jan-08 Apr-08
Feb-07 Jun-07 Oct-07 Feb-08
Feb-03 Jun-03 Oct-03 Feb-04 Jun-04 Oct-04 Feb-05 Jun-05 Oct-05 Feb-06 Jun-06 Oct-06
0.0
Feb-02 Jun-02 Oct-02
Ratio
(monthly volume / monthly open interest)
Ratio of volume to open interest
Wheat
Rough rice
Maize
Soybeans
Source: U.S. Commodity Futures Trading Commission (CFTC).
Source: Chicago Board of Trade (CBOT).
4
Rice
for more than 70 percent of the total open interest in managed and pension funds, as well as commercial traders. any given market.) Futures positions in a commodity are Information is available for positions on futures and opclassified as commercial if a trader uses futures contracts tions contracts for wheat, maize, and soybeans. In the case in that commodity for hedging purposes as defined by the of wheat index traders, long positions account for around CFTC; otherwise, a position is classified as noncommercial. 40 percent of total open interest, whereas in the cases of Hence, whereas commercial positions are held for maize and soybeans this proportion is around 25 percent. hedging purposes, noncommercial positions in futures As long as these index traders enter the agricultural comcontracts mainly represent speculative activity in pursuit modities futures and options markets for reasons other of financial profits. This brief uses the CFTC classification than hedging against commodity-specific risks, their trading to study the importance of speculative activity relative positions are used here as a proxy for speculative activity. to hedging activity in recent years, looking at the ratio of In particular, we look at net positions (long minus short noncommercial positions to total positions, for long as positions). Figure 3 shows an upward trend for soybeans well as for short positions. Data incorporate only total and maize from January 2006 to mid-2008. reportable positions because only reportable positions are classified as either commercial or noncommercial. The ratio of long noncommercial positions to total long positions seems to have grown in recent years. For each of the years from 2006 to 2008, the ratio’s weekly average has grown in at least three of the four commodThis study statistically tested whether speculative activity ity markets. For maize this ratio averaged 0.29 in 2005 in the futures market can be identified as a source of and reached 0.49 in the first five months of 2008. Similarly, increasing agricultural commodity prices in 2007–08. The increases have been observed for wheat and soybeans. results show that speculative activities might have been For rough rice, this ratio has been more erratic over time. influential, but the evidence is far from conclusive. Although the ratio increased during 2008 compared with The analysis here tested to what extent the selected 2007, it is still lower than observed levels in past years. In indicators for speculative activity can help forecast spot the case of short positions, there is less evidence of an price movements, using the Granger causality test (see the upward trend in the relative importance of speculative poAppendix for details on this methodology). This test seeks sitions in recent years. On the contrary, it seems that commercial short positions have become relatively more important. Overall, increasing participation by commercial hedgers in the futures Figure 3—Index traders’ net positions in futures and options, markets has been matched by increasing par January 2006–May 2008 ticipation by speculative investors. This situation does not mean, however, that short positions by speculators have not affected prices. Ultimately, 500 450 the volume of short positions held by speculators 400 has strongly increased over time, as has the vol350 ume of short positions held by hedgers. 300 250 Index traders’ net positions. Since 2006, the 200 CFTC has provided information on futures and 150 options trading by a new category of traders in 100 selected agricultural markets known as index 50 0 traders. These traders generally replicate a commodity index by establishing long futures positions in a mix of commodity markets and then rolling Wheat Maize Soybeans those positions forward from future to future Source: U.S. Commodity Futures Trading Commission (CFTC). using a fixed methodology. Hence, most of these Note: Net positions = long-short positions. traders hold long-only futures positions. This category includes noncommercial traders, such as
5
Mar-3-08
May-3-08
Jan-3-08
Sep-3-07
Nov-3-07
Jul-3-07
Mar-3-07
May-3-07
Jan-3-07
Sep-3-06
Nov-3-06
Jul-3-06
May-3-06
Mar-3-06
Jan-3-06
(thousands)
Number of (equivalent) futures contracts
Evidence of Causal Effects
Table 1—Evidence of speculation activity affecting commodity prices Commodity
Indicator of speculation activity
Wheat Maize
Soybeans Rice
1. Monthly volume of futures contracts, CBOT 2. Monthly open interest of futures contracts, CBOT 3. Ratio of volume to open interest (1)/(2) (futures contracts)
+ (Apr. 2005– Oct. 2007)
+ (Dec 2004– Jun. 2007)
4. Ratio of noncommercial positions to total reportable positions (long)
+ (Apr. 2004–Oct. 2006 and Sept. 2005–Mar. 2008 )
5. Ratio of noncommercial positions to total reportable positions (short)
+ (Mar. 2004– Sept. 2006 and Jan. 2005– Jul. 2007
6. Index traders’ net positions (long – short positions)a
+ (Jan. 2006– May 2008)
+ (Aug. 2005– Feb. 2008) n.a.
Source: Authors. Note: “+” indicates evidence of causality.The starting period of the evidence of causality is in parentheses. “n.a.” indicates not available. a This indicator combines futures and options positions using data available since January 2006.
each different speculation indicator, 49 causality tests were conducted as the period of analysis moved ahead one month at a time. As the analysis reached more recent periods, when prices started to increase more rapidly, the tests were able to show any indication that speculation was pushing prices up. Because data on index traders’ net positions before 2006 were unavailable, this rolling period strategy could not be used to analyze that indicator. In this case a simple causality test for the available period (2006–08) was conducted. Table 1 summarizes the results of the causality tests. As shown, the size of trading activity in futures contracts when measured by volume or open interest separately shows no evidence of affecting commodity prices. The ratio of monthly volume to open interest in futures contracts, however, has an influence in forecasting price movements for wheat and rice. In other words, past changes in this ratio help to forecast future changes in the price of wheat and rice. In addition, for the case of rice the ratio of noncommercial long positions to total long reportable positions has an effect on prices. An analysis of the same ratio
to determine whether past movements in one variable can help explain current movements in another one; if so, the latter variable is said to be caused by the former one. This econometric technique was applied to each agricultural commodity. Using monthly spot prices, as reported by the Food and Agriculture Organization of the United Nations (FAO), we investigated whether any of the proxies for speculation used here can be identified as causing (technically, “Granger”-causing) the corresponding price change. (More specifically, in a time-series setting, we looked at the current log prices and ran a regression on past log prices and the lagged proxy of speculation. Then this model was compared with a restricted model, which removed the lagged proxy variable using an F-test. Whenever we found evidence of nonstationary series, for either prices or speculation indicators, we used first differences, provided these were stationary. For more information, see the Appendix.) The tests were conducted by taking 30-month periods beginning with the period January 2002–June 2004 and moving ahead one month at a time until the period November 2005–May 2008 was reached. For each commodity and
6
Conclusion
Figure 4—Evidence of speculation influencing commodity prices, July 2004–May 2008 Index = F statistic - F critical value
8 6 4 2 0 -2 -4 -6
Jul-04 Sep-04 Nov-04 Jan-05 Mar-05 May-05 Jul-05 Sep-05 Nov-05 Jan-06 Mar-06 May-06 Jul-06 Sep-06 Nov-06 Jan-07 Mar-07 May-07 Jul-07 Sep-07 Nov-07 Jan-08 Mar-08 May-08
for short positions provides additional evidence that speculation affects prices, with significant results in the soybean market. In the case of maize there are signs of causality for the ratio of noncommercial short positions to total short positions between March 2004 and September 2006 and during the 30-month span lasting from January 2005 until July 2007. Finally, a test of the influence of the net positions of index traders on commodity prices from January 2006 to May 2008 reveals positive evidence in the case of maize (a 95 percent confidence level is used to claim statistical evidence). Figure 4 provides a more detailed picture of cases in which evidence shows that speculation activity causes price changes. Typically, a Granger causality test produces an indicator, called an F statistic, that must be compared with another number called an F critical value. A positive difference indicates causality, and the bigger this difference, the more statistically significant the evidence.
Last month of a 30-month period Wheat:Volume/open interest Rice:Volume/open interest Rice: Ratio of noncommercial long positions Maize: Ratio of noncommercial short positions Soybeans: Ratio of noncommercial short positions Note: Positive numbers on vertical axis show evidence of influence.
This analysis statistically tested whether speculative activity in the futures market can be identified as a source of the increasing agricultural commodity prices in 2007–08. The results show that speculative activities might have been influential. The analysis also tested the extent to which selected indicators for speculative activity can help forecast spot price movements, producing evidence that some speculation indicators affect current commodity prices of wheat, rice, maize, and soybeans. The excess price surges caused by speculation and possible hoarding could have severe effects on confidence in global grain markets, thereby hampering the market’s performance in responding to fundamental changes in supply, demand, and costs of production. More important, they could result in unreasonable or unwanted price fluctuations that can harm the poor and result in long-term, irreversible nutritional damage, especially among children. Appropriate global institutional arrangements for preventing these market failures are missing. A global solution that prevents excessive speculation in food markets may be costly, but given the losses created by food price crises like the one in 2007–08, it will still have large positive net returns. It is clear that the incentives for speculation in food commodities could be reduced by (1) changing regulatory frameworks to limit the volume of speculation versus hedging, (2) making delivery on contracts or portions of contracts compulsory, (3) imposing capital deposit
requirements when each futures transaction is made, or all three. These regulatory measures could be implemented case by case or as a platform through an international “alliance of commodity exchanges.” Difficulties could arise, however, in walking a line between ineffective regulators (like the U.S. Commodity Futures Trading Commission) and overzealous ones (like those in China and India). Market regulation also raises political economy concerns, including the possibilities that regulatory measures could benefit relatively small groups, that certain groups may capture control of the regulatory agency, that regulatory agreements may not be completed, and that countries may lack the institutional capacity to implement and enforce the regulatory measures. A new global institutional arrangement encompassing a “virtual reserve” could be an alternative solution (see the IFPRI policy brief Implementing Physical and Virtual Food Reserves to Protect the Poor and Prevent Market Failure, by Joachim von Braun and Maximo Torero. Washington, DC: International Food Policy Research Institute, 2009). This virtual reserve would consist of a coordinated commitment by member countries (the Group of Eight Plus Five plus some other major grain-exporting countries such as Argentina, Thailand, and Vietnam). Each country would commit to supplying funds, if needed, for intervention in the futures market. The innovative concept
7
behind the virtual reserve is the signal that it would give to markets, including speculators. Although its presence alone would likely divert speculators from entering this market, the virtual reserve must be ready to trade grain
when necessary. This concept could provide the kind of global collective action that is needed to facilitate wellfunctioning grain markets and to reduce the harm that can result from excessive price spikes.
Appendix: Rolling Regressions Granger Causality Tests This appendix explains the details behind the rolling regressions Granger causality tests. First, we selected the international price of a specific commodity . The log of this price at time was denoted as . Second, we focused on a speculation proxy variable. For each commodity there were five speculation proxies, denoted here as , where and = noncommercial long ratio for commodity = noncommercial short ratio for commodity = volume-to-open interest ratio for commodity = volume traded on short or long futures for commodity = open interest for commodity All of these proxies refer to transactions in futures markets; data are taken from transactions in the Chicago Board of Trade. All variables are in a monthly frequency. A speculation proxy for a given time was denoted as . The order of integration for each speculation proxy was tested. In the case of and , the condition that the time series behave as stationary was imposed. We claim that this is by construction because these ratios are bounded between zero and one. If a given speculation proxy is integrated of order one, we then worked using its first difference. None of our proxies behave as integrated of order two or greater. Here, for exposition purposes, we assumed that all proxies behave as integrated of order one, and hence we used the first difference . Third, we fixed a sample period of 30 months, starting in January 2002. Then for every commodity price and every speculation proxy for that commodity , we ran a one-way Granger causality test to examine whether the speculation proxy caused, in the Granger sense, the commodity price. As stated in the literature, by “Granger sense” we mean whether the speculation proxy helps forecast the commodity price. Then we rolled the 30-sample period one month ahead and repeated the same Granger causality test exercise. The second exercise was thus a 30-month sample starting in February 2002. We kept rolling the 30-month sample ahead until we exhausted the available data.
Each Granger causality test consisted of the following steps. First, we ran the following unrestricted model:
Notice that we incorporated only one speculation proxy in this unrestricted model, and we did exactly the same for each speculation proxy. One could incorporate more than one proxy or add other exogenous variables into this model. We chose not to do so because we wanted to keep the simplest unrestricted model (a pure autoregressive process) and study the forecasting ability of every speculation proxy against this simple model. To determine the lag structure, a general-to-specific approach was used, where more lags were considered in an original unrestricted regression than were thought to be necessary. Then we used the Bayesian-Schwartz criterion to define the most appropriate lag structure for the specific commodity and speculation proxy combination. Once the unrestricted model was computed, we saved the residual sum of squares . Second, we ran the following restricted model:
Based on this restricted model, we computed the residual sum of squares . Finally, we constructed the following F-test:
where the null hypotheses is that does not Granger-cause .
Miguel Robles (
[email protected]) is a postdoctoral fellow in and Maximo Torero (
[email protected]) is director of the Markets, Trade, and Institutions Division (MTID) of the International Food Policy Research Institute (IFPRI). Joachim von Braun (
[email protected]) is director general of IFPRI. FINANCIAL CONTRIBUTORS AND PARTNERS
IFPRI’s research, capacity strengthening, and communications work is made possible by its financial contributors and partners. IFPRI receives its principal funding from governments, private foundations, and international and regional organizations, most of which are members of the Consultative Group on International Agricultural Research (CGIAR). IFPRI gratefully acknowledges the generous unrestricted funding from Australia, Canada, China, Finland, France, Germany, India, Ireland, Italy, Japan, Netherlands, Norway, South Africa, Sweden, Switzerland, United Kingdom, United States, and World Bank.
INTERNATIONAL FOOD POLICY RESEARCH INSTITUTE 2033 K Street, NW • Washington, DC 20006-1002 • USA T +1.202.862.5600 • Skype: ifprihomeoffice • F +1.202.467.4439 •
[email protected]
www.ifpri.org
This brief has been printed on recycled paper with a high-recycled content and is processed chlorine free. Copyright © 2009 International Food Policy Research Institute. All rights reserved. Sections of this document may be reproduced without the express permission of but with acknowledgment to IFPRI. Contact
[email protected] for permission to reprint.