TSUNAMI EVACUATION BUILDINGS (TEBs) AND EVACUATION PLANNING IN BANDA ACEH, INDONESIA Hendri Yuzal Department of Urban and Regional Planning University of Hawaii at Manoa 2424 Maile Way Honolulu, HI 96822 Ph. (808)386-0556 Fax. (808)536-9110 Email.
[email protected] Karl Kim, Ph.D. (Corresponding Author) Department of Urban and Regional Planning University of Hawaii at Manoa 2424 Maile Way Honolulu, HI 96822 Ph. (808)956-0601 Fax. (808)536-9110 Email.
[email protected] Pradip Pant, Ph.D. Department of Urban and Regional Planning University of Hawaii at Manoa 2424 Maile Way Honolulu, HI 96822 Ph. (808)956-3738 Fax. (808)956-6870 Email.
[email protected] Eric Yamashita National Disaster Preparedness Training Center University of Hawaii at Manoa Fort street Mall? Honolulu, HI 96822 Ph. (808)956-0602 Fax. (808)536-9110 Email.
[email protected]
No. of Words: 5153 + 2250 = 7403 Figures: 7 and Tables: 2
1
1 2 3 4 5 6 7 8 9 10 11 12 13 14 15 16 17 18
ABSTRACT Indonesia, a country of more than 17,000 islands is exposed to many hazards. A magnitude 9.1 earthquake struck off the coast of Sumatra, Indonesia on December 26, 2004. It triggered a series of tsunami waves that spread across the Indian Ocean causing damage in eleven countries. Banda Aceh, the capital city of Aceh Province, was among the most damaged. More than 31,000 people were killed. At the time, there was no early warning systems nor evacuation buildings that could provide safe refuge for residents. Since the tsunami, four Tsunami Evacuation Buildings (TEB) have been constructed in the Meuraxa sub district of Banda Aceh. Based on an analysis of evacuation routes and travel times, the capacity of existing TEBs is examined. Existing TEBs would not be able to shelter all at-risk population. Additional buildings and locations for TEBs are proposed and all at-risk residents are assigned to the closest TEBs. While TEBs may be part of a larger system of tsunami mitigation, other strategies and approaches tneed to be considered. In addition to physical structures, detection, warning and alert systems, land use planning, and building training, exercises, and other preparedness strategies are essential to tsunami risk reduction. KEYWORDS: Tsunami Evacuation Buildings (TEBs), Evacuation Planning, Indonesia, GIS
19
2
20 21 22 23 24 25 26 27 28 29 30 31 32 33 34 35 36 37 38 39 40 41 42 43 44 45 46 47 48 49 50 51 52 53 54 55 56 57 58 59 60 61 62 63 64 65
INTRODUCTION On December 26, 2004, a strong, magnitude 9.1 Mw earthquake struck off the coast of Sumatra, Indonesia. It was the largest recorded earthquake since the 9.5 Mw magnitude earthquake in 1960 in Chile (1). The earthquake triggered a series of tsunami waves that spread across the Indian Ocean and other parts of the world, affecting 11 different nations. Within 40 minutes of the earthquake, the western coast of Northern Sumatra was struck by a 100 foot tsunami wave, with the greatest damage occurring in Aceh, Indonesia (2). Banda Aceh, the capital city was heavily affected, with more than 31,000 fatalities. A primary strategy for saving lives is to evacuate people from the hazard zone (3). Evacuation planning involves analyzing natural and built environments and social systems, assessing risk and vulnerabilities and understanding human behavior (4). A tsunami evacuation or escape building (TEB) is a temporary shelter for evacuation during a tsunami (4, 5). It must be located close to population centers and accessible via roads and transportation systems. When people cannot leave the area, the escape building can be an effective alternative (6). The shelter must be higher than flood heights and able to withstand the forces of the tsunami waves (7). Moreover, it should be able to accommodate the expected number of evacuees (4). Different types of buildings can such as community centers, commercial facilities (hotels, arenas, and convention centers), school facilities, or additions to existing structures can be used as (8). To increase awareness of tsunami mitigation options and plan for evacuation, government, private sector, and the community needs to work together (9). Interaction among stakeholders will increase resilience and is consistent with the "whole community" initiative in which residents, emergency managers, organizational and community leaders, and government officials collectively understand and assess the needs and determine the best ways to organize and strengthen their assets, capacities, and interests (10). Public and private organizations need to collaborate with the community to develop effective solutions for building resilience (11). Many disaster risk reduction plans exist at all levels of government, business, and industry. Government sector plans must include all elements of the whole community. Some progress has been made in countries such as the U.S., where, according to the 2013 National Preparedness Report, 85 percent of states rated their “emergency operations plans as adequate to accomplish their missions.”and 61 percent of states “involved the whole community in developing those plans, including nongovernmental organizations, the private sector, and groups representing individuals with access and functional needs” (12). Private sector plans need to take into account the community’s emergency operations plan (11). Businesses need to work with government to understand how to manage events that threaten business survival. Government relies on businesses for tax revenue, jobs, and income for workers and local economies. Businesses provide significant resources during disasters. They are a critical component of the community’s emergency operations plan. The value of such plans, however, lies in the periodic review, updating, and exercising of the plans. In so doing, organizations are continuously evaluating and managing risk (11). The aim of this study is to identify evacuation locations for the at risk population in a tsunami event comparable to that which occurred in 2004, using demographic data, transportation modeling, routing and location of tsunami escape buildings. The paper is structured as following. The data and methods are described in the next section. Location of existing escape buildings and their carrying capacity are analyzed. After determining that the existing buildings do not have sufficient capacity, new locations are proposed and analyzed by considering the population distribution, road network, pedestrian paths and evacuation building 3
66 67 68 69 70
locations. Concerns related to tsunami TEB strategies are discussed. The paper concludes with policy implications as well as supplemental and supporting measures for planning and building tsunami resilience.
71 72 73 74 75 76 77 78 79
Study Area: Banda Aceh The study area of this project is a sub district in Banda Aceh called Meuraxa and is shown in Figure 1, "Study Area." Based on updated data (2012), Banda Aceh had a population of 248,727 of which 18,617 were in the Meuraxa sub district with a total of 7,716 buildings (13). The predominant land uses before the 2004 disaster were residential and commercial uses comprising more than 30 % of the city area. Other categories of land use include swamp, coastal areas and open spaces, most of which was used for fisheries, one of main economic activities of the region (5).
DATA AND METHODS
80 81 82 83 84 85 86 87 88 89 90 91 92 93 94 95 96 97 98 99 100 101 102 103 104
FIGURE 1 Study Area Meuraxa was almost completely destroyed by the tsunami in 2004. Meuraxa is located on the coastline, on low-lying lands vulnerable to coastal hazards. It houses port facilities and densely populated residential neighborhoods (14). Before 2004, Meuraxa was a relatively mixed neighborhood that included lower income residents dependent on fishing and ferry port industrial activities as well as middle and upper income households many of whom worked in government and the city center. Population Distribution According to census data, the population in Banda Aceh in 2005 was 177,000, which was a decrease of 25.62% from 2004 population of 239,000. The decrease can be attributed to the 4
105 106 107 108 109
tsunami. Banda Aceh’s population has increased since the disaster with slight decreases in 2008 and 2009 due to the departure of foreign aid and reconstruction workers (15). By 2012 in the Meuraxa sub district, the population has increased to 18,617. The growth of population ibetween 2000 to 2011 is shown in Figure 2, "Population of Banda Aceh and Aceh Besar."
110
FIGURE 2 Population of Banda Aceh and Aceh Besar, 2000-2011 in thousands (15)
111 112 113 114 115 116 117 118 119 120
The demand for evacuation is determined by distributing population in the area using dasymetric (16) mapping techniques to estimate building occupancies using census data and building footprints. This technique provides a better estimate of the population distribution than using centroid or areal weighting methods. Since the study area is completely within the tsunami hazard zone, the entire population will need to evacuate to from existing structures to the nearest TEB. Vertical evacuation is the only option considered in this study. The evacuee’s origins and destinations are established based on footprints of every structure in the study area. It is assumed that every building other than the TEBs would be completely flooded in the event of a tsunami. While some evacuees might escape by moving to higher ground, these options are severely limited by geography and the extent of flooding in the sub district.
121 122 123 124 125 126 127 128 129
Analysis Method Following the tsunami, the Japan International Cooperation Agency (JICA) prepared a tsunami mitigation study and plan (5). JICA used field survey methods to determine the locations of the TEBs. The study used 2004 data on the physical conditions and demographic variables to plot suitable sites for TEB. Based on this, TEBs were built in several locations in 2007. The JICA (5) disaster management resource plan and relief plan showed the catchment areas of the proposed TEBs, but did not include evacuation routes. At present there are four escape buildings in Meuraxa. Three buildings were constructed by JICA and the fourth by the Agency for Rehabilitation and Reconstruction of Aceh and Nias (BRR). In 2008, a tsunami drill was 5
130 131 132
conducted in Banda Aceh. The drill showed that the capacity of these buildings is not sufficient to accommodate evacuees for a tsunami event similar to that of 2004.
133 134
FIGURE 3 Analysis Method (17)
135 136 137 138 139 140 141 142 143 144 145 146 147 148 149 150 151 152 153 154 155 156 157 158 159 160
The GIS-based approach included determining the population distribution, assessing the road network and transportation system, modeling flows to TEBs, and identifying restricted allocation areas and other constraints. Figure 3, "Analysis Method," shows the steps used to determine TEB locations. It uses a two-tiered process. The first involved applying the data and methods to the existing TEBs by defining service areas for TEBs based on travel time or distance. A network service area is a region that encompasses all accessible streets, that is, streets that lie within a specified impedance based on either a distance or a time cost. For instance, the 20-minute service area for a TEB includes all the streets that can be reached within 20 minutes from that TEB. The second level focuses on additional TEBs beyond the four existing buildings. Results of the modeling include proposed locations of additional escape buildings, capacity and service area of each building, and the evacuation route to the TEB for each center of population. The proposed locations for additional TEBs were again determined through network analysis. The capacities of additional TEBs were adjusted to meet the surplus demand. Accessibility analysis and network models were used to optimize spatial distribution of TEB locations. Evacuation routes can be further developed and refined for each service area. Tsunami travel time is an essential concept since it will limit the movement of evacuees in the evacuation process (17). Tsunami travel time is defined as the time for tsunami waves to travel from the source (epicenter) to a particular location in the coastal area (3). The International Tsunami Survey Team (ITST) surveyed the 2004 tsunami wave on west coast of Sumatra, and their analysis showed that the wave arrived in Simeulue, Meulaboh and some parts of Banda Aceh coast within 30-40 minutes (18) of the earthquake. TEBs need to be located within walking or running distance from population locations in tsunami hazard zones. The National Planning and Development Agency’s (Bappenas) masterplan of rehabilitation and reconstruction defines the reachable distance of 500m, 1000m, 1500m, and 2000m corresponding to the shortest travel time of 5, 10, 15, and 20 minutes respectively by elderly people, women and children (19). The time 6
161 162 163 164 165 166 167 168 169 170 171 172
parameters are decided through evacuee walking speed. For safety reasons, it is preferable that the speed be adjusted to the velocity of the elderly or disabled in areas where many such residents live. A walking speed for elderly people of 0.751 m/s is used in this analysis (19). Dewi (20) identifies four components of evacuation time which consist of: (i) decision time between event detection and the official decision to warrant an evacuation; (ii) evacuation warning, preparation time or the reaction time of the population (RT); (iii) and response time or actual response time (TTime) which is the time required for respondents to physically evacuate to safer areas. Additionally, the technical or natural warning signs (ToNW) will be determined by official decision time (IDT) and notification time (INT). Generally, human response can be based on natural or technical warning signs. It requires knowledge of tsunami warning signs like earthquake or sudden drop of sea level and the knowledge of what to do such as evacuation by community.
173 174
FIGURE 4 Time allocated for tsunami evacuation (20)
175 176
The evacuation time (ET) or response time of the population (TTime) can be calculated based on the following modified formula (20):
177 178 179 180 181 182 183 184 185 186 187 188 189 190 191 192
TTime= ETA – ToNW – RT ToNW= IDT + INT
193
RESULTS
194 195 196 197
Service area of tsunami evacuation building The TEB service area is defined as the capacity of travel time along a street network. During an evacuation, people will move away from their existing buildings to the TEBs. In general, evacuees will move in directions away from the direction of the tsunami movement. TEBs,
(I) (II)
where, TTime= Time required for people to evacuate; ETA = Estimated Tsunami Arrival (40 minutes); ToNW = Technical or Natural Warning (8 minutes); RT = Reaction Time of Population (10 minutes); IDT = Institutional Decision Time (Issuance from INA-TEWS, 5 minutes); INT = Institutional Notification Time (Issuance by local government, 3 minutes). These elements were incorporated to determine the coverage area of TEBs based on the evacuation time. The estimated time of tsunami arrival of 40 minutes refers to the experience in 2004. It took 8 minutes for the early warning system to sound, and 10 minutes as the reaction time, which leaves 22 minutes to travel to the shelter building. Based on the evacuation process, this 22 minute-evacuation time was split into 17 minutes to travel along the network to the shelter buildings and 5 minutes to get to the upper floor.
7
198 199 200 201 202 203 204 205
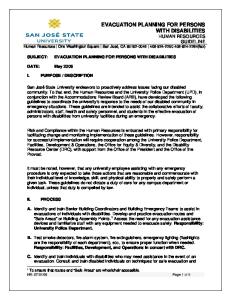
therefore need to be accessed by people who come from the coastal, but also allow people from the opposite direction to be evacuated if their distance was within 22 minutes. GIS tools were used to develop service areas based on the evacuation times to a TEB. The three different coverage areas included 5-minute, 17-minute, and 22-minute service area to access the TEB were mapped. Next, people accessing existing buildings were determined using GIS Network Analyst. Figure 5, "Existing TEB Service," shows the coverage area for the existing four TEBs. The analysis showed that most of the potentially affected people would not have time to access the building even within 22-minute maximum time available for evacuation.
206 207
FIGURE 5 Existing TEB Service Analysis
208 209 210 211
Based on the analysis of existing TEBs, an estimated 12,598 people or approximately 68% of the total population are exposed to the tsunami threat. Table 1, "Coverage of Existing TEB in Meuraxa," shows the population that could safely evacuate within the 5, 17, and 22minutes evacuation time.
212 213 214 8
215
TABLE 1 Coverage of Existing TEB in Meuraxa Building Name TDMRC
TEB1
TEB2
TEB3 Population Not Covered Grand Total
Time Access (minutes) 0-5 5 - 17 17 - 22 0-5 5 - 17 17 - 22 0-5 5 - 17 17 - 22 0-5 5 - 17 17 - 22
Evacuee 31 903 643 264 676 512 74 358 834 184 966 574 12598 18617
216 217 218 219 220 221 222 223 224 225 226 227 228 229 230
Additional tsunami evacuation buildings The next step was to estimate additional TEBs to be added and identify the populations to be evacuated from existing buildings. Data such as building footprints, tsunami inundation area, roads, village areas, district borders were collected from the Banda Aceh Municipality Planning and Development Agency. ArcGIS Network Analyst was used to allocate additional TEBs for high population density areas. The service areas were then developed by considering the 5-, 17-, and 2-2 minute travel times and two-way rule. Travel time ranges were used to determine the coverage areas for each TEB, and how many people would evacuate within the time range. Proposed TEBs were evaluated for suitability using land use maps and local knowledge of the community. A first cut analysis identified new TEBs based on under-served population clusters. These sites were evaluated and adjusted. After several iterations, the best locations to cover the at-risk population were determined. Figure 6, "Existing TEB and Additional TEB," shows existing TEBs locations in blue and the additional TEBs in green.
231 232 233 234 235
9
236 237
FIGURE 6 Existing TEB and Additional TEB
238 239 240 241 242 243 244 245 246 247 248 249
The final selection of TEBs included 12 new buildings to cover the total population exposed to tsunami threats. The needed capacity of the new proposed TEBs were based on the number of people in these service areas and the travel times based on movements from existing buildings to the new proposed TEBs. Table 2, "Additional and existing location of TEBs," contains the capacities of the existing and proposed TEBs for vertical evacuation. The largest space was calculated for TEB-ADD3 which could accommodate 1,766 people. On the other hand, the lowest capacity building was TEB2 which could hold approximately 320 people. With the proposed and existing TEB, all at-risk population would theoretically be able to evacuate to the closest shelters within the expected arrival time of tsunami generated by a near shore earthquake, comparable to that of the 2004 tsunami. The combined analysis of existing with additional TEBs showed a reconfiguration of evacuation destinations. The four existing TEBs will accommodate 4,035 people and the 12 additional TEBs will accommodate 14,582 people.
250
10
251
TABLE 2 Additional and existing location of TEBs in Meuraxa Building Name
Evacuee Capacity
TDMRC TEB1 TEB2 TEB3 TEB-ADD1 TEB-ADD2 TEB-ADD3 TEB-ADD4 TEB-ADD5 TEB-ADD6 TEB-ADD7 TEB-ADD8 TEB-ADD9 TEB-ADD10 TEB-ADD11 TEB-ADD12 Grand Total
1332 1218 320 1165 796 1301 1766 736 1189 1352 1515 1444 1498 738 1402 845 18617
Building Footprint 697 611 160 305 276 664 532 368 478 484 486 330 665 369 886 405 7716
Remarks
Existing
Additional
252 253 254 255 256 257 258 259 260 261 262 263 264 265 266 267 268
Closest Facility to TEBs Closest facility analysis was used to assign each building to existing or proposed TEBs. Routing was based on the shortest travel time using pedestrian travel. In previous research, the authors have conducted analysis on pedestrian walk speed and level of service (LOS) in urban areas to estimate the capacity of a facility to be able to handle pedestrian flow, delay, disruption, conflicts, and travel direction (21, 22). The location-allocation algorithm identifies the closest facility by using information on routes to assign origin points to the nearest TEB destinations. Location-allocation assists with the selection of TEBs from a set of TEBs based on their potential interaction with demand points. The objective is to minimize the overall distance between demand points and TEBs, maximize the number of demand points covered within a certain distance of TEBs, maximize an apportioned amount of demand that decays with increasing distance from a TEB, or maximize the amount of demand captured in an environment of friendly and competing TEBs. Figure 7, "Household Assignment to the Closest TEB" shows the assignment of evacuee origin points, which are footprint of building structures, to the closest TEBs. This technique is useful for evacuation planning and disaster drills as each household can be specifically assigned to a TEB.
11
269 270
FIGURE 7 Household Assignment to the Closest TEB
271 272 273 274 275 276 277 278 279 280 281 282 283 284 285 286 287 288
DISCUSSION The proposed locations for additional TEBs were determined through network analysis. Since a TEB is a destination for vertical evacuation, the characteristics of the 2004 tsunami and the elderly pedestrian walk speeds were used to determine the catchment areas of the existing TEBs. The capacities of additional TEBs were then adjusted to meet the surplus demand. In addition, accessibility analysis and network models were used to optimize the spatial distribution of TEB location. It was assumed that people will evacuate to the TEBs instead of leaving the area. Based on the analysis of existing TEBs, approximately 12,598 were not able to be accommodated, representing approximately 68 percent of the population in the area. Each TEB accommodated evacuees with 5, 17, and 22 minutes evacuation travel times for the people to reach the building. By adding 12 new TEBs the entire at-risk population in the area could theoretically be accommodated. The capacity of these additional TEBs varies both because of the number of people in the surrounding areas and the travel times. For example, the highest building capacity that will be able to accommodate 1,766 people and the lowest capacity will shelter 320 people. For TEBs to function properly there must also be extensive training and capacity building efforts. Evacuees need to be informed as to when the tsunami alerts and warnings have been issued. They need to know where to travel to and how to vertically evacuate. Building owners 12
289 290 291 292 293 294 295 296 297 298 299 300 301 302 303 304 305 306 307 308 309 310 311 312 313 314 315 316 317 318 319 320 321 322 323 324 325 326 327 328 329 330 331 332 333 334
and others need to support the movements of evacuees and ensure that buildings are accessible. One of the biggest challenges is managing the capacity of the structure to accommodate either additional evacuees or additional surplus capacity. Working out the protocol and operations in drills, exercises, and trainings will support real world events. It should be noted that although the entire area is exposed to the tsunami threat and would be under water in the advent of a tsunami similar to the 2004 event, it is difficult to predict exactly the location of all the people in the area. While this analysis is based on the assignment of population to building footprints, it should be noted that people could be in other locations at other times of the day. The modeling could be refined by more extensive surveying and estimates of population locations. There are other limitations to this analysis. It examined flooding extent and not flood depths. The impacts of flood depth on evacuation have been studied (23) and could be included if additional data become available. Underlying exposure is constantly changing. More growth and development in hazardous zones continue to occur. New migrants to the region increase diversity and complexity of building awareness and preparedness. There is need for updated training, exercises, and evaluation of plans. There are changes in urban development, roadway networks and transport system. Changes in the volume, modes of transport, accessibility and mobility add conceptual and modeling challenges. This analysis showed the complexities of siting TEBs. It is not always feasible to construct new buildings. Serving as an evacuation building may or not be consistent with other planned uses. It is difficult to convert existing buildings into new uses. For either reconstruction or retrofitting, owners and developers need early involvement in the process. Reconstruction of existing buildings may be more expensive but it may be the best option, especially if they are located in dense, heavily populated areas. TEBs should have structural attributes to withstand seismic forces, as well as hydrostatic, buoyant forces, hydrodynamic uplift, impulsive (surge), and debris impact. TEBs might also be used with other structures such as evacuation towers. An advantage of the TEB is that it can be used for other uses. The base can be used as a car park and designed to allow the tsunami to flow through it. Upper floors can be flexible use space. The roof can also be used as a temporary evacuation site or serve as a helipad for medical emergencies and supply center. TEB scan serve as a community center and build social capital. They can be used to promote awareness, preparedness and training on tsunami mitigation. Participation can foster a stewardship of the building and reduce maintenance costs. TEBs could serve too as mosques, schools, hospitals, offices, retail space and hotels. The Grand Mosque in Banda Aceh served as an evacuation site during the 2004 tsunami. Public buildings can be designed open staircases for easy access from the outside. Ramp and elevators with backup power can be used for evacuation of persons with disabilities and the elderly. TEBs raises two concerns. First, in order for them to be effective, there must be sufficient warning and alert so that people know to evacuate. Especially with short-notice events, occurring at challenging times of the day (such as the middle of the night, when most people are asleep), it may be difficult to execute evacuation plans. With vertical evaluation, there may be hardships for elderly, persons with disabilities, and populations with special needs. A second concern involves the “moral hazard” problem. The construction of the TEB may create a false sense of safety, that the area has “addressed” the tsunami risk problem. The TEB is but one of many different strategies for addressing tsunami risk. Construction of TEBs may further encourage greater densities and development in unsafe areas. It may also shift focus away from 13
335 336 337 338 339 340 341 342 343 344 345 346 347 348 349 350 351 352 353 354 355 356 357 358 359 360 361 362 363 364 365 366 367 368 369 370 371 372 373 374 375 376 377 378 379 380
prudent land use planning and other mitigation strategies. In this way, if not implemented carefully, TEBs can have unintended consequences which might potentially increase rather than lower tsunami risk. Complementary approaches need to be pursued in terms of tsunami risk reduction and the building of resilient communities. Structures, like sea walls can be constructed in coastal areas to reduce destructive energy of tsunami waves. Hardened structures such as walls, compacted terraces and berms, parking structures, and other rigid construction can block the force of waves. Blocking, however, may result in amplifying wave height in reflection or in redirecting wave energy to other areas (17). Buildings can be elevated or placed on berms and higher elevations. Building codes can be used to establish minimum standards of design, construction and material in order to avoid structural collapse under conditions of severe physical stressed caused by extreme natural phenomena. Land use controls and zoning are equally important for disaster mitigation (24). Building design, materials, and construction methods can reduce risks associated with hazards in the area(24). CONCLUSIONS All across the world, there are opportunities to study disasters such as the Indian Ocean Tsunami and learn from the responses to tragedy. The survivors have important lessons in response, recovery, mitigation and adaptation to ongoing risks. The lessons are important to both Indonesia and others around the world facing tsunamis and other hazards. Effective mitigation planning and preparedness needs to safeguard communities and the livelihoods of residents. Future development will be at risk if communities fail to address disaster risks with appropriate mitigation measures. Tool and approaches such as TEBs and understanding of evacuation behavior helps to build resilience. This study identifies the need for evacuation and proposed additional evacuation buildings which could be reached using existing roads and pathways. While evacuation sites are important, residents, emergency managers, organizational and community leaders, and government officials need to collectively manage needs, assets, capacities, and interests to build resilient communities. This study uses spatial information and pedestrian routes to evaluate and site evacuation locations and increase preparedness for future tsunamis. The Banda Aceh Spatial Plan 2009-2029 identified mitigation measures to minimize potential future disasters. Many measures emphasize structural solutions such as escape buildings, breakwaters and evacuation routes in the event of a tsunami. While non-structural measures such as zoning to restrict new development in hazard prone areas were identified, these have been difficult to design and implement. Non-structural measures are less visible and rely on government and other stakeholders to plan, zone, regulate, inspect, enforce, and maintain land use laws and building codes. Another tactic is to encourage best practices in designing tsunami resilient buildings and communities. Towards this end, the National Disaster Preparedness Training Center, housed at the University of Hawaii (ndptc.hawaii.edu) has developed training courses to build capacity in disaster risk reduction. Training and capacity building plays a significant role in reducing risks. There is need for continued research on integrating urban design, pedestrian planning and evacuation from flooding and other hazards (21, 22, 23). There is important knowledge and practical experience in urban planning, emergency management and transport engineering relevant to resilience. There needs to be both continuous learning and sharing of knowledge across disciplines to minimize the loss and impact of future disasters.
14
381 382 383 384 385 386 387 388 389 390 391 392 393 394 395 396 397 398 399 400 401 402 403 404 405 406 407 408 409 410 411 412 413 414 415 416 417 418 419 420 421 422 423 424 425
REFRENCES 1. USGS, Preliminary earthquake report 26 December 2004. U.S. Geological Survey, National Earthquake Information Center, World Data Center for Seismology, Denver. http://earthquake.usgs.gov/earthquakes/world/10_largest_world.php Accessed Dec 16, 2013. 2. Aitkenhead MJ, Lumsdon P, Miller DR, Remote sensing-based neural network mapping of tsunami damage in Aceh, Indonesia, 2007. 3. NTHMP, Designing for Tsunami - Seven Principles for Planning and Designing for Tsunami Hazards. National Tsunami Hazard Mitigation Program. USA, NOAA, USGS, FEMA, NSF, Alaska, California, Hawaii, Oregon, and Washington, 2001. 4. Scheer, S., Gardi, A., Guillande, R., Eftichidis, G., Varela, V., and de Vanssay, B.: Handbook of Tsunami Evacuation Planning, SCHE:MA ( Scenarios for Hazard induced Emergencies Management) Project, 2011. 5. JICA, The Study on the Urgent Rehabilitation and Reconstruction Support Program for Aceh Province and Affected Areas in North Sumatra, Japan International Cooperation Agency (JICA), Badan Perencanaan Pembangunan Nasional (Bappenas), and Provincial Government of Nanggroe Aceh Darussalaam, Banda Aceh, 2005. 6. Sangki Park, John W. van de Lindt, Rakesh Gupta, and Daniel Cox, Method to Determine Locations of Tsunami Vertical Evacuation Shelters, Natural Hazards: Journal of the international Society for the Prevention and Mitigation of Natural Hazards, DOI 10.1007/s11069-012-0196-3, 2012. 7. FEMA, Vertical Evacuation from Tsunamis: A Guide for Community Officials. FEMA P646A, 2009. 8. Jay Raskin, Yumei Wang, Marcella M. Boyer, Tim Fiez, Javier Moncada, Kent Yu, and Harry Yeh, Tsunami Evacuation Buildings (TEBs): A New Risk Management Approach to Cascadia Earthquakes and Tsunamis, 2009. 9. Yumei Wang, Tsunami Vertical Evacuation Refuge Activities in Oregon, Oregon Department of Geology and Mineral Industries (DOGAMI), Submitted to Federal Emergency Management Agency (FEMA), February 2012. 10. FEMA, A Whole Community Approach to Emergency Management: Principles, Themes, and Pathways for Action, FDOC 104-008-1 / December 2011. 11. David et. al., Resilience 2013, Survey & Report, IMR Group, Inc, 2013. 12. David Van Gasbeck, Catherine L. Feinman, Thad Allen, Resilience 2013, Survey & Report. http://www.domesticpreparedness.com/userfiles/reports/Resilience13.pdf Accessed Nov. 28, 2013. 13. Banda Aceh, Laporan Kependudukan Kota Banda Aceh, Jumlah Penduduk Menurut Golongan Umur,http://www.bandaacehkota.go.id/images/dokumen/JUMLAH%20PENDUDUK%2 02012.pdf Accesed Feb. 6, 2014. 14. Labattut et. al., (2011) Humanitarian action in cities: new challenges, new roles? Special Issue “Cities and Crises”. URD. 2011. 15. Mahdi, Saiful, City Population Changes in Post-Disaster Region: A Case of PostTsunami Aceh, Indonesia, Survey and Policy Analysis Research Group (SPARG), Program in Statistics, Department of Mathematics, Syiah Kuala University; International Centre for Aceh and Indian Ocean Studies (ICAIOS), Banda Aceh, Indonesia, 2012.
15
426 427 428 429 430 431 432 433 434 435 436 437 438 439 440 441 442 443 444 445 446 447 448 449 450 451 452 453 454
16. Maantay, J., & Maroko, A. (2009). Mapping urban risk: Flood hazards, race, & environmental justice in New York. Applied Geography, 29, 111-124 17. Budiarjo A., Evacuation Shelter Building Planning For Tsunami-Prone Area; A Case Study of Meulaboh City, Indonesia. International Institute for Geo-Information Science and Earth Observation., 2006. 18. Yalciner, A.C. et al. December 26, 2004 Indian Ocean tsunami field survey (Jan. 21-31, 2005) at North of Sumatra Island. UNESCO Intergovernmental Oceanographic Comission. http://ioc.unesco.org/iosurveys/Indonesia/yalciner/yalciner-et-al2005.pdf. Accessed Dec 17, 2013. 19. Bappenas, Master Plan for the Rehabilitation and Reconstruction of the Regions and Communities of the Province of Nanggroe Aceh Darussalam and the Island of Nias, Province of North Sumatera. Badan Perencanaan Pembangunan Nasional (Bappenas) Republik Indonesia, Jakarta, 2005. 20. Dewi, R, A-GIS Based Approach of Evacuation Model for Tsunami Risk Reduction. IDRiM Journal, 2. doi:10.5595/idrim.2012.0023, 2012. 21. Kim, K., Hallonquist, L. Settachai, N., and Yamashita, E. Walking in Waikiki, Hawaii: Measuring Pedestrian Level of Service in an Urban Resort District. In Transportation Research Record: Journal of the Transportation Research Board, No. 1982, Transportation Research Board of the National Academies, Washington, D.C., 2006, pp. 104-112. 22. Kim, K. and Yamashita, E. Urban Environmental Quality and Pedestrian Volumes. Presented at 90th Annual Meeting of the Transportation Research Board, Washington, D.C., 2011. 23. Kim, K. P. Pant, and E. Y. Yamashita. Evacuation planning for plausible worst case inundation scenarios in Honolulu, Hawaii. Journal of Emergency Management. (in press) DOI: 10.5055/jem.2014.0000 24. Fithri Farahnaz Saifa , Assessment on the Implementation of the Spatial Plan as a Tool for Disaster Prevention: A Case of Banda Aceh, Rotterdam, September 2009.
16