The Prince Edward Island Bioscience Cluster The Prince Edward Island Bioscience Cluster Economic Impact Analysis
Economic Impact Analysis March 2014
March 2014
Prepared by: Jupia Consultants Inc.
Prepared by: Jupia Consultants Inc.
Table of Contents Page Acknowledgements .......................................................................................................................................................2 Executive Summary .......................................................................................................................................................3 1. Introduction ...............................................................................................................................................................5 1.1 Purpose of this report ..........................................................................................................................................5 1.2 The economic impact model ...............................................................................................................................5 2. The PEI Bioscience Cluster: Summary profile ............................................................................................................7 3. Economic impact analysis of the PEI Bioscience Cluster .........................................................................................10 3.1 Economic impact model parameters .................................................................................................................10 3.2 Industry output and GDP impacts .....................................................................................................................11 3.3 Employment and labour income effects............................................................................................................12 3.4 Taxation effects .................................................................................................................................................13 3.5 Consumer spending effects ...............................................................................................................................14 4. The PEI Bioscience Cluster: Comparative review .....................................................................................................16 4.1 Bioscience and the PEI economy .......................................................................................................................16 4.2 The PEI Bioscience Cluster in the national context ............................................................................................20 5. The value proposition for bioscience on PEI ............................................................................................................22 5.1 Cluster elements ................................................................................................................................................22 5.2 Operating cost environment..............................................................................................................................22 5.3 The talent pipeline .............................................................................................................................................23 5.4 Supportive government .....................................................................................................................................24 5.5 The PEI living lab for bioscience .........................................................................................................................24 6. Conclusion: Bioscience and PEI in the years to come ..............................................................................................25 Appendix A: The Economic Impact Model ...................................................................................................................26 Appendix B: GDP comparison – PEI and Ontario ........................................................................................................27
The Economic Impact of Bioscience on Prince Edward Island
1
Acknowledgements This report was prepared for the Prince Edward Island BioAlliance with the financial support of Industry Canada and the Atlantic Canada Opportunities Agency.
The Economic Impact of Bioscience on Prince Edward Island
2
Executive Summary The PEI Bioscience Cluster is rapidly becoming a significant driver of the Prince Edward Island economy. In 2012, the industry directly employed 992 people and generated over $188 million worth of output. The cluster’s private sector revenue growth has been impressive rising from $62 million in 2006 to $124 million in 2012. Total employment increased by more than 50 percent over the same timeframe. The PEI Bioscience Cluster includes 37 bioscience companies, eight research institutions, and federal and provincial government departments and agencies (Section 2). These direct cluster participants are supported by dozens of companies up and down the supply chain on the Island. The Bioscience Cluster direct output and employment generates a significant economic impact on PEI including a $140 million boost to provincial GDP, over 1,700 jobs and nearly $92 million worth of labour income from direct, indirect and induced economic impacts (Section 3). The industry also supports an estimated $29.5 million worth of taxes not including any corporate income tax payments. The employment income generated by the industry supports nearly $69 million worth of consumer spending each year on PEI. PEI Bioscience Cluster Economic Impact Summary (2012) Output & GDP Impacts Direct industry output Direct & indirect GDP Total GDP*
$188.3 million $116.4 million $140 million
Employment and labour income supported on PEI Direct sector employment 992 Direct and indirect employment (FTE*) 1,514 Total employment on PEI (FTE)** 1,733 Employment multiplier 1.7 Direct & indirect labour income $ 82 million Total labour income supported on PEI** $ 91.9 million
Taxes generated on PEI Personal income tax (PIT) Harmonized sales tax (HST) Property taxes (residential) Indirect taxes*** Total taxes Taxes as a percentage of GDP
$ 14.2 million $ 7.3 million $ 2.4 million $ 5.6 million $ 29.5 million 21.1%
Estimated consumer spending on PEI Total consumer spending Food expenditures Shelter Transportation Health and personal care Recreation
$ 68.9 million $ 10.8 million $ 14.7 million $ 14.6 million $ 4.1 million $ 7.8 million
*Full time equivalent employment. **Total employment includes indirect and induced effects. ***See Section 3.4 for a definition of indirect taxes. The PEI Bioscience Cluster’s GDP contributes more to the Island economy than the seafood product preparation and packaging and fishing sectors combined. The bioscience sector generates a similar level of GDP compared to the banking sector and the accommodation and food services sector. The PEI Bioscience Cluster GDP contribution (including direct, indirect and induced effects) represents 2.7 percent of total GDP on the Island (Section 3.2). The PEI Bioscience Cluster generates well above average wages (Section 3.3). In 2012, the average salary in the cluster was 40 percent higher than for an average worker across Prince Edward Island. The Economic Impact of Bioscience on Prince Edward Island
3
Executive Summary (cont.) Private sector revenue in the PEI Bioscience Cluster has been growing at a rate of 33 percent per year since 2006 compared to four percent for the economy as a whole (Section 4.1). The cluster is a fast growing export revenue generator for the PEI economy. Bioscience-related exports from PEI are up 147 percent between 2004 and 2013 compared to 39 percent for all exports from the Island. PEI ranks third in Canada among the 10 provinces for per capita pharmaceutical and medicine exports and second for exports of other basic organic chemical manufacturing (Section 4.2). The PEI Bioscience Cluster is research-intensive generating $65 million worth of R&D spending in 2011 or some 35% of total cluster output (Section 4.1). Across the PEI economy, R&D spending represents less than two percent of GDP. The PEI Bioscience Cluster is rapidly developing a skilled labour pool (Section 4.2). In 2011, the PEI labour market had a higher percentage of biologists and related scientists, biological technologists and technicians, veterinarians, animal health technologists and veterinary technicians than any of the other 10 provinces. PEI also has a higher percentage of chemists in its workforce compared to most other provinces in Canada. Only Quebec and Ontario have more chemists relative to the size of the workforce. The value proposition for investment into the PEI Bioscience Cluster has been strengthened in recent years by the work of the PEI BioAlliance supported by a number of key stakeholders including: the University of Prince Edward Island, Holland College, Innovation PEI (provincial government), Atlantic Canada Opportunities Agency, National Research Council, Agriculture and Agri-Food Canada, the Prince Edward Island AgriAlliance Inc. and BIO|FOOD|TECH (Section 5). In addition to the growing labour pool and cluster support, bioscience firms can take advantage of one of the most competitive operating cost environments in North America and Europe (Section 5.2). The 2014 KPMG Competitive Alternatives report recently concluded that a typical bio-related research and development facility in Boston will face a cost environment 43 percent higher than in Charlottetown. Other bioscience clusters in places such as Montreal, San Diego and Raleigh, North Carolina also face much higher cost environments compared to Prince Edward Island. Prince Edward Island needs growth industries to provide tax revenues and good quality career opportunities. The PEI Bioscience Cluster is well positioned for continued growth well into the future.
The Economic Impact of Bioscience on Prince Edward Island
4
1. Introduction 1.1 Purpose of this report The objective of the project is to estimate the economic contribution of the bioscience sector to the Prince Edward Island economy including direct, indirect, and induced economic activity. This report provides data on sector output and gross domestic product (GDP) as well as employment, employment income, taxation and consumer spending. In addition, the report includes a broader set of data to tell the story of the contribution the PEI Bioscience Cluster makes to the Island economy. The bioscience sector has been a significant new driver of the provincial economy over the past decade. There has been substantial growth in sector revenue, GDP contribution and exports. In addition, the sector has added hundreds of well-paid and highly skilled workers. Prince Edward Island now has a higher concentration of biologists, biological technologists, veterinarians and animal health technologists than any other province in Canada relative to the size of its labour market (see Section 5 below for details). From international exports to immigration, the PEI Bioscience Cluster has become an example of how a focused effort can drive economic growth and prosperity even in smaller markets that are outside the geographic orbit of North America’s big bioscience clusters. The industry’s stakeholders, led by the PEI BioAlliance, have deliberately internationalized the cluster and as a result it is attracting firms, talent, investment and technology from around the world. This report also briefly discusses the value proposition for the PEI Bioscience Cluster. The ‘case’ for this sectors’ investment on the Island has been significantly strengthened in recent years due to strategic investments in research and support infrastructure and cluster development. As measured by international exports per capita, PEI is nipping at the heels of both Quebec and Ontario - the dominant bioscience clusters in Canada.
1.2 The economic impact model The primary purpose of this report is to develop an economic impact model estimating the contribution of the bioscience cluster to the economy of Prince Edward Island. The economic impact model is based on Statistics Canada’s Input-Output (I-O) tables that provide a detailed profile of how expenditures in specific sectors flow through the provincial and national economy as well as by international trade. The I-O tables are developed using actual spending patterns within specific industries and provinces and therefore estimates of new economic activity are based on the expenditure profile of previous activity in those industries. If there is reason to believe a certain project will dramatically deviate in its expenditure profile, the efficacy of the Input-Output tables as predictor of economic impact should be called into question. There is no reason to believe this is the case with the firms and industries reviewed in this report.
The Economic Impact of Bioscience on Prince Edward Island
5
The economic impact model evaluates the direct, indirect, and induced economic impacts, using the following parameters: •
Direct impact measures the value added to the economy from the industry that is attributed directly from the employees, the wages earned, and the revenues generated. In certain cases, direct impacts are not published by Statistics Canada due to privacy considerations.
•
Indirect impact measures the value-added the bioscience sector generates within the PEI economy through the firm and organizational demand for intermediate inputs or other support services (e.g. the supply chain).
•
Induced impacts are derived when employees in the aforementioned industries spend their earnings and owners spend their profits. These purchases lead to more employment, higher wages, and increased income and tax revenues, and can be felt across a wide range of industries.
The I-O tables trace the impact of economic activity (output shock) on the provincial and national economies (including imports and exports). In addition to the output, GDP and employment impacts, the economic impact model estimates the amount of tax revenue supported by the industry as well as consumer spending impacts. NOTE: Due to the size of the economy on Prince Edward Island, for many industries the direct multipliers are unavailable (due to confidentiality concerns). However, the combined direct and indirect multipliers are available and are used in this report. Table 1: The Economic Impact Model Direct effect -within province (where available)
Simple multipliers (direct and indirect) - within province and rest of Canada
Output GDP basic price Labour income Jobs International imports Export shares
Output GDP basic price Labour income Jobs International imports
Total multipliers (direct, indirect and induced) - within province and rest of Canada Output GDP basic price Labour income Jobs International imports
There are over 200 industries for which detailed I-O data is available. Each firm and organization in the PEI Bioscience Cluster has been assigned to its most relevant industry classification (using the NAICS classification 1 system ) and the spending of those organizations has been analyzed to determine economic impacts. Because many firms in the cluster are pre-production or research and development intensive, they are classified in the economic impact model as being in an R&D phase. This is an important distinction because the multiplier effects can be significantly different depending on how the firms are classified. Finally, it is important to point out that no company-specific information is included in this report nor can it be inferred from the data. The report is meant to derive the overall economic impact of the bioscience sector on PEI.
1
North American Industrial Classification System (NAICS).
The Economic Impact of Bioscience on Prince Edward Island
6
2. The PEI Bioscience Cluster: Summary profile In the last decade, the bioscience cluster on Prince Edward Island has exhibited robust growth. Between 2006 and 2012, private sector revenue more than doubled from $62 million to $124 million. Total employment increased by more than 50 percent over the same timeframe. There are now approximately 1,100 direct employees in the sector (as of 2014).
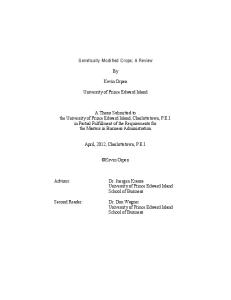
Figure 1: Percentage share of international exports from Atlantic Canada (2013) NAICS 32541 - Pharmaceutical and Medicine Manufacturing
According to Statistics Canada, the sector spent some $65 million on research and development in 2011. The PEI Bioscience Cluster includes 37 bioscience companies, eight research institutions, and federal and provincial government departments and agencies. These direct cluster participants are supported by hundreds of companies up and down the supply chain on the Island. There are several challenges when attempting to compare the bioscience sector in one jurisdiction to another. This is because there is not a standard definition of what firms and industries are included in the bioscience industry and much of the data at the provincial level is suppressed for confidentiality reasons.
NAICS 32519 - Other Basic Organic Chemical Manufacturing
However, using international exports as a proxy, it is clear the PEI bioscience sector is starting to pull away from the other three provinces in Atlantic Canada. Two of the principal industries representing bioscience product exports are: NAICS 32541 - Pharmaceutical and Medicine Manufacturing 2 and NAICS 32519 - Other Basic Organic Chemical Manufacturing . In 2004, pharmaceutical and medicine manufacturing exports from PEI represented 48 per cent of the Atlantic Canadian total. In 2013, the $36.5 million worth of exports in this sector from Prince Edward Island represented 71 percent of the Atlantic Canada total. In 2013, PEI also generated 44 percent of total Atlantic Canada exports from NAICS 32519 Other Basic Organic Chemical Manufacturing.
Source: Statistics Canada
The significant level of research and development occurring right now in the PEI bioscience sector should translate into continued revenue growth into the future.
2
Medical devices, equipment and supplies manufacturing are a significant part of Canada’s bioscience exports but Atlantic Canada only generates a marginal share of exports in these segments.
The Economic Impact of Bioscience on Prince Edward Island
7
The Prince Edward Island Bioscience Cluster is made up of a diverse mix of local, national and international firms supported by local education and research institutions. Companies such as BioVectra, Novartis Animal Health and Sekisui operate significant export-based businesses on the Island. The mix of local and international early stage companies are attracting private capital and expanding employment and revenue. According to the PEI BioAlliance, over a dozen companies and technologies located in other parts of Canada and internationally are currently in a pre-incubation relationship with the BioAlliance. Between 2010 and 2012, the PEI Bioscience Cluster attracted over $22.5 million per year worth of follow-on investment into existing firms. Table 2 shows the breakdown of firms and organizations in the PEI Bioscience Cluster by employment size. There are 28 firms and organizations with fewer than five employees, 12 with between five and 19 employees, four with between 20 and 99 employees and four with 100 or more employees. Table 2: PEI Bioscience Cluster firms/organizations by employment size (2012) PEI Bioscience Cluster 27
% of total 58%
All firms on PEI 51%
5 to 19 employees
12
25%
37%
20 to 99 employees
4
8%
11%
100+ employees
4
8%
2%
Total organizations
47
Less than five employees
Sources: PEI bioscience firms and organizations supplied by the PEI BioAlliance. All firm employment breakdown on PEI taken from Statistics Canada Canadian Business Patterns for 2012.
Key to the success of the industry – and its future potential – is the network of education, research and support infrastructure supporting the private sector firms. These include the National Research Council Canada (NRC), University of Prince Edward Island (including Atlantic Veterinary College), Holland College, Bio-Food-Tech, and Agriculture and Agri-Food Canada. The PEI Bioscience Cluster focuses on four main segments as shown in Figure 2 below. Building on the province’s farming and fishing heritage, the bioscience sector has considerable strengths in fish and animal health products and services. Also building on the province’s agricultural base, the personal health and functional ingredients segment has considerable potential. There is also a number of firms in the biopharmaceutical, medical and diagnostic device segment. Finally, several firms are offering contract services to clients locally, nationally and internationally.
The Economic Impact of Bioscience on Prince Edward Island
8
Figure 2: Target market segments of PEI Bioscience Cluster companies
The Economic Impact of Bioscience on Prince Edward Island
9
3. Economic impact analysis of the PEI Bioscience Cluster 3.1 Economic impact model parameters The PEI BioAlliance provided 2012 data on firm and organization employment and ‘output’ – defined as either total revenue (for established firms and organizations) or total expenditures (for pre-commercial firms). Using input from the BioAlliance, the firms and organizations were segmented into appropriate four-digit NAICS industry groups to provide an accurate assessment of their economic impact. Table 3 shows a list of industries used in the model. There are 37 private sector firms and eight entities supporting the cluster including the PEI BioAlliance, Atlantic Veterinary College, Bio Food Tech, Agriculture & AgriFood Canada, National Research Council, UPEI-Science Faculty, Holland College-Bioscience Technology and Canada's Smartest Kitchen. Table 3: Industries included in the economic impact model Industry code: BS112500 BS111A00 BS311900 BS325400 BS333100 BS339100 BS541700 BS541700 BS541900 BS813000 GS611200
Description: Aquaculture Crop production Food product manufacturing Pharmaceutical manufacturing Manufacturing of bioscience-related equipment Medical device manufacturing Research and development Research and development Other professional services Industry association Post-secondary education
Once segmented into their proper industry group, each firm was analyzed to determine its indirect and induced employment on PEI; direct, indirect and induced gross domestic product (GDP) impact and other impacts. It should be noted that only one company was included in each of the Aquaculture, Crop Production, and Food Product Manufacturing sectors. Those companies utilize specific bioscience-based technologies that differentiate them from more traditional businesses in those sectors. Normally, the PEI BioAlliance does not include companies in those sectors in its assessment of the size and impact of the sector.
The Economic Impact of Bioscience on Prince Edward Island
10
3.2 Industry output and GDP impacts In 2012, the PEI bioscience cluster generated $188.3 million worth of industry output. Of that output, $135.9 million was generated by private sector firms or 72 percent of the total. The cluster directly generates 2.1 percent of the total Island economic output up from just over one percent in 2006. In 2012, the $188.3 million worth of output generated by bioscience sector on PEI (private, public and education sectors combined) was more output than the arts, entertainment and recreation sector ($76.5 million), the fishing sector ($106.7 million), the wholesale trade sector ($131.5 million) or the animal production sector ($158.5 million). In addition, because of its rapid growth, bioscience industry output is closing in on one of the most important industries on the Island - the seafood product preparation and packaging industry - which generated an estimated $214 million worth of industry output in 2012.
Figure 3: Selected PEI industries by annual output (2012) $Million Crop production
$331.2
Seafood product preparation and packaging
$214.6
Bioscience Cluster
$188.3
Animal production Fishing, hunting and trapping Accommodation services Arts, entertainment and recreation
$158.5 $106.7 $92.0 $76.5
Sources: PEI Bioscience Cluster private sector revenue supplied by the PEI BioAlliance. Other industry output derived from Statistics Canada CANSIM Table 381-0031.
Gross domestic product (GDP) represents the value added from industry output that stays on Prince Edward Island. In 2012, the $188.3 million worth of industry output generated by the PEI Bioscience Cluster resulted in $116.4 million worth of GDP directly and in its supply chain on PEI. Including induced economic effects on PEI, the industry generated an estimated $139.9 million worth of GDP on PEI (Table 4). Table 4: Bioscience industry output and GDP on PEI (2012) Direct industry output
$
188,267,531
Direct & indirect GDP
$
116,377,888
Total GDP*
$
139,857,428
*Combined direct, indirect and induced effects. Derived using Statistics Canada’s I-O Tables at the M level (2009) and other Statistics Canada CANSIM tables relating to taxation and spending. See Appendix A for a full source list.
NOTE: Smaller provinces such as PEI have more economic ‘leakage’ than larger provinces. For example, if the industry needs to purchase equipment, technology or expertise it may have to look off-Island for these goods and services. Even if manufactured goods can be purchased from a PEI-based supplier, it is likely the value added from manufacturing has occurred elsewhere. This is not just the case for the PEI Bioscience Cluster. See Appendix B for a comparison of GDP creation on Prince Edward Island compared to a larger province, Ontario.
The Economic Impact of Bioscience on Prince Edward Island
11
The bioscience sector’s direct and indirect (supply chain) GDP contributes more to the Island economy than the seafood product preparation and packaging and fishing sectors combined. The bioscience sector generates a similar level of GDP compared to the banking sector and the accommodation and food services sector. Total PEI Bioscience Cluster GDP (including direct, indirect and induced effects) represents 2.7 percent of total GDP on the Island.
3.3 Employment and labour income effects The PEI Bioscience Cluster has become an important employer on the Island. In 2012, it employed 992 people at well above industry average wages. This represented 154 out of every 10,000 workers across Prince Edward Island. Including indirect and induced employment effects, 270 out of every 10,000 jobs on the Island are supported by the PEI Bioscience Cluster. Figure 4 shows the number of persons employed by the PEI Bioscience Cluster relative to other sectors of the economy. It should be noted the Bioscience Cluster generates almost as much GDP as the accommodation and food services sector with 80 percent fewer workers. This is primarily because of the high levels of employment income in bioscience sectors compared to accommodation and food services.
Figure 4: Selected PEI industries by employment (2012) Per 10,000 employed the overall workforce Accommodation and food services
892
Wholesale trade
306
Bioscience Cluster - total effects*
270
Banking sector
169
Bioscience Cluster - direct
154
Arts, entertainment and recreation
143
Residential building construction
110
*including indirect and induced employment supported by the Bioscience Cluster. Sources: PEI Bioscience Cluster private sector revenue supplied by the PEI BioAlliance. Other industry employment taken from Statistics Canada CANSIM Table 381-0031.
A significant percentage of the jobs in the cluster require highly skilled workers which pushes up average wages. The total wage bill (labour income) generated directly and indirectly by the cluster on PEI in 2012 was $82 million. Including induced economic effects, the total labour income supported by the industry rises to $91.9 million. Table 5: PEI Bioscience Cluster employment and labour income supported on PEI (2012) Direct sector employment Direct and indirect employment (FTE*) Total employment supported on PEI (FTE)** Employment multiplier Direct & indirect labour income Total labour income supported on PEI**
992 1,514 1,733 1.7 $81,955,587 $91,888,683
*Full time equivalent employment. **Combined direct, indirect and induced effects. Derived using Statistics Canada’s I-O Tables at the M level (2009) and other Statistics Canada CANSIM tables relating to taxation and spending. See Appendix A for a full source list.
The Economic Impact of Bioscience on Prince Edward Island
12
Figure 5 shows the average annual labour income generated by the PEI Bioscience Cluster compared to other industries on the Island. Only the public administration sector offers a higher average wage than the PEI Bioscience Cluster. The average wage for a bioscience sector worker is 40 percent higher than for an average worker across Prince Edward Island. The average wage is more than double that in the accommodation and food services or retail trade sectors on the Island. Figure 5: Average annual employment income comparison (2012) Public administration Biosciences cluster* Wholesale trade Finance and insurance Educational services Banking services Manufacturing Professional, scientific & tech services Construction All industries Administrative and support services Retail trade Accommodation and food services
$56,505 $54,150 $48,888 $48,236 $45,234 $44,645 $43,219 $43,215 $42,116 $38,589 $27,511 $25,820 $17,598
*Average annual employment income (direct and indirect) for the bioscience sector in 2012. Average annual employment income for other sectors taken from Statistics Canada CANSIM Table 281-0027.
3.4 Taxation effects Driven mainly by the large amount of employment income, the bioscience sector provides an above average amount of tax revenue to governments. Table 6 shows the estimated total taxes generated by the PEI Bioscience Cluster in 2012. The industry contributed over $14.2 million in personal income tax (PIT) to federal and provincial governments as well as nearly $7.3 million worth of harmonized sales taxes (HST). Local governments on PEI benefitted from over $2.4 million worth of residential property taxes in 2012. Finally, indirect taxes generated from the PEI Bioscience Cluster accounted for $5.6 million worth of revenue to federal and provincial governments.
Figure 6: Taxes generated by the PEI Bioscience Cluster (% of total) HST 25% PIT 48% Indirect taxes 19%
Property tax 8%
In total, taxes generated by the PEI Bioscience Cluster were equivalent to 21.1 percent of GDP.
The Economic Impact of Bioscience on Prince Edward Island
13
Table 6: PEI Bioscience Cluster taxes generated on PEI (2012)* Personal income tax (PIT)
$14,242,746
Harmonized sales tax (HST)
$7,259,206
Property taxes (residential)
$2,422,543
Indirect taxes**
$5,610,735
Total taxes
$29,535,230
Taxes as a percentage of GDP
21.1%
*Combined direct, indirect and induced effects. Derived using Statistics Canada’s I-O Tables at the M level (2009) and other Statistics Canada CANSIM tables relating to taxation and spending. See Appendix A for a full source list. **In addition to non-refundable HST, indirect taxes include business-related property taxes, fuel taxes and other fees and levies. Note that corporate income tax is not included in the model nor is the impact of any R&D-related income tax incentives or subsidies. NOTE: The bioscience sector on PEI generates tax revenue in other provinces. This additional revenue for federal and provincial governments was not included in the economic impact model.
3.5 Consumer spending effects The employment income generated by the bioscience sector on PEI in 2012 supported a wide variety of consumer spending on the Island. Table 7 shows the estimated direct, indirect and induced consumer spending activity supported by the industry by major expenditure category. The figures are based on the average household expenditures on PEI and on the assumption that the industry’s employment income would be spent in a similar pattern to the average household across the Island.
Figure 7: Consumer spending generated by the PEI Bioscience Cluster (% of total)
In total, the employment income generated by the cluster supported nearly $69 million worth of consumer spending during the year. This included $10.8 million on food (groceries and restaurants), over $14.6 million in housing-related expenditures such as mortgage payments, utilities and furniture and over $14.5 million on transportation costs that are mostly related to vehicle purchases, operations and maintenance. As shown in Table 7, the industry supported $6.5 million worth of spending on insurance and retirement savings and another $4 million on health and personal care.
The Economic Impact of Bioscience on Prince Edward Island
14
Table 7: Estimated consumer spending from the PEI bioscience economic activity on PEI (2012) Total consumer spending Food expenditures Food purchased from stores Food purchased from restaurants
$68,860,793 $10,765,239 $7,817,454 $2,947,785
Shelter Water, fuel and electricity for principal accommodation Household operations Communications Household furnishings and equipment
$14,654,926 $4,234,641 $5,338,940 $2,303,797 $2,285,877
Clothing and accessories Transportation
$4,716,232 $14,567,568
Health and personal care
$4,052,084
Recreation
$7,823,054
Education
$1,115,499
Personal insurance payments and pension contributions
$6,509,318
Gifts of money, support payments and charitable contributions
$2,264,598
Source: Derived using Statistics Canada’s I-O Tables at the national M level (2009) and CANSIM Table 203-0021 Survey of household spending (SHS), household spending (2010). See Appendix A for a full source list.
The Economic Impact of Bioscience on Prince Edward Island
15
4. The PEI Bioscience Cluster: Comparative review 4.1 Bioscience and the PEI economy A much needed fast growing industry The PEI provincial government is facing increasing costs associated with health care and other public services and the Island’s residents are used to relying on high quality public infrastructure. In order to maintain high quality public services and infrastructure, the government will need at least a moderate level of economic growth for the foreseeable future. Demographic forces are further complicating the province’s growth potential. Prince Edward Island needs growth industries and it needs to attract a new wave of population to counterbalance demographic trends. However, the Island does not have the oil and gas revenues that are driving much of the economic growth elsewhere in Canada. While natural resources that support agriculture and fisheries are an important part of the Island economy, the upside revenue growth potential is limited without innovative new supply chains with valueadded emphasis, perhaps enabled by bioscience technologies. In addition, federal government transfer payments to Prince Edward Island are not as significant as they have been in the past. In 2006-2007, PEI received $989 out of every $100,000 worth of federal transfer payments to provincial and territorial goverments combined. By 2014-2015, that had dropped by 16 percent to $833 out of every $100,000 worth of transfers. The major federal transfer payments to PEI have dropped from 37 percent of total revenue a 3 decade ago to 33 percent in the 2013-2014 budget . A number of the big traditional industries on Prince Edward Island have been growing slowly or not at all in recent years. For example, over the past decade the accommodation and food services sector, the core of the tourism sector on PEI, has been growing by a modest 2.4 percent per year in nominal terms.
Figure 8: PEI industry output growth (2006-2012) average annual growth rate (%) PEI biosciences cluster private sector revenue
All industries combined
Accommodation and food services
+33%
+4%
+2.4%
Sources: PEI Bioscience Cluster private sector revenue growth supplied by the PEI BioAlliance. The growth rate of provincial gross output by sector uses basic prices expressed in current dollars. Statistics Canada CANSIM Tables 381-0016 and 3810031.
By contrast, private sector revenue from the bioscience sector has been growing by 33 percent per year (between 2006 and 2012). At its current growth rate, the bioscience sector will generate more output than the accommodation and food services sector by 2015 or 2016. The industry is positioned to sustain this rapid growth rate. There are a number of early stage firms with rapid growth potential in the cluster and several of the larger firms are growing strongly. Cluster development efforts are showing results. 3
These include Canada Health Transfer, Canada Social Transfer and Equalization.
The Economic Impact of Bioscience on Prince Edward Island
16
A driver of international exports The PEI bioscience sector is a major contributor to the Island’s export revenues. As discussed above the bioscience sector cuts across many different industries and as such it is difficult to get a complete picture of the sector’s export profile. This is further complicated by the sporadic and incomplete data on service-based exports. However, there are a number of sectors that are bioscience-related and help define the export profile of the PEI Bioscience Cluster. The three main sectors that are bioscience-related are NAICS 32541 - Pharmaceutical and Medicine Manufacturing, NAICS 32519 - Other Basic Organic Chemical Manufacturing and NAICS 33451 Measuring, Medical and Control Instruments Manufacturing. All three of these sectors have expanded the value of international exports over the past decade.
Figure 9: Percentage change in the total value of product exports (2004-2013) 147%
39%
Biosciences-related exports
Total exports (all industries)
As detailed in Table 8: Source: Statistics Canada.
The value of pharmaceutical and medical manufacturing exports has increased by nearly $20 million over the decade. In total, the five sectors listed below have witnessed a 147 percent growth rate in the value of international exports compared to 39 percent for all PEI industries combined. The relative share of biosciencerelated exports has increased by 78 percent over the last decade. Table 8: Total value of bio-based international merchandise exports from PEI ($000s) – 2004 and 2013 Industry: 32541 - Pharmaceutical and Medicine Manufacturing 32519 - Other Basic Organic Chemical Manufacturing 33451 - Measuring, Medical and Control Instruments Manufacturing 32599 - All Other Chemical Product Manufacturing 32561 - Soap and Cleaning Compound Manufacturing Sub-total: Bioscience-related exports % of total provincial merchandise exports Total exports (all industries)
2004 $16,618 $6,768 $2,448 $696 $65 $26,594
2013 $36,437 $20,648 $3,652 $2,431 $2,426 $65,594
4.0%
7.1%
$666,830
$926,117
% change +119% +205% +49% +250% +3639% 147%
+39%
Source: Statistics Canada data as published by Industry Canada’s Trade Data Online. As discussed above, there is good reason to believe the bioscience sector will continue to drive export growth in the coming years bringing new revenue to Prince Edward Island increasing employment, consumer spending and taxation.
The Economic Impact of Bioscience on Prince Edward Island
17
A research and development intensive industry The PEI Bioscience Cluster is research-intensive. According to Statistics Canada, the sector spent $65 million on research and development in 2011 which represents 35 percent of direct spending and is equivalent to 48 percent of total sector GDP. Across the PEI economy, R&D spending represents less than two percent of GDP. Statistics Canada tracks gross domestic expenditures on research and development (GERD) in each of the 10 provinces and the national capital region. The most recent data is for 2011. Prince Edward Island generates the second least amount of GERD per capita among the 10 provinces in Canada but its growth rate since 2004 has been the second fastest among the provinces. Between 2004 and 2011, total spending on GERD rose by 48 percent (Figure 10). There can be no doubt the PEI Bioscience Cluster has driven most of the R&D spending growth on the Island in the past few years. Figure 10: Percentage change in gross domestic expenditures on research and development (GERD) - 2004-2011 Newfoundland and Labrador
+70%
Prince Edward Island
+48%
New Brunswick
+26%
Saskatchewan
+22%
Manitoba
+22%
British Columbia
+19%
Nova Scotia
+11%
Alberta
+5%
Ontario
+5%
Quebec
+2%
Excluding the national capital region. Source: Statistics Canada CANSIM Table 358-0001.
NOTE: Medical schools are the catalyst for a significant percentage of national R&D spending in Canada. If human health-related R&D spending were excluded from GERD, PEI would rise in the provincial rankings.
Attracting national and international investment to PEI The PEI bioscience cluster has been an important catalyst for the attraction of national and international investment to Prince Edward Island. According to the PEI BioAlliance, of the 37 companies currently operating within the cluster, 14 are early stage companies whose technologies and management were recruited from outside the province, and three were small to medium-sized businesses purchased by multinationals that have since expanded those businesses on Prince Edward Island. The bioscience start-up firms in the PEI cluster are also attracting capital. Between 2010 and 2012, the PEI Bioscience Cluster attracted over $54 million worth of followon investment each year.
The Economic Impact of Bioscience on Prince Edward Island
18
Attracting skilled talent to PEI The PEI Bioscience Cluster has been a magnet for highly skilled talent from across Canada and beyond. Anecdotally, firms and organizations have indicated they are recruiting specialized workers to fill scientist and technician roles.
Figure 11: Percentage of PEI workforce employed in NAICS 54 Professional, scientific and technical services 10.6%
The National Household Survey (NHS) taken in 2011 provides an indication of this inward migration of skilled workers. The NHS provides a breakdown of the PEI workforce by industry and by immigrant and non-immigrant population. Figure 11 shows the percentage of PEI nonimmigrant and immigrant populations working in NAICS 54 professional, scientific and technical services. In 2011, there were 3,245 immigrants in the PEI workforce of which 425 (10.6 percent) were working in NAICS 54. There are 2.5 times as many immigrants working in this sector relative to the total employed population compared to the non-immigrant population.
4.0%
Percentage of nonimmigrant workforce employed in NAICS 54
Percentage of immigrant workforce employed in NAICS 54
Source: Statistics Canada 2011 National Nationally, there is also a higher percentage of the Household Survey. immigrant workforce employed in professional, scientific and technical services (8.9 percent compared to 6.4 percent among the non-immigrant workforce). The higher percentage of immigrants working in professional and scientific industries on PEI is an indication the bioscience sector is attracting skilled talent to the Island.
The Economic Impact of Bioscience on Prince Edward Island
19
4.2 The PEI Bioscience Cluster in the national context Prince Edward Island represents only 0.4 percent of Canada’s population and 0.3 percent of its economic output. On an absolute basis, its bioscience cluster is small in the national context. However, on a relative basis or adjusted for population size, the PEI cluster is becoming a force on the national stage.
Figure 12: Biologists and related scientists per 10,000 in the labour market 19.7
There are a number of indicators that reveal how the PEI Bioscience Cluster has developed in the past decade to become a relatively important force in the national bioscience industry.
12.7
Bioscience-related talent clustering For example, across a number of bioscience-related technical occupations, PEI has a larger share of employment than most Canada Prince Edward Island other provinces in Canada. There are just under 20 biologists and Source: Statistics Canada 2011 National related scientists (NOC 2121) on PEI for every 10,000 persons in Household Survey. the overall provincial labour market (or one out of every 510 workers on PEI) (Figure 12). On a relative basis, this means there are 55 percent more biologists and related scientists on PEI than across Canada as a whole. Table 10 provides a comparison for selected bioscience-related occupations in the 10 provinces across Canada. PEI has more biologists and related scientists relative to the size of its overall labour market than all other provinces in Canada. It also has the most biological technologists and technicians (NOC 2221) and by far the most veterinarians and animal health technologists and veterinary technicians (NOCs 3114 and 3214) compared to other provinces. PEI also has a higher percentage of chemists (NOC 2112) in its workforce compared to most other provinces in Canada. Only Quebec and Ontario have more chemists relative to the size of the workforce. This clustering of talent will be helpful as the industry continues to grow in the years ahead. Table 10: Persons working in bioscience-related occupations per 10,000 in the overall labour market Occupational Group: NOC 2112 Chemists
PE 10.9
NL 2.5
NS 5.2
NB 4.1
QC 11.4
ONT 11.5
MB 6.3
SK 3.9
AB 7.2
BC 5.9
NOC 2121 Biologists and related scientists
19.7
14.4
12.7
15.6
12.9
10.3
16.4
15.8
11.6
16.3
NOC 2221 Biological technologists & technicians
19.7
11.7
8.0
11.6
6.1
4.8
9.5
8.5
4.9
7.6
NOC 2222 Agricultural & fish products inspectors
15.3
5.0
1.8
4.1
3.6
2.5
4.9
3.2
3.5
2.8
NOC 3114 Veterinarians
14.6
2.5
4.9
4.0
5.0
5.8
5.8
6.7
6.2
5.7
NOC 3213 Animal health technologists and veterinary technicians
17.5
2.3
7.3
7.0
7.6
8.6
10.0
7.1
7.7
8.8
Source: Statistics Canada 2011 National Household Survey.
The Economic Impact of Bioscience on Prince Edward Island
20
International exports Prince Edward Island’s bioscience cluster is among the leaders among the 10 provinces across Canada for international exports in two top bioscience-related industries: NAICS 32541 - Pharmaceutical and Medicine Manufacturing and NAICS 32519 - Other Basic Organic Chemical Manufacturing. In 2013, PEI exported $251 per capita worth of NAICS 32541 - Pharmaceutical and Medicine Manufacturing, third among the 10 provinces in Canada behind Ontario and Manitoba. Further, the value of PEI exports more than doubled over the past decade - much faster than sector growth in both Ontario and Quebec. In 2013, PEI exported $142 per capita worth of NAICS 32519 - Other Basic Organic Chemical Manufacturing, second in Canada among the 10 provinces. The value of PEI exports nearly tripled over the past decade much faster than all other provinces except New Brunswick (which started from a very low base). Table 11: Per capita value of international merchandise exports
Province: Manitoba Ontario Prince Edward Island Quebec British Columbia Nova Scotia Alberta Saskatchewan Newfoundland and Labrador New Brunswick
NAICS 32541 - Pharmaceutical and Medicine Manufacturing % Change 2013 since 2004: $329.05 +98% $324.18 +32% $250.88 +108% $133.71 +49% $19.03 +144% $12.98 -25% $10.24 +45% $6.17 +133% $1.84 -6% $1.77 +244%
NAICS 32519 - Other Basic Organic Chemical Manufacturing % Change 2013 since 2004: $22.25 +11% $66.80 +9% $142.17 +189% $117.02 +26% $13.66 -70% $14.84 +152% $442.95 -3% $1.67 -79% $0.05 -99% $16.26 +811%
Source: Statistics Canada data as published by Industry Canada’s Trade Data Online.
Other PEI bioscience-related competitive advantages Beyond the talent and export profile of the industry, there are a number of other advantages emerging that are detailed in Section 5 below.
The Economic Impact of Bioscience on Prince Edward Island
21
5. The value proposition for bioscience on PEI 5.1 Cluster elements A full review of the Prince Edward Island bioscience cluster is beyond the scope of this report but a summary is included here to bring context to the data in the economic impact model. The PEI BioAlliance has played the role of industry catalyst for a number of years leading to the results shown by the industry today. It remains a critical player in the development of the cluster through its outreach efforts, startup incubation focus and other support services. The University of Prince Edward Island, through the Atlantic Veterinary College and Three Oaks Innovation Inc., has also been a key cluster player. UPEI is also turning out high quality graduates for the industry (Section 5.3). Holland College also bolsters research and talent through its Bioscience Technology Program and Canada’s Smartest Kitchen TAC. There are a number of other support entities such as the Prince Edward Island AgriAlliance Inc., BIO|FOOD|TECH, and other government funded research laboratories. There has been a deliberate effort to build linkages between sources of funding for the industry and the firms on PEI. This is a very important part of the cluster building effort.
5.2 Operating cost environment The operating cost environment in a jurisdiction is less important to the global bioscience sector than other business factors such as the talent pool, supply chain, access to capital, research and development support, market access and other cluster elements. However, that does not mean the operating cost environment is not important. From a business perspective, locating on PEI allows firms to run leaner operations compared to the well-known cluster locations such as San Diego and Boston. From a talent perspective, it provides highly skilled workers with a much lower cost of living compared to most other locations in North America.
Figure 13: Average operating cost premium by locating an R&D facility in the listed communities compared to Charlottetown Boston
+43%
San Diego
+40%
Toronto
+26%
Raleigh
+24%
The KPMG Competitive Alternatives report in 2014 revealed the Vancouver +23% operating cost advantages of locating on PEI. The report modelled operating costs for several bioscience-related Montreal +20% operations in over 200 jurisdictions around the world. For all of them, PEI came out as one of the most competitive locations. Source: KPMG Competitive Alternatives 2014. The average bio-related research and development facility in Boston will face a cost environment 43 percent higher than in Charlottetown. Biomedical research also benefits from Prince Edward Island’s lower cost environment. The cost of clinical trials management is also lower although the spread between other North American locations is tighter.
The Economic Impact of Bioscience on Prince Edward Island
22
Table 12: Location sensitive operating costs – Example bioscience-related operations (2014) Shown in US dollars
Jurisdiction: Boston San Diego Toronto Raleigh Vancouver Montreal Charlottetown
Average Bio-related R&D operation Compared to $Millions Charlottetown $8.3 +43% $8.2 +40% $7.3 +26% $7.2 +24% $7.2 +23% $7.0 +20% $5.8
Example Biomedical R&D facility Compared to $Millions Charlottetown $8.5 +40% $8.4 +38% $7.7 +28% $7.4 +22% $7.6 +25% $7.3 +21% $6.0
Example Clinical Trials Mgmt. operation Compared to $Millions Charlottetown $5.4 +34% $5.2 +29% $4.8 +21% $4.6 +15% $4.7 +18% $4.7 +17% $4.0
Source: KPMG Competitive Alternatives Report (2014).
5.3 The talent pipeline As discussed above, PEI has built a relatively large pool of workers with skills needed in the Bioscience Cluster. It also has been able to attract talent from outside the province. However, to support a robust growth rate it will need to continue to incubate and attract highly skilled workers. The Island’s post-secondary education institutions (college and university) have stepped up and are turning out an increasing number of graduates for this sector. Statistics Canada tracks the number of students enrolled in university and college by major program area and PEI has seen a significant increase in the number of students enrolled in physical and life sciences and technologies. This program area includes physical sciences; marine sciences; biological and biomedical sciences; natural sciences; nutrition sciences; human biology; and science technologies/technicians. Between 2002 and 2012, the post-secondary education institutions on PEI have witnessed a 61 percent increase in enrolment in physical and life sciences and technologies programs. There are now nearly twice as many students enrolled in these programs on PEI as a percentage of total post-secondary students compared to Canada as a whole (Figure 14).
Figure 14: Percentage of total university and college enrolments in physical, life sciences and related technologies programs (2012) 9.8%
5.1%
All Canadian universities Prince Edward Island and colleges *Includes physical sciences; marine sciences; biological and biomedical sciences; natural sciences; nutrition sciences; human biology; and science technologies/technicians. Source: Statistics Canada CANSIM Table 477-0029.
This growing pool of home grown talent can be matched with efforts to attract talent in a comprehensive program to build the bioscience workforce of the future.
The Economic Impact of Bioscience on Prince Edward Island
23
5.4 Supportive government For more than a decade, the provincial and federal governments have supported efforts to foster growth in the Island’s bioscience sector. This is very important, as government support has been critical to the success of bioscience clusters across North America and Europe. In PEI, this support comes in the form of research funding and infrastructure, workforce development, inter-jurisdictional cooperation, and a collaborative partnership through the BioAlliance to inform policy, programs, and investment priorities. In PEI, the Atlantic Canada Opportunities Agency (ACOA) has been an important partner providing seed capital for early stage companies and through Atlantic Innovation Fund investments into bioscience research commercialization. The provincial government, through Innovation PEI, has also been very supportive both through funding support for firms and for cluster-related initiatives. Other federal government departments and agencies also play a key role such as the NRC (through its Aquatics and Crop Resource Development Program and the NRC-IRAP program), the Scientific Research and Experimental Development (SRED) program, and Agriculture and Agri-Food Canada (through its research platform for the agri-food ag-based bioproduct sectors, as well as financial assistance under the Agri-Food Growing Forward Program).
5.5 The PEI living lab for bioscience Prince Edward Island’s long history with farming, fishing and other natural resources sectors provides the emerging bioscience sector on the Island with a natural lab for the development of innovative new products, technologies and services. Many of PEI’s leading bioscience firms were born out of these traditional industries. The BioAlliance’s partnership with the Prince Edward Island AgriAlliance Inc. provides a direct conduit between the agricultural sector and firms looking to develop innovative products and services for this sector. The BioAlliance provides an environment to nurture start-ups and linkages with industry on PEI. At any time, the BioAlliance may be providing pre-incubation advisory services to 8 to 12 early stage companies or entrepreneurs outside the PEI bioscience cluster. In the years ahead, the strength of the PEI Bioscience Cluster will be enhanced by leveraging the Island as a living laboratory for innovation.
The Economic Impact of Bioscience on Prince Edward Island
24
6. Conclusion: Bioscience and PEI in the years to come Prince Edward Island needs growth sectors to strengthen its economic performance and provide the tax base to support investment in public services and infrastructure. This is the principle reason why provincial and federal governments are supportive of economic development efforts. The bioscience cluster on PEI is an excellent example of an industry that can grow and prosper. By targeting specific areas of opportunity and supporting the sector through strategic investments in research and cluster development, bioscience has emerged as an exciting opportunity for the Island. It is attracting firm investment and highly skilled talent and it is providing career and supply chain opportunities for people at home In 2012, the PEI bioscience cluster generated nearly $140 million worth of GDP on the Island, supported 1,733 FTE jobs, nearly $92 million in employment income and over $29.5 million in tax revenue for local, provincial and national governments. It also stimulated an estimated $69 million worth of consumer spending – supporting hundreds of small and medium sized businesses all across the Island. Because of the size of the provincial economy and the relatively nascent stage of the PEI Bioscience Cluster, there is some economic ‘leakage’ through the supply chain and induced economic activity. This leakage should be reduced over time as the cluster strengthens and more services and products are developed on Island. The bioscience cluster is well-positioned for continued growth. The large number of firms at an early stage of development and the ability of PEI to attract entrepreneurs from outside points to sustained economic growth in the future. If the PEI Bioscience Cluster continues to grow at its current pace it will rival tourism for its GDP impact within the next few years. The bioscience industry is high value because it generates well above average wages. These wages translate into higher taxes for government and jobs that are attractive both to keep young Islanders at home and to attract talent from abroad.
The Economic Impact of Bioscience on Prince Edward Island
25
Appendix A: The Economic Impact Model Statistic:
Description:
Employment and output figures for the industry (2012)
Supplied by the PEI BioAlliance.
Other bioscience sector data
Including historical sales and employment data. Supplied by the PEI BioAlliance.
Indirect and induced GDP, employment and income estimates
Uses Statistics Canada Input-Output multiplier and impact estimates at the M industry level. Provincial Input-Output Multipliers, 2009. Catalogue no. 15F0046XDB. Industry Accounts Division. Statistics Canada.
HST paid
Based on the ratio of HST collected to total provincial personal income in 2012 (Source: provincial budget documents and FP Markets 2012).
Personal income taxes paid
Derived using several sources including Statistics Canada CANSIM Table 202-0501 Income tax, by economic family type and CANSIM Table 202-0707 and Statistics Canada CANSIM Table 203-0022 - Survey of household spending (SHS) for 2012.
Property taxes paid (from employment income)
Derived using Statistics Canada CANSIM Table 203-0022 - Survey of household spending (SHS) for 2012.
Indirect taxes
Source: Statistics Canada Input-Output tables. These indirect taxes are levied on the business activity (not employment income) and include such tax areas as: business property taxes, fuel taxes, vehicle license fees, land transfer taxes, and any sales taxes arising out of the corporate activity.
Estimated consumer spending impacts
Derived using Statistics Canada CANSIM Table 203-0022 - Survey of household spending (SHS) for 2012.
Provincial output by industry comparison
Uses Statistics Canada CANSIM Table 381-0031 Provincial gross output, by sector and industry.
Provincial GDP by industry comparison
Uses Statistics Canada CANSIM Table 379-0030 Gross domestic product (GDP) at basic prices, by North American Industry Classification System (NAICS).
Export data by industry
Statistics Canada data as published in Industry Canada’s Trade Data Online.
International operating cost comparison
2012 KMPG Competitive Alternatives Report.
Employment size of firms on PEI
Statistics Canada. Canadian Business Patterns 2012.
Enrolments in post-secondary educational institutions
Source: Statistics Canada CANSIM Table 477-0029 - Postsecondary enrolments, by program type, credential type, Classification of Instructional Programs.
Occupational comparisons
Source: Statistics Canada. 2011 National Household Survey.
Average annual employment income data
Source: Statistics Canada CANSIM Table 281-0027 Average weekly earnings (SEPH), by type of employee for selected industries. Annualized for comparison.
Federal government transfer payment data
Source: Department of Finance Canada.
Provincial research and development expenditure data
Source: Statistics Canada CANSIM Table 358-0001 - Gross domestic expenditures on research and development, by science type and by funder and performer sector.
The Economic Impact of Bioscience on Prince Edward Island
26
Appendix B: GDP comparison – PEI and Ontario NOTE: The economic impact model used to assess the bioscience sector on PEI uses four-digit NAICS codes. The table here is for illustrative purposes only.
Total GDP per $1.00 of Direct Industry Output Per $1 of direct exogenous industry output shock
Crop and animal production Forestry and logging Fishing, hunting and trapping Support activities for agriculture and forestry Mining, quarrying, and oil and gas extraction Utilities Residential construction Non-residential building construction Engineering construction Repair construction Manufacturing Wholesale trade Retail trade Transportation and warehousing Information and cultural industries Finance, insurance, real estate, rental and leasing Professional, scientific and technical services Administrative and support, waste management Educational services Health care and social assistance Arts, entertainment and recreation Accommodation and food services Other services (except public administration) Government education services Government health services Other federal government services Other provincial government services Other municipal government services
Prince Edward Island $ 0.61 $ 0.49 $ 0.57 $ 1.01 $ 1.06 $ 0.95 $ 0.58 $ 0.69 $ 0.60 $ 0.69 $ 0.58 $ 1.10 $ 0.96 $ 0.71 $ 0.81 $ 0.85 $ 0.97 $ 0.96 $ 1.08 $ 1.00 $ 0.74 $ 0.84 $ 0.98 $ 1.08 $ 1.10 $ 1.07 $ 0.93 $ 0.89
Ontario $ 0.84 $ 0.89 $ 1.18 $ 1.00 $ 1.00 $ 0.94 $ 0.85 $ 0.92 $ 0.91 $ 1.05 $ 0.62 $ 1.04 $ 1.12 $ 0.96 $ 0.93 $ 1.03 $ 1.13 $ 1.12 $ 1.18 $ 1.08 $ 1.02 $ 0.96 $ 1.08 $ 1.24 $ 1.12 $ 1.13 $ 1.02 $ 1.13
Differential: -27% -45% -52% +2% +5% +1% -32% -25% -34% -35% -7% +6% -15% -26% -12% -17% -14% -15% -8% -7% -28% -13% -9% -13% -2% -5% -9% -21%
Source: Provincial Input-Output Multipliers, 2009. Catalogue no. 15F0046XDB. Industry Accounts Division. Statistics Canada.
The Economic Impact of Bioscience on Prince Edward Island
27