The Neuromuscular Efficiency of Lower Back Muscles in Low Back Pain
Dissertation
An academic thesis submitted to the Faculty of Human Sciences of the University of Potsdam for the degree Doctor of Philosophy (Ph.D.)
Stephan Kopinski Potsdam, December 2016
This work is licensed under a Creative Commons License: Attribution 4.0 International To view a copy of this license visit http://creativecommons.org/licenses/by/4.0/
Supervisor Prof. Dr. Frank Mayer (M.D.) Sports Medicine and Sports Orthopaedics Department of Sports and Health Sciences University of Potsdam, Potsdam, Germany Published online at the Institutional Repository of the University of Potsdam: URN urn:nbn:de:kobv:517-opus4-101241 http://nbn-resolving.de/urn:nbn:de:kobv:517-opus4-101241
ABSTRACT BACKGROUND: The etiology of low back pain (LBP), one of the most prevalent and costly diseases of our time, is accepted to be multi-causal, placing functional factors in the focus of research. Thereby, pain models suggest a centrally controlled strategy of trunk stiffening in LBP. However, supporting biomechanical evidence is mostly limited to static measurements during maximum voluntary contractions (MVC), probably influenced by psychological factors in LBP. Alternatively, repeated findings indicate that the neuromuscular efficiency (NME), characterized by the strength-to-activation relationship (SAR), of lower back muscles is impaired in LBP. Therefore, a dynamic SAR protocol, consisting of normalized trunk muscle activation recordings during submaximal loads (SMVC) seems to be relevant. This thesis aimed to investigate the influence of LBP on the NME and activation pattern of trunk muscles during dynamic trunk extensions. METHODS: The SAR protocol consisted of an initial MVC reference trial (MVC 1), followed by SMVCs at 20, 40, 60 and 80% of MVC1 load. An isokinetic trunk dynamometer (Con-Trex TP, ROM: 45° flexion to 10° extension, velocity: 45°/s) and a trunk surface EMG setup (myon, up to 12 leads) was used. Extension torque output [Nm] and muscular activation [V] were assessed in all trials. Finally, another MVC trial was performed (MVC2) for reliability analysis. For SAR evaluation the SMVC trial values were normalized [%MVC1] and compared interand intra-individually. The methodical validity of the approach was tested in an isometric SAR single-case pilot study (S1a: N = 2, female LBP patient vs. healthy male). In addition, the validity of the MVC reference method was verified by comparing different contraction modes (S1b: N = 17, healthy individuals). Next, the isokinetic protocol was validated in terms of content for its applicability to display known physiological differences between sexes in a cross-sectional study (S2: each n = 25 healthy males/females). Finally, the influence of acute pain on NME was investigated longitudinally by comparing N = 8 acute LBP patients with the retest after remission of pain (S3). The SAR analysis focused on normalized agonistic extensor activation and abdominal and synergistic extensor co-activation (t-tests, ANOVA, α = .05) as well as on reliability of MVC1/2 outcomes. 3
RESULTS: During the methodological validation of the protocol (S1a), the isometric SAR was found to be descriptively different between individuals. Whereas torque output was highest during eccentric MVC, no relevant difference in peak EMG activation was found between contraction modes (S1b). The isokinetic SAR sex comparison (S2), though showing no significant overall effects, revealed higher normalized extensor activation at moderate submaximal loads in females (13 ± 4%), primarily caused by pronounced thoracic activation. Similarly, co-activation analysis resulted in significantly higher antagonistic activation at moderate loads compared to males (33 ± 9%). During intra-individual analysis of SAR in LBP patients (S3), a significant effect of pain status on the SAR has been identified, manifesting as increased normalized EMG activation of extensors during acute LBP (11 ± 8%) particularly at high load. Abdominal co-activation tended to be elevated (27 ± 11%) just as the thoracic extensor parts seemed to take over proportions of lumbar activation. All together, the M. erector spinae behaviour during the SAR protocol was rather linear with the tendency to rise exponentially during high loads. For the level of normalized EMG activation during SMVCs, a clear increasing trend from healthy males to females over to non-acute and acute LBP patients was discovered. This was associated by elevated antagonistic activation and a shift of synergistic towards lumbar extensor activation. The MVC data revealed overall good reliability, with clearly higher variability during acute LBP. DISCUSSION: The present thesis demonstrates that the NME of lower back muscles is impaired in LBP patients, especially during an acute pain episode. A new dynamic protocol has been developed that makes it possible to display the underlying SAR using normalized trunk muscle EMG during submaximal isokinetic loads. The protocol shows promise as a biomechanical tool for diagnostic analysis of NME in LBP patients and monitoring of rehabilitation progress. Furthermore, reliability not of maximum strength but rather of peak EMG of MVC measurements seems to be decreased in LBP patients. Meanwhile, the findings of this thesis largely substantiate the assumptions made by the recently presented ‘motor adaptation to pain’ model, suggesting a pain-related intra- and intermuscular activation redistribution affecting movement and stiffness of the trunk. Further research is needed to distinguish the grade of NME impairment between LBP subgroups.
4
ABSTRACT - GERMAN HINTERGRUND: Die Ätiologie von unteren Rückenschmerzen (LBP), als eine der häufigsten und kostenintensivsten Beschwerden unserer Zeit, gilt als multi-kausal, wobei funktionelle Aspekte im Fokus der Forschung stehen. Schmerzmodelle vermuten dabei ein zentral gesteuertes Muster der Rumpfversteifung. Von biomechanischer Seite jedoch, sind unterstützende Daten weitestgehend auf statische Messungen während maximal-willentlicher Kontraktionen (MVC) beschränkt, wobei psychologische Einflussfaktoren bei LBP-Patienten nicht auszuschließen sind. Alternativ werden Anzeichen für Beeinträchtigungen der neuromuskulären Effizienz (NME) der unteren Rückenmuskulatur berichtet, welche durch ein verringertes Kraft-Aktivierungsverhältnis (SAR) gekennzeichnet sind. Daher könnte ein dynamisches SAR Protokoll, basierend auf normierten Aktivierungswerten der Rumpfmuskulatur während submaximaler Belastungen (SMVC), eine maßgebliche Alternative darstellen. Ziel der vorliegenden Arbeit war es deshalb, den Einfluss von LBP auf die NME und Aktivierung des Rumpfes während dynamischer Rumpfstreckbewegungen zu untersuchen. METHODEN: Das NME-Protokoll bestand aus einem initialen MVC-Referenzdurchgang (MVC1), gefolgt von SMVC bei 20, 40, 60 und 80% der MVC1-Last. Mittels isokinetischem Rumpfdynamometer (ConTrex TP, ROM: 45° Flexion bis 10° Extension, 45°/s) und Oberflächen-EMG (myon, max. 12 Rumpfableitungen) wurden dabei Extensionsdrehmomente [Nm] und Muskelaktivität [V] aufgezeichnet. Für die Reliabilitätsanalyse wurde abschließend ein weiterer MVC-Durchgang (MVC2) durchgeführt. Die Normierung der SMVC-Daten [%MVC1] ermöglichte den inter- und intraindividuelle Vergleich der NME Werte. Die methodische Validierung erfolgte in einer Einzelfallvergleich-Pilotstudie mit isometrischem NME Protokoll (S1a) und einem Vergleich der MVC-Referenzwerte in mehreren Kontraktionsmodi (S1b: N = 17, gesunde Teilnehmer). In der Folge wurde das isokinetische NME-Protokoll in einer Querschnittstudie inhaltlich, auf die Abbildbarkeit bekannter physiologischer Geschlechterunterschiede, geprüft (S2: jeweils n = 25 gesunde Männer und Frauen). In der finalen Studie wurde der Einfluss von akutem Schmerz auf die NME im Längsschnitt von akutem und schmerzfreien Zustand bei N = 8 LBP Patienten verglichen (S3). Die Analyse konzentrierte sich auf die normierte agonistische Extensorenaktivierung und die abdominale und synergistischen Kokontraktion, sowie die MVC1/2 Reliabilität. 5
ERGEBNISSE: Die methodische Validierung des Protokolls (S1a) resultierte in einem deskriptiv unterschiedlichen NME Verlauf, mit eher widersprüchlichen Daten der LBP-Patientin. Im Vergleich der Kontraktionsarten (S1b) zeigten die exzentrischen MVC die höchsten Drehmomentwerte, jedoch wurden keine bedeutsamen Unterschiede in der maximalen Aktivierung gefunden. Obwohl im Geschlechtervergleich mit dem isokinetischen NMEProtokoll (S2) kein Gesamteffekt gefunden wurde, zeigten Frauen eine höhere normalisierte Aktivierung der Extensoren bei mittleren Lasten (13 ± 4%), verursacht vor allem durch höhere thorakale Aktivität. Auch die antagonistische Koaktivierung der Frauen war bei moderaten Lasten signifikant höher (33 ± 9%) als bei den Männern. Der Vergleich der NME Werte innerhalb der LBP-Patienten (S3) ergab einen signifikanten Effekt von Schmerz auf die NME mit gesteigerter normalisierter Extensorenaktivität (11 ± 8%) besonders bei hoher Last. Damit einhergehend wurde eine tendenziell erhöhte Kokontraktion (27 ± 11%) und eine anteilige Verschiebung von lumbaler hin zu thorakaler Extensorenaktivierung festgestellt. Insgesamt zeigte der M. erector spinae während des NME-Protokolls ein eher lineares Verhalten mit tendenziell überproportionalem Anstieg bei höheren Lasten. Die normierte EMG-Aktivität zeigte einen eindeutig ansteigenden Trend von gesunden Männern zu Frauen bzw. von schmerzfreien zu akuten LBP-Patienten. Im gleichen Maße stieg das Level der abdominalen Kokontraktion und der thorakale Aktivitätsanteil. Die MVC-Daten ergaben eine insgesamt gute Reproduzierbarkeit, mit erhöhter Variabilität bei akuten LBP-Patienten (S3). DISKUSSION: Die vorliegende Arbeit zeigt dass die NME der unteren Rückenmuskulatur bei LBP-Patienten, besonders während akuter Schmerzen, beeinträchtigt ist. Es wurde ein neues dynamisches Protokoll vorgestellt, welches das zugrundeliegende SAR mittels normierter Rumpfmuskelaktivität bei submaximalen isokinetischen Lasten abbildet. Gesunde Frauen zeigten im Zuge der Validierung eine geringere NME und ein abweichendes Aktivierungsmuster im Vergleich zu Männern. Insgesamt empfiehlt sich das Protokoll als biomechanischdiagnostische Messmethode für die NME bei LBP-Patienten und deren Therapiekontrolle. Auch bestätigt es die Grundlagen des ‘motor adaptation to pain’-Modells, welches eine schmerzabhängige intra- und intermuskuläre Aktivierungsanpassung des Rumpfes bei LBP annimmt. Weitere Forschung zur Beeinträchtigung der NME bei LBP-Untergruppen ist notwendig.
6
TABLE OF CONTENTS Abstract ........................................................................................................................... 3 Abstract - German ............................................................................................................ 5 Table of Contents ............................................................................................................. 7 Chapter 1 – Background.................................................................................................... 8 1.1 Low back pain.............................................................................................................. 8 1.2 Assessment of neuromuscular capacity in LBP patients........................................... 20 1.3 Strength-Activation Relationship (SAR) .................................................................... 26 1.4 Research Paradigm.................................................................................................... 31 Chapter 2 – Materials and Methods ................................................................................ 36 2.1 General aspects and methods of the SAR approach ................................................ 36 2.2 Study 1 (S1) - Development of the method - Pilot studies ........................................ 46 2.3 Study 2 (S2) - Validation of the method - Sex comparison........................................ 51 2.4 Study 3 (S3) - Transfer of the method to LBP patients .............................................. 54 Chapter 3 – Results ......................................................................................................... 60 3.1 Results S1 - Development of the Method - Pilot studies .......................................... 60 3.2 Results S2 - Validation of the method - Sex comparison .......................................... 63 3.3 Results S3 - Transfer of the method to LBP patients ................................................. 67 3.4 Summary of Results .................................................................................................. 78 Chapter 4 – Discussion .................................................................................................... 80 References ..................................................................................................................... 98 Appendix...................................................................................................................... 110 Abbreviations .................................................................................................................. 110 List of Figures .................................................................................................................. 111 List of Tables ................................................................................................................... 113 Complementary data ...................................................................................................... 114 Acknowledgements ........................................................................................................ 115 Affidavits ......................................................................................................................... 117 7
CHAPTER 1 – BACKGROUND The impact of low back pain (LBP) on modern society is typically determined by its enormous financial burden, caused by work absenteeism and long-term care, especially when it becomes a permanent state. Patients suffering from chronic LBP (CLBP) are responsible for the majority of the costs due to repeated treatment, long-term work absence, and early retirement (Burton et al., 2006; Maniadakis & Gray, 2000; Taimela et al., 2000). However, the real seriousness of LBP and its chronicity is apparent by the restrictions on physical and social activities, having a substantial effect on the quality of life in those affected (G. B. Andersson et al., 1983; Walsh et al., 1992), and even resulting in a shortening of life expectancy (Hoy et al., 2014; Jansson et al., 2012). As the risk factors for developing LBP seem to be multifactorial, the scientific approaches explaining the underlying mechanisms causing and preserving LBP are numerous. From a biomechanical perspective, the functional factors discussed in the context of LBP contain aspects on the muscular and neuronal levels. However, to date no biomechanical explanation model has been found that describes the etiology of LBP convincingly.
1.1 LOW BACK PAIN Epidemiology of low back pain Low back pain (LBP) is well known as an extremely common disease of our time (Hoy et al., 2014; Taylor et al., 2014); it is one of the most prevalent and costly afflictions globally (G. B. Andersson, 1999) having its focus in the high-income economies (Hoy et al., 2014). LBP is the leading cause of activity limitation and work absence throughout most regions of the world (Hong et al., 2013; Hoy et al., 2014; Jansson et al., 2012; Murray et al., 2013; Walker et al., 2004). Beside its enormous financial burden on individuals, families, communities, industry and governments (Hoy et al., 2014; Kent & Keating, 2005; Steenstra et al., 2005), the substantial effect of LBP and its chronicity on the quality of life, even shortening the life expectancy of those affected (Hoy et al., 2014; Jansson et al., 2012), may be its most devastating consequence. 8
The global prevalence rates of LBP, reported by recent systematic reviews, average at 18.3% for point (range: 9 - 33%), 38.0% for annual (range: 22 - 65%), and 38.9% for lifetime prevalence in the adult general population (Hoy et al., 2012, 2014; Walker, 2000). Individual cross-sectional studies from western countries, excluding the low prevalence rates of lowand middle-income economies (Hoy et al., 2012), refer to lifetime prevalence values as much as 70% - 85% (G. B. Andersson, 1999; Biering-Sørensen, 1983; Walker et al., 2004). Independent of the variability in prevalence rates reported, likely caused by methodologic variation in terms of case definition and periods looked at (Hoy et al., 2012), the high impact of the LBP disease on modern society cannot be denied. Until quite recently, it was consistently assumed that LBP is most frequent during middle age (35 to 69), with higher prevalence in females over all age groups (G. B. Andersson, 1999; Hoy et al., 2012). Most recent data from the Global Burden of Disease 2010 study (GBD 2010), however, concludes the peak prevalence at around 80 years of age, with a higher age-standardised mean pointprevalence of 10.1% in males compared to 8.7% in females (Hoy et al., 2014; Murray et al., 2012) (Fig. 1).
The global prevalence of LBP
Figure 1: The global prevalence of low back pain
Figure 1: Prevalence (per 1) of LBP across age groups and regions for males (left) and females (right). Figure out of Hoy et al. (2014), p. 972.
Further findings of the GBD 2010 attest that LBP ranks highest in overall (years lived with) disability and to be sixth in terms of overall burden (disability adjusted life years), out of 291 conditions listed (Hoy et al., 2014). As a consequence of the peak of prevalence in older age groups (Fig. 1), the burden of LBP is higher in regions with higher life expectancies, with prospects of substantial increase in the future (Hoy et al., 2014). 9
It has been assumed that LBP complaints in 80 to 90% of cases disappear without medical intervention within six weeks (Biering-Sørensen, 1983; Waddell, 1987), however, chronic LBP after all is responsible for almost 90% of total costs for LBP treatment and total disability days (Abenhaim & Suissa, 1987; Hashemi et al., 1997). More critical investigations assume considerably higher rates of chronification with e.g. only 18% to 44% of patients reporting full recovery by 12 month after LBP onset (Croft et al., 1998). To sum up, LBP is a concern for all ages and it is spread over all sectors of society (Burton et al., 2006), showing similar prevalence rates in adolescents and adults (Watson et al., 2002) and no appreciable differences between workers and non-workers (Nachemson et al., 2000). Differences in prevalence rates are caused by discrimination of aspects such as symptom occurrence, care seeking, work absenteeism, and disability, and are influenced by varying proportions of biological, psychological and social factors (Burton et al., 2006; Nachemson et al., 2000).
Definition and classification of low back pain Referring back to the GBD 2010, the final definition of LBP was set to “Low back pain (± pain referred into one or both legs) that lasts for at least one day” with the “low back” being defined as “the area on the posterior aspects of the body from the lower margin of the twelfth ribs to the lower gluteal folds” (Hoy et al., 2012, 2014). At first glance, this definition appears to be quite simplistic; however, it presents kind of the lowest common denominator that reflects the challenging specification of a disease as complex and diverse as LBP. From an anatomical point of view, the localization of LBP complaints in literature most commonly is categorized as “low back”, being more specific with “below the costal margin (of the twelfth ribs) and above the inferior/lower gluteal folds” (Burton et al., 2006; Hoy et al., 2012). Furthermore, the involvement of pain radiating “into one or both lower limbs” (Hoy et al., 2010, p. 155) should not be underestimated (Burton et al., 2006). From a clinical point of view, a common differentiation of LBP can be drawn by means of structural integrity during diagnosis: about 9% of LBP cases have lumbar strain/spasm, followed by about 5% diagnosed cases of scoliosis, about 4% have compression fractures, about 1% to 3% show degeneration, herniation, or prolapse of intervertebral discs, whereas ≤ 1% have neoplasms (abnormal tissue growth), ankylosing spondylitis (inflammation) and spinal 10
infections (Koes et al., 2006; Van Tulder et al., 2006; S. Yang et al., 2015). However, the basic principle of clinical practice - to identify a diagnosis during initial patient assessment for diagnosis-specific treatment - is difficult to apply to LBP because over 80% of LBP presentations cannot be assigned to a specific reason (Burton et al., 2006; Kent & Keating, 2004; Van Tulder et al., 2006; S. Yang et al., 2015) and abnormal imaging findings do not necessarily indicate symptoms (Hall et al., 2009). Accordingly, ‘non-specific LBP’ has become a widely accepted categorization for patients showing no recognized structural-pathological cause (Kent & Keating, 2004). Waddell (2004), for example, suggested non-specific LBP to be mechanical pain of musculoskeletal origin with symptoms varying in accordance to physical activity. However, others argued that the variety of mechanical conditions associated with non-specific LBP and its diverse responses to movement and postures do not support this categorical unification (Hall et al., 2009), and that subgrouping systems classifying LBP based on pattern recognition (e.g. dominant pain location, pain frequency, exacerbating or alleviating movements/ postures) may be more appropriate (Hall et al., 2009; McIntosh et al., 2008). Considering the development of LBP, put simply, from the first onset to chronic state, the high variation in the course of back pain becomes even more obvious: “The natural history of the symptom is extremely variable; some patients are better within days, while others complain of back pain for years.” (Roland & Morris, 1983, p. 149). LBP often seems to occur in phases changing between transient, recurrent, and chronic phases over time (Von Korff, 1994): ”LBP should be viewed as a chronic problem with an untidy pattern of grumbling symptoms and periods of relative freedom from pain and disability interspersed with acute episodes, exacerbations, and recurrences.” (Croft et al., 1998, p. 1359). In general, the terms ‘acute pain’ and ‘chronic pain’ have been defined in numerous ways that are often difficult to measure (Nachemson & Bigos, 1984; Von Korff, 1994). Based on an enlarged taxonomy, including information on onset, prognosis, and clinical course of LBP, Von Korff (1994) proposed a detailed definition of LBP phases, providing a solid fundament both from a clinical and a scientific perspective (De Vet et al., 2002). Furthermore, Von Korff et al. presented an approach that summarizes different pain measures (pain intensity, persistence, related disability, recency of onset) to grade the severity of chronic LBP, resulting in the Graded Chronic Pain Scale (GCPS) questionnaire (Von Korff et al., 1992). 11
Overall, as LBP is a heterogeneous condition, different approaches of LBP classification, considering purpose and point of view, have been distinguished. On the one hand, clinical diagnosis, matching the treatment to patient presentation and pattern of pain, is important for effective recovery of patients (McIntosh et al., 2008). It has been emphasized that the identification of meaningful and clinically relevant LBP subgroups, derived from clear and reasonable definitions, is important to influence therapy outcomes positively (Bouter et al., 2003; Hall et al., 2009; Spitzer et al., 1987). However, since in the majority of LBP patients no definitive cause for their complaints can be identified, the overutilization of diagnostic procedures may run the risk of adversely affecting outcomes and lead to inappropriate treatment (Hall et al., 2009; Waddell, 2004). It has to be considered that “overall, nonspecific low back pain is important not so much for its existence as for its consequences” (Burton et al., 2006, p. 141). LBP and consequential disability are causally and clinically related to the underlying physical pathology and functional impairment (Waddell, 1987), however, in many patients it seems to be a case of “which came first, the chicken or the egg?”. On the one hand, heavy and/or unilateral repetitive activity, degeneration and psychological stress are considered risk factors for development of LBP (G. B. Andersson, 1997; Taylor et al., 2014). On the other hand, observed functional and behavioural alterations, such as changes in trunk posture, restrictions in trunk range of motion, pain-avoidance behaviour and decreased activity levels make LBP patients prone to recurrence and aggravation of LBP symptoms (Hodges & Tucker, 2011). In addition, the impact of this vicious circle is moderated by psychosocial factors, e.g. emotional distress, depression, and social isolation (Steenstra et al., 2005). In accordance and owing to the fact that most people do not only suffer from LBP at least once in their life but also experience more than one period of LBP (Carey et al., 1999; Waddell, 1987), it has been generally accepted that LBP can be characterized as an episodic disease (De Vet et al., 2002).
12
Risk factors and etiology of low back pain Although highly relevant for prevention concepts, risk factors for LBP are poorly understood and documented inconsistently and insufficiently comprehensive (Burton et al., 2006; Taylor et al., 2014; Van Tulder et al., 2006). Undisputedly, “the most powerful risk factor for a new episode of back pain is a previous history” (Burton et al., 2006, p. 141), with the average 12month risk being over 70% (Hestbaek et al., 2003; Koes et al., 2006). Apart from that, LBP development is regarded to be ‘multi-causal’ with associated risk factors being classified into physical (functional) and psychosocial sub-groups (Taylor et al., 2014; Waddell, 1987; Winkel & Mathiassen, 1994). The most frequently reported functional risk factors are heavy physical work, frequent bending, twisting, lifting, pulling and pushing, repetitive work, static postures and vibrations (G. B. Andersson, 1997; Burton et al., 2006; Taylor et al., 2014). Psychosocial risk factors often stated include stress, distress, anxiety, depression, cognitive functioning, pain behaviour, job dissatisfaction and mental stress at work (G. B. Andersson, 1997; Koes et al., 2006; Pincus et al., 2002; Taylor et al., 2014). However, despite the frequent number of times mentioned, there is overall limited evidence with non-consistent and small effectsizes for all these risk factors (Taylor et al., 2014). Yet high exposure rates, e.g. because of occupational settings, and individual general health related risk factors, such as smoking and obesity, probably influence certain LBP outcomes (Burton et al., 2006). The most frequent reason patients experience dissatisfaction with medical care in LBP has been found to be the failure to get an adequate explanation for their LBP complaint (Deyo & Diehl, 1986). This fact already indicates the complicated transition from acute to chronic LBP, and supports the increasing evidence for the importance of psychosocial factors (Koes et al., 2006). To identify LBP patients at risk in clinical practice, screening instruments based on “yellow flags” have been developed and validated, including aspects such as fear avoidance behaviour and reduced activity levels (Koes et al., 2006; Linton & Halldén, 1998; Samanta et al., 2003). Such a comparable list of yellow flags is missing for functional risk factors, however it would be desirable – not only for the identification of LBP patients to prevent chronification, but with potential for primary prevention of LBP in the first place.
13
From a very traditional perspective, LBP has been commonly viewed as a result of “injury” (Tan et al., 1993). However, only a very small percentage of LBP symptoms is caused by acute trauma (Casazza, 2012; Troup et al., 1981) and when viewing it as an injury, one does not consider that LBP is mostly transient and/or develops gradually (Roland & Morris, 1983; Tan et al., 1993). These flaws have been respected in the cumulative trauma model, which characterizes LBP as a consequence of concurrent gradual degeneration of the spine and prolonged exposure to compressive and shear loads (Kumar, 1990; Tan et al., 1993). Although submaximal in its magnitude, prolonged and repetitive loading, e.g. during onesided occupational activities, is supposed to interfere with the healing and remodelling of tissues. If aging processes and micro-traumas within the spine add up to a certain injury threshold, then even submaximal strain may cause the emergence of LBP (Kumar, 1990; Tan et al., 1993). Moreover, cumulative muscular fatigue and occupationally related stress may further decrease this threshold (Kumar, 1990). Accordingly, a history of unbalanced biomechanical stress on musculoligamentous tissues and intervertebral disks in combination with frequent psychological stress is likely to result in the degeneration of viscoelastic structures and the reduction of stress-bearing capacity of the spine, predisposing it to LBP (Kumar, 1990). However, pathoanatomic approaches which imply that LBP is caused by compromised spinal structures (Porter, 1989) share the flaws that only a minority of LBP diagnoses can be confirmed by imaging techniques (Jensen et al., 1994) and that there is a high incidence of false-positive findings (Roy & Oddsson, 1998; Weishaupt et al., 1998). Bearing in mind that the etiology in most cases of LBP is unknown (Panjabi, 1992), musculoskeletal dysfunctions have been suggested to be a potential cause of LBP (Geisser et al., 2005). From early on, the concept of spinal instability has been considered to be an important functional mechanism in LBP development and chronification, however, being defined and discussed controversially ever since (Nachemson, 1985; Panjabi, 1992). It has been hypothesized that an accident or micro-trauma, caused by repetitive or abnormally large motions, may affect nociceptors and thus pain sensation by either compression and/or stretching of the inflamed neural elements (Panjabi, 1992, 2006). “Inflammation, biochemical and nutritional changes, immunological factors, changes in the structure and material of the endplates and discs, […] such as nerve ingrowth” (Panjabi, 2006, p. 669) have been considered to be associated with altered mechanics of the spinal column. 14
Accordingly, muscle control dysfunctions require increased neuronal activation to stabilize lumbar segments and to adjust corrupted transducer signals from injured ligamentous mechanoreceptors. This may translate into altered activation pattern of trunk muscles, which in turn result in impaired muscle coordination and force characteristics (Geisser et al., 2005; Panjabi, 1992, 2006; Van Dieën, Selen, et al., 2003). The abnormal strain then intensifies the degeneration of affected structures, conceivably leading to gradual inflammation of neural tissue (Cavanaugh et al., 1997), and therefore to chronic LBP (Panjabi, 1992). Although the evidence for the exact mechanisms leading to changes in neuromuscular control of the trunk in LBP remains vast, some important and common observations have been reported, especially when it comes to chronic LBP patients (Panjabi, 2006): delayed muscle response after a postulated task (Butler et al., 2010; Taimela et al., 1993) or sudden spine loading (Magnusson et al., 1996), delayed muscle shut-off after a respective external load (Radebold et al., 2000), contra-lateral activation imbalances (Larivière et al., 2005, 2000b; Magnusson et al., 1996), and decreased spinal posture control and balance, especially during more complex tasks (Luoto et al., 1998; Radebold et al., 2001). Given these indications, short-term adaptations of the neuromuscular control of the spine in response to pain sensation, due to acute or accumulated injury or degeneration, are likely. If these modifications fail to compensate for trunk stability deficiencies, a permanent corrupted muscle response pattern may intensify the initial reasons for the onset of LBP, leading to the often experienced recurrence of LBP complaints (Panjabi, 2006). This concept is also in line with the so-called deconditioning syndrome, indicating the deterioration of trunk extensor muscle function as a result of progressive disuse during LBP suffering and fear of reappearance of symptoms (Larivière et al., 2008; Verbunt et al., 2003). Deconditioningrelated reorganisation of muscle fiber characteristics (Mannion et al., 2000) and muscle atrophy (Danneels et al., 2000) most likely further contribute to a consolidation of changes in neuromuscular function of the trunk in LBP patients compared to healthy individuals. However, like these concepts of abnormal muscle function, the role of pain in LBP context is an ongoing matter of debate (Van Dieën, Selen, et al., 2003).
15
The role of pain in low back pain Even though the mechanisms for changes in trunk muscle function in LBP patients have not been fully understood yet, the interpretation of indicated alterations regarding the role of pain lead to different models, being controversially discussed in literature (Van Dieën, Selen, et al., 2003). The ‘pain-spasm-pain model’ (Travell et al., 1942), also known as the vicious cycle theory (Roland, 1986) is based on the assumption that pain causes an increase in muscle activation to stiffen the painful area (Flor & Turk, 1984; Hodges & Tucker, 2011; Kallenberg & Hermens, 2006). After acute trauma, this reaction appears to be functional since further damage caused by movement will be prevented. However, during nontraumatic pain, similar muscular responses are more likely to have adverse effects and be self-reinforcing, consequently leading to more pain (Van Dieën, Selen, et al., 2003). Proposed neural pathways of a vicious pain-spasm-pain cycle are based on afferent nociceptor information being projected to both higher centers (pain perception) and onto segmental alpha motorneurons (Wyke, 1987). Others suggested an influence of nociceptor information on muscle spindle output via projections on gamma motorneurons as cause for the hyperexcitation of alpha motorneurons (Johansson & Sojka, 1991). Independent of the underlying pathway, both theories result in a more sustained and intense muscle activation and in turn are expected to cause pain by accumulating excitatory substances in the muscles, such as ionic acid, bradykinin, potassium and lactate (Van Dieën, Selen, et al., 2003). As a consequence of the reflexive hyperactivity in response to pain, the pain-spasmpain model predicts an increased trunk extensor activation during submaximal task and in rest in LBP patients (Wyke, 1987). Together with higher synergistic and antagonistic trunk muscle activation, a lower efficiency during force production compared to controls has to be expected (Van Dieën, Selen, et al., 2003) (Tab. 1). In contrast, the ‘pain-adaptation model’ (J. P. Lund et al., 1991), based on clinical findings in pain syndromes, predicts a decreased muscle activation during agonistic working and an increase during antagonistic working. As a results, the movement velocity gets reduced and the range of movement is limited, which is believed to prevent pain provocation (Van Dieën, Selen, et al., 2003). Since the neural pathway for these recruitment changes, nociceptor projections on alpha motorneurons via inhibitory and excitatory interneurons, controlled by 16
the central nervous system and dependent on the motor command, have been suggested (Hodges & Tucker, 2011; J. P. Lund et al., 1991; Van Dieën, Selen, et al., 2003). J. P. Lund et al. (1991) used the terms agonists and antagonists to refer to muscle shortening and lengthening, respectively. Following this interpretation, the pain-adaptation model, irrespective of intensity level, predicts extensor muscle activation to be decreased during concentric trunk extension and increased while performing eccentric work, resulting in unchanged activation during isometric tasks (Van Dieën et al., 2003) (Tab. 1). Table 1: EMG amplitude predictions by pain models compared to asymptomatic participants Submaximal
Maximal
Rest
ISM
CON
ECC
ISM
CON
ECC
Pain-spasm-pain model
↑
↑
↑
↑
→
→
→
Pain-adaptation model
→
→
↓
↑
→
↓
↑
EMG amplitude predictions between patients and control participants (→, ↑, ↓ refer to equal, higher or lower EMG amplitudes in patients as compared to controls) depending on experimental task (Rest: during rest, ISM: isometric, CON: concentric, ECC: eccentric). Table adapted from Van Dieën et al. (2003), pp. 335, 337.
In literature, however, neither the pain-spasm-pain nor the pain-adaptation model is consistently supported (Van Dieën, Selen, et al., 2003): “There is no doubt that some observations are congruent with predictions of existing theories, but numerous observations are not.” (Hodges & Tucker, 2011, p. 90). Moreover, it has been found that motor control was disturbed in the presence of pain, resulting for instance in contra-lateral asymmetries of erector spinae muscle activation (Grabiner et al., 1992; Larivière et al., 2005). Overall, the observed changes in EMG activation due to pain seem to aim for the prevention of further harm to injured structures, which is in line with the stability model by Panjabi (1992) as a cause of LBP (Van Dieën, Selen, et al., 2003). There has been substantial evidence that spinal stability is decreased after injury, requiring adaptations of muscular activation to compensate for reduced passive stiffness (Van Dieën, Selen, et al., 2003). Suggested mechanisms include increased co-contraction (Cholewicki & McGill, 1996; Cholewicki et al., 1997; Granata & Marras, 2000) and changes of activation distribution in extensor muscles (Larivière & Arsenault, 2008; Van Dieën, Cholewicki, et al., 2003; Vink et al., 1987). However, aside from the risk of pain self-reinforcement by muscle hyperactivity, as presumed by the pain-spasm-pain model, potential negative effects of pain-related neuromuscular adaptations of the trunk have to be considered (Van Dieën, Selen, et al., 2003). In more 17
detail, impaired functional abilities, persistence of changes beyond the recovery duration of underlying physiological causes, and possible trigger effects by fear of movement and reinjury may be relevant (Van Dieën, Selen, et al., 2003; Vlaeyen et al., 1999). The variable and non-uniform changes of individual trunk muscle and muscle group behaviour between individuals and tasks is accounted for in the more recent model of ‘motor adaptation to pain’, introduced by Hodges & Tucker (2011). Key elements of the model include a pain-related intra- and intermuscular activity redistribution and a modified movement and stiffness behaviour, aiming to protect from further pain or injury. Overall, the essence of the ‘new’ motor adaptation to pain model contains a more flexible adaptation strategy, with complementary, additive, or competitive changes at the complementary levels of the motor system (D’hooge et al., 2013; Hodges & Tucker, 2011) (Fig. 2). Most recent investigations of trunk muscles, in agreement with the proposed more complex changes, reported higher co-contraction levels of superficial, and opposing activation differences of contralateral deep paraspinal muscles in LBP patients (D’hooge et al., 2013). Nevertheless, the authors again question the short-term benefit of dynamic trunk muscle control at the cost of potential long-term effects, such as increased spine load and earlier fatigue, suggested to contribute to LBP recurrence (D’hooge et al., 2013).
Motor adaptation to pain model (Hodges & Tucker, 2011)
Figure 2: Motor adaptation to pain model (Hodges & Tucker, 2011)
Figure 2: Motor adaptation to pain model by Hodges & Tucker (2011) - rather unequal than uniform distribution of nociceptor input to motoneurons with individual- and task-specific activity redistribution between intra- and intermuscular regions. Figure out of Hodges & Tucker (2011, p. 93).
18
Common to all theories about the effect of pain on neuromuscular control is the possibility that the adaptations endure beyond the period of recovery (Hodges & Tucker, 2011; Van Dieën, Selen, et al., 2003). Regarding motorneuron recruitment, for example, it has been reported that discharge rates normalize with vanishing pain, but intra-muscular activation redistribution does not (Hodges & Tucker, 2011). Moreover, individuals with increased pain sensitivity have been shown to be less likely to restore muscle recruitment patterns completely to a normal state (Moseley & Hodges, 2006). For the fact of high recurrence rates of pain after an initial episode of LBP (Pengel et al., 2003) and the unknown interaction between positive and negative consequences of adaptation (Hodges & Tucker, 2011), the role of acute pain on pain-related neuromuscular changes remains to be investigated in acute and chronic LBP patients. To sum up, if muscular and/or neuronal capacities of the trunk are insufficient for adequate compensation of external loads, degeneration/injury of spinal structures may lead to pain. As a consequence, the nervous system adapts the neuromuscular coordination of trunk muscles to avert further damage. However, enduring changes may further increase the load on spinal structures, potentially leading to a self-reinforcing cycle of low back pain (Fig. 3).
The role of neuromuscular deficits in low back pain
Figure 3: The role of neuromuscular deficits in low back pain
Figure 3: The role of neuromuscular deficits in low back pain development - alterations in neuromuscular coordination pattern of the trunk potentially lead to a vicious cycle of self-reinforcing pain.
19
1.2 ASSESSMENT OF NEUROMUSCULAR CAPACITY IN LBP PATIENTS Independent of the wide-ranging notion of ‘physical’ or ‘functional’ risk factors for LBP (Taylor et al., 2014), lumbar muscle function has been considered as a crucial factor for the development and characterization of LBP from early on (Leino et al., 1987; Roy et al., 1989). In accordance with the high incidence of LBP related to repetitive and fatiguing occupational tasks (G. B. Andersson, 1997; Burton et al., 2006), the investigation of a comprised muscle function in terms of weakened and less endurable back muscles has been initially focused on (Addison & Schultz, 1976; Alston et al., 1966; Magora, 1972; Nicolaisen & Jørgensen, 1985). Although a few studies investigated muscular activation in connection with back muscle fatigue in LBP, at the same time (DeVries, 1968b; Jayasinghe et al., 1978), the actual ‘rush’ on EMG signal analysis in context of LBP is not recognizable before the 1990’s, when technical advancements allowed a wider scientific audience access to the method (De Luca, 1997; McGill, 1991; Roy et al., 1989).
Trunk strength measurements in LBP Muscular strength of the trunk, especially of extensors and flexors, is essential for maintaining demanded posture and core stability (E. Andersson et al., 1988; J. Müller et al., 2014) and is an important contributor to spine stability (J. H. Lee et al., 1999). Strong trunk muscles are not only decisive for the transfer between upper and lower limb forces (Kubo et al., 2011) but all the more are crucial for the prevention of musculoskeletal disorders, such as LBP (Guilhem et al., 2014; Yahia et al., 2011). Accordingly, the assessment of trunk muscle strength is one of the preliminary and most common approaches in both research and clinical handling of LBP (Ripamonti et al., 2011; Roy et al., 1989). In the beginning, caused by the absence of technical alternatives, trunk extensor and flexor strength in LBP patients and healthy controls was evaluated exclusively non-dynamometric using isometric and dynamic contractions. The majority of these early studies reported an overall significantly lower trunk extensor strength in LBP patients compared to control participants (Addison & Schultz, 1976; Alston et al., 1966; Biering-Sørensen, 1984; McNeill et al., 1980). However, others found this result only in inactive patients (Nachemson & Lindh, 1969) or even determined no associations of low back symptoms and isometric muscle 20
strength at all (Jørgensen & Nicolaisen, 1987; Kondraske et al., 1987; Leino et al., 1987). Similar contradictory findings have been found since isokinetic strength measurement techniques have been available, reporting either that trunk muscles are weakened (Dvir & Keating, 2003; Langrana et al., 1984; J. H. Lee et al., 1999; Sjölie & Ljunggren, 2001; Yahia et al., 2011) or are not necessarily impaired in LBP patients (Balagué et al., 2010, 1993; Feldman et al., 2001; Thorstensson & Arvidson, 1982). In addition, psychological aspects like motivation as well as possible inhibitory effects due to pain and fear of (re)injury are known to influence maximum strength measurements, especially when considering patients suffering from LBP (Mannion et al., 1996; Oddsson & De Luca, 2003; M. Stokes & Young, 1984; Vlaeyen et al., 1999). Alternatively, maximum trunk strength assessments are frequently used to shape a flexion/extension (F/E) ratio, which is based on the assumption of an imbalance between abdominal and back musculature as aetiological factor in LBP (Janda, 1978; Leino et al., 1987). With trunk extensors being usually determined as stronger than trunk flexors (S. Müller et al., 2012), poor abdominal muscle strength, resulting in reduced F/E ratios, has been reported in several studies (Frymoyer et al., 1983; Newton et al., 1993; Pope et al., 1985; S. S. Smith et al., 1985) whereas lower normalized back muscle strength led to increased F/E ratios in others (H. J. Lee et al., 2012; J. H. Lee et al., 1999; Ripamonti et al., 2011; Yahia et al., 2011). The high and random intersubject variation in F/E ratios (Dervisevic et al., 2007; Hultman et al., 1993; Ripamonti et al., 2011) may be partly caused by the device specificity and dependency of isokinetic data (Dervisevic et al., 2007; Hupli et al., 1997; Ripamonti et al., 2011). Moreover, F/E ratios claim to provide the balance of antagonistic flexion and extension strength, however, they are obtained using a maximum test of each muscle group separately (Kellis & Katis, 2007). Since joint loading similarly depends on concurrent force production of both groups (Kellis & Katis, 2007; Solomonow et al.), isokinetic moment ratios are limited in determination of muscle function in LBP. Overall, it has been indicated that the variability of muscle strength impairments in LBP studies is mainly caused by heterogeneity of methodology and standardization, such as distinct LBP definition, type of dynamometer, positioning of patients and inconsistency in protocols used (Balagué et al., 2010; Gleeson & Mercer, 1996; S. Müller et al., 2012). 21
Nevertheless, isokinetic dynamometry has become one of the most commonly used methods to objectively measure trunk muscle strength (Carvalho et al., 2011; Fairbank et al., 2011; Guilhem et al., 2014; Hirschmüller et al., 2005; Ripamonti et al., 2011), allowing a valid (S. Müller et al., 2012) and reliable (Hupli et al., 1997; Hutten & Hermens, 1997) evaluation of LBP patients under safe conditions (Den Hartog et al., 2010; Gleeson & Mercer, 1996; Maul et al., 2005). However, since strength performance furthermore depends on psychological factors (DeVries, 1968a; Roy & Oddsson, 1998) and the functional state of the neuromuscular system, such as the capacity of individuals to activate motor units (David et al., 2008), measuring muscle strength exclusively is not comprehensive enough in the presence of LBP (Newton & Waddell, 1993). In agreement, Grabiner & Jeziorowski (1992, p. 199) concluded that “measures of mechanical trunk function alone cannot provide clinical information relative to the mechanisms underlying functional deficits”.
Surface electromyography of the trunk in LBP Beside force as the mechanical output, muscular strength is from a neural perspective determined by muscle activation, which in turn is denoted by spatial and temporal properties of motor unit recruitment during voluntary muscle contraction (Guilhem et al., 2014; Lippold, 1952). Very briefly, muscular activation is characterized by the one-to-one relationship of the action potential that excites a motor unit, consisting in turn of a motoneuron and its innervated muscle fibres, and the resulting action potential in these muscle fibres. This latter potential, as the trigger for muscle contraction, is measured by electromyography (EMG) (Gottlieb & Agarwal, 1971). Since the first studies of electrical muscle activation by recordings from the skin surface (Piper, 1912) or within muscles by needle electrodes (Adrian & Bronk, 1929), EMG has been found to be feasible and reliable enough to be used in routine diagnosis of muscle diseases (Milner-Brown & Stein, 1975). Whereas needle electrodes allow the recording of individual fibre EMG, surface electrodes non-invasively enable the measurement of the EMG of many motor units appearing as the entirety of their interference pattern (Gottlieb & Agarwal, 1971). Therefore, surface EMG (SEMG) fundamentally and versatilely contributed to the knowledge on trunk muscle function in healthy individuals and LBP patients (De Luca, 1997; Oddsson & De Luca, 2003; Roy et al., 1995). EMG amplitudes, for example, frequently have been investigated for 22
muscle activation differences in LBP (Ahern et al., 1988; Murray et al., 2013; Oddsson & De Luca, 2003; Roy et al., 1990), reporting either higher or lower values (G. B. Andersson et al., 1977; Larivière et al., 2000b; Sihvonen et al., 1991) or no differences in back muscle activation (Nouwen et al., 1987; Roland, 1986) in LBP patients compared to healthy controls. Beside high inter-individual variability, these ambiguous differences were indicated to be caused by unprecise descriptions of patients, electrode positions and protocols (De Luca, 1993; Oddsson & De Luca, 2003; Roland, 1986; Roy et al., 1989). Since fatigability of paraspinal muscles has been identified as a clear risk factor in LBP (Biering-Sørensen, 1984; Luoto et al., 1995; Verbunt et al., 2003), many studies investigated the endurance of back muscles in LBP presence, as another example (Farina et al., 2003; Moreau et al., 2001). Using mean or median frequency analysis, a number of studies used EMG spectrum parameters to assess differences in fatigue between LBP patients and asymptomatic individuals (Larivière et al., 2002; Peach & McGill, 1998; Reeves et al., 2005; Roy et al., 1989, 1995; Roy & Oddsson, 1998). The respective protocols usually are based on sustained isometric contractions at intensity levels of at least 40% - 80% of maximum voluntary efforts (Oddsson et al., 1997; Reeves et al., 2005), requiring an initial assessment of maximum strength capacity. However, as already indicated, LBP patients in pain at the time of testing are likely influenced by psychological factors due to the pain itself or fear of reinjury (Verbunt et al., 2003; Vlaeyen et al., 1999), making the assessment of “true” MVC values difficult (Oddsson & De Luca, 2003; Oddsson et al., 1997). Additionally, the validity of EMG measurements resting exclusively upon fatigue parameters of the erector spinae muscle group frequencies has been doubted (Farina et al., 2003; Larivière et al., 2003; Reeves et al., 2005). Another attempt to evaluate LBP with EMG is based on the findings which showed indications that response latencies are delayed in LBP patients (Hodges & Richardson, 1996; Magnusson et al., 1996; Radebold et al., 2000), resulting in several studies using sudden load-release protocols accompanied by EMG time domain analyses (Ebenbichler et al., 2001; Radebold et al., 2001; Reeves et al., 2005). The demonstrated response latencies of less than 100 ms following load-release (Radebold et al., 2000) indicate that the muscular response is a reflex rather than a voluntary response, suggesting its potential for an 23
objective classification of LBP patients (Reeves et al., 2005). Furthermore, in comparison to EMG fatigue parameters, reflex measures only require low level exertions of about 20% MVC and are reported to be less physically stressful (Reeves et al., 2005). Interestingly, beside reports on sex and age sensitivity, Reeves et al. (2005) presumed that reflex parameters should not be influenced by non-physiologic impairments, questioning its validity in unspecific LBP patients. A further approach to evade the problem of EMG amplitude normalisation, the generation of EMG amplitude ratios, is based on the assumption that the presence of pain in LBP patients is associated with a redistribution of trunk extensor activation pattern resulting in increased asymmetries in the EMG signal (De Luca, 1993). Quantifying either left-right (contralateral) imbalances of back muscles (Oddsson & De Luca, 2003) or altered EMG distribution at different levels (ipsilateral) of the spine (Reeves et al., 2006; Van Dieën, Selen, et al., 2003), poor re-test reliability in contralateral (Larivière & Arsenault, 2008; Larivière et al., 2005) and high influence of confounding factors (force level, contraction type, subcutaneous fat distribution) in ipsilateral EMG ratios (Larivière & Arsenault, 2008) limit its applicability in classification attempts of LBP patients. To sum up, SEMG undoubtedly provides an easy and most acceptable general indication of muscle activation (Hof, 1997). However, beside some more or less serious contributions by different approaches of EMG signal analysis to the understanding of back muscle function in general and in LBP research, the very fundamental relationship between a muscle’s EMG activation and its muscular output has been of constant interest over the decades (MilnerBrown et al., 1986). The awareness of the close dependency of external force and motor unit activation of muscles (Lippold, 1952) frequently has been used to assess the functional state of different muscle groups (David et al., 2008) and to validate further approaches evaluating muscle function based upon this concept (Guilhem et al., 2014; McGill, 1991).
Combining strength and electromyographic measurements in LBP The failure of strength measures to assess LBP (Newton & Waddell, 1993) has been suggested to be mainly caused by its dependency on motivational aspects and fear of reinjury, undermining a truly objective benefit (Vlaeyen et al., 1999). However, when submaximal tasks are combined with trunk muscle activation analysis by EMG, results 24
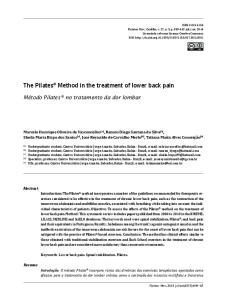
theoretically should be less prone to the influence of psychological factors (Larivière & Arsenault, 2008). In accordance, various investigations used concurrent muscle strength and activation measures of the trunk in the presence of LBP. Following studies measuring trunk muscle activation pattern during heavy lifting (Schultz et al., 1982, 1987; Zetterberg et al., 1987), Grabiner et al. (1992) using isometric trunk extensions could demonstrate changes in neuromuscular control of back muscle excitation in LBP patients (Grabiner et al., 1992). Driven by the hypothesis that chronic LBP patients show higher fatiguing rates of extensor muscles, Roy et al. (1989) compared EMG amplitude and frequency parameters using SMVCs of 40%, 60% and 80% MVC during isometric trunk extensions (Fig. 4).
Findings of impaired neuromuscular control in LBP presence
Figure 4: Example of EMG differences in LBP (Roy et al., 1989)
Figure 4: Mean slope (and SD) of median frequency of M. multifidus (L5 level) during 60s isometric SMVC of 40%, 60% and 80% MVC of n = 12 LBP patients and n = 12 control participants compared by ANOVA (* p < .05) (Roy et al. (1989), p. 997).
Demonstrating muscle-site specific and load-dependent differences of EMG spectral parameters (Fig. 4), Roy et al. (1989) concluded that the protocol, which is not directly influenced by psychological aspects, was able to objectively discriminate muscle function between individuals with and without LBP. Comparing contra-lateral and segmental EMG amplitudes and frequencies of M. erector spinae (L1, L2, L5 level) by isometric SMVC at 40% and 80% MVC intensities, Oddsson & De Luca (2003) found significantly higher imbalances in chronic LBP patients in pain compared to healthy participants. They suggested that acute pain induced a redistribution of synergistic activation patterns of back muscles. Reeves et al. (2006) also investigated intra-muscular EMG distribution within M. erector spinae (L5 and T9 level), comparing male and female athletes with and without LBP during isometric trunk extensions. Interestingly, performing at a constant force level corresponding to about 60% 25
MVC intensity, the LBP patients showed activation imbalances in both directions, either to a more thoracic or to higher lumbar EMG activation. Following up on this, Larivière & Arsenault (2008) used isometric ramp and step contractions to compare intra-muscle EMGratios of M. erector spinae (L1, L5, T10 level) at several SMVC loads (10 - 80% MVC) between chronic LBP patients and healthy individuals of both sexes. In contrast to the findings of Reeves et al. (2006), no effects of pain on coordination patterns were found. After all, the EMG-ratios during submaximal intensities were sensitive to sex, showed good reliability and allowed grouping of individuals that showed similar patterns (Larivière & Arsenault, 2008). Nevertheless, the usage of combined strength and activation measurements seems to be a promising approach to assess the variety of potential changes in neuromuscular function of trunk muscles in LBP. Mechanisms such as higher co-contraction and fatigue (Tesch et al., 1990) and fiber type impairments due to deconditioning (Bilodeau et al., 1992; Roy & Oddsson, 1998) may be relevant. Moreover, especially the indications of altered EMG activation in relation to force development (Tesch et al., 1990), resulting in differences particularly during higher loads (Roy & Oddsson, 1998), emphasize the need for further insights into the force to EMG relationship of trunk muscles during LBP. Following mechanisms found in hemiplegia patients (Bilodeau et al., 1992) and runners with Achilles tendon complaints (Hirschmüller et al., 2005), higher EMG activation of trunk extensor muscles and altered neuromuscular coordination (inter- and intramuscular) very likely have their impact on the force to EMG relationship of trunk muscles in LBP (D’hooge et al., 2013).
1.3 STRENGTH-ACTIVATION RELATIONSHIP (SAR) As already introduced, there have been indications that the relationship of muscular strength and activation (SAR) of lower trunk muscles may be impaired in LBP patients compared to asymptomatic individuals. However, before discussing these alterations in detail, the characteristics of the physiological relationship between strength capacity and muscular activation of human muscles need to be clarified. As early as the 1950’s, Lippold (1952) described signs for “a quantitative relationship between the applied weight and the amplitude of the electromyographic tracing” (Lippold, 1952, p. 492) during load-carrying and superficial muscle activity determination. Lippold was able to show “a linear relation between the integrated electromyogram and the tension produced by a voluntary isometric 26
contraction in a human muscle” (Lippold, 1952, p. 498) with correlation coefficients ranging between r = .93 and .99 (Fig. 5 A). He concluded that the non-existent physiological proportionality between mechanical and electrical response of a single motor unit (MU) is overcome by the summation effect of a large number of MUs recorded by the surface electrodes. Physiologically, both the increase in number of MUs active and their rise in frequency seem to promote this linear relationship (Lippold, 1952). Soon afterwards, Bigland & Lippold (1954a) confirmed the linear relation between signal recorded and force generated during calf muscle contractions of constant velocity, however, reported variations in slope between participants and with changes in velocity. In this example (Fig. 5 B), the coefficient of correlation was found to be r = .93 (above) and .88 (below). The authors concluded that this directly linear relationship of muscle tension-toEMG would be valid for most of the larger muscles and smaller ones with short tendons. In contrast, however, they also reported indications for “a quadratic rather than a linear” (Bigland & Lippold, 1954, p. 214) relationship in certain muscles, e.g. M. tibialis anterior. In order to investigate the underlying physiological mechanisms, Bigland & Lippold performed another study indicating “that gradation of contraction in the muscles investigated is brought about mainly by motor unit recruitment, except at very low and high contractions strengths” (Bigland & Lippold, 1954b, p. 334).
Linear muscle tension-to-EMG relationship
A
B
Figure 5: Linear tension-to-EMG relationship (Lippold, 1952; Bigland & Lippold, 1954)
Figure 5: Muscle tension-to-EMG relationship during (A) 10 ascending isometric calf contractions from 4.5 to 45 kg (10 to 100 arbitrary units) with “best fit” regression line, one participant measured 2 times (Lippold, 1952, p. 496) and (B) calf lengthenings (above) and shortenings (below) (Bigland & Lippold, 1954, p. 218).
27
The proportional increase of muscular activation with strength could also be demonstrated in a fatiguing protocol a few years later (Edwards & Lippold, 1956). Therein, after four minutes of fatiguing isometric contractions, the soleus muscle still showed a liner tensionto-EMG relationship, but with a steeper slope. The authors suggested that the progressive increase of electrical activation was caused by the recruitment of additional motor units compensating the decrease in contraction force (Edwards & Lippold, 1956). When Lenman (1959) investigated the effect of exercise on biceps and triceps muscle strength in patients with muscular weakness due to degenerative diseases, he found “consistent linearity of the curves relating tension to the integrated electromyogram” (Lenman, 1959, p. 192), as well. In contrast, Zuniga & Simons (1969) were one of the first to demonstrate a quadratic rather than the previously reported linear tension-EMG relationship. They used a new technical solution that draws a continuous curve reflecting the summated EMG potentials to muscular force, and asked participants to steadily increase an isometric contraction of the biceps until maximum within 5 seconds. Fig. 6 A shows the resulting plot of one trial, and Fig. 6 B the averaged values of 42 plots. Although the single trial plot (A) may lead to an overestimation of the quadratic tension-EMG curve, the quadratic equation (B) provides a clearly better fit than the linear equation. The authors suggested this nonlinear relationship to be caused by “increasing motor unit synchronization with increasing muscular tension” (Zuniga & Simons, 1969, p. 613).
Elbow flexor EMG
Elbow flexor EMG
Curvilinear muscle tension-to-EMG relationship
A
Tension
B
Tension
Figure 6: Curvilinear muscle tension-to-EMG relationship (Zunig & Simons, 1969)
Figure 6: Tension-to-EMG curves of (A) a single effort and (B) the average of 42 efforts of isometric biceps contraction at 90° elbow flexion, showing SD and “best fit” regression quadratic (dottet line) and linear line (Zuniga & Simons, 1969, pp. 615, 617).
28
The scientific discussion about an either linear or quadratic relationship of muscular tension and electrical activation was compiled by Milner-Brown & Stein (1975), a few years later. After comprehensive analysis of needle and surface EMG data of isometric hand muscle testing, they concluded that the relationship based on the raw EMG signal may proceed indeed non-linearly at moderate to high force levels, however, resulting in an overall close to linear development of the rectified signal. Furthermore, the motor unit recruitment seems to have its largest contribution at low force levels, with the increasing firing rate becoming more important at higher force levels (Milner-Brown & Stein, 1975). In agreement, Moritani & deVries (1978), after investigating isometric elbow flexion in healthy men, confirmed observations of a linear EMG/torque course using unipolar EMG leads, however, reported a rather curvilinear (quadratic) relationship if bipolar recordings were analysed. Others suggested differences in fibre type composition as a possible explanation for non-linear EMG/force relations (Woods & Bigland-Ritchie, 1983).
Strength-activation relationship (SAR) of the trunk From early on, the (either linear or curvilinear) ratio of muscular contraction to electrical activation has been transferred to the concept of ‘efficiency of electrical activity’ (DeVries, 1968a; Fischer et al., 1959), evolving later to ‘neuromuscular efficiency’ (NME) as a measure to evaluate the functional state of muscles (Milner-Brown et al., 1986). The index of NME was considered to describe the amount of muscular activation needed to generate a force (ratio of Force/EMG) of 50% maximum voluntary contraction (Arabadzhiev et al., 2010). The authors assumed, in agreement with Edwards & Lippold (1956), that a decrease in the NME because of fatigue indicated an increased recruitment of motor units to produce the same force output as during the non-fatigued state (Milner-Brown et al., 1986). Subsequently, the concept of NME was commonly pursued in terms of an increasing EMG amplitude during submaximal strength contractions (Arabadzhiev et al., 2010) with the general belief that NME changes are mainly caused by neural drive alterations (Castaingts et al., 2004; Gauthier et al., 1996; Kallenberg & Hermens, 2006). However, regarding the indications for alterations of the relationship between trunk muscle force output and trunk muscle activation, the term ‘neuromuscular efficiency’, being commonly interpreted as fatigue ratio, suggests a causal interpretation and appears to not 29
be specific enough (Lindeman et al., 1999). The meaning of ‘efficiency’, a synonym for economic usage, in context with ‘neuromuscular’ has also been used in the context of EMG reflex activation, spectral parameters or fatigue. Furthermore, for a comprehensive analysis of the muscular strength-to-activation ratio course, it is not enough to consider the intensity of 50% MVC (Lippold, 1952) only. In general, the interpretation of a ratio consisting of two variable factors, here strength and EMG activation, does not allow one to draw conclusions about the cause of possible differences (Hirschmüller et al., 2005). Together with the fact that muscular output, when measured by a dynamometer, is given in parameters of strength nowadays (force or torque instead of tension or contraction in former times), the more specific expression ‘strength-activation relationship’ (SAR) will be used hereinafter. Independent from terminology, in the context of strength and activation measurements, the decisive role of normalization has to be considered. Isokinetic strength performance is related to a variety of physiological aspects (e.g. anthropometrics, sex) as well as the dynamometer device and the protocol (e.g. contraction mode, range of motion) being used (Hutten & Hermens, 1998; S. Müller et al., 2012). Similarly, muscle activation measurements by EMG are highly influenced by technical (e.g. electrode application and placement, amplification), physiological (e.g. subcutaneous fat thickness, muscle length) and protocolspecific (e.g. task execution, contraction velocity) factors (Burden, 2010; Lehman & McGill, 1999). Accordingly, to allow comparisons of combined isokinetic and EMG data between trials, individuals and studies, and to avoid misinterpretation of measurement results, normalization of data is necessary (Lehman & McGill, 1999). In the specific context of SAR investigations, Fuglsang-Frederiksen & Månsson (1975), for example, were among the first to rely on submaximal loads as a fixed proportion of maximum effort when comparing isometric elbow flexion/extension characteristics. Later, J. F. Yang & Winter (1983) confirmed the superior reliability of isometric SMVC contractions in general, which was later supported by others investigating SMVC validity in healthy individuals (Brown & McGill, 2008; I. A. Stokes et al., 1987) and reliability in LBP populations (McGill, 1991; O’Sullivan et al., 2002). Just recently, Guilhem et al. (2014) reported the validity of submaximal torque measurements (0 to 80% MVC) together with EMG analysis (proportional to MVC activation) of the trunk, however, as all the other studies that have been mentioned before, this was limited to isometric contraction mode. 30
1.4 RESEARCH PARADIGM In the last decades, many scientific investigations with very different attempts have tried to research neuromuscular alterations of trunk muscles assumed to be associated with LBP. Widely recognised pain models suggest an adaptable centrally controlled strategy of trunk stiffening in response to LBP, conceived to stabilize the affected and surrounded structures and to protect them from further injury (Hodges & Tucker, 2011; Panjabi, 1992; Van Dieën, Selen, et al., 2003). To assess these changes in neuromuscular control biomechanically, strength capacity and muscular activation measures of the trunk have proven to be the methods of choice (Fairbank et al., 2011; Tesch et al., 1990). However, supporting evidence for the aforementioned models is limited almost exclusively to static measurements. Moreover, maximum performance efforts, being mandatory for appropriate normalization procedures, are likely influenced psychologically in LBP patients (Ripamonti et al., 2011). Alternatively, repeated findings indicate that the fundamental relationship of muscular strength and activation (SAR) is impaired in back muscles during LBP presence (D’hooge et al., 2013; Grabiner & Jeziorowski, 1992; Panjabi, 2006; Roy et al., 1989; Silfies et al., 2005). A valid and feasible measurement protocol, however, providing benefits for therapeutic as well as preventive concepts, still needs to be established (Guilhem et al., 2014; S. Müller et al., 2012; Ripamonti et al., 2011). The main purpose of this thesis was to investigate the dynamic neuromuscular efficiency of lower back muscles in LBP. As the neuromuscular control of the trunk has shown to be compromised diversely in people with LBP (D’hooge et al., 2013; Hodges & Tucker, 2011; Van Dieën, Selen, et al., 2003), changes of the trunk’s SAR in terms of a decreased efficiency of force production (Lippold, 1952; Milner-Brown et al., 1986) appear necessarily. To establish a relevant measurement protocol, however, it must first be determined if it is methodologically valid to depict the NME of lower back muscles using the SAR approach. Then, one must investigate in terms of content if this approach is capable to display known physiological aspects in a non-symptomatic population. Finally, the clinical applicability of the SAR protocol in LBP patients had to be verified, considering the fact that psychological pain-related inhibitions possibly make them incapable of producing maximum strength efforts. 31
1.4.1 Development of the method First, a protocol that assesses the SAR of the trunk in an objective, reliable and valid manner needed to be developed in the present thesis. From a methodological point of view, the use of isokinetic dynamometry to measure the mechanical output (= strength) together with EMG recordings of the neural input (= activation) are the most suitable methods, each representing the ‘gold standard’ of their discipline (Hof, 1997; S. Müller et al., 2012; Van Damme et al., 2013). However, only very few studies are available including trunk muscle activation recordings during varying extension loads (Guilhem et al., 2014; Roy et al., 1989; Tan et al., 1993), as essentially required for a SAR protocol (Lippold, 1952). All of these studies are restricted to the use of isometric contractions and SMVC normalization to initially performed MVC trials. In doing so, the high variability in maximum strength capacity of trunk muscles between individuals is circumvented (Hutten & Hermens, 1998; S. Müller et al., 2012) and comparison of its associated muscular activation between trials, muscles and individuals is enabled (Burden, 2010). However, although strength measurements do not necessarily have to be biased in people with LBP (Hutten & Hermens, 1997; Larivière et al., 2000b), psychological aspects like motivation, fear of reinjury and pain always have to be considered (Mannion et al., 1996; Oddsson & De Luca, 2003; Vlaeyen et al., 1999). As data concerning test-retest reliability of isokinetic trunk dynamometry is limited (Caruso et al., 2012), an additional MVC trial at the end of a SAR protocol is potentially useful to control the influence of motivation and acute pain in LBP context. Moreover, the comparison of muscular SMVC activation offers additional benefits, as EMG signals recorded during SMVC revealed superior reliability (De Luca, 1997; J. Yang & Winter, 1983), especially when achieved in pain populations (McGill, 1991; O’Sullivan et al., 2002). An initial pilot study investigating inter-individual SAR differences in a static setting appears to be reasonable. Besides its static stabilization task, most functions of the trunk are of dynamic nature and involve movements that are associated with pain and injuries in LBP (Marras et al., 1995; Roy & Oddsson, 1998). It has been found that with increase of dynamic trunk characteristics, the strength capability decreases while both agonistic and antagonistic muscle activation is elevated, causing in turn significant increases of spinal loads compared to isometric conditions (Davis & Marras, 2000). Accordingly, the development of EMG methods involving strength measurements during non-isometric contraction tasks has been 32
recommended (Roy & Oddsson, 1998). For technical and standardization reasons, only a few studies characterized both strength and activation of trunk muscles during isokinetic movement (Davis & Marras, 2000; Ripamonti et al., 2011; Van Damme et al., 2013). However, technical limitations of isometric SMVC strength testing, leading in part to divergent EMG activation levels depending on either ramp or step contraction protocols, are overcome using isokinetic contractions (Larivière & Arsenault, 2008). Therefore, a protocol derived from isometric SAR studies (Guilhem et al., 2014; McGill, 1991; Roy et al., 1989) transferred on dynamic trunk movements appeared to be promising. Whereas MVC normalization reached broad agreement at least in pain-free populations, the most appropriate contraction mode, especially in combination with recordings of muscular activation, is an ongoing matter of debate. Traditional postulations for the exclusive use of isometric MVC (De Luca, 1997) are increasingly challenged by findings indicating that nonisometric task contractions should instead be normalized to MVC of the same dynamic contraction type (Burden, 2010; Dervisevic et al., 2007). From early on, isokinetic trunk testing has been suggested to provide a means of controlled movement evaluation (Marras et al., 1984). In addition, differences in trunk strength capacity and EMG activation between contraction modes have been found to be lower than in other muscles (Burden et al., 2003), which is assumed to be caused by the complex interplay of the entirety of trunk encompassing musculature (Tesch et al., 1990). Accordingly, to investigate if isokinetic MVCs produce similar peak activation as isometric ones, the activation levels of major trunk muscles needed to be compared between MVCs of relevant dynamic contraction modes. Regarding potential causes and/or implications of assumed SAR alterations in LBP, altered inter- and intramuscular coordination has been reported frequently in the presence of LBP (Cholewicki et al., 1997; Larivière & Arsenault, 2008; Panjabi, 1992). Findings of increased agonistic and antagonistic muscle activation, particularly during trunk extensions, have been considered as neuromuscular adjustments to compensate for loss of spinal stability (Cholewicki et al., 1997; Larivière et al., 2000b). In addition, higher lateral and thoracic extensor activation was found in LBP patients, possibly reflecting a redistribution of synergistic activation in response to lumbar pain (J. M. Mayer et al., 2005; Van Dieën, Cholewicki, et al., 2003). Thus, antagonistic co-activation and synergistic activity distribution had to be evaluated additionally during strength development within the SAR protocol. 33
1.4.2 Validation of the method Before applying the SAR trunk protocol on LBP patients, an investigation including healthy individuals was reasonable, aiming to evaluate the usual manifestation of neuromuscular efficiency and co-activation of trunk muscles, and the feasibility of the protocol (Bilodeau et al., 1992). Because of well-known physiological differences in strength capacity (Langrana & Lee, 1984; S. Müller et al., 2012) and sufficient indications for differences in the SAR (David et al., 2008; Komi & Karlsson, 1978), sex as grouping criteria appeared to be appropriate. Although, the on average lower absolute values of maximum strength development in women do not automatically mean a lesser degree of neuromuscular efficiency, together with findings of equal or better fatigue resistance (Langrana & Lee, 1984) and differences in fiber type distribution of the trunk (Mannion et al., 1997) compared to men, the distinction of SAR between sex seemed promising. Moreover, because of the contradictory reports about differences in LBP prevalence (Balagué et al., 2010; Hoy et al., 2014; MacDonald et al., 1997), the comparison of males and females with the SAR protocol became even more interesting. Accordingly, the neuromuscular efficiency and co-activation of trunk muscles needed to be investigated between healthy individuals of both sexes using the SAR protocol.
1.4.3 Transfer of the method to LBP patients Finally, considering that LBP patients may not be able to retrieve whether maximum strength efforts during MVC due to psychological inhibitions, it had to be clarified if the SAR protocol is an applicable alternative in this clinical setting. Based on the aforementioned alterations of neuromuscular control of the trunk, it had to be investigated whether the neuromuscular efficiency of trunk muscles, represented by their SAR, is reduced in people with LBP. Furthermore, the role of antagonistic and synergistic co-activation of trunk muscles during the SAR protocol associated with LBP was a secondary purpose. Therefore, a test-retest investigation on the basis of a within-patient comparison between acute and pain-free status appeared to be indicated. In doing so, although the cause-effect relationship between pain and trunk muscle control cannot be determined, this will shed light on the effect of acute pain on altered functional parameters of trunk muscles in LBP. Please find the order of measurements summarized in section 2.1.1. 34
1.4.4 Research questions With regard to the above paragraphs, the following research questions (RQ) had to be clarified methodologically in a pilot stage, before targeting the main objectives of this thesis. RQ1:
Can the neuromuscular efficiency of lower back muscles be expressed biomechanically by means of the strength-to-activation (SAR) relationship? RQ1a: Does a measurement protocol using submaximal isometric contractions clearly discriminate the strength-activation relationship of back muscles between healthy individuals and patients suffering from LBP? RQ1b: Are maximum voluntary contractions in dynamic mode suitable to produce maximum electromyographic activation during trunk extensions?
With the measurement protocol being methodologically constructed, a content-related validation needed to be done within another investigation: RQ2:
Is the strength-activation relationship protocol valid to determine sex differences in neuromuscular efficiency of lower back muscles during dynamic trunk extensions?
Finally, with the method for the assessment of neuromuscular efficiency of the trunk established, the clinical applicability of the protocol had to be proven by investigating neuromuscular efficiency in patients suffering from low back pain: RQ3:
Is the neuromuscular efficiency of lower back muscles, assessed by the SAR protocol, decreased in LBP patients during an acute pain episode?
Beside these main research questions, two further aspects had to be evaluated within the scope of the SAR method (RQ1a, RQ2 and RQ3). On the one hand, the robustness of peak torque and activation values during reference MVC trials was of interest regarding reliability of the normalization method. Furthermore, the inter- and intra-muscular coordination in terms of antagonistic co-activation and synergistic activity distribution during the SAR protocol needed to be evaluated for better insight into underlying mechanisms.
35
CHAPTER 2 – MATERIALS AND METHODS 2.1 GENERAL ASPECTS AND METHODS OF THE SAR APPROACH 2.1.1 Order of measurements Following the given research questions (RQ1 to RQ3), the measurements of this thesis have been divided into three main parts that build on one another. In study 1 (S1), the measurement protocol, aiming to access the neuromuscular efficiency of lower back muscles represented by the strength-activation relationship (SAR), has been validated methodologically. Therefore, a single-case (S1a) and contraction mode comparison (S1b) were conducted. In study 2 (S2), the validity of the SAR protocol has been investigated exemplarily by comparing the neuromuscular efficiency of trunk muscles between healthy males and females. In the final study 3 (S3), the influence of pain on the neuromuscular efficiency of lower back muscles was evaluated by measuring LBP patients with the SAR protocol. Accordingly, after declaration of overall aspects of the SAR method, the details of each of the three research questions and the related studies are presented individually (Fig. 7).
Study overview
Figure 7: Flowchart of overall thesis measurements
Figure 7: Flowchart of overall measurements (S1 - S3) according to the research questions (RQ1 - RQ3).
36
2.1.2 SAR protocol The main features of the strength-activation relationship (SAR) protocol remained the same during all measurements (S1a, S2, S3). The protocol started with a warm-up consisting of 30 repetitions of trunk extension and flexion with the focus on prompt execution at ~ 50% of maximum effort. Near the end of the warm-up, participants were encouraged to execute three to five repetitions with almost maximum effort (~ 90%), serving as practice trials for the following exertions (Roy et al., 1989). The actual SAR protocol (Fig. 8) always began with a maximum voluntary contraction trial (MVC1) in either isometric (S1a) or isokinetic (S2, S3) contraction mode. To encourage participants to access maximum strength output, the investigator verbally encouraged them during completion of the trial (Burden, 2010; Campenella et al., 2000). In addition, EMG activation was recorded during MVC repetitions. Afterwards, submaximal voluntary contractions (SMVC) were performed in a standardized order. In order to make the participants familiar with visual biofeedback (section 2.1.3, page 39) (Baltzopoulos et al., 1991; Campenella et al., 2000; Lindeman et al., 1999), several SMVC training trials were executed before actual testing. Thereby, emphasis was placed on achieving the most accurate performance while following the prescribed torque intensity given by the on-screen target corridor. The SMVC loads were consistently composed of 20, 40, 60 and 80% of MVC torque output (SMVC20-80), executed in the given order (Lindeman et al., 1999). The deliberate choice was made to not randomize the SMVC sets, in favour of a stepwise increase of load from 20% up to 80% to minimize a possible influence of fatigue. The occurrence of either dizziness, feelings of insecurity or fear, fainting or sudden strong pain was defined as general abort criteria.
Strength-activation relationship (SAR) protocol
MVC: maximum voluntary contraction
SMVC: submaximal voluntary contraction
Figure 8: Flowchart of strength-activation (SAR) protocol
Figure 8: Schematic flow chart of strength-activation protocol (SAR)
37
2.1.3 Dynamometry Within all studies of the present thesis, trunk muscle torque measurements were performed using a Con-Trex MJ isokinetic dynamometer (Model MJ, physiomed AG, Germany) connected to a specific trunk module (Con-Trex TP 1000, Fig. 9). This dynamometer has been designed to enable measurements of angular position, angular velocity and inertia compensated torque during movement in the sagittal plane. After the participants were placed in the TP module in an upright position (Baur et al., 2010; Guilhem et al., 2014; Van Damme et al., 2013), the device was adjusted to their anthropometrics. The axis of rotation was set in accordance with the intersection point of the mid-axillary line and the lumbosacral junction (L5-S1 level) (Hermann & Barnes, 2001), approximately 3.5 cm below the iliac crest (Van Damme et al., 2013). The feet were positioned on a horizontal plate with the heels against the footplate heel cup. A pad against the back of the knees along with two rests for the legs below (tibia) and above (thigh) the kneecap respectively (Baur et al., 2010; Van Damme et al., 2013) fixated the knee in 10-20° flexed position (Guilhem et al., 2014). Using a non-expandable belt across the anterior superior iliac spine, the hip was fastened firmly to the lumbar pad (Baur et al., 2010; Guilhem et al., 2014; Van Damme et al., 2013). In addition, the scapula pad was adjusted across the centre to lower half of the scapula with the chest pad aligned at the same height and properly tightened (Van Damme et al., 2013). A pair of handgrips mounted to the chest pad ensured a standardized arm position.
Trunk strength dynamometer
Figure 9: Trunk strength dynamometer (Con-Trex MJ with TP module)
Figure 9: Con-Trex TP 1000 module (A) connected to MJ dynamometer (B), driven by a computer (C). Range of motion (ROM): 45° trunk flexion to 10° extension (0° = resting position). Please also compare Guilhem et al. (2014).
38
Trunk flexion and extension movements were performed within a range of motion (ROM) of 45° flexion to -10° extension (i.e. 55° ROM; 0° vertical starting position) (J. Müller et al., 2014). To ensure that the pre-set ROM was constantly reached during all isokinetic repetitions, a change of the movement direction before reaching the end of ROM was not permitted (Bardis et al., 2004). All strength measurements were corrected for gravitational influences (Baltzopoulos & Brodie, 1989) by determination of the torque resulting from upper body mass including the effect of stretched tissues near the endpoints of movement in passive mode throughout the whole ROM, before the isometric and isokinetic exercises (Baltzopoulos & Brodie, 1989; Bardis et al., 2004; Guilhem et al., 2014). Visual biofeedback was used for torque performance during SMVC trials (Shafat et al., 2004). On the basis of the first MVC trial the operating software displayed a target corridor (SMVC torque ± 10%) on a screen in front of the study participants with the produced torque imaged in real-time enabling the participants to adapt to the reference torque corridor at any time (Fig. 10).
Visual biofeedback of SMVC torque production
Figure 10: Target torque corridor given by dynamometer software
Figure 10: Target torque corridor (light grey hatched band) by Con-Trex operation software for on-screen biofeedback during SMVC trials; examples given for (A) too high, (B) initially to high then too low, (C) optimal torque production (thin black line).
Sampling frequency of data was 1000 Hz. The torque output was real-time displayed and stored using the manufacturer’s software (Con-Trex human kinetics; version 1.7.3). To synchronize the data of muscular activation with the dynamometer output, information on angular position, velocity and torque were also transmitted to the EMG software. In all reference MVC measurements, peak torque in Newton meters [Nm] of either the highest value (isometric) or the 3 highest out of 5 repetitions (isokinetic) were used (Baur et al., 2010; Kannus, 1994; F. Mayer et al., 2001; S. Müller et al., 2007). 39
2.1.4 Electromyography (EMG) EMG setup and recording The activation of trunk muscles was assessed by surface electromyography (SEMG). On the hardware side, a wireless telemetry system (myon m320, myon AG, Switzerland) providing up to 32 EMG channels was utilized. The detected EMG signals were displayed, stored and post-processed using the LabVIEW (National Instruments, Austin TX, USA) based software Imago (pfitec, Endingen, Germany). The individual EMG setup consisted of six to 12 channels depending on the submeasurements (S1-S3, see below). Each lead consisted of a pair of disc shaped (size 40.8 x 34.0 mm, sensor area 10 mm²) disposable Ag/AgCl (silver/silver chloride) electrodes (Ambu Blue Sensor P, Ambu A/S, Denmark, Fig. 11 A) which were placed bilaterally on back and abdominal muscles. The skin at the electrode sites was shaved, gently abrasioned with sandpaper and cleaned with an alcohol solution to obtain an inter-electrode impedance of less than 5 kΩ according to S.E.N.I.A.M. (‘Surface EMG for a Non-Invasive Assessment of Muscles’) recommendations (Hermens et al., 2000; Hirschmüller et al., 2005).
EMG system hardware
A
B
C
Figure 11: EMG electrodes and hardware (myon 320)
Figure 11: Electrodes (A), Transmitter Box (B) and Receiver Box (C). Source: myon 320 product data sheet.
The pre-gelled electrodes were placed with a centre-to-centre spacing of 20 mm (Hermens et al., 2000) in parallel orientation to the muscle fibres over the following main trunk extensor and flexor muscles (Borghuis et al., 2008; Guilhem et al., 2014): the three extensors – lumbar erector spinae (ESL, 3 cm lateral to L3 spinous process), thoracic erector spinae (EST, 5 cm lateral to T9 spinous process) and latissimus dorsi (LD, lateral to EST over the muscle belly), and the three flexors – rectus abdominis (RA, 3 cm lateral to the 40
umbilicus), external oblique (EO, 15 cm lateral to the umbilicus) and internal oblique (IO, approximately 2 cm lower than the most prominent point of the anterior superior iliac spine in the direction of the symphysis pubis, superior to the inguinal ligament), on each side of the body (Boccia & Rainoldi, 2014; Cholewicki & McGill, 1996). This electrode placement setup has demonstrated a maximal signal-to-noise ratio with minimized levels of cross-talk in earlier studies (Cholewicki & McGill, 1996; Cholewicki et al., 1997; McGill, 1991; Radebold et al., 2000). After the wireless transmitter boxes (m320TXB, myon AG, Switzerland, Fig. 11 B) were connected by press studs to the electrodes, they were fixed to the skin with adhesive tape. Attention was paid to ensure that the cables had sufficient leeway to not come under stress and that the participant was not restricted during trunk movement. Before starting the measurements, both the EMG resting signal and the activation signal were visually checked for plausibility using appropriate function tests. The detailed 12-lead EMG trunk setup is shown in Fig. 12 below.
12-lead surface EMG trunk setup
Figure 12: Surface electromyography (EMG) setup
Figure 12: Surface EMG trunk setup - 12 bipolar leads. Upper row: Back muscles, Lower row: abdominal muscles. Left: fully prepared measurement setup including wireless transmitter boxes. Middle: schematic progression of derived musles including electrode position (exemplarily unilateral). Figures adapted out of Pocket Atlas Anatomy (Platzer, W.), 2005, Edition. 9.
41
The recorded muscle activation signals (sampling rate 4000 Hz per channel, resolution rate 12 Bit, differential pre-amplified (gain 1000), bandwidth [5-500 Hz], 3dB) were forwarded wirelessly (transmission frequency 2.4 GHz, constant latency 16 ms) from the transmitter units to the receiver box (myon m320RX, myon AG, Germany, Fig. 11 C). The A/D-converted signals (DAQCard 6062E, 500 kS/s, 12-Bit, National Instruments, Austin TX, USA) were displayed and stored on a computer using the Imago Record module before further analysis.
EMG signal analysis and outcome parameters The post processing of EMG signals was performed offline using the Imago module Process Master (Imago, pfitec, Endingen, Germany). In general, the three dynamometer channels (position, velocity and torque), recorded in addition to the EMG channels, were used to trigger and/or cut the EMG files before further processing. The triggers were placed manually (‘Trigger Generation’ module) following standardized criteria and blinded to participant number or group assignment of the individual trial. Based on these triggers, the EMG signal was fit to smaller pieces (‘Trigger Cut’ module) before the signal offset was adjusted (‘Set Zero’ module) with the zero line calculated as the mean of the area (De Luca, 1997). A full-wave rectification (‘Rectification’ module) was performed next using the absolute value of each data point of the EMG signal during further analysis (De Luca, 1997; Hof, 1997). During all measurements including the SAR protocol, the root-mean-squared value (RMS [V], ‘RMS’ module) was computed as the output parameter of the EMG amplitude (De Luca, 1997; Hof, 1997). Then, after being averaged between sides, the absolute RMS values were normalized to MVC1 amplitude values (Guilhem et al., 2014), to obtain the normalized EMG activation according the requirements of the SAR protocol. Beside analysis of individual muscle EMG, the activation of the three extensor leads (ESL, EST, LD) and the three abdominal muscles (RA, OE, OI) was averaged to receive an extensor (ALLext) and a flexor (ALLflx) EMG ‘equivalent’, respectively (Cholewicki et al., 1997). Except the normalization process, the EMG activation of the final MVC trial at the end of the measurements (MVC2) was processed in the same manner, enabling the validation of reference activation during MVC1 by comparison to MVC2 activation. Independently, during contraction mode comparison of S1b, the moving average (MVA [V]) was chosen as the output parameter, ensuring comparability between modes. 42
2.1.5 Statistics For the statistical analysis and graphs the Statistical Package for Social Sciences (SPSS, IBM V.22) and Excel (Microsoft Office V.10) were used. After completion of collection, all data were transferred into a database and checked for plausibility using range check. Implausible values and outliers were double-checked and corrected or erased accordingly. Descriptive data is presented as mean ± standard deviation (SD) and/or by total span [Max; Min]. Before comparison of mean values between participants and/or groups, data of dependent variables were tested for normal distribution (Shapiro-Wilk). During all comparisons, the significance level was set to α < .05. Besides the main objectives, i.e. the development (S1), validation (S2) and application in LBP patients (S3) of a new protocol that assesses the strength-activation relationship (SAR) of lower back muscles, two sub-questions have been explored in the measurements of the present thesis. On the one hand, the reproducibility of the initial MVC1 trial, serving as reference for SMVC20-80 loads and normalization of EMG activation during the SAR protocol, has been evaluated by including another MVC trial (MVC2) at the end of the protocol. Secondly, alterations of agonistic co-activation and synergistic activity distribution, indicated to be associated with impaired neuromuscular efficiency of lower back muscles, have been investigated during analysis of all measurements using the SAR protocol (S1a, S2, S3).
Reliability Peak torque and absolute EMG activation between MVC1 and MVC2 were compared using:
Coefficient of variation (CV (%) = SD / mean) (Atkinson & Nevill, 1998)
Intraclass correlation coefficient (ICC, 2.1) with 95% confidence interval (CIlower, CIupper) (Caruso et al., 2012; Shrout & Fleiss, 1979)
Test-retest variability (TRV (%) = (|xi - yi| * 0.5 (xi + yi)) * 100, where xi is MVC1 and yi is MVC2 for subject i) (König et al., 2013; F. Mayer et al., 1994)
Limits of agreement analysis [bias ± 1.96 * SD = 95% - absolute limits of agreement, LoA, in Nm (torque) and V (EMG)] (Bland & Altman, 1986; Nevill & Atkinson, 1997) for torque and EMG data (Atkinson & Nevill, 1998; Hopkins, 2000). 43
Inter- and intramuscular coordination patterns To evaluate possible associations of SAR alterations and differences in inter- and intramuscular coordination patterns, a) co-contraction of abdominal muscles and b) synergistic activity distribution within ES (ESL, EST) and over back muscles (ESL, EST, LD) were analysed during all measurements that used the SAR protocol (S1a, S2, S3): H_0a): The co-contraction of abdominal muscles during trunk extension in the SAR protocol does not differ between individuals (S1a), between sexes (S2) and between acute and pain-free status in low back pain patients (S3). H_1a):
The co-contraction of abdominal muscles during trunk extension in the SAR protocol differs between individuals (S1a), between sexes (S2) and between acute and pain-free status in low back pain patients (S3).
In the single-case comparison of S1a, the co-activation analysis of abdominal muscles (individual and ALLflx) was conducted descriptively using the EMG of antagonistic activation during MVC1 trunk extension, since MVC activation in trunk flexion was not available because of the measurement protocol. Because of the reduced EMG setup in sex comparison of S2, co-activation analysis of abdominal muscles was restricted to M. rectus abdominis (RA), however, this time normalized to agonistic activation during trunk flexion of MVC1. Since samples did not met criteria of normal distribution (Shapiro-Wilk, p < .01), an independent samples Mann Whitney U-test was used. In LBP patient comparison, coactivation in relation to agonistic activation (similar to S2) was compared between AP and NP by paired t-test and repeated measures ANOVA
for individual muscles and ALLflx
(α = .05). H_0b): The synergistic coordination pattern of trunk extensors in the SAR protocol does not differ between individuals (S1a), between sexes (S2) and between acute and pain-free status in low back pain patients (S3). H_1b):
The synergistic coordination pattern of trunk extensors in the SAR protocol differs between individuals (S1a), between sexes (S2) and between acute and pain-free status in low back pain patients (S3). 44
In order to analyse the contribution of each of the back muscles to overall trunk extensor EMG activation, their individual RMS output was put in relation to the overall EMG activation of all back muscles taken together. After descriptive comparison within S1a singlecase measurements, intra-muscular activity proportion of ES levels (ESL, EST) in S2 was tested for sex differences using an independent samples t-test (α = .05). During analysis of S3 LBP patients during AP and NP, the comparison of synergistic activation (including LD) at each SMVC load by paired t-test was complemented by a repeated measures ANOVA (α = .05).
45
2.2 STUDY 1 (S1) - DEVELOPMENT OF THE METHOD - PILOT STUDIES 2.2.1 Single-case comparison (S1a) Participants (S1a) After the main features of the measurement protocol had been outlined, a single-case comparison was conducted to see if it works. To find a preferably high difference in SAR of low back musculature, the two participants were chosen by certain physiological characteristics and LBP prevalence. Apart from divergent reports of most recent findings (Hoy et al., 2014; Murray et al., 2012) females at the age of 40 to 69 years commonly showed the highest prevalence of LBP, while males in their twenties showed the lowest (G. B. Andersson, 1999; Hoy et al., 2012). In addition, several reviews and international guidelines consistently found that low levels of physical activity are associated with LBP development (Airaksinen et al., 2006; Cavanaugh et al., 1997; Henschke et al., 2010; Van Tulder et al., 2006). Accordingly, a healthy male (30 yrs, recreationally active) and a female chronic LBP patient in remission of pain (49 yrs, sedentary) were compared in the first SAR testing session (S1a, Tab. 2). Table 2: Anthropometric data S1a Participants (N = 2)
Age [yrs]
Weight [kg]
Height [m]
Low back pain
patient (female)
49
55
1.68
chronic (>15 yrs)
control indivdual (male)
30
87
1.84
none
Age, weight and height for female patient with chronic low back pain and male healthy control participant.
Within the framework of all investigations (S1 - S3), participants gave their written informed consent after receiving detailed information regarding the nature, aims and risks associated with the measurement protocol. Allowance for the completion of the studies was granted by the University of Potsdam Ethics Commission. All measurements were conducted in accordance with Declaration of Helsinki. Previous to all measurements, a physical examination by experienced sports medicine physicians was obligatory to secure eligibility of participants.
46
Protocol (S1a) The chronic LBP patient in remission of pain and the non-symptomatic participant had to perform the SAR protocol in isometric mode, aiming to have a preferable highly standardized situation (De Luca, 1997). After warm-up, several sets of 5-second isometric trunk extensions in 20° trunk flexion had to be performed: familiarization trial, three reference MVC1 trials (1 min rest in between), SMVC contractions. Each of the SMVC loads at 20 to 80% MVC1 (SMVC20-80) started with a familiarization trial, followed by three submaximal isometric trunk extensions separated each time by 1 min rest (Larivière & Arsenault, 2008). After a break of 3 min, another MVC trial (MVC2) completed the protocol.
Isometric SAR protocol – single-case comparison (S1a)
MVC1/2: maximum voluntary contraction trials
SMVC: subMVC trials
Figure 13: Flowchart of isometric SAR protocol (S 1a)
Figure 13: Schematic flowchart of isometric strength-activation relationship (SAR) protocol (S1a).
Measurement methods (S1a) Dynamometry: Peak torque of MVC1/2 was derived from the maximum torque value within the mid 3 seconds of the 5-second isometric torque trial (Fig. 14), before the target torque (%MVC1) was presented to the participants during submaximal isometric trials (SMVC20-80).
Isometric peak torque determination
Figure 14: Peak torque analysis of maximum voluntary contractions (MVC) in isometric mode
Figure 14: Peak torque [Nm] determination of isometric (highest value of 5 s trial) max. voluntary contractions (MVC).
47
EMG: During the SAR single-case comparison (S1a), the complete 12-lead EMG setup (extensors: ESL, EST, LD; flexors: RA, OE, and OI) was derived (see 2.1.4). For analysis of maximum EMG activation during each of the three 5-second isometric MVC and SMVC of the pilot validation measurements (S1a), a window of ± 250 ms around constant peak torque plateau was visually determined and triggered (compare Fig. 14) (Larivière & Arsenault, 2008). In addition, a trigger was placed to the EMG resting signal prior to the strength measurement, with the participant already driven to the testing position. Then, the EMG signal was cut into pieces with a defined length of 500 ms (“Trigger Signal Cut” module).
Statistics (S1a) For the first validation of the proposed SAR protocol in trunk extension, consisting of submaximal voluntary contractions (SMVC) with different loads in proportion to maximum voluntary contractions (MVC), the SAR comparison of a healthy individual and a low back pain patient is limited to descriptive analysis based on individual mean values: RQ1a:
Does the SAR of a healthy participant and a low back pain patient, compared by the SAR protocol in an isometric setting, clearly proceed differently?
2.2.2 Reference MVC contraction mode comparison (S1b) Participants (S1b) To decide whether to use static or dynamic contractions during the reference MVC1 trial of the SAR protocol, peak force and EMG activation during MVCs of different contraction modes were compared. Therefore, a sub-analysis of data of selected participants of another in-house intervention study was used. Paying attention to only include healthy and symptom-free participants, n = 17 participants were analysed within S1b (Tab. 3). Table 3: Anthropometric data S1b Participants
Age [yrs]
Weight [kg]
Height [m]
males (n = 10)
24 ± 6
80 ± 9
1.82 ± 0.09
females (n = 7)
27 ± 9
60 ± 4
1.72 ± 0.13
overall (N = 17)
25 ± 7
71 ± 12
1.78 ± 0.11
Average age, weight and height for healthy male and female participants (mean ± SD).
48
Protocol (S1b) After an extensive warm-up, the protocol consisted of two isometric trials (ISM; trunk extension and flexion, both in 17.5° trunk flexion for 5 s) and four isokinetic trials (ROM: 45° flexion to 10° extension) - three in concentric (CON30/60/120; 30°/s, 60°/s and 120°/s, each 5 repetitions) and one in eccentric mode (ECC; 30°/s, 5 repetitions), each with 60 s rest.
MVC contraction mode comparison protocol S1b
MVC: maximum voluntary contraction ISM: isometric CON: concentric ECC: eccentric Figure 15: Flowchart of MVC contraction mode comparison protocol ( S1b)
Figure 15: Schematic flowchart of MVC contraction mode comparison (S1b)
Measurement methods (S1b) Dynamometry: For ISM trials, peak torque [Nm] was extracted from the maximum torque value within the mid 3 seconds plateau (similar to S1b). Peak torque of CON and ECC trials was analysed from the torque curves of the each 5 repetitions, after periods of high inertia influence were filtered (Fig. 16). These ‘peak torque overshoot’ (Ayers & Pollock, 1999) artefacts, contained in the torque output, are caused by the inertial forces during phases of acceleration and deceleration before the achievement of the constant pre-set angular velocity, and need to be excluded from analysis (Baltzopoulos & Brodie, 1989).
Isokinetic peak torque determination
Figure 16: Peak torque analysis of maximum voluntary contractions (MVC) in isokinetic mode
Figure 16: Peak torque [Nm] determination isokinetic (3 highest out of 5 rep.) maximum voluntary contractions (MVC).
49
EMG: The complete 12-lead EMG setup (ESL, EST, LD, RA, OE, OI) was derived (see 2.1.4). For the comparison of maximum absolute EMG activation during MVC validation measurements (S1b), trigger placement depended on contraction mode. Similar to the S1a procedure, for isometric (ISM) contractions, a ± 500 ms-window around constant peak torque plateau was used. The triggers for isokinetic concentric (CON) and eccentric (ECC) contractions were set using the velocity signal supplied to EMG recordings by the dynamometer. Therein, the signal was cut such that only the respective isokinetic phase of repetitions was left for further analysis. Then, the fitted and time normalized signals (“Time Normalization” module) of ISM, CON and ECC were smoothed using a moving average filter (MVA, “Filter” module), computing the running average EMG amplitude (50 th order).
Statistics (S1b) Aiming to identify a contraction mode that produces significantly higher EMG activation values during a MVC trial, a one-way repeated measures Analysis of Variance (ANOVA (α = .05)), with Holmes stepdown Bonferroni adjustment to account for multiple testing, was used to test the agonistic muscle activation during trunk extension and flexion for differences between the five contraction modes. RQ1b:
Are maximum voluntary contractions in dynamic mode suitable for producing maximum electromyographic activation during trunk extensions? H0_S1b: Maximum neuromuscular activation of the trunk, assessed by EMG during MVC in trunk extension and flexion, does not differ between isometric and isokinetic concentric/eccentric contractions. H1_S1b: Maximum neuromuscular activation of the trunk, assessed by EMG during MVC in trunk extension and flexion, shows higher values during isometric than during isokinetic concentric/eccentric contractions.
50
2.3 STUDY 2 (S2) - VALIDATION OF THE METHOD - SEX COMPARISON Participants (S2) After the pilot measurements of S1 and before its employment on a LBP patient cohort in S3 testing, the SAR protocol was extended to an isokinetic setup comparing the neuromuscular efficiency of lower back muscles between sexes. Fifty healthy participants (males (M): n = 25; females (F): n = 25), mainly young adults associated with the University Outpatient Clinic Potsdam, were compared in a cross-sectional design (Tab. 4). Table 4: Anthropometric data S2 Participants
Age [yrs]
Weight [kg]
Height [m]
(n = 25)
28 ± 4
78 ± 8
1.82 ± 0.06
females (n = 25)
25 ± 3
60 ± 7
1.67 ± 0.06
overall (N = 50)
27 ± 4
69 ± 12
1.74 ± 0.10
males
Average age, weight and height for healthy male and female participants (mean ± SD).
Protocol (S2) In contrast to the static single-case comparison of the RQ1a pilot measurements, the protocol was here adjusted to a more complex testing condition. Following the recommendations of earlier studies (e.g. Roy & Oddsson, 1998), the SAR protocol was extended from isometric to isokinetic contraction mode. Although isometric MVC may be favourable concerning a higher EMG stability, the reference MVC has been recommended to be processed in exactly the same way as the task MVC. Ultimately, the results of S1b showed that overall no contraction mode is clearly superior in generating maximal EMG activation of trunk muscles. Therefore, maximal (MVC) and submaximal (SMVC) strength test trials were performed isokinetically from S2 measurements on. The experimental SAR procedure of S2 measurements consisted of a concentric isokinetic test session at 45°/s angular velocity and lasted approximately 30 min overall. In several test sessions prior to actual measurements, 45°/s turned out to be the best trade-off providing sufficient peak torque and movement velocity (Humer et al., 2011), being comfortable and safe (Maul et al., 2005) and consisting of an explicit isokinetic phase (1.2 s), at the same time, compared e.g. to the more common velocity of 60°/s (0.6 s) (Baur et al., 2010; S. Müller et al., 2012). Following the surface EMG 51
preparation procedure and the warm-up trial, five isokinetic MVCs in flexion and extension were conducted (MVC1). After a three minute break, two isokinetic SMVC familiarization trials at 40% and 60% were executed, introducing the visual biofeedback to the participants. Then, at each SMVC load of 20% to 80% of MVC1 peak torque, two sets consisting of five repetitions (isokinetic flexion-extension) were processed. Finally, a second MVC trial (MVC2) was to be passed to allow reliability analysis of peak torque later on. To minimize the effect of fatigue, the resting intervals between the MVC1 trial and the SMVC trials were kept to 1 min and to 3 min before the MVC2 set, respectively. The protocol for S2 measurements is summarized in Fig. 17 below.
Isokinetic SAR protocol - sex comparison (S2)
ME: medical examination WU: warm-up MVC1/2: max. voluntary contraction trials SMVC: subMVC trials Figure 17: Flowchart of isokinetic SAR protocol (S 2)
Figure 17: Schematic flowchart of isokinetic strength-activation relationship (SAR) protocol (S2)
Measurement methods (S2) Dynamometry: Similar to S1b, isokinetic peak torque of MVC1/2 was derived from each inertia-filtered repetition (see Fig. 16). Accordingly, the average of the 3 highest values of 5 (Baur et al., 2010; Kannus, 1994; F. Mayer et al., 2001; S. Müller et al., 2007) was taken as reference for SMVC target torque values. To choose the three best fitting repetitions for each SMVC level (20 - 80% MVC1), a computational solution utilizing the frame-by-frame Excel export function of the EMG software was generated. First, the rectified and time normalized dynamometer signal recorded by the EMG software was averaged and plotted in Excel (mean ± 10%) to reproduce the ‘training’ mode reference graph used as biofeedback. Then, the EMG software torque recording of all SMVC repetitions (rectified, timenormalized) was plotted in the same figure. By comparing the progression of the actual torque produced with the reference graph, the three best fitting repetitions for each SMVC load were identified and used for EMG activation analysis afterwards. 52
EMG: Muscular activation of the main trunk extensor and flexor was recorded during the isokinetic strength testing (6-lead EMG setup: ESL/EST, RA). Owing to the elongated progression of M. erector spinae as main lower trunk extensor, both lumbar and thoracic levels were measured. The EMG analysis was based on triggers that were set to the isokinetic phase of the dynamometer’s velocity signal (similar to S1b), from which the RMS [V] was calculated and normalized to MVC1 activation later on.
Statistics (S2) For the validation of the SAR protocol in the isokinetic setting, healthy males and females were compared in a cross-sectional design, testing for differences in SAR by an independent samples t-test (α < .05). To analyse the effect of sex on the entirety of SAR data (sex * SAR) a repeated measures 2 (sex: M, F) x 5 (SAR: Rest, SMVC20-80) ANOVA (α = .05) was used reporting F and p values. RQ2:
Is the strength-activation relationship protocol valid to determine sex differences in neuromuscular efficiency of lower back muscles during dynamic trunk extensions? H0_S2: The neuromuscular efficiency of trunk extensors, assessed by the strengthactivation relationship (SAR) protocol in a dynamic setting, does not differ between healthy males and females. H1_S2: The neuromuscular efficiency of trunk extensors, assessed by the strengthactivation relationship (SAR) protocol in a dynamic setting, is lower in healthy females compared to healthy males.
53
2.4 STUDY 3 (S3) - TRANSFER OF THE METHOD TO LBP PATIENTS Participants (S3) For intra-individual comparison of the SAR during an acute LBP episode compared to a nonsymptomatic phase, 8 patients complaining of acute LBP volunteered for this study. They were recruited from University of Potsdam surroundings, such as the ‘back school’ of the Centre for University Sports courses, the University fitness clubs and the consultation hours of the University Outpatient Clinic. Because of the fundamental nature of S3 and the heterogeneous cohorts of patients with LBP, participants were included in the measurements if they were “sharing only one phenotype – the presence of lumbar back pain” (Fairbank et al., 2011, p. 19), which means that they suffered LBP at the day of study enrollment (‘acute’ pain). Thereby, LBP was defined as pain and discomfort below the costal margin and above the inferior gluteal folds (Hoy et al., 2014). While doing so, neither cause nor chronicity of the pain was decisive for study inclusion, however, both were recorded during medical examination using the Graded Chronic Pain Scale (GCPS) alias ‘Korff’ questionnaire (Klasen et al., 2004; Von Korff, 1992) (see further below on page 56). In addition, patients expressed their overall LBP on a 100 mm Visual Analogue Pain Scale (VAS) (Huskisson, 1974; J Scott & Huskisson, 1976), before, during and after the test protocol (see further below on page 57). The patients included in this study showed no neurologic deficits at the time of measurements and were fully resilient with regard to the testing protocol. For detailed anthropometric data as well as for Korff and VAS data please refer to Tab. 5. Table 5: Anthropometric data S3 Participants
Age [yrs]
Weight [kg]
Height [m]
GCPSM1 [/10]
GCPSM2 [/10]
VASM1 [/100]
VASM2 [/100]
Interval [d]
all
(N = 8)
40 ± 14
69 ± 19
1.72 ± 0.17
3.4 ± 1.1
0.4 ± 0.8
36 ± 17
7±6
38 ± 30
males
(n = 3)
38 ± 16
89 ± 8
1.90 ± 0.11
3.0 ± 1.0
0.0 ± 0.0
28 ± 15
0±1
28 ± 31
females (n = 5)
44 ± 12
57 ± 12
1.62 ± 0.06
3.8 ± 1.3
0.8 ± 1.0
40 ± 18
8±6
45 ± 31
Average age, weight, height and results for GCPS (Graded Chronic Pain Scale) item 1 (present pain) and VAS (Visual Analogue Pain Scale) during acute LBP test day (M1) and during symptom-free test day (M2), and time difference between M1 and M2 (d), for male (M, n = 3), female (F, n = 5) and over all (all, N = 8) LBP patients (mean ± SD).
Following the definition of LBP symptoms suggested by Von Korff (1994), participants of S3 measurements were classified as follows: Four participants of S3 measurements reported recurrent LBP pain, which in three of them was caused by lumbar disc herniation and in one 54
case by repeated blockades of sacroiliac joint. Average duration of the episode at time of study inclusion was 9 days (ranging from 1 - 14 days). Three of the other participants suffered from chronic LBP, reporting an average history of 8 years (ranging from 1 - 15 years). In two of them, spinal degeneration was diagnosed; in the third chronic LBP patient the underlying reason was unknown (chronic unspecific LBP). The one remaining participant reported no history of LBP and was diagnosed with a strain of M. erector spinae being the cause for his condition.
Protocol (S3) The measurements intended to answer the questions proposed in S3 contained a test-retest design with LBP patients tested in a painful episode and a symptom-free one, respectively. Furthermore, muscular activation of the trunk was assessed by a 12-lead trunk EMG setup to allow analysis of the intermuscular coordination pattern. The LBP level and the history of pain were assessed by the Grades Chronic Pain Scale (GCPS) questionnaire (Von Korff, 1992) and a Visual Analogue Scale (VAS) (Ogon et al., 1996). For details see further below on page 56 to 58. Whereas the Korff questionnaire had to be answered before clinical examination, the VAS was part of the protocol before and after MVC1/2 and SMVC trials. Furthermore, after both MVC1/2 and SMVC test blocks, subjective exertion of participants was assessed using a 6 to 20 rate of perceived exertion (RPE) Borg scale (Borg, 1970, 1982). Overall, the measurement protocol of study S3 was quite similar to S2. All trials had to be performed in isokinetic mode with 45°/s angular velocity. After warm-up and 5 repetitions for MVC1, two sets of five repetitions each per SMVC20-80, initiated by two SMVC familiarization trials (40%, 60% MVC1), had to be carried out, completed by the final MVC2 trial (Fig. 18).
Isokinetic SAR protocol - pain status comparison in LBP (S3)
ME: medical examination WU: warm-up MVC1/2: max. voluntary contraction trials SMVC: subMVC trials Korff: pain questionnaire VAS: visual analogue scale BORG: rate of perceived exertion Figure 18: Flowchart of isokinetic SAR protocol (S 3)
Figure 18: Schematic flowchart of isokinetic SAR protocol (S3) and pain measurements
55
Measurement methods (S3) Dynamometry: Peak torque [Nm] of MVC1/2 was extracted from each repetition after the peak torque overshoot artefacts had been filtered (similar to S1 and S2, Fig. 16, page 49). The selection of the three best fitting SMVC repetitions per load step was performed using the real-time display output (Con-Trex software) of each SMVC repetition, showing both reference torque corridor and actual torque production (comp. Fig. 10, page 39) and was captured and stored with the aid of a screenshot tool (Greenshot, V.1.0.7.2). In doing so, the straightforward identification of the three most accurate repetitions of target torque and output (Fig. 10 C, page 39) was enabled during later visual analysis. EMG: In the final comparison of LBP patients by the SAR, the EMG setup consisted again of all 12 trunk leads, allowing a more comprehensive analysis of intra- and intermuscular coordination pattern and its contribution to assumed differences in neuromuscular efficiency. The analysis of recorded EMG signals was performed in the same way as in S2.
Pain assessment (S3) Graded Chronic Pain Scale (‘Korff questionnaire’) In measurements of SAR in LBP patients, severity of LBP was firstly classified using a German version of the Graded Chronic Pain Scale (GCPS or colloquially ‘Korff’) questionnaire (Von Korff, 1992). Based on the approach of graded pain classification to summarize the global severity of chronic pain (Von Korff et al., 1990), the GCPS validly and reliably measures pain intensity, disability, persistence and recency of onset in a simple and brief questionnaire (Klasen et al., 2004; B. H. Smith et al., 1997; Von Korff, 1992). In doing so, a hierarchical pain severity model has been suggested, where ‘pain intensity’ represents the lower range of pain severity and ‘pain related disability’ scales in its upper range (Klasen et al., 2004). The German GCPS score consists of seven items: three items regarding back pain-related interference in regard to recreational, social and work activities over the previous three months; three items measuring pain intensity (present back pain, average back pain, worst back pain in the previous three months); and one item assessing the number of disability days in the past three months (Fig. 19). By means of the pain intensity score and the number 56
of disability points, participants are then classified into one of five mutually exclusive and collectively exhaustive hierarchical pain grades (Schmidt et al., 2007). However, since the presence of pain was a criteria for inclusion of participants in measurements of S3, the first GCPS item particularly, asking for pain severity at the present time, was the determining item.
Graded chronic pain scale (‘Korff’) questionnaire (German 7-item version)
Figure 19: Graded Chronic Pain Scale (alias Korff, German version)
Figure 19: German version of the Graded Chronic Pain Scale used in the measurements investigating SAR in LBP patients.
Visual Analogue Scale During S3 measurements, participants were asked to rate their pain intensity in general and low back related on two separate 100 mm Visual Analog Scales (VAS). For this, they were requested to place a vertical mark on the horizontal line that ranges at the extreme ends from the statements ‘no pain’ on the left side to ‘the most intense pain imaginable’ on the right, indicating the severity of their pain (Fig. 20). The distance from the left end to the mark on the line was then measured and reported in mm (Esola et al., 1996). 57
Visual analogue scale (VAS)
Figure 20: Visual Analogue Scale for pain (VAS, German version)
Figure 20: Visual Analogue Scale for pain (VAS, German version): two 100 mm scales for general and back related pain.
Since first approaches of graphical rating methods that have been adapted from psychology for pain (Huskisson, 1974), VAS pain ratings in general have demonstrated good reliability and validity in both chronic (Downie et al., 1978; McCormack et al., 1988; Jane Scott & Huskisson, 1979) and acute pain measurements (Kelly, 1998; Revill et al., 1976; Todd et al., 1996). ICC values of 0.95 and above for VAS scores taken 1 minute apart (Bijur et al., 2001), with 95% of differences being within ± 18 mm when acute pain was assessed twice within 3 min (DeLoach et al., 1998), indicate the high reliability compared to other instruments (Triano et al., 1993). In the context of LBP, the VAS has often been used for e.g. classification and allocation of study participants in cross-sectional studies (Geisser et al., 2005; Marshall & Murphy, 2010) or the assessment of changes in pain intensity after exercise rehabilitation (Niemistö et al., 2003; Pieber et al., 2014). For measurements within the scope of RQ3, participants were included in the analysis only if their self-rated pain score (VAS) at the acute LBP testing day (M1) was VAS > 10 mm (Nelson-Wong & Callaghan, 2010). For retest after remission of pain (M2), participants were measured only with no or minimum pain (VAS ≤ 10 mm) at begin of the testing protocol (J. Müller et al., 2014).
Statistics (S3) For the evaluation of the effect of acute low back pain onto the SAR of lower back muscles, LBP patients were compared longitudinally performing the SAR in an acute pain episode (AP) and after remission of pain (NP). The comparison of absolute torque output of MVC1 trials between AP and NP was performed using a paired t-Test. Because of the small number 58
of participants within groups (no test for normal distribution possible), comparison within and between sexes was made by Wilcoxon signed rank and Mann-Whitney U-test, respectively. Absolute EMG values of individual muscles were compared pair-wise between pain and pain-free status (AP, NP) using a paired t-test, too. To test whether pain status affects normalized EMG activation over SAR load steps (pain * SAR), a two-way repeated measures 2 (pain: AP, NP) x 5 (SAR: Rest, SMVC20-80) ANOVA with two within-participants factors was used (F and p values presented). If the sphericity assumption, referring to equality of group pairs’ variances, was violated (Mauchly’s test: p < .05), the degrees of freedom were Greenhouse-Geisser corrected to decrease the Type 1 error (Mauchly, 1940). RQ3:
Are there differences in the strength-activation relationship of lower back muscles during dynamic trunk extensions in individuals during an acute low back pain episode and after remission of pain? H0_S3: The neuromuscular efficiency of lower back muscles, assessed by the strength-activation relationship of trunk extensors, does not differ between acute pain and pain-free status in low back pain patients. H1_S3: The neuromuscular efficiency of lower back muscles, assessed by the strength-activation relationship of trunk extensors, is lower during acute pain compared to pain-free status in low back pain patients.
Within-sex comparison of normalized EMG was done using a Mann-Whitney U test. In addition, to look for sex differences, the ANOVA was extended by the between-participants factor sex (pain * SAR * sex) (Crosbie et al., 2013). For analysis of pain status during SAR comparison in LBP patients (S3) between acute pain (AP) and no pain status (NP), self-rated pain grading data by both GCPS (item 1: “present LBP”) and VASmean1-4 (four time points during SAR protocol) were compared using a Wilcoxon signed rank-test (p < .05). A Spearman correlation was used to analyse agreement in pain grading between GCPS and VAS1 as well as between GCPS and VASmean1-4 (p < .05) for both AP and NP test day (p < .05). Associations are given by correlation coefficient r and significance level, and simple linear regression (r ≤ .39: weak, .40 ≤ r ≤ .59 moderate, .60 ≤ r ≤ .79 strong, r ≤ 80 very strong correlation (Evans, 1995)). 59
CHAPTER 3 – RESULTS 3.1 RESULTS S1 - DEVELOPMENT OF THE METHOD - PILOT STUDIES 3.1.1 S1a - SAR single-case comparison Absolute values, MVC reliability: Peak torque differed -3.4% in the healthy participant (H, 442 to 427 Nm) and -1.1% (207 to 205 Nm) in the patient (P, MVC1 to MVC2). EMG extensor activation differed -0.3% (LD) to 36.2% (ESL) in H, and 1.5% (ESL) to 21.1% (EST) in P. Flexor co-activation differed -1.2% (OI) to -35.6% (OE) in H, and -0.6% (OI) to 24.3% (RA) in P. SAR results: Normalized EMG activation [%MVC1] during the isometric SAR protocol was higher during rest and SMVC20 and lower during SMVC40-80 for P in relation to H (ALLext, resulting in 122 ± 269% (difference P/H, mean ± SD) (Tab. 6, Fig. 21). Table 6: Normalized EMG activation during SAR protocol pilot study (S1) Healthy participant (H)
LBP patient (P)
Diff. P/H
Muscles
ESL
EST
LD
ALLext
ESL
EST
LD
ALLext
ALLext [%]
Rest
1.3
4.6
1.3
2.4
8.7
11.7
30.3
16.9
+593
SMVC20
13.0
14.1
2.1
9.8
15.3
15.5
26.5
19.1
+96
SMVC40
24.9
40.6
3.4
23.0
15.3
18.0
23.0
18.8
-18
SMVC60
46.9
77.1
14.0
46.0
33.9
37.8
28.5
33.4
-27
SMVC80
82.6
134.3
47.5
88.1
55.2
65.5
53.6
58.1
-34
Normalized EMG activation [%MVC1] of individual extensors (ESL/EST: M. erector spinae lumbar/thoracic, LD: M. latissimus dorsi) and extensor equivalent (Allext) during rest and isometric SMVC20-80 of the LBP patient in relation to the healthy control participant [%] for ALLext.
SAR of ALLext between LBP patient and healthy individual (S1)
Figure 21: Strength-activation relationship (SAR) pilot single case comparison (S 1a)
Figure 21: Strength-activation relationship (SAR) during isometric contractions for extensor muscle equivalent (ALL ext) compared between a healthy and a LBP participant.
60
Antagonistic co-activation: Since flexion measures were not part of the isometric SAR protocol, antagonistic activation of abdominal muscles during rest and SMVC20-80 extensions was normalized to their antagonistic activation during MVC1 extension. As a result, P showed overall much higher co-activation than H (146 ± 62%), with 12.3% to 61.9% compared to 6.7% to 41.2% (antagonistic MVC1 activation, rest to SMVC80). The initial increase from resting activation over SMVC20 to SMVC40 is quite subtle, then rising sharply from SMVC60 to SMVC80 (Fig. 22). Analysis of individual abdominal muscles showed a rather low co-activation of M. rectus abdominis (RA) as main flexor during low to moderate loads, however, it increased considerably during SMVC80 (no figure).
Antagonistic co-activation during SAR protocol pilot study (S1)
Figure 22: Antagonistic co-activation pilot single case comparison (S 1a)
Figure 22: Co-activation [antagonistic extension %MVC1] of extensor equivalent (ALLflx: Mm. rectus abdominis, obliquus externus/internus) during rest and SMVC20-80 comparing a healthy (H) with a LBP individual (P).
Synergistic co-activation: Analysis of individual back muscle contribution to overall EMG activation (%MVC1) during the isometric SAR protocol revealed a mean activation of 39% (ESL), 45% (EST) and 16% (LD) for H, and 36% (ESL), 42% (EST) and 22% (LD) for P. However, these similar mean values do not reflect the diverse contribution development between the two participants. ESL activation of H decreases (from 45 to 34%) while LD values increase (from 15 to 37%) with rising loads (from rest to MVC1). For P, in contrast, the contribution of ESL increases (from 25 to 41%) while LD decreases (from 38 to 17%). EST activation showed to be 3 to 12% higher (except during MVC1) in H compared to P. Overall, synergistic activation in H and P has been found to be highly variable, with clearly opposite utilization of individual back muscles in extreme cases. 61
3.1.2 S1b - Reference MVC contraction mode comparison Torque: Peak torque of different contraction modes during MVC is given in Tab. 7 below. Table 7: MVC peak torque of trunk extension during different contraction modes (S1b) ISM
CON30
CON60
CON120
ECC30
EXT
216 ± 86
218 ± 67
224 ± 78
200 ± 71
281 ± 87
FLX
138 ±70
144 ± 52
135 ± 49
136 ± 52
143 ± 54
Peak torque (Nm) of N = 17 healthy participants in trunk extension (EXT) and flexion (FLX) during isometric (ISM), isokinetic concentric at 30, 60 and 120°/S (CON30, 60, 120) and isokinetic eccentric at 30°/s (ECC30) contractions (mean ± SD).
EMG: Maximum muscle activation was 0.80 ± 0.35 V (ESL, CON120), 0.49 ± 0.27 V (EST, ISM) and 0.38 ± 0.28 V (LD, CON60) during EXT, and 0.69 ± 0.35 V (RA, CON30), 0.87 ± 0.49 V (OE, ISM) and 0.87 ± 0.49 V (OI, ) during FLX (Fig. 23). For trunk extensor muscles, the effect of contraction mode was found to be statistically significant only for EST (p < .05) with non-significant values for ESL (p = .460) and LD (p = .238). For flexors, a statistically significant effect of contraction mode was present only for OI (p < .01), but not for RA (p = .190) and OE (p = 1.197). Post-hoc pair-wise comparison for EST and OI did not identify a difference between individual contraction modes.
MVC contraction mode comparison (S1b) Extension
Flexion
Figure 23: Maximum EMG activity contraction mode comparison (S 1b)
Figure 23: Peak EMG activity of N = 17 healthy participants during isometric (ISM), isokinetic concentric (30, 60,
120°/S,CON30, 60, 120) and eccentric (30°/s, ECC30) contractions; for extensors (Mm. erector spinae lumbar (ESL) and thoracic (EST), latissimus dorsi (LD)) and flexors (Mm. rectus abdominis (RA), obliquus externus (OE) and internus (OI)); presented as mean ± SD.
62
3.2 RESULTS S2 - VALIDATION OF THE METHOD - SEX COMPARISON Absolute values of MVC1: Isokinetic peak torque ranged from 227 to 493 Nm in males (M) and from 111 to 304 Nm in females (F). Maximum EMG activation of ES (mean ESL/EST) ranged from 0.25 to 0.71 V (M) and from 0.12 to 0.58 V (F). For mean values see Tab. 8, 9. Reliability of MVC values: Within-protocol reliability of peak torque was similarly excellent in both males (M) and females (F) revealing mean indices of CV 3.8%, TRV 6.0% and ICC 0.97 over all participants during trunk extension. Sex specific data is given in Tab. 8. Table 8: Reliability data of torque output (MVC1-MVC2) during sex comparison (S2) M F
MVC1
MVC2
CV
TRV
[Nm]
[Nm]
[%]
± SD [%]
317 ± 63
328 ± 62
3.6
5.2 ± 5.2
214 ± 55
223 ± 53
4.2
6.9 ± 7.6
CI
CI
Bias
LoA
LoA
lower
upper
[Nm]
lower
upper
0.94
0.83
0.97
11
-28
50
0.95
0.88
0.98
9
-22
40
ICC
Trunk extension peak torque [Nm, mean ± SD] for males (M, n = 25) and females (F, n = 25). CV: coefficient of variation; TRV: test-retest variability; ICC: intraclass correlation coefficient with CIlower/higher: 95% confidence intervals; bias with LoAlower/upper: mean difference (MVC2 - MVC1) ± 1.96 * SD (LoA, limits of agreement).
Within-protocol reliability of EMG activation for trunk extensors ranged CV 5.9 - 9.2%, TRV 8.5 - 14.3%, and ICC 0.93 - 0.90 over all participants. Distinguished between sexes, a general trend for poorer reliability in F compared to M has been recognized (Tab. 9, Fig. 24). Table 9: Reliability data of EMG activation (MVC1-MVC2) during sex comparison (S2) MVC1
MVC2
CV
TRV
[V]
[V]
[%]
± SD [%]
M
0.41 ± 0.11
0.41 ± 0.12
4.7
6.8 ± 4.9
F
0.36 ± 0.11
0.34 ± 0.09
8.7
12.8 ± 9.7
CI
CI
Bias
LoA
LoA
lower
upper
[V]
lower
upper
0.95
0.89
0.98
-0.01
-0.07
0.07
0.85
0.68
0.93
-0.02
-0.12
0.08
ICC
EMG activation [V, mean ± SD] of M. erector spinae (ES: here mean of EST and ESL) for males (M, n = 25) and females (F, n = 25). CV: coefficient of variation; TRV: test-retest variability; ICC: intraclass correlation coefficient with CIlower/higher: 95% confidence intervals; bias with LoAlower/upper: mean difference (MVC2 - MVC1) ± 1.96 * SD (LoA, limits of agreement).
Reliability of EMG (ES) during sex comparison (S2) Figure 24: MVC reliability - Bland-Altman plot EMG sex comparison (S2)
Figure 24: Bland-Altman plot comparing EMG activity [V] of overall M. erector spinae (ES) during trunk extension between MVC1 and MVC2 compared between sexes (male, n = 25; female, n = 25), bias: mean difference MVC1,2; LoA: 95% limits of agreement = bias ± 1.96 * SD.
63
SAR results of M. erector spinae compared between sexes: Normalized EMG activation [%MVC1] of M. erector spinae (ES) during SAR protocol was on average 13%, 12%, 16%, 15% and 7% higher, respectively, in F compared to M (rest, MVC2080).
Compared by unpaired t-test, SAR of ES was statistically different at SMVC40 (p < .05) and
SMVC60 (p < .01). However, the repeated measures ANOVA did not reveal a statistically significant sex * SAR interaction effect for ES (F(1,4) = 2.381, p = .088) (Tab. 10, Fig. 25). Table 10: Normalized EMG activation during SAR protocol compared between sexes (S2) Muscles / Load
ES
rest SMVC20 SMVC40 SMVC60 SMVC80
M
F
All
n = 25, [%] 2 ± 1 22 ± 5 34 ± 6 49 ± 8 74 ± 11
n = 25, [%] 2 ± 1 25 ± 9 40 ± 10 57 ± 10 80 ± 12
N = 50, [%] 2 ± 1 24 ± 7 37 ± 9 53 ± 10 77 ± 12
Difference F/M [%] 114 112 116 115 107
t-Test
ANOVA
(p) .380 .172 .025 * .006 * .090
(F, p) 2.381 .088
Normalized EMG activation [%MVC1] of M. erector spinae (ES, mean lumbar/thoracic) during rest and SMVC20-80 compared between sexes (F in relation to M [%]) by unpaired t-Test (* p < .05) and repeated measures ANOVA (α = 0.05).
SAR of ES compared between genders (S2)
ANOVA: p = .088
Figure 25: Strength-activation relationship (SAR) sex comparison ES (S 2)
Figure 25: SAR of M. erector spinae overall (ES) in resting position and isokinetic trunk extensions (SMVC 20-80) compared between sexes (M: n = 25, F: n = 25) by unpaired t-Test and repeated measures ANOVA (*p < 0.05).
Considered separately, normalized EMG activation of ES generally tended to be higher at lumbar level (ESL) than at thoracic level (EST), being markedly more pronounced in M (ESL: 1.4% to 78.0%; EST: 3.0% to 69.9%) than in F (ESL: 1.8% to 82.4%; EST: 3.3% to 78.1%) (rest to SMVC80). Similar to ES analysis, comparison by t-test reached statistically significance at SMVC40 (p < .05) and SMVC60 (p < .01) of EST. Again, the results of sex * SAR effect analysis by ANOVA were not statistically significant (ESL: p = .300, EST: p = .203) (Tab. 11 and Fig. 26). 64
Table 11: Normalized EMG activation during SAR protocol compared between sexes (S2) Muscles / Load
ESL
EST
Rest SMVC20 SMVC40 SMVC60 SMVC80 Rest SMVC20 SMVC40 SMVC60 SMVC80
M
F
All
t-Test
ANOVA
n = 25, [%] 1 ± 1 27 ± 6 41 ± 7 57 ± 8 78 ± 11 3 ± 2 17 ± 6 26 ± 8 40 ± 12 70 ± 16
n = 25, [%] 2 ± 1 29 ± 8 46 ± 11 62 ± 9 82 ± 10 3 ± 2 20 ± 11 32 ± 11 50 ± 14 78 ± 26
N = 50, [%] 2 ± 1 28 ± 7 43 ± 9 60 ± 9 80 ± 11 3 ± 2 19 ± 9 29 ± 10 45 ± 14 74 ± 22
(p) .182 .402 .091 .056 .189 .623 .178 .046 * .012 * .193
(F, p) 1.229 .300
1.642 .203
Normalized EMG activation [%MVC1] of individual back muscles (ESL/EST: M. erector spinae lumbar/thoracic) during rest and SMVC20-80 compared betw. sexes (M: n = 25, F: n = 25) by unpaired t-test (* p < .05) and rep. meas. ANOVA (α = 0.05).
SAR of individual extensor muscles compared between sexes (S2) M. erector spinae lumbar (ESL)
ANOVA: p = .300
A M. erector spinae thoracic (EST)
ANOVA: p = .203
B Figure 26: SAR of individual muscles during sex comparison (S2)
Figure 26: SAR during isokinetic contractions of M. erector spinae (A) lumbar (ESL) / (B) thoracic (EST) during rest and SMVC20-80 compared between sexes (M: n = 25, F: n = 25) by unpaired t-test and repeated mesures ANOVA (*p < 0.05).
65
Antagonistic co-activation: Normalized to agonistic EMG activation during MVC1 trunk flexion, co-activation of rectus abdominis muscle (RA) during trunk extension ranged from 2.7 to 6.5% in M and 3.6 to 7.7% in F (mean values of rest, SMVC20-80 and MVC1). Thus, with differences ranging from +18% (MVC1) to +43% (SMVC20) in relation to M, co-activation was always higher in F. However, when verified by Mann Whitney U-test, a statistically significant difference between sexes was found only for SMVC60 (p < .05) (Tab. 12, Fig. 27). Table 12: Abdominal co-activation during trunk extension compared between sexes (S2) rest
SMVC20
SMVC40
SMVC60
SMVC80
MVC1
males (M)
2.7 ± 1.6
2.9 ± 1.9
2.8 ± 1.8
3.2 ± 2.0
4.2 ± 2.5
6.5 ± 4.5
females (F)
3.6 ± 2.8
4.1 ± 3.6
3.7 ± 2.1
4.4 ± 2.4
5.6 ± 2.9
7.7 ± 4.0
MW U-test
.299
.114
.090
.041 *
.067
.165
Co-activation (reference: agonistic activation during MVC1 trunk flexion) of M. rectus abdominis during rest and SMVC20-80) compared between sexes (M: n = 25, F: n = 25) using Mann Whitney U-test (MW U-test, * p < .05) (means ± SD).
Antagonistic co-activation of RA, sex comparison (S2)
Figure 27: Antagonistic co-activation sex comparison (S2)
Figure 27: EMG co-activation [agonistic flexion %MVC1] of M. rectus abdominis during rest and SMVC20-80 compared between sexes (M: n = 25, F: n = 25) by Mann Whitney U-test (MW U-test, * p < .05) (means ± SD).
Synergistic co-activation: Mean contribution values resulted in 61 ± 9% (ESL) and 39 ± 9% (EST) in M, and in 59 ± 12% (ESL) and 41 ± 12% (EST) in F (mean ± SD). While proportional activation of ESL was clearly lower during rest in F compared to M (37% in F; 46% in M), its contribution to overall ES muscle activation was quite comparable during isokinetic SMVC trunk extensions (max. 2% difference). Accordingly, statistical comparison found no difference in EMG activity distribution of ESL and EST to overall ES muscle activation between sexes. Rather interesting in general, EST contribution continiously increased with rising loads (from 30% during SMVC20 to 43% (mean values) during MVC1 in both sexes). 66
3.3 RESULTS S3 - TRANSFER OF THE METHOD TO LBP PATIENTS Differences of pain intensity in LBP patients: Self-rated LBP grading data was statistically significantly different between acute pain (AP, M1) and no pain (NP, M2) test days (p < .05). Mean values for GCPS (item 1: “present LBP”) were 3.4 ± 1.1 (AP) and 0.4 ± 0.8 (NP). VAS ratings (“LBP at this moment”) averaged (VAS1-4) to 36 ± 17 mm (AP) and 7 ± 6 mm (NP) (Fig. 28, Tab. 13).
Self-rated LBP status (S3)
Figure 28: Pain intensity rating (GCPS and VAS1-4) comparison AP vs. NP (S3)
Figure 28: Self-graded LBP rating by Graded Chronic Pain Scale (GCPS alias “Korff” [/10], only item 1) and Visual Analog Scale (VAS [/100 mm]) of the whole measurement day (VAS1-4) compared between LBP statuses (AP: acute pain, NP: no pain) in N = 8 participants (mean ± SD) by Wilcoxon signed rank-test (p * < .05).
Table 13: Self-graded LBP intensity data GCPS and VAS (S3) GCPS
VAS1
VAS2
VAS3
VAS4
VASmean1-4
[/10]
[/100]
[/100]
[/100]
[/100]
[/100]
Acute Pain (AP)
3.6 ± 1.2
30 ± 17
26 ± 17
40 ± 16
37 ± 16
33 ± 15
No pain (NP)
0.5 ± 0.8
3±4
4±6
6±6
LBP status
10 ± 9
6±5
Results for GCPS (Graded Chronic Pain Scale) item 1 (“present LBP”) and VAS (Visual Analogue Pain Scale) during acute LBP test day (AP) and symptom-free test day (NP) for all N = 8 participants (mean ± SD).
Correlations of pain measurement tools: During AP, GCPS - VAS1 correlated non-significantly (r = .556, p = .152) and GCPS - VASmean1-4 correlated statistically significant (r = .791, p < .05). For NP, a statistically significant correlation was found for GCPS - VAS1 (r = .923, p < .01), but not for GCPS -VASmean1-4 (r = .674, p = .067). The associations of GCPS and VAS1/mean1-4, including simple linear regression fitting lines, are plotted in the appendix. 67
Absolute torque and EMG values of MVC1 in LBP patients: Isokinetic peak torque was 200 ± 66 Nm (ranging 103 to 257 Nm) during AP and 211 ± 58 Nm (ranging 103 to 237 Nm) during NP. Thereby, M (n = 3) produced statistically significant higher torque than F (n = 5) in both AP (270 ± 27 Nm to 158 ± 36 Nm; p < .05) and NP status (272 ± 21 Nm to 175 ± 36 Nm; p < .01). Absolute EMG of ALLext (rest to MVC1, mean values) distinguished by pain status ranged from 0.02 to 0.31 V (AP) and from 0.02 to 0.32 V (NP). Compared between sexes, EMG values ranged from 0.02 to 0.28 V in M and from 0.02 to 0.32 V in F. Reliability of MVCs in LBP patients: Peak torque did not differ statistically significantly between AP and NP status (p = .068), however, within-day reliability indices overall were poorer for AP than for NP (Tab. 14, Fig 29.). During within-sex analysis of AP and NP peak torque, no statistically significant differences were found (M: p = .673, M: p = .077). Table 14: Reliability data of torque output (MVC1-MVC2) during pain status comparison (S3) MVC1
MVC2
CV
TRV
[Nm]
[Nm]
[%]
± SD [%]
AP
200 ± 66
209 ± 50
5.5
9.2 ± 9.6
NP
211 ± 58
212 ± 55
3.1 4.3
MVC1 AP vs. NP
CI
CI
Bias
LoA
LoA
lower
upper
[Nm]
lower
upper
0.94
0.75
0.99
9
-26
44
5.2 ± 5.6
0.97
0.87
0.99
0
-26
26
7.5 ± 9.6
0.96
0.74
0.99
12
-16
38
ICC
Trunk extension peak torque [Nm, mean ± SD] of acute (AP) and no LBP (NP) status within (MVC1-MVC2) and between test days (MVC1) in N = 8 LBP patients. CV: coefficient of variation; TRV: test-retest variability; ICC: intraclass correlation coefficient, CIlower / higher: 95% confidence intervals; bias, LoAlower / upper: mean difference (MVC2 - MVC1) ± 1.96 * SDdifference (LoA, limits of agreement).
Reliability of MVC peak torque in LBP patients (S3)
Figure 29: MVC reliability - Bland-Altman plot EMG pain status comparison (S 3)
Figure 29: Bland-Altman plot comparing trunk extension peak torque [Nm] of MVC1 and MVC2 (before and after SMVC trials) between LBP statuses (AP: acute LBP, NP: no LBP); bias: mean difference MVC 1,2; LoA: 95% limits of agreement = bias ± 1.96 * SD.
68
EMG activation of extensor muscles during measurements without pain (NP) showed generally higher reliability indices compared to acute pain (AP) status. Details are given in Tab. 15 and Bland-Altman Fig. 30 below. Table 15: Reliability data of EMG activation (MVC1-MVC2) during pain status comparison (S3) MVC1
MVC2
CV
TRV
[V]
[V]
[%]
± SD [%]
ICC
CI
CI
Bias
LoA
LoA
lower
upper
[V]
lower
upper
Extensor Equivalent (ALLext)
AP NP
0.31 ± 0.18
0.32 ± 0.19
8.1
12.6 ± 7.2
0.97
0.88
0.99
0.01
-0.07
0.09
0.32 ± 0.17
0.31 ± 0.15
4.9
6.8 ± 4.0
0.99
0.93
1.00
-0.01
-0.06
0.04
8.3
16.8 ± 15.9
0.97
0.87
0.99
0.01
-0.07
0.09
MVC1 AP vs. NP M. erector spinae lumbar (ESL)
AP NP
0.44 ± 0.26
0.39 ± 0.23
10.0
12.6 ± 13.7
0.92
0.69
0.98
-0.04
-0.21
0.12
0.44 ± 0.21
0.42 ± 0.18
6.3
8.8 ± 4.0
0.97
0.89
1.00
-0.02
-0.10
0.06
10.6
19.8 ± 16.5
0.95
0.75
0.99
0.00
-0.15
0.15
MVC1 AP vs. NP M. erector spinae lumbar (EST)
AP NP
0.33 ± 0.23
0.38 ± 0.29
12.4
0.35 ± 0.25
0.33 ± 0.24
6.0
MVC1 AP vs. NP
17.9 ± 10.2
0.95
0.74
0.99
0.05
-0.09
0.19
12.0 ± 9.0
0.99
0.96
1.00
-0.02
-0.07
0.04
20.4
16.8 ± 15.9
0.97
0.88
0.99
0.11
-0.04
0.26
M. latissimus dorsi (LD)
AP NP
0.16 ± 0.09
0.18 ± 0.12
16.4
18.9 ± 11.6
0.88
0.51
0.97
0.03
-0.06
0.12
0.17 ± 0.12
0.16 ± 0.12
14.0
19.2 ± 15.2
0.93
0.70
0.99
0.00
-0.09
0.08
19.4
26.1 ± 14.0
0.84
0.40
0.97
0.01
-0.10
0.12
MVC1 AP vs. NP
Reliability of EMG activation [V, mean ± SD] of N = 8 participants for acute (NP) and no pain (NP) status within (MVC1-MVC2) and between test days (MVC1). CV: coefficient of variation; TRV: test-retest variability; ICC: intraclass correlation coefficient with CIlower / higher: 95% confidence intervals; bias with LoAlower / upper: mean difference (MVC2 - MVC1) ± 1.96 * SDdifference (LoA, limits of agreement).
Reliability of EMG (ALLext) during MVC1 in LBP patients (S3)
Figure 30: MVC reliability - Bland-Altman plot EMG pain status comparison (S 3)
Figure 30: Bland-Altman plots comparing EMG activity [V] of overall extensor equivalent (Allext: mean of M. erector spinae lumbar (ESL) and thoracic (EST), and M. latissimus dorsi (LD)) of trunk extension between LBP statuses (AP: acute LBP, NP: no LBP); bias: mean difference MVC1,2; LoA: 95% limits of agreement = bias ± 1.96 * SD.
69
SAR results of extensor equivalent in LBP patients: Normalized EMG values [%MVC1] of extensor equivalent (ALLext) ranged from 9 ± 5% to 91 ± 12% in AP (two participants exceeding 100%) and from 9 ± 4% to 78 ± 12% in NP (mean ± SD). With the exception of resting values, normalized EMG activation was always higher during AP (AP in relation to NP: 111 ± 8%, mean ± SD, SMVC20-80). This is also reflected by the ANOVA outcome, showing a statistically significant pain * load interaction effect of F(1,4) = 4.377, p < .01. The paired t-test identified a statistically significant difference in normalized EMG activation between pain status for SMVC80 (p < .01) (Tab. 16, Fig. 31). Table 16: Normalized EMG activation of ALLext during SAR protocol in LBP patients (S3) Muscles / Load Rest ALLext
SMVC20 SMVC40 SMVC60 SMVC80
Acute LBP
No Pain
Difference
t-Test
ANOVA
(AP)
(NP)
AP/NP [%]
(p)
(F, p)
9±5
9±4
99 ± 26
.928
25 ± 6
22 ± 6
116 ± 26
.233
38 ± 7
34 ± 8
14 ± 24
.241
53 ± 7
50 ± 7
109 ± 28
.503
91 ± 12
78 ± 12
118 ± 12
.003 *
4.377 .007 *
Normalized EMG activation [%MVC1] of all back muscles averaged (ALLext) during rest and SMVC20-80 compared between LBP status (AP: acute pain, NP: no pain) in N = 8 participants by difference (AP in relation to NP), and by paired t-test and repeated measures ANOVA (* p < .05).
SAR of ALLext in LBP patients (S3)
ANOVA: p = .007 *
Figure 31: Strength-activation relationship (SAR) pain status comparison ALLext (S3)
Figure 31: SAR of trunk extensor equivalent (ALLext) during resting position and isokinetic trunk extensions (SMVC20-80) compared between LBP status (AP: acute pain, NP: no pain) of N = 8 participants by paired t-Test and repeated measures ANOVA (* p < 0.05).
70
SAR of individual extensor muscles in LBP patients: When split for individual back muscle EMG activation, differences of M. erector spinae levels show quite similar behaviour, ranging from 1 ± 1% to 5 ± 10% (ESL) and from 1 ± 4% to 17 ± 10% (EST) with higher values during AP when compared to NP (rest to SMVC80, mean ± SD). In doing so, the smaller differences between pain statuses of ESL level resulted in non-significant ANOVA and t-test values. At EST level, the pain * load interaction effect (F (1,4) = 6.589, p < .001) and t-test at SMVC80 (p = .002) were statistically significant. In two participants, EST activation at SMVC80 was higher than 100% MVC1. Proceeding less linearly but more exponentially especially at the acute LBP (AP) test day, differences of normalized EMG of LD (ranging -2 ± 5% to 18 ± 25% for rest to SMVC80, mean ± SD), tested by ANOVA and paired t-test, were not statistically significant. It is noteworthy that for LD only SMVC80 values followed the trend of higher normalized EMG activation during AP (three participants >100% MVC1), with constantly lower values during rest and SMVC20-60 (Tab. 17, Fig. 32). Table 17: Normalized EMG activation of ESL, EST, LD during SAR protocol in LBP patients (S3) Acute LBP
No Pain
ANOVA
(NP)
Difference (AP - NP)
t-Test
(AP)
(p)
(F, p)
4±2
3±1
1±1
.191
SMVC20
35 ± 8
28 ± 6
6±8
.058
SMVC40
48 ± 7
45 ± 5
4±7
.203
SMVC60
65 ± 8
60 ± 6
5 ± 10
.182
SMVC80
87 ± 10
82 ± 10
5 ± 10
.246
Rest
11 ± 5
9±6
1±4
.356
SMVC20
23 ± 3
19 ± 8
4±7
.169
SMVC40
41 ± 15
31 ± 11
10 ± 13
.061
SMVC60
58 ± 16
46 ± 13
11 ± 14
.054
SMVC80
88 ± 18
71 ± 19
17 ± 10
.002 *
Rest
13 ± 10
15 ± 8
-2 ± 5
.330
SMVC20
18 ± 12
19 ± 11
-2 ± 9
.639
SMVC40
24 ± 12
27 ± 15
-3 ± 12
.539
SMVC60
36 ± 14
46 ± 13
-8 ± 26
.438
SMVC80
97 ± 29
80 ± 31
18 ± 25
.083
Muscles / Load Rest ESL
EST
LD
.893 .481
6.589 .001 *
3.598 .051
Normalized EMG activation [%MVC1] of individual back muscles (ESL/EST: Mm. erector spinae lumbar/thoracic, LD: latissimus dorsi) in resting position (Rest) and isokinetic trunk extensions (SMVC20-80) compared between LBP status (AP: acute pain, NP: no pain) in N = 8 participants by paired t-test and repeated measures ANOVA (* p < .05).
71
SAR of individual extensor muscles in LBP patients (S3) M. erector spinae lumbar (ESL)
ANOVA: p = .481
A M. erector spinae thoracic (EST)
ANOVA: p = .001 *
B M. latissimus dorsi (LD)
ANOVA: p = .051
C Figure 32: SAR of individual muscles LBP patients (S 3)
Figure 32: SAR during isokinetic contractions of individual back muscles ((A) ESL / (B) EST : M. erector spinae lumbar / thoracic, (C) LD : M. latissimus dorsi) during rest and SMVC20-80 compared between LBP status (AP: acute pain, NP: no pain) in N = 8 LBP participants by paired t-test and repeated measures ANOVA (* p < .05).
72
To sum up, when compared to NP status, normalized muscle activation during AP measurement day was on average 11 ± 8% (ALLext) higher, with individual differences of up to 5 ± 10% (ESL), 17 ± 10% (EST), and 18 ± 25% (LD), respectively (Fig. 33).
SAR of AP in relation to NP in LBP patients (S3)
Figure 33: Strength-activation relationship (SAR) difference AP in %NP (S 3)
Figure 33: Differences of normalized EMG activity [%MVC1] of back extensor equivalent (ALL) and individual back muscles ESL / EST: Mm. erector spinae lumbar / thoracic, LD: M. latissimus dorsi) during rest and SMVC20-80 for acute (AP) in relation to no LBP (NP) in N = 8 participants (mean ± SD, paired t-test: * p < .05).
73
SAR in LBP patients compared between sexes: Considered separately for sex (M: n = 3, F: n = 5), differences of normalized EMG activation of ALLext between AP and NP ranged from -1 ± 4% to 15 ± 4% in M, and from 1 ± 3% to 12 ± 11% in F (mean ± SD [rest, SMVC80]). During rest and SMVC20-60, normalized EMG activation shows a linear and very similar increase in both sexes. At SMVC80, however, an exponential increase in activation is recognizable in F during both AP and NP status, with the latter even rising above AP activation of M (Fig 34). Because of the small n and the high variance within groups, comparison of the difference in pain status (AP, NP) between sexes showed no effect, neither by Mann-Whitney U-test nor by repeated measures ANOVA (pain * load * sex). Fig. 35 shows the difference of AP activation in relation to NP.
SAR compared between pain status and sexes (S3)
Figure 34: SAR compared between pain status and sex (S3)
Figure 34: All back muscles averaged (ALLext) during rest and SMVC20-80 distinguished for acute (AP) and no LBP (NP) and compared between sexes (M, n = 3; F, n = 5) (only mean values for better differentiation).
AP in relation to NP compared between sexes (S3)
Figure 35: SAR differences of AP in %NP compared between sexes (S3)
Figure 35: Differences of relative EMG activity [%MVC1] of acute pain (AP) in relation to no LBP pain (NP) for all back muscles averaged (ALLext) during rest and SMVC20-80 compared between sexes (M, n = 3; F, n = 5) (mean ± SD).
74
Antagonistic co-activation in LBP patients: Antagonistic EMG activation of abdominal muscles (ALLflx: flexor equivalent) during trunk extension trials, normalized to their agonistic activation during MVC1 trunk flexion, ranged from 6.2 ± 3.9% to 15.3 ± 5.7% during AP and from 4.5 ± 2.7% to 13.2 ± 5.7% during NP status (mean ± SD for rest to MVC1) (Fig. 35 A). Accordingly, given as difference compared to NP reference activation, AP values descriptively were overall higher in the range of +10% (SMVC60) to +38% (rest) and on average 27 ± 11% for ALLflx (no figure). A similar trend was observed when individual abdominal muscles were analysed separately (Fig. 35 B-D), resulting in maximum differences of +47% (RA) and +48% (OI) during rest, and +23% (OE) at SMVC20. Only the OI muscle at MVC1 and SMVC60-80 revealed slightly smaller mean EMG activation (-1 to -6%) during AP compared to NP status. However, analysis by paired t-test and ANOVA showed no difference or interaction effect of co-activation EMG by pain status.
Antagonistic co-activation during SAR protocol in LBP patients (S3) Flexor equivalent (ALLflx)
A
M. rectus abdominis (RA)
B M. obliquus externus (OE)
C
M. obliquus internus (OI)
D
Figure 36: Antagonistic co-activation of trunk flexors in LBP patients (S3)
Figure 36: Antagonistic co-activation (in % of agonistic activity during MVC1 trunk flexion) of (A) flexor equivalent (ALLflx) and individual muscles - (B) RA: rectus abdominis, (C/D) OE/OI: obliquus externus / internus) during rest, SMVC20-80, MVC1 compared between LBP status (AP: acute pain, NP: no pain), N = 8 participants (mean ± SD).
75
Antagonistic co-activation in LBP patients compared between sexes: Sex-specific values for antagonistic co-activation for ALLflx ranged from 5.8 ± 3.7% to 13.4 ± 4.9% in M (n = 3) and from 6.4 ± 3.8% to 16.5 ± 6.4% in F (n = 5) during acute LBP (AP), and 3.9 ± 1.5% to 11.6 ± % (M) and 4.9 ± 3.4% to 14.5 ± 6.6% (F) during no pain (NP) trials (mean ± SD [rest; MVC1],) (Fig. 37). The trend for a higher normalized co-activation in females compared to males, independent of LBP status, also appeared when differentiated between individual muscles. However, no statistically significant difference was found by pairwise comparison or ANOVA.
Antagonistic co-activation ALLflx in LBP - sex comparison (S3)
Figure 37: Antagonistic co-activation of ALLflx in LBP patients - sex comparison (S3)
Figure 37: Antagonistic co-activation (in % of agonistic activity during MVC1 flexion) of flexor equivalent (ALLflx: all abdominal muscles averaged) during rest, SMVC20-80 and MVC1 compared between sexes (M: n = 3, F: n = 5) and LBP status (AP: acute pain, NP: no pain) (mean ± SD).
Synergistic co-activation pattern in LBP patients: Comparison of individual back muscle contribution to overall extensor EMG in LBP patients resulted in average values of 48 ± 14% (ESL), 36 ± 7% (EST) and 16 ± 7% (EST) during acute LBP (AP), and 49 ± 15% (ESL), 33 ± 6% (EST) and 18 ± 8% (LD) during no pain status (NP), (mean ± SD) (Fig. 38, 39). Independent of pain status, ESL showed very low activation during rest (AP: 21%; NP: 20%), however, generating about half of overall back muscle activation during trunk extensions decreasing with rising load (ranging 60% to 46%). Contributing about half of resting activation (AP: 50%; NP: 45%), EST proportion ranged from 29 to 40% during SMVC20-80 and MVC1. LD contribution, except during rest (AP: 29%; NP 35%), was overall rather low, with a rising activity proportion during higher loads (ranging 9 to 19%). 76
Tested for differences, ESL contribution values tended to be lower (with p < .05 at SMVC80), EST values were generally higher (p < .05 at rest and SMVC40-80), and LD activation, being lower during rest and SMVC20-60 (p < .001 at Rest; p < .05 at SMVC20), was higher at high load during AP compared to NP status. When compared by ANOVA (pain * load), effect of pain was found to be statistically significant for LD only (F (1,5) = 4.415, p < .05) (Fig. 38 A - C).
Synergistic EMG distribution during SAR protocol in LBP patients (S 3)
Figure 38: Synergistic co-activation in LBP patients stacked bars (S 3)
Figure 38: Contribution [%] of ESL/EST: M. erector spinae lumbar/thoracic, LD: M. latissimus dorsi to overall back muscle activity (100%) during rest, SMVC20-80, MVC1 (mean values) for acute (AP) vs. no LBP (NP), N = 8 participants.
Synergistic co-activation during SAR protocol in LBP patients (S3) M. erector spinae thoracic (EST)
M. erector spinae lumbar (ESL)
ANOVA: p = .147
A
ANOVA: p = .061
B M. latissimus dorsi (LD)
Figure 39: Synergisic co-activation of individual muscles during SAR protocol (S3)
ANOVA: p = .021*
C
Figure 39: Contribution [%] of (A) ESL / (B) EST: erector spinae lumbar/thoracic, (C) LD: latissimus dorsi, to overall back muscle activity (100%) during rest, SMVC20-80 and MVC1 trunk extensions compared between acute LBP status (AP) and no pain (NP) test day for N = 8 participants (mean ± SD, * p < .05).
77
3.4 SUMMARY OF RESULTS Development of the method The descriptive analysis of the isometric SAR between a female LBP patient and a healthy male control (S1a) resulted in a clear difference in progression of normalized EMG activation (ALLext) during load increase (Tab. 18). Whereas the healthy participant, with twice as much MVC1 torque output compared to the patient, showed a constant curvilinear SAR trajectory, the respective EMG values of the patient initially remained constant before increasing markedly during higher SMVC loads. Regarding co-activation, antagonists showed higher and synergists much more variable values in the LBP patient compared to the healthy participant. Comparison of MVCs, as reference for SAR normalization, during different contraction modes (S1b) revealed the highest extension torque output during eccentric mode, and for flexors similar high values during eccentric and concentric modes. In contrast, peak EMG activation overall showed no significant or directed difference between contraction modes. The reliability analysis of MVC within-test day comparison (initial versus final MVC trial) revealed high reproducibility for peak torque in healthy participants of both sexes (S2) as well as in LBP patients (S3), however, with the latter showing about twice the amount of variability during acute pain status. EMG activation analysis in general revealed less variability in healthy participants, compared to LBP patients (S3), with females having twice as much as males (S2). When comparing MVC within-test day reliability between acute and no pain status in LBP patients, variability was clearly higher during acute LBP. Nevertheless, overall reliability of absolute peak EMG activation during MVC was even better than expected for both within- and between-days.
Validation of the method by comparison of sexes When comparing sexes in S2 the SAR values of M. erector spinae, though showing no significant overall effect, resulted in a higher normalized activation in females at moderate submaximal loads. This difference seems to be primarily caused by a deviating SAR course of the thoracic part of M. erector spinae, whereas its lumbar part proceeded nearly congruent. Overall, the SAR trajectory showed linear rather than clearly curvilinear behaviour, with normalized EMG activation recordings appearing lower in male participants compared to females (Tab. 18). Similarly, abdominal co-activation was pronounced distinctly higher in 78
females, emerging as statistically significant at moderate SMVC load. During analysis of synergistic co-activation, only minor differences in EMG distribution have been identified. The activation of thoracic erector spinae increased constantly with rising load in both sexes, what was more pronounced within female participants.
Transfer of the method to LBP patients Taking the extensor muscles together, a significant effect of pain status on the SAR in terms of higher normalized EMG activation was found in S3, being particularly marked during high load (Tab. 18). Considered individually, M. erector spinae showed a quite linear SAR trajectory, with its thoracic part being more affected by pain condition compared to its lumbar part. The role of M. latissimus dorsi remains somewhat ambiguous. At least, an overall accented increase of normalized LD EMG activation at high load became visible. Although not statistically significant, a clear pattern of higher abdominal co-activation was found in acute pain status compared to pain-free measurements in the LBP patients as well. In conformity with S2 results, female LBP patients showed a distinct higher co-activation during both acute and pain-free status. With regard to synergistic muscle activation, normalized EMG of thoracic erector spinae muscle were higher during acute pain compared to pain-free status, with its lumbar part behaving vice versa. Again, the activation pattern of M. latissimus dorsi was less unique, being significant lower during low load, at least.
Overview of SAR results Table 18: Summary of the main SAR results Study
S1a
S2
S3
SAR subanalysis
Overall characteristics of normalized EMG activation
Single-case comparison
ALLext ALLflx Syn. distr.
Sex comparison
ES RA Syn. distr.
ALLext Pain status ALLflx LBP patients Syn. distr.
Difference (mean ± SD)
uniform increase in H, transient course in LBP patient higher co-activation in the LBP patient highly variable, often opposite proportional activation
↕ 122 ± 269% ↑ 146 ± 62% -
always and increasingly higher in females continuously higher in females similar increase of thoracic activation with rising loads
↑ 113 ± 4%
higher during acute pain (except resting activation) continuously higher in acute pain and female patients lower lumbar / higher thoracic activation in acute pain
↑ 111 ± 8% ↑ 127 ± 11% -
↑ 133 ± 9% -
Main findings of S1-S3 measurements regarding SAR of agonistic extensor activation (ALLext: extensor equivalent; ES: M. erector spinae), of antagonistic abdominal co-activation (ALLflx: flexor equivalent; RA: M. rectus abdominis), and synergistic activity distribution of extensors (Distr. ext), given with difference of S1a: female LBP patient in relation to healthy male, S2: healthy females in relation to healthy males, and S3: LBP patient during acute pain in relation to no pain status (mean ± SD).
79
CHAPTER 4 – DISCUSSION The main purpose of this thesis was to investigate the neuromuscular efficiency of lower back muscles in LBP. Although various studies tried to research indications for altered neuromuscular control of trunk muscles in the presence of LBP from diverse perspectives, a clear and feasible protocol which is able to outline these changes as requested is still missing. Methodical issues, such as the restriction to (quasi-)static test routines and the impairments of strength assessment by psychological inhibitions, seem to be among the biggest obstacles. As an alternative approach, the assessment of neuromuscular efficiency of lower back muscles during dynamic SMVC appears to be relevant. In a pilot stage, a protocol combining strength and activation measures to characterize the efficiency of trunk musculature has been developed successfully. Then, this protocol has been validated by demonstrating differences in neuromuscular efficiency of the trunk between healthy males and females. Finally, it has been shown that the SAR protocol is valid and feasible to show differences in LBP patients, in terms of a decreased neuromuscular efficiency of lower back muscles and an altered trunk muscle recruitment pattern, when comparing an acute episode and after remission of pain.
The SAR protocol to represent the neuromuscular efficiency of the trunk With the aim of investigating a possibly impaired neuromuscular relationship of back extensor muscles in the presence of LBP (D’hooge et al., 2013; Roy et al., 1989) a valid and reliable protocol based on the fundamental physiological strength-activation relationship (SAR) (Lippold, 1952) needed to be developed first. Accordingly, for the testing of muscle strength it appeared to be obvious to stick to isokinetic measurements, recently being considered as the appropriate ‘Gold Standard’ proven in validity and reliability for trunk strength measurements in healthy and LBP individuals (Guilhem et al., 2014; Hutten & Hermens, 1997; Langrana et al., 1984; S. Müller et al., 2012; Newton & Waddell, 1993; Van Damme et al., 2013). On the other hand, muscular activation was assessed by EMG amplitude measurements, similarly being accepted as valid and reliable from early on (De Luca, 1997; Hof, 1997; Milner-Brown & Stein, 1975; J. Yang & Winter, 1983). As concurrent isokinetic and EMG measurements during submaximal tasks have been indicated to be less vulnerable to psychological factors in the context of LBP (Grabiner et al., 1992; Larivière et 80
al., 2003; Oddsson & De Luca, 2003; Roy et al., 1989), the testing of muscle activation during submaximal loads of 20 to 80% of maximum capacity, in conformity with the SAR fundament, appeared to be the protocol of choice. The initial isometric pilot measurements descriptively showed a clear difference in SAR of back muscles between a healthy male individual and a female chronic LBP patient. However, while absolute maximum isometric torque output of MVC1 trials of S1a was plausible for both participants (Guilhem et al., 2014; Newton et al., 1993), absolute EMG activation was only plausible for the healthy participant. Particularly in view of the reference values during isometric contraction trials of the MVC contraction mode comparison measurements (S1b), and with the influence of sex and pain status as well as anthropometric data taken into account (De Luca, 1997), the values of the LBP patient during S1a seem to be far too low. As the normalized EMG activation during respective SMVC trials roughly follows the same pattern, a systematic inaccuracy during EMG recording may be a matter of speculation. On the other hand, the progression of the patients’ normalized EMG activation during increasing submaximal loads also does not correspond to the expected SAR characteristics. Whereas the healthy control participant showed an exponential, but nevertheless constant, increase of muscle activation resulting in a clear curvilinear SAR function (Zuniga & Simons, 1969), an increase of muscle activation was not recorded before an intensity above 50% MVC1 in the LBP patient. Interestingly, abdominal co-activation in total was clearly higher in the LBP patient, being more in line with results to be expected from the literature (David et al., 2008). In this respect, the chosen isometric protocol clearly discriminated between participants, however, a further analysis of this pilot single-case comparison should be considered with caution for the LBP patient. For the normalization of load and EMG activation during SMVC trials, the use of peak values assessed during MVC efforts is common (Guilhem et al., 2014). Following repeated demands to investigate neuromuscular function of trunk muscles during non-isometric tasks (Larivière et al., 2000a; Roy & Oddsson, 1998) and the ongoing debate about the most appropriate contraction mode for the reference MVC (Burden, 2010; De Luca, 1997), another pilot investigation comparing trunk MVC values during different contraction modes was performed (S1b). In S1b, trunk extensors were shown to be stronger than trunk flexors independent of contraction mode and movement velocity in all participants, in accordance 81
to previous findings (Blacker et al., 2010; S. Müller et al., 2012). During trunk extension, peak torque values were clearly highest during ECC30, lower during ISM and CON30, 60, and lowest during CON120 (Dvir & Keating, 2003; S. Müller et al., 2012). Differences between contraction modes during trunk flexion, in contrast, were found to be less explicit, yielding less than 10% higher values in ECC30 and CON30 compared to ISM and CON60, 120. Together with some contradictory data for flexion peak torque found by Mueller et al. (2012), these findings indicate differences in muscular capacity between trunk extensors and flexors. Furthermore, trunk musculature in general seems to work differently than other human muscles, where maximum voluntary force has been reported to be 30 - 40% higher during ECC compared to CON contractions (Tesch et al., 1990). Regarding maximum EMG values, on the other hand, a higher homogeneity was found in the present measurements. During trunk extension, no obvious differences in EMG activation, despite a statistically significant effect of contraction mode for EST activation (p < .05), became apparent. Indeed, only the rise of co-activation by flexor muscles with extension movement velocity (CON30-120) became visible. For abdominal muscle activation during trunk flexion, a similar balanced composure during different contraction modes was found. Overall, the higher torque output with comparable EMG signal during ECC compared to CON and ISM, especially in trunk extension, is in confirmation with previous findings. Indications for greater mechanical efficiency, lower neural drive and differences in motor unit recruitment patterns have been suggested to be causative (Tesch et al., 1990). However, more recent reports of greater EMG activation during CON compared to ECC, considered to be caused by similar reasons (Kubo et al., 2011), could not be verified by the findings of the present measurements. Concerning the descent debate in literature about EMG normalization procedures, Carlo J De Luca (1997) on the one hand postulated that the use of isometric MVC would be favourable concerning higher EMG signal stability with low relative movement of electrodes over trunk muscle fibres. At the same time, he advocated that out of a set of three MVC contractions the one showing the highest EMG amplitude should be used as a reference value. In contrast, others claimed that the use of isometric contractions is inappropriate for dynamic activities because of differences in peak torque output and recruitment patterns between isometric and non-isometric contractions (Burden, 2010; Kellis & Baltzopoulos, 1996; Mirka, 1991). However, similar to the findings of the present 82
measurements, further studies found only minor differences between the two contraction modes (Burden & Bartlett, 1999; Burden et al., 2003). To conclude, although MVC in isometric mode may produce a more stable reference EMG signal, the use of isokinetic trunk contractions seems to be more conclusive when normalizing results of dynamic trunk strength testing. Moreover, this is in accordance with the fundamental concept of EMG normalization, requiring that the reference EMG is processed in exactly the same way as the task EMG (Burden, 2010). Accordingly, regarding the types of isokinetic contraction, concentric mode occurred to be more appropriate to be used than eccentric mode. Although likewise showing the same level of peak EMG activation, ECC contractions have been shown to rely on a different pattern of motor unit recruitment and fibre type usage (Tesch et al., 1990), thus being inadequate for the normalization of concentric SMVCs during the SAR protocol. Finally, to produce as valid and reliable isokinetic concentric reference MVCs as possible, peak EMG activation of the three most forcible repetitions out of five, with the same angular velocity and ROM, were averaged for the reference value (Baur et al., 2010; Kannus, 1994; F. Mayer et al., 2001; S. Müller et al., 2007). Generally speaking, minimal measurement error of performance is important for the identification of differences between groups and for the tracking of changes between trials. Moreover, it is mandatory for precision in assessment of performance (Carvalho et al., 2011; Hopkins, 2000), especially when the (SAR) protocol by its nature depends upon reliable (MVC) reference values and a reasonable interpretation of outcomes (Atkinson & Nevill, 1998; Lexell & Downham, 2005). Although it has been argued that the analysis of EMG parameters during SMVCs is objective because it is difficult to volitionally influence the action potential signal recorded by EMG (Peach & McGill, 1998), the SMVC resistance intensities are still determined by MVC trials (Reeves et al., 2005). To control possible effects of motivational factors and fear of re-injury and/or inhibition by pain (Vlaeyen et al., 1999) on the reference MVC trial (MVC1), another MVC trial (MVC2) was performed at the end of the SAR protocol within the presented measurements. The analysis of peak torque reproducibility overall revealed excellent reliability, being in conformity with reports from relevant literature (Carvalho et al., 2011; Dervisevic et al., 2007; Gleeson & Mercer, 1992; S. Müller et al., 2007). Although slightly higher variability was found during acute pain status in the LPB patients (S3), the indices still remained below assumed biological and technical 83
variability (Caruso et al., 2012; Carvalho et al., 2011; H. Lund et al., 2005; S. Müller et al., 2007), and clinically relevant cut-off values for isokinetic strength measurements (Gleeson & Mercer, 1992; S. Müller et al., 2007). Despite the absence of control participants and the modest number of LBP patients, it can be confirmed that acute pain does not necessarily cause strength deficits in LBP patients, however, it may be associated with a higher variability in peak torque production. The analysis of maximum EMG activation in total demonstrated acceptable to excellent results of within-protocol reliability (S2/3, range: CV 4.7 - 16.4%, TRV 6.8 - 19.2%) which are consistent with relevant literature (Dankaerts et al., 2004; Danneels et al., 2002). Interestingly, within-day reliability in healthy individuals (S2) tended to reveal poorer indices in females for M. erector spinae (ES) compared to males. Moreover, pain-free LBP patients (S3) showed equally excellent values as healthy participants did during sex comparison. In accordance with indices for torque output, LBP patients in pain (AP) demonstrated clearly weaker within-protocol reliability (ALLext: CV 8.1%, TRV 12.6%) than during the pain-free retest trial (ALLext: CV 4.9%, TRV 6.8%). Furthermore, M. latissimus dorsi (LD) showed the lowest reliability (max values: CV 16.4%, TRV 19.2%) of all extensor muscles recorded during S3. Looking at development of absolute EMG activation, values in general decreased from MVC1 to MVC2 in healthy individuals and pain-free LBP patients. During acute pain, in contrast, EMG activation increased in EST and LD just as much as ESL activation decreased. These within-protocol redistributions of muscular activation support indications for higher fatigability of lumbar trunk musculature in the presence of LBP (Larivière & Arsenault, 2008; Roy et al., 1989; Tesch et al., 1990), requiring compensation by higher extensor muscle proportions to ensure spinal stability (Van Dieën, Cholewicki, et al., 2003), and being a matter of discussion later on. Regarding between-day reliability (S3), indices for EMG peak activation ranged from barely acceptable to excellent (CV 8.3 - 20.4%, TRV 8.8 - 26.1%), which is also consistent with literature findings (Dankaerts et al., 2004; Danneels et al., 2002). However, to the author’s knowledge, there were no previous studies regarding testretest reliability in LBP patients with and without acute pain, thus making comparisons between current and existing data difficult. The fact that the present findings in LBP patients (S3), independent of pain status, range within the same area of reliability as found in healthy participants (S2) confirms earlier concerns suggesting absolute EMG parameters being 84
critical when used as outcome measures (Dankaerts et al., 2004; Elfving et al., 1999). Besides the biological within-individual variation inherent in EMG analysis (Roy et al., 1989), removal and reapplication of electrodes has been identified as a major cause for betweenday error (De Luca, 1997; Roy et al., 1989; Veiersted, 1991). Despite the overall excellent peak torque and acceptable to excellent peak EMG reliability data (Caruso et al., 2012; Shrout & Fleiss, 1979), some further limitations of the measurements, especially of those including LBP patients, have to be discussed. During SAR pain status comparison, the test-retest interval was very variable (38 ± 30 d, mean ± SD), owed to the naturally different duration of pain subsiding within the heterogeneous group of LBP patients. Moreover, given the small sample size of S3 measurements, the results of reliability analysis have to be seen as a first insight requiring further validation. Ultimately, it has been suggested that, because of the pain-related psychological factors previously mentioned, testing of LBP patients “may actually be more a test of their pain level and tolerance, resulting in poorer reliability” (Dankaerts et al. (2004), p. 339). All the more, considering the overall good reproducibility of absolute muscle strength and activation parameters in both healthy and LBP participants, together with the comparison of normalized EMG activation during even more reliable SMVCs (McGill, 1991; O’Sullivan et al., 2002), the SAR protocol approach appears to be based on a promising fundament.
Validation of the SAR protocol comparing neuromuscular efficiency between sexes Before investigating the influence of acute pain on the strength-activation relationship (SAR) in LPB patients, the feasibility of the measurement protocol and the variability of outcome parameters needed to be validated (Bilodeau et al., 1992). Thereby, physiological sex differences in strength and neuromuscular performance have long been known (Komi & Karlsson, 1978; Langrana & Lee, 1984; I. A. Stokes et al., 1987) and have been confirmed recently (David et al., 2008; S. Müller et al., 2012). The consequently conducted comparison of healthy males and females resulted in less pronounced than expected, but still unequivocally different pattern of neuromuscular coordination. Performing the isokinetic SMVC within the SAR protocol, females exhibited 7 - 16% higher normalized EMG activation than males when M. erector spinae EMG-leads were taken as a whole. In doing so, the highest and statistically decisive differences at SMVC40-60 were shown to be mainly caused 85
by its thoracic part (up to 25% higher normalized EMG activation), whereas lumbar activation developed quite equally. This finding was also reflected by the results of synergistic distribution analysis with females compared to males showing marginally yet consistently higher relative EST contribution (3 - 4%) to overall M. erector spinae activation during low to moderate intensities, vanishing at higher load and being lower during rest. Based on sex differences found during isometric back extensions, Larivière & Arsenault (2008) recommended investigating EMG patterns between groups within the very intensity levels of 40 to 60% MVC, after finding deviations of EMG parameters up to twofold in this area. Furthermore, in agreement with the present findings, they reported a higher proportional use of thoracic erector spinae muscle in females as well. It has been speculated that this may be caused by a different motor control pattern, supported even by findings of diverse muscle microstructure in the thoracic and lumbar region between sexes (Larivière & Arsenault, 2008; Mannion et al., 1997; E. M. Miller et al., 2010). However, these conclusions were drawn on basis of investigations that were exclusively composed of isometric contractions (Gallagher et al., 2011). More recently, Nelson-Wong et al. (2012) also reported indications for sex differences in postural control mechanisms during dynamic trunk extensions after prolonged standing. Accordingly, the findings of the present thesis verify the sum of assumptions mentioned so far, showing for the first time differences in normalized trunk muscle recruitment patterns between healthy males and females during dynamic trunk extensions without preloading. Besides higher normalized agonistic muscle activation and indications of a shift in recruitment towards the thoracic part of overall M. erector spinae, a higher antagonistic coactivation has been found for females in the present measurements. Thereby, differences of normalized M. rectus abdominis activation during isokinetic trunk extensions ranged 18 - 43%, when the values for females were put in relation to those of males. Higher coactivation in females was also reported by others, e.g. by Marras et al. (2003), who investigated sex influences on spinal loads during lifting tasks. Referring to findings of Granata & Marras (1995), they suggested this to be indirectly caused by the redistribution of activation and the recruitment of ‘non-primary’ extensor muscles such as M. latissimus dorsi. However, only the main extensor and flexor muscles were analysed in the present sex comparison, leaving this aspect a matter of speculation. Nevertheless, it appears to be 86
common consensus in the literature that females have greater difficulty to maintain trunk stability (Cholewicki et al., 2000), inducing higher coactivation of antagonistic muscles as a compensation strategy (David et al., 2008; Granata & Orishimo, 2001; Marras et al., 2003). Independent of possible distinctions in muscle physiology or motor control and recruitment patterns, anthropometric differences such as body mass, subcutaneous adipose tissue and relative upper body height (Swami et al., 2006) are mandatory to be considered when it comes to sex comparison in trunk muscle activation (Gallagher et al., 2011). In terms of body mass, for example, males not only demonstrate a higher proportion of lean tissue (A. E. Miller et al., 1993) but carry a greater percentage of their total body mass in their upper body, contributing to timing and amplitude of extensor muscle activation (Nelson-Wong et al., 2012). The trunk dynamometer used for the present measurements in any case corrects for gravitational influences of upper body mass and height through the whole range of motion (Bardis et al., 2004; Guilhem et al., 2014; S. Müller et al., 2011), which is essentially required for drawing valid conclusions out of isokinetic strength testing (Baltzopoulos & Brodie, 1989). Regarding the erroneous effect of subcutaneous adipose tissue thickness on interpretation of absolute levels of voltage (Lehman & McGill, 1999; Nordander et al., 2003), the normalization procedure during SMVC used within the present SAR protocol eliminated any possible data corruption by comparing only normalized muscle activation levels interindividually (Larivière & Arsenault, 2008; McGill, 1991). The results of minor yet systematic differences found in the present SAR measurements of trunk muscles, support the frequent indications for differences in neuromuscular control and coordination patterns between sexes: “… women are not just scaled down versions of men.” (Marras et al., 2003, p. 98). Although males produce higher absolute torque output, the compressive loads on the spine appear to be much closer to the expected tolerance level in women (Jäger & Luttmann, 1991; Marras et al., 2003). As a consequence, higher normalized extensor activation especially on the thoracic level, in combination with an increased abdominal co-activation, may be necessary mechanisms to maintain spinal stability. On the other hand, this trade-off leads to a decrease of neuromuscular efficiency of the trunk in females. However, if indeed no differences in overall LBP prevalence are evident between the sexes, something other or additional to the presented alterations in the SAR and inter- and intramuscular coordination pattern has to be contributing to LBP. 87
The effect of acute pain on neuromuscular efficiency in LPB patients As the main objective of the present thesis, the effect of acute pain on the neuromuscular efficiency of trunk muscles in LBP patients has been investigated. Since LBP is a very heterogeneous condition (Airaksinen et al., 2006; Fairbank et al., 2011; Hall et al., 2009), its actual clinical manifestation in the eight study participants is of general interest for the interpretation of results. The measurement population, though relatively small, appears to be representative in a way, containing after all chronic, recurrent and first onset of LBP (Von Korff, 1994) with structural, transient and non-specific causes (Kent & Keating, 2004; Van Tulder et al., 2006; Waddell, 2004). In common was back pain (Fairbank et al., 2011; Hoy et al., 2014) on the first measurement day. However, it has to be considered that acute and chronic pain are “not only different in time scale but are fundamentally different in kind.” (Waddell, 1987, p. 636). Whereas acute pain is usually characterized by the peripheral stimulus, nociception and tissue damage, chronic pain often becomes increasingly dissociated from its physical origin and any nociceptive stimulus (Waddell, 1987). Since adaptations of neuromuscular control of trunk muscles due to LBP have been shown to potentially consolidate, with the consequences being still unclear (Hodges & Tucker, 2011; Van Dieën, Selen, et al., 2003), any generalization of conclusions drawn from the present measurements should be well-considered. Concerning pain intensity on the two measurement days, a clear difference was found between acute (AP) and pain-free (NP) statuses with a poor to high correlation of the two pain measurement tools. With a change in reported LBP intensity of 3.1 ± 1.1 (GCPS) and 27 ± 16 mm (VAS1), the difference between test days (mean ± SD) appeared to be clinically relevant, following the definition of at least 10 to 18% decrease in pain rating (Bijur et al., 2001; Childs et al., 2005; Hägg et al., 2003; Hall et al., 2009), and within-1 min reliability results of ±13 to ±18 mm (95% LoA) for acute pain, reported by previous studies (Bijur et al., 2001; DeLoach et al., 1998; Todd et al., 1996). In the present tests, the participants seemed to be more decisive in estimation of their present pain sensation when answering the first item of the GCPS, consisting of an 11-point numeric pain scale. In contrast, participants hesitated markedly when asked to fill out the graded VAS, presumably initially confused by the additional request of ‘general’ pain, thought to be used for explicit discrimination of pain localization. Furthermore, difficulties in transferring the subjective pain experience into 88
a distance measure have been indicated before (Bijur et al., 2001). Accordingly, the participants seemed to become more confident during repeated VAS ratings in the course of the measurement protocol. Referring to this aspect, a slight increase of self-reported pain level has been found during the measurements of both AP (4 ± 10 mm) and NP (7 ± 8 mm) status (mean ± SD), however, without having a significant impact on the discrimination criteria between test days. Beside the overall demanding though not exhausting exercise protocol, well-known differences in short-term pain fluctuation between participants, likely decisive because of the small number of participants here, may be relevant reasons for this increase (Bijur et al., 2001). Although self-reported measures recently have been confirmed to provide the ‘gold-standard’ for pain assessment (Schmidt et al., 2010), the reasons mentioned above may also be held responsible for the poor to moderate correlation results found between the two pain measurement tools here. Only the results of GCPS to VAS1 comparison during NP status are in agreement with previous findings, reporting high correlation values of r = .91 to .95 between an 11-item graded pain scale and a VAS in preand post-laparoscopic surgery patients (DeLoach et al., 1998). Nevertheless, considering the small and heterogeneous group of LBP patients within the present measurements, the difference in pain status between test conditions can be considered to be clinically relevant. During analysis of normalized EMG values during isokinetic loads between acute LBP and after remission of pain, a statistically significant effect of pain on the SAR of the trunk extensor equivalent (ALLext) was found. The evaluation of individual back muscles revealed that normalized activation of lumbar erector spinae (ESL) tended to be higher, but increased almost similarly during rising load accomplishment. More obvious, its thoracic activation (EST) was clearly elevated during acute pain status with the difference rising almost continuously with increasing loads until reaching statistical significance at SMVC80. This behaviour recalls roughly the SAR pattern found within the sex comparison, this time, however, with its divergence peaking at high instead moderate load (Larivière & Arsenault, 2008). In agreement with similar findings during isometric tests, distinct pain induced adaptation mechanisms such as a shift in fibre-type usage towards anaerobic type II fibers which are predominantly recruited during relatively higher force levels may be relevant (Roy et al., 1989; Roy & Oddsson, 1998). Interestingly, the SAR behaved quite similar at low to moderate loads (SMVC20-60) within LPB patients of both sexes, before female EMG activation 89
increased markedly, however, not statistically significantly above male values. It appears that indications for differences in postural control between sexes may be particularly relevant during loads that are close to the expected individual maximum capacity. Independent of sex, the normalized EMG activation of LBP patients overall was increased during force development in the present study. This mechanism early has been previously associated with findings of decreased neuromuscular efficiency in fatigue, where more MUs need to be recruited to generate the same amount of force as in the non-fatigued state (Edwards & Lippold, 1956; Milner-Brown et al., 1986). In accordance, Kallenberg & Hermens (2006) demonstrated increased EMG amplitude and frequency parameters in patients with chronic painful trapezius muscles during computer work-related tasks. They concluded that the increased high-threshold MU recruitment and firing rate for the same biomechanical demand indicate a higher motor control input afforded by the central nervous system. Additionally, the authors reported an elevated muscular stress sensitivity during a cognitive task in the chronic pain patients, indicated by increased MU activation even without biomechanical demand (Kallenberg & Hermens, 2006). These findings are in favour of the pain-spasm-pain model (Flor & Turk, 1984; Travell et al., 1942), suggesting a stiffening of the painful area by higher muscle activation to prevent further damage (Kallenberg & Hermens, 2006). However, in contrast to the assumptions of the model, normalized EMG activation of agonistic extensors was not elevated during rest in the acute pain measurements here. Looking at the recruitment of M. latissimus dorsi (LD), a rather slow increase of normalized EMG activation during low to moderate loads (SMVC20-60), with values tending to be lower during acute pain status, was found in LBP patients in the present study. However, during SMVC80 the activation on acute pain test day increased exponentially above the activation of pain-free testing, resulting in average values close to and beyond MVC1 reference activation. The increased recruitment of ‘secondary’ agonistic muscles during higher loads is well known from healthy participants during isometric tests (Marras et al., 2003; Tan et al., 1993) and has been considered to result in a more complex loading of the trunk. The clearly higher, though not statistically significant normalized LD activation at high load during acute pain seems to be owed to the trunk’s strategy to compensate stability deficiencies (Panjabi, 1992), required especially during demanding tasks (Marras et al., 2003), as discussed for thoracic activation in both sexes, and overall extensor activation in females before. 90
The increased recruitment of non-primary extensor muscles such as LD has been shown to be associated with an increase in antagonistic co-activation (Granata & Marras, 1995; Marras et al., 2003). In accordance, analysis of co-activation of abdominal muscles during the SAR protocol resulted in overall clearly elevated activation during acute pain status in LBP patients. In detail, extensor equivalent (ALLext) activation was up to 38% higher, with M. rectus abdominis (RA) and M. obliquus externus (OE) showing up to 47% and 23% increased EMG values, respectively, compared to the pain-free test day. Increased co-activation of trunk muscles has also been reported by several studies in the literature investigating chronic or recurrent LBP patients in remission of pain (Cholewicki et al., 2002; D’hooge et al., 2013; Jones et al., 2012; Radebold et al., 2000, 2001; Van Dieën, Cholewicki, et al., 2003). It has been suggested that antagonistic co-contraction is induced by spinal control demands (Granata & Orishimo, 2001; Van Dieën, Selen, et al., 2003) as a stiffening strategy to prevent further harm to impaired spinal structures (Cholewicki et al., 1997; Jones et al., 2012). Besides distorted proprioceptive input and/or pain, increased co-activation of the trunk seems to be triggered by reduced spinal stability and trunk muscle force (D’hooge et al., 2013; Panjabi, 2003; Van Dieën, Cholewicki, et al., 2003). In congruence with the findings during sex comparison (S2), co-activation was always markedly higher in female patients independent of pain status, supporting the indications for generally different neuromuscular control pattern between sexes (Marras et al., 2003). Furthermore, there seem to be overlaps in biomechanical strategies of the trunk to compensate for assumed physiological deficiencies and pathologic impairments of stability between females (Cholewicki et al., 2000) and LBP patients (Granata & Marras, 2000; Panjabi, 1992). As antagonistic coactivation has been proven to increase spinal load, “it remains to be demonstrated whether increased stability at the cost of spinal load is beneficial” (Granata & Marras, 2000, p. 1398). It has been shown, for example, that prolonged co-activation levels above 5% MVC activation during neutral posture, as found in LBP patients during acute pain status within the present study, significantly correlated with muscular pain (Cholewicki et al., 1997). Moreover, as antagonistic trunk flexor activation decreases the trunk extensor moment, prime extension movers and synergists have to compensate this decrement by increased activation (Granata & Marras, 1995). Consequently, increased co-activation in LBP “may reflect a suboptimal muscle recruitment strategy.“ (D’hooge et al., 2013, p. 176). 91
During analysis of synergistic activity distribution, with individual contributions being mapped in relation to overall extensor activation, the differences between pain conditions are put into perspective, however, are confirmed overall. Most visible appears to be the intra-muscular activity redistribution of M. erector spinae, showing a lower lumbar but higher thoracic proportion, being statistically significant at almost all SMVC loads (except SMVC20). Moreover, the contribution of LD to total extensor activation seems to be less superficial than before, now resulting in a statistically significant effect of pain status. The varying synergistic contributions of individual extensor muscles with exercise intensity is in line with previous findings, reporting a lower activation of laterally located back muscles compared to the medial ones at low to moderate intensities, with decreasing differences at higher intensities (J. M. Mayer et al., 2005; Vink et al., 1987). From the perspective of exhaustion, Larivière et al. (2008) concluded, encouraged by their data on fatigue indices by EMG amplitude analysis, that medial back muscles should fatigue faster. Accordingly, more laterally (and higher) located muscles would compensate this decrease of force capacity by increasing their relative activity contribution (Larivière et al., 2008). In concurrence with other studies showing that relative contribution of EST compensated for an ESL decrease in LBP patients (Van Dieën, Cholewicki, et al., 2003), a consistent higher proportion of EST to overall activation has been found during acute LBP here. It has been assumed that this higher relative contribution of EST during LBP may also be caused by the mechanical advantage due to a longer lever arm, aiming to support ESL and to decrease the compressive cost on the lumbar spine (McGill, 1991; Potvin et al., 1991). This so-called ‘favouring’ of muscle use, however, may result in a less functional share of mechanical loads within the spine, potentially leading to further overuse injuries (Roy & Oddsson, 1998). To the author’s knowledge, the present thesis is the first to report normalized EMG activation pattern of trunk muscles during isokinetic strength testing in LBP patients suffering from acute pain. It has been shown that EMG activation of main agonistic extensors as well as antagonistic flexors was increased, and synergistic extensor activation was redistributed in LBP patients during acute pain compared to a pain-free episode. No healthy controls were included in these measurements (S3), however, the results can be put into context by comparison with values of the sex comparison in non-symptomatic participants (S2), as major parts of the setup (except fewer EMG leads) and the protocol 92
itself were the same. Starting with the SAR course of M. erector spinae, ESL and EST in both cohorts proceeded very similarly, with ESL showing a more linear and EST an apparent curvilinear behaviour. Several factors being mutually dependent, such as differences in fibre type composition (Mannion et al., 1997; Woods & Bigland-Ritchie, 1983; Zuniga & Simons, 1969), mechanical characteristics (Cholewicki & McGill, 1996; Potvin et al., 1991) and central nervous recruitment pattern (McGill, 1991), have to be considered. Next, concerning the level of normalized EMG activation during SMVC, a clear trend from healthy males to females over to non-acute and acute LBP patients has been discovered. This range of neuromuscular interaction may reflect the options of trunk motor control to functionally adapt to physiologic (sex) and pathophysiologic (LBP) conditions in order to always provide sufficient trunk stability. Referring back to co-contraction patterns, a similar association has been demonstrated by co-activation of M. rectus abdominis, being in general higher for healthy and LBP females and even higher during acute LBP, indicated to be beneficial for protective trunk stiffening and increase in stability (Jones et al., 2012; Marras et al., 2003). Regarding intra-muscular coordination of M. erector spinae, the increased normalized EMG activation was accompanied by a shift of recruitment towards the thoracic level, suggested to compensate for lumbar deficiencies in stability and extensor moment provision (Larivière & Arsenault, 2008; Van Dieën, Cholewicki, et al., 2003). Overall, these findings support indications of a generalized pattern of altered central motor programming to compensate for insufficient trunk stability (D’hooge et al., 2013; Jacobs et al., 2011; McGill, 1991). However, the consequences of an altered trunk control in terms of a decreased ‘neuromuscular efficiency’ for the short and long-term course of the LBP condition remain to be clarified. On the one hand, the results of the MVC tests in the present thesis show, in agreement with other studies including isometric protocols, that maximum strength performance does not necessarily have to be significantly decreased during acute LBP (Balagué et al., 2010; Feldman et al., 2001). The performance of a task, on the other hand, does not solely depend on the capacity to generate maximum force, but also on the amount of muscle activation needed (Patsika et al., 2011). Accordingly, increased normalized EMG activation, as found in LBP patients during acute pain and even after remission of symptoms here, indicates a lower neuromuscular efficiency and in turn a requirement for more neural drive (Arabadzhiev et al., 2010; Oksa et al., 2012). However, it has to be noted that an 93
elevation of amplitude characteristics, as is also often found during fatigue, may also be caused also by peripheral factors such as changes in the profile of intracellular action potentials (Arabadzhiev et al., 2010). The term ‘neuromuscular efficiency’ thus can be misleading when EMG amplitude alterations are only related to central mechanisms. Beside the ability to effectively activate the agonistic working back muscles, the neuromuscular performance during trunk extension, moreover, is characterised by the antagonistic activation of abdominal muscles (Patsika et al., 2011). Indicated to compensate for impaired extensor muscle function, their increased activation found in LBP patients during acute pain in the present thesis is in agreement with accepted trunk stability mechanisms (Granata & Marras, 2000; Panjabi, 1992). However, the increased antagonistic co-contraction, as already indicated, in turn seems to require even higher agonistic extensor activation than already found to be elevated, probably leading to a vicious cycle on cost of neuromuscular efficiency of the trunk as a whole. In this context, the additional shift of M. erector spinae activation towards a more pronounced thoracic proportion appears as another mechanism of neuromuscular trunk control to relieve the painful lumbar muscle area. All the more, the benefit of increased stability but higher internal spinal load, and its role in chronification of LBP remains questionable. The substantial increase of internal load on the spine, however, may result in similar degenerative processes as discussed for cumulative external loads, especially when exposed for a longer period of time.
Methodological considerations Beside the promising results of the present studies, some limitations need to be carefully considered. Although isokinetic measurements recently have been considered to be the ‘Gold Standard’ for strength capacity assessment (S. Müller et al., 2012; Stark et al., 2011) their reliability and validity in trunk strength testing is traditionally a matter of debate (Guilhem et al., 2014). A major potential drawback, for example, is the considerable contribution of hip muscles, especially during attempted or dynamic trunk extension of isometric or isokinetic contractions, respectively (Thorstensson & Arvidson, 1982). However, in the present investigations participants were measured in a standing position with slightly flexed knees and the centre of rotation was placed in axis to L3, both having shown to decrease the non-willing recruitment of hip muscles during trunk extension (Grabiner et al., 94
1990; Guilhem et al., 2014; Tan et al., 1993; Thorstensson & Arvidson, 1982). In addition, by the firm and standardized positioning of participants, the potential displacement of the axis of rotation was minimized, which has been discussed as another source of bias during dynamic torque assessment in previous studies (Guilhem et al., 2014; Thorstensson & Arvidson, 1982). Apparently contradictory, beside verbal encouragement for maximum torque production, participants were not instructed on how to produce maximum trunk extension and flexion contractions, to let the central nervous system optimize its control strategy by itself (De Luca, 1997). An issue of reliability of SEMG measurements often addressed is the electrode position on the muscle and thus the specificity of the muscle generating the recorded signal (Roy et al., 1989; Roy & Oddsson, 1998). Within the measurements of the present thesis, both were addressed by carefully selecting an EMG electrode setup that has proven to be reliable in various studies (Cholewicki & McGill, 1996; Cholewicki et al., 1997; McGill, 1991; Radebold et al., 2000). The setup best represents the activation pattern of main trunk extensors and flexors and has shown minimized cross-talk between lead pairs during trunk bending tasks (McGill, 1991). Furthermore, it has been concluded that, by the use of normalized SMVC activation values during the SAR protocol, the effects of cross-talk should automatically become minimized (Clancy et al., 2001). Therefore, no further efforts to test or reduce cross-talk (De Luca, 1997) were made in the measurements of this thesis. As initially introduced, differences in EMG parameters between patients suffering from LBP and healthy individuals have been reported to be significant particularly during high to maximum loads (Roy et al., 1989), which is supposed to be induced, among other reasons, by fiber type impairments due to disuse (Roy & Oddsson, 1998). However, in the SAR protocol used in the present measurements, the EMG amplitudes during SMVCs have been normalized to their activation during MVC contractions. Therefore, the course of the SAR has to converge near maximum strength production given its nature, possibly masking potential differences of EMG characteristics during higher loads between sexes (S2) and in LBP patients (S3) with and without acute pain (see results for activation distribution analysis). Accordingly, the finding of significant differences in normalized EMG of trunk extensor muscles (ALLext) at SMVC80 in LBP patients of S3 measurements, all the more underlines the identification of a true difference between pain statuses at higher loads. 95
Conclusion Despite numerous attempts in research to biomechanically assess neuromuscular alterations of trunk muscles which assumed to be associated with LBP, supporting evidence that substantiates the suggested centrally controlled trunk stiffening strategy is scarce. Moreover, the studies that demonstrated more promising results are mostly limited to static measurements and/or share the restriction of comparing muscle activation parameters solely using maximum strength measurements, which are possibly being influenced psychologically in LBP patients. Alternatively, it has been indicated repeatedly that the SAR of back muscles is impaired in the presence of LPB, meaning a decreased neuromuscular efficiency in terms of higher neural activation input is necessary for the same or lower strength output when compared to asymptomatic individuals. The present thesis introduces a new method to analyse the SAR of back muscles, allowing proof of impairments of neuromuscular efficiency during dynamic trunk extensions in LBP patients. It has been shown that the measurement protocol, primarily consisting of the analysis of normalized muscular activation during submaximal loads, is valid and feasible in healthy individuals and in the clinical setting of LBP. Moreover, it has been shown clearly that the decreased neuromuscular efficiency of main back extensor muscles is accompanied by an increased abdominal co-activation and a redistribution of synergistic back muscle activation towards a more thoracic pronounced coordination pattern in patients suffering from LBP. These findings thereby confirm consistently the assumptions made by the ‘motor adaptation to pain’ model by Hodges & Tucker (2011), predicting a pain-related intra- and intermuscular activity redistribution. The results of the present thesis, which is the first to investigate LBP patients longitudinally during an acute pain episode and after remission of pain in a dynamic setting, show a significant effect of LBP on the neuromuscular efficiency of the trunk. Consequently, the SAR protocol may be used as a biomechanical tool to diagnostically analyse neuromuscular efficiency of LBP patients and to monitor their progress during rehabilitation (Renkawitz et al., 2008). The gradual increase of normalized EMG activation of agonistic extensor muscles found in the investigations of this thesis, from healthy males to females over to LBP patients in remission of pain and during an acute pain episode, indicate the availability of reference values that may characterize an ‘optimal’ range of neuromuscular efficiency of lower back muscles. Taken together with the insights 96
on abdominal co-activation and synergistic distribution of extensor activation, the current findings have the potential to contribute to the biomechanical understanding of physiologic and pathophysiologic trunk muscle recruitment pattern and overuse mechanisms. However, further research is needed to distinguish the grade of impairment of neuromuscular efficiency in LBP subgroups, e.g. between first onset and chronic LBP patients, because a trade-off between short-term benefits and long-term effects of the altered trunk muscle control is likely. Furthermore, the relatively linear relationship of strength and activation, especially during moderate submaximal isokinetic trunk extensions, raises the question of whether a similar protocol may be beneficial in patients who cannot perform with maximum effort, e.g. if the acute LBP level is too high or if structural impairments do not permit it.
97
REFERENCES Abenhaim, L., & Suissa, S. (1987). Importance and economic burden of occupational back pain: a study of 2,500 cases representative of Quebec. Journal of Occupational Medicine. : Official Publication of the Industrial Medical Association, 29(8), 670–4. Addison, R., & Schultz, A. (1976). Trunk strengths in patients seeking hospitalization for chronic low-back disorders. Spine, 5(6), 539–44. Adrian, E. D., & Bronk, D. W. (1929). The discharge of impulses in motor nerve fibres: Part II. The frequency of discharge in reflex and voluntary contractions. The Journal of Physiology, 67(2), i3–151. Ahern, D. K., Follick, M. J., Council, J. R., Laser-Wolston, N., & Litchman, H. (1988). Comparison of lumbar paravertebral EMG patterns in chronic low back pain patients and non-patient controls. Pain, 34(2), 153–60. Airaksinen, O., Brox, J. I., Cedraschi, C., Hildebrandt, J., Klaber-Moffett, J., Kovacs, F., … Zanoli, G. (2006). Chapter 4. European guidelines for the management of chronic nonspecific low back pain. European Spine Journal : Official Publication of the European Spine Society, the European Spinal Deformity Society, and the European Section of the Cervical Spine Research Society, 15 Suppl 2, S192– 300. Alston, W., Carlson, K. E., Feldman, D. J., Grimm, Z., & Gerontinos, E. (1966). A quantitative study of muscle factors in the chronic low back syndrome. Journal of the American Geriatrics Society, 14(10), 1041–7. Andersson, E., Swärd, L., & Thorstensson, A. (1988). Trunk muscle strength in athletes. Medicine and Science in Sports and Exercise, 20(6), 587–93. Andersson, G. B. (1997). The epidemiology of spinal disorders. In J. W. Frymoyer (Ed.), The adult spine: principles and practice (2nd ed., pp. 93–141). New York: Raven Press. Andersson, G. B. (1999). Epidemiological features of chronic low-back pain. Lancet, 354(9178), 581–585. Andersson, G. B., Ortengren, R., & Herberts, P. (1977). Quantitative electromyographic studies of back muscle activity relatated to posture and loading. The Orthopedic Clinics of North America, 8(1), 85–96. Andersson, G. B., Svensson, H. O., & Odén, A. (1983). The intensity of work recovery in low back pain. Spine, 8(8), 880–4. Arabadzhiev, T. I., Dimitrov, V. G., Dimitrova, N. a., & Dimitrov, G. V. (2010). Interpretation of EMG integral or RMS and estimates of “neuromuscular efficiency” can be misleading in fatiguing contraction. Journal of Electromyography and Kinesiology, 20(2), 223– 232. Atkinson, G., & Nevill, A. M. (1998). Statistical methods for assessing measurement error (reliability) in variables relevant to sports medicine. Sports Medicine (Auckland, N.Z.), 26(4), 217–38. Ayers, S., & Pollock, M. L. (1999). Isometric dynamometry. In D. E. Stude (Ed.), Spinal Rehabilitation (pp. 339–367). Stamford: Appleton & Lange. Balagué, F., Bibbo, E., Mélot, C., Szpalski, M., Gunzburg, R., & Keller, T. S. (2010). The association between isoinertial trunk muscle performance and low back pain in male adolescents. European Spine Journal : Official Publication of the European Spine Society, the European Spinal Deformity Society, and the European Section of the Cervical Spine Research Society, 19(4), 624–32. Balagué, F., Damidot, P., Nordin, M., Parnianpour, M., & Waldburger, M. (1993). Cross-sectional study of the isokinetic muscle trunk strength among school children. Spine, 18(9), 1199–205. Baltzopoulos, V., & Brodie, D. A. (1989). Isokinetic dynamometry. Applications and limitations. Sports Medicine (Auckland, N.Z.), 8(2), 101– 16. Baltzopoulos, V., Williams, J. G., & Brodie, D. A. (1991). Sources of error in isokinetic dynamometry: effects of visual feedback on maximum torque. The Journal of Orthopaedic and Sports Physical Therapy, 13(3), 138–142. Bardis, C., Kalamara, E., Loucaides, G., Michaelides, M., & Tsaklis, P. (2004). Intramachine and intermachine reproducibility of concentric performance: A study of the Con-Trex MJ and the Cybex Norm dynamometers. Isokinetics and Exercise Science, 12(2), 91–97. Baur, H., Müller, S., Pilz, F., Mayer, P., & Mayer, F. (2010). Trunk extensor and flexor strength of long-distance race car drivers and physically active controls. Journal of Sports Sciences, 28(11), 1183–7. Biering-Sørensen, F. (1983). A prospective study of low back pain in a general population. I. Occurrence, recurrence and aetiology. Scandinavian Journal of Rehabilitation Medicine, 15(2), 71–9. Biering-Sørensen, F. (1984). Physical measurements as risk indicators for low-back trouble over a one-year period. Spine, 9(2), 106–19. Bigland, B., & Lippold, O. C. (1954). Motor unit activity in the voluntary contraction of human muscle. The Journal of Physiology, 125(2), 322–35. Bigland, B., & Lippold, O. C. (1954). The relation between force, velocity and integrated electrical activity in human muscles. The Journal of Physiology, 123(1), 214–224.
98
Bijur, P. E., Silver, W., & Gallagher, E. J. (2001). Reliability of the visual analog scale for measurement of acute pain. Academic Emergency Medicine : Official Journal of the Society for Academic Emergency Medicine, 8(12), 1153–1157. Bilodeau, M., Arsenault, A. B., Gravel, D., & Bourbonnais, D. (1992). Time and frequency analysis of EMG signals of homologous elbow flexors and extensors. Medical & Biological Engineering & Computing, 30(6), 640–4. Blacker, S. D., Fallowfield, J. L., Bilzon, J. L. J., & Willems, M. E. T. (2010). Within-day and between-days reproducibility of isokinetic parameters of knee, trunk and shoulder movements. ISOKINETICS AND EXERCISE SCIENCE, 18(1), 45–55. Bland, J. M., & Altman, D. G. (1986). Statistical methods for assessing agreement between two methods of clinical measurement. Lancet, 1(8476), 307–10. Boccia, G., & Rainoldi, A. (2014). Innervation zones location and optimal electrodes position of obliquus internus and obliquus externus abdominis muscles. Journal of Electromyography and Kinesiology : Official Journal of the International Society of Electrophysiological Kinesiology, 24(1), 25–30. Borg, G. (1970). Perceived exertion as an indicator of somatic stress. Scandinavian Journal of Rehabilitation Medicine, 2(2), 92–8. Borg, G. (1982). Psychophysical bases of perceived exertion. Medicine and Science in Sports and Exercise, 14(5), 377–381. Borghuis, J., Hof, A. L., & Lemmink, K. a P. M. (2008). The importance of sensory-motor control in providing core stability: Implications for measurement and training. Sports Medicine, 38(11), 893–916. Bouter, L. M., Pennick, V., & Bombardier, C. (2003). Cochrane back review group. Spine, 28(12), 1215–8. Brown, S. H. M., & McGill, S. M. (2008). Co-activation alters the linear versus non-linear impression of the EMG-torque relationship of trunk muscles. Journal of Biomechanics, 41(3), 491–7. Burden, A. (2010). How should we normalize electromyograms obtained from healthy participants? What we have learned from over 25 years of research. Journal of Electromyography and Kinesiology : Official Journal of the International Society of Electrophysiological Kinesiology, 20(6), 1023–35. Burden, A., & Bartlett, R. (1999). Normalisation of EMG amplitude: an evaluation and comparison of old and new methods. Medical Engineering & Physics, 21(4), 247–57. Burden, A., Trew, M., & Baltzopoulos, V. (2003). Normalisation of gait EMGs: a re-examination. Journal of Electromyography and Kinesiology, 13(6), 519–532. Burton, A. K., Balagué, F., Cardon, G., Eriksen, H. R., Henrotin, Y., Lahad, A., … Van der Beek, A. J. (2006). Chapter 2. European guidelines for prevention in low back pain : November 2004. European Spine Journal : Official Publication of the European Spine Society, the European Spinal Deformity Society, and the European Section of the Cervical Spine Research Society, 15 Suppl 2, S136–68. Butler, H. L., Larivière, C., Hubley-Kozey, C. L., & Sullivan, M. J. L. (2010). Directed attention alters the temporal activation patterns of back extensors during trunk flexion-extension in individuals with chronic low back pain. European Spine Journal : Official Publication of the European Spine Society, the European Spinal Deformity Society, and the European Section of the Cervical Spine Research Society, 19(9), 1508–16. Campenella, B., Mattacola, C. G., & Kimura, I. F. (2000). Effect of visual feedback and verbal encouragement on concentric quadriceps and hamstrings peak torque of males and females. Isokinetics and Exercise Science, 8(1), 1–6. Carey, T. S., Garrett, J. M., Jackman, A., & Hadler, N. (1999). Recurrence and care seeking after acute back pain: results of a long-term follow-up study. North Carolina Back Pain Project. Medical Care, 37(2), 157–64. Caruso, J. F., Brown, L. E., & Tufano, J. J. (2012). The reproducibility of isokinetic dynamometry data. Isokinetics and Exercise Science, 20, 239–253. Carvalho, H. M., Coelho e Silva, M. J., Vaz Ronque, E. R., Gonçalves, R. S., Philippaerts, R. M., & Malina, R. M. (2011). Assessment of reliability in isokinetic testing among adolescent basketball players. Medicina (KAunas), 47(8), 446–452. Casazza, B. A. (2012). Diagnosis and treatment of acute low back pain. American Family Physician, 85(4), 343–50. Castaingts, V., Martin, A., Van Hoecke, J., & Pérot, C. (2004). Neuromuscular Efficiency of the Triceps Surae in Induced and Voluntary Contractions: Morning and Evening Evaluations. Chronobiology International, 21(4-5), 631–643. Cavanaugh, J. M., Ozaktay, A. C., Yamashita, T., Avramov, A., Getchell, T. V, & King, A. I. (1997). Mechanisms of low back pain: a neurophysiologic and neuroanatomic study. Clinical Orthopaedics and Related Research, (335), 166–80. Childs, J. D., Piva, S. R., & Fritz, J. M. (2005). Responsiveness of the numeric pain rating scale in patients with low back pain. Spine, 30(11), 1331–1334. Cholewicki, J., Greene, H. S., Polzhofer, G. K., Galloway, M. T., Shah, R. A., & Radebold, A. (2002). Neuromuscular function in athletes following recovery from a recent acute low back injury. The Journal of Orthopaedic and Sports Physical Therapy, 32(11), 568–75. Cholewicki, J., & McGill, S. M. (1996). Mechanical stability of the in vivo lumbar spine: Implications for injury and chronic low back pain. Clinical Biomechanics, 11(1), 1–15. Cholewicki, J., Panjabi, M. M., & Khachatryan, A. (1997). Stabilizing function of trunk flexor-extensor muscles around a neutral spine posture. Spine, 22(19), 2207–2212.
99
Cholewicki, J., Simons, A. P., & Radebold, A. (2000). Effects of external trunk loads on lumbar spine stability. Journal of Biomechanics, 33(11), 1377–85. Clancy, E. A., Bouchard, S., & Rancourt, D. (2001). Estimation and application of EMG amplitude during dynamic contractions. IEEE Engineering in Medicine and Biology Magazine : The Quarterly Magazine of the Engineering in Medicine & Biology Society, 20(6), 47–54. Croft, P. R., Macfarlane, G. J., Papageorgiou, A. C., Thomas, E., & Silman, A. J. (1998). Outcome of low back pain in general practice: a prospective study. BMJ (Clinical Research Ed.), 316(7141), 1356–9. Crosbie, J., Nascimento, D. P., Filho, R. D. F. N., & Ferreira, P. (2013). Do people with recurrent back pain constrain spinal motion during seated horizontal and downward reaching? Clinical Biomechanics, 28(8), 866–872. D’hooge, R., Hodges, P. W., Tsao, H., Hall, L., Macdonald, D., & Danneels, L. A. (2013). Altered trunk muscle coordination during rapid trunk flexion in people in remission of recurrent low back pain. Journal of Electromyography and Kinesiology : Official Journal of the International Society of Electrophysiological Kinesiology, 23(1), 173–81. Dankaerts, W., O’Sullivan, P. B., Burnett, A. F., Straker, L. M., & Danneels, L. A. (2004). Reliability of EMG measurements for trunk muscles during maximal and sub-maximal voluntary isometric contractions in healthy controls and CLBP patients. Journal of Electromyography and Kinesiology : Official Journal of the International Society of Electrophysiological Kinesiology, 14(3), 333–42. Danneels, L. A., Coorevits, P. L., Cools, A. M., Vanderstraeten, G. G., Cambier, D. C., Witvrouw, E. E., & De, C. H. J. (2002). Differences in electromyographic activity in the multifidus muscle and the iliocostalis lumborum between healthy subjects and patients with subacute and chronic low back pain. European Spine Journal : Official Publication of the European Spine Society, the European Spinal Deformity Society, and the European Section of the Cervical Spine Research Society, 11(1), 13–9. Danneels, L. A., Vanderstraeten, G. G., Cambier, D. C., Witvrouw, E. E., & De Cuyper, H. J. (2000). CT imaging of trunk muscles in chronic low back pain patients and healthy control subjects. European Spine Journal : Official Publication of the European Spine Society, the European Spinal Deformity Society, and the European Section of the Cervical Spine Research Society, 9(4), 266–72. David, P., Mora, I., & Pérot, C. (2008). Neuromuscular efficiency of the rectus abdominis differs with gender and sport practice. Journal of Strength and Conditioning Research / National Strength & Conditioning Association, 22(6), 1855–61. Davis, K. G., & Marras, W. S. (2000). The effects of motion on trunk biomechanics. Clinical Biomechanics (Bristol, Avon), 15(10), 703–17. De Luca, C. J. (1993). Use of the surface EMG signal for performance evaluation of back muscles. Muscle & Nerve, 16(2), 210–6. De Luca, C. J. (1997). The use of surface electromyography in biomechanics. Journal of Applied Biomechanics, 13, 135–163. De Vet, H. C. W., Heymans, M. W., Dunn, K. M., Pope, D. P., Van der Beek, A. J., Macfarlane, G. J., … Croft, P. R. (2002). Episodes of low back pain: a proposal for uniform definitions to be used in research. Spine, 27(21), 2409–16. DeLoach, L. J., Higgins, M. S., Caplan, A. B., & Stiff, J. L. (1998). The visual analog scale in the immediate postoperative period: intrasubject variability and correlation with a numeric scale. Anesthesia and Analgesia, 86(1), 102–106. Den Hartog, D., Eker, H. H., Tuinebreijer, W. E., Kleinrensink, G. J., Stam, H. J., & Lange, J. F. (2010). Isokinetic strength of the trunk flexor muscles after surgical repair for incisional hernia. Hernia : The Journal of Hernias and Abdominal Wall Surgery, 14(3), 243–7. Dervisevic, E., Hadzic, V., & Burger, H. (2007). Reproducibility of trunk isokinetic strength findings in healthy individuals. Isokinetics and Exercise Science, 15(2), 99–109. DeVries, H. A. (1968a). “Efficiency of electrical activity” as a physiological measure of the functional state of muscle tissue. American Journal of Physical Medicine, 47(1), 10–22. DeVries, H. A. (1968b). EMG fatigue curves in postural muscles. A possible etiology for idiopathic low back pain. American Journal of Physical Medicine, 47(4), 175–81. Deyo, R. A., & Diehl, A. K. (1986). Patient satisfaction with medical care for low-back pain. Spine, 11(1), 28–30. Downie, W. W., Leatham, P. A., Rhind, V. M., Wright, V., Branco, J. A., & Anderson, J. A. (1978). Studies with pain rating scales. Annals of the Rheumatic Diseases, 37(4), 378–381. Dvir, Z., & Keating, J. L. (2003). Trunk extension effort in patients with chronic low back dysfunction. Spine, 28(7), 685–92. Ebenbichler, G. R., Oddsson, L. I., Kollmitzer, J., & Erim, Z. (2001). Sensory-motor control of the lower back: implications for rehabilitation. Medicine and Science in Sports and Exercise, 33(11), 1889–98. Edwards, R. G., & Lippold, O. C. (1956). The relation between force and integrated electrical activity in fatigued muscle. The Journal of Physiology, 132(3), 677–681. Elfving, B., Németh, G., Arvidsson, I., & Lamontagne, M. (1999). Reliability of EMG spectral parameters in repeated measurements of back muscle fatigue. Journal of Electromyography and Kinesiology : Official Journal of the International Society of Electrophysiological Kinesiology, 9(4), 235–43. Esola, M. A., McClure, P. W., Fitzgerald, G. K., & Siegler, S. (1996). Analysis of lumbar spine and hip motion during forward bending in subjects with and without a history of low back pain. Spine, 21(1), 71–78. Evans, J. D. (1995). Straightforward Statistics for the Behavioral Sciences. Pacific Grove, CA: Brooks Cole Publishing Company.
100
Fairbank, J., Gwilym, S. E., France, J. C., Daffner, S. D., Dettori, J., Hermsmeyer, J., & Andersson, G. (2011). The role of classification of chronic low back pain. Spine, 36(21 Suppl), S19–42. Farina, D., Gazzoni, M., & Merletti, R. (2003). Assessment of low back muscle fatigue by surface EMG signal analysis: methodological aspects. Journal of Electromyography and Kinesiology, 13(4), 319–332. Feldman, D. E., Shrier, I., Rossignol, M., & Abenhaim, L. (2001). Risk factors for the development of low back pain in adolescence. American Journal of Epidemiology, 154(1), 30–6. Fischer, A., Merhautova, J., Joachimsthaler, F., & Sukop, J. (1959). [Studies on muscular coordination and on its changes following exercise and fatigue in work and athletic performance]. Ceskoslovenská Fysiologie / Ústrední ústav Biologický, 8(3), 187. Flor, H., & Turk, D. C. (1984). Etiological theories and treatments for chronic back pain. I. Somatic models and interventions. Pain, 19(2), 105–21. Frymoyer, J. W., Pope, M. H., Clements, J. H., Wilder, D. G., MacPherson, B., & Ashikaga, T. (1983). Risk factors in low-back pain. An epidemiological survey. The Journal of Bone and Joint Surgery. American Volume, 65(2), 213–8. Fuglsang-Frederiksen, a, & Månsson, a. (1975). Analysis of electrical activity of normal muscle in man at different degrees of voluntary effort. Journal of Neurology, Neurosurgery, and Psychiatry, 38(Table 1), 683–694. Gallagher, K. M., Nelson-Wong, E., & Callaghan, J. P. (2011). Do individuals who develop transient low back pain exhibit different postural changes than non-pain developers during prolonged standing? Gait & Posture, 34(4), 490–495. Gauthier, A., Davenne, D., Martin, A., Cometti, G., & Van Hoecke, J. (1996). Diurnal rhythm of the muscular performance of elbow flexors during isometric contractions. Chronobiology International, 13(2), 135–46. Geisser, M. E., Ranavaya, M., Haig, A. J., Roth, R. S., Zucker, R., Ambroz, C., & Caruso, M. (2005). A meta-analytic review of surface electromyography among persons with low back pain and normal, healthy controls. The Journal of Pain : Official Journal of the American Pain Society, 6(11), 711–26. Gleeson, N. P., & Mercer, T. H. (1992). Reproducibility of isokinetic leg strength and endurance characteristics of adult men and women. European Journal of Applied Physiology and Occupational Physiology, 65(3), 221–8. Gleeson, N. P., & Mercer, T. H. (1996). The utility of isokinetic dynamometry in the assessment of human muscle function. Sports Medicine (Auckland, N.Z.), 21(1), 18–34. Gottlieb, G. L., & Agarwal, G. C. (1971). Dynamic relationship between isometric muscle tension and the electromyogram in man. Journal of Applied Physiology, 30(3), 345–51. Grabiner, M. D., & Jeziorowski, J. J. (1992). Isokinetic trunk extension discriminates uninjured subjects from subjects with previous low back pain. Clinical Biomechanics (Bristol, Avon), 7(4), 195–200. Grabiner, M. D., Jeziorowski, J. J., & Divekar, A. D. (1990). Isokinetic measurements of trunk extension and flexion performance collected with the biodex clinical data station. The Journal of Orthopaedic and Sports Physical Therapy, 11(12), 590–8. Grabiner, M. D., Koh, T. J., & El Ghazawi, A. (1992). Decoupling of bilateral paraspinal excitation in subjects with low back pain. Spine, 17(10), 1219–23. Granata, K. P., & Marras, W. S. (1995). The influence of trunk muscle coactivity on dynamic spinal loads. Spine, 20(8), 913–9. Granata, K. P., & Marras, W. S. (2000). Cost-benefit of muscle cocontraction in protecting against spinal instability. Spine, 25(11), 1398– 404. Granata, K. P., & Orishimo, K. F. (2001). Response of trunk muscle coactivation to changes in spinal stability. Journal of Biomechanics, 34(9), 1117–1123. Guilhem, G., Giroux, C., Couturier, A., & Maffiuletti, N. a. (2014). Validity of trunk extensor and flexor torque measurements using isokinetic dynamometry. Journal of Electromyography and Kinesiology : Official Journal of the International Society of Electrophysiological Kinesiology, 24, 986–993. Hägg, O., Fritzell, P., & Nordwall, A. (2003). The clinical importance of changes in outcome scores after treatment for chronic low back pain. European Spine Journal : Official Publication of the European Spine Society, the European Spinal Deformity Society, and the European Section of the Cervical Spine Research Society, 12(1), 12–20. Hall, H., McIntosh, G., & Boyle, C. (2009). Effectiveness of a low back pain classification system. Spine Journal, 9(8), 648–657. Hashemi, L., Webster, B. S., Clancy, E. A., & Volinn, E. (1997). Length of disability and cost of workers’ compensation low back pain claims. Journal of Occupational and Environmental Medicine / American College of Occupational and Environmental Medicine, 39(10), 937– 45. Henschke, N., Ostelo, R. W., Van Tulder, M. W., Vlaeyen, J. W. S., Morley, S., Assendelft, W. J., & Main, C. J. (2010). Behavioural treatment for chronic low-back pain. The Cochrane Database of Systematic Reviews, (7), CD002014. Hermann, K. M., & Barnes, W. S. (2001). Effects of eccentric exercise on trunk extensor torque and lumbar paraspinal EMG. Medicine and Science in Sports and Exercise, 33(6), 971–7.
101
Hermens, H. J., Freriks, B., Disselhorst-Klug, C., & Rau, G. (2000). Development of recommendations for SEMG sensors and sensor placement procedures. Journal of Electromyography and Kinesiology : Official Journal of the International Society of Electrophysiological Kinesiology, 10(5), 361–74. Hestbaek, L., Leboeuf-Yde, C., & Manniche, C. (2003). Low back pain: what is the long-term course? A review of studies of general patient populations. European Spine Journal : Official Publication of the European Spine Society, the European Spinal Deformity Society, and the European Section of the Cervical Spine Research Society, 12(2), 149–165. Hirschmüller, A., Baur, H., Müller, S., & Mayer, F. (2005). Quantifizierung der Kraftfähigkeiten und der neuromuskulären Effizienz bei Gesunden und Läufern mit chronischen Achillessehnenbeschwerden. Deutsche Zeitschrift Für Sportmedizin, 56(2), 39–44. Hodges, P. W., & Richardson, C. A. (1996). Inefficient muscular stabilization of the lumbar spine associated with low back pain. A motor control evaluation of transversus abdominis. Spine, 21(22), 2640–50. Hodges, P. W., & Tucker, K. (2011). Moving differently in pain: a new theory to explain the adaptation to pain. Pain, 152(3 Suppl), S90–8. Hof, A. L. (1997). The relationship between electromyogram and muscle force. Sportverletzung Sportschaden : Organ Der Gesellschaft Für Orthopädisch-Traumatologische Sportmedizin, 11(3), 79–86. Hong, J., Reed, C., Novick, D., & Happich, M. (2013). Costs associated with treatment of chronic low back pain: an analysis of the UK General Practice Research Database. Spine, 38(1), 75–82. Hopkins, W. G. (2000). Measures of reliability in sports medicine and science. Sports Medicine (Auckland, N.Z.), 30(1), 1–15. Hoy, D., Bain, C., Williams, G., March, L., Brooks, P., Blyth, F., … Buchbinder, R. (2012). A systematic review of the global prevalence of low back pain. Arthritis and Rheumatism, 64(6), 2028–37. Hoy, D., March, L., Brooks, P., Blyth, F., Woolf, A. D., Bain, C., … Buchbinder, R. (2014). The global burden of low back pain: estimates from the Global Burden of Disease 2010 study. Annals of the Rheumatic Diseases, 73(6), 968–974. Hoy, D., March, L., Brooks, P., Woolf, A. D., Blyth, F., Vos, T., & Buchbinder, R. (2010). Measuring the global burden of low back pain. Best Practice and Research: Clinical Rheumatology, 24(2), 155–165. Hultman, G., Nordin, M., Saraste, H., & Ohlsèn, H. (1993). Body composition, endurance, strength, cross-sectional area, and density of MM erector spinae in men with and without low back pain. Journal of Spinal Disorders, 6(2), 114–23. Humer, M., Kösters, A., & Müller, E. (2011). Dynamische und statische Maximalkraft in der geschlossenen Kette bei Rumpfflexion/extension und Rumpfrotation. Sportverletzung · Sportschaden, 25(01), 13–21. Hupli, M., Sainio, P., Hurri, H., & Alaranta, H. (1997). Comparison of trunk strength measurements between two different isokinetic devices used at clinical settings. Journal of Spinal Disorders, 10(5), 391–7. Huskisson, E. C. (1974). Measurement of pain. Lancet (London, England), 2(7889), 1127–31. Hutten, M. M. R., & Hermens, H. J. (1997). Reliability of lumbar dynamometry measurements in patients with chronic low back pain with test-retest measurements on different days. European Spine Journal, 6(1), 54–62. Hutten, M. M. R., & Hermens, H. J. (1998). Relationships between isoinertial lumbar dynamometry parameters and demographic parameters in chronic low back pain patients. European Spine Journal : Official Publication of the European Spine Society, the European Spinal Deformity Society, and the European Section of the Cervical Spine Research Society, 7(6), 454–60. Jacobs, J. V, Henry, S. M., Jones, S. L., Hitt, J. R., & Bunn, J. Y. (2011). A history of low back pain associates with altered electromyographic activation patterns in response to perturbations of standing balance. Journal of Neurophysiology, 106(5), 2506–14. Jäger, M., & Luttmann, A. (1991). Compressive strength of lumbar spine elements related to age, gender, and other influencing factors. In P. A. Anderson (Ed.), Electromyographical kinesiology (pp. 291–4). Baltimore: Elsevier. Janda, V. (1978). Muscles, Central Nervous Regulation and Back Problems. In I. M. Korr (Ed.), The Neurobiologic Mechanisms in Manipulative Therapy (pp. 27–42). New York: Plenum Press. Jansson, C., Mittendorfer-Rutz, E., & Alexanderson, K. (2012). Sickness absence because of musculoskeletal diagnoses and risk of all-cause and cause-specific mortality: a nationwide Swedish cohort study. Pain, 153(5), 998–1005. Jayasinghe, W. J., Harding, R. H., Anderson, J. A., & Sweetman, B. J. (1978). An electromyographic investigation of postural fatigue in low back pain--a preliminary study. Electromyography and Clinical Neurophysiology, 18(3-4), 191–8. Jensen, M. C., Brant-Zawadzki, M. N., Obuchowski, N., Modic, M. T., Malkasian, D., & Ross, J. S. (1994). Magnetic resonance imaging of the lumbar spine in people without back pain. The New England Journal of Medicine, 331(2), 69–73. Johansson, H., & Sojka, P. (1991). Pathophysiological mechanisms involved in genesis and spread of muscular tension in occupational muscle pain and in chronic musculoskeletal pain syndromes: a hypothesis. Medical Hypotheses, 35(3), 196–203. Jones, S. L., Henry, S. M., Raasch, C. C., Hitt, J. R., & Bunn, J. Y. (2012). Individuals with non-specific low back pain use a trunk stiffening strategy to maintain upright posture. Journal of Electromyography and Kinesiology : Official Journal of the International Society of Electrophysiological Kinesiology, 22(1), 13–20. Jørgensen, K., & Nicolaisen, T. (1987). Trunk extensor endurance: determination and relation to low-back trouble. Ergonomics, 30(2), 259– 67.
102
Kallenberg, L. a C., & Hermens, H. J. (2006). Motor unit action potential rate and motor unit action potential shape properties in subjects with work-related chronic pain. European Journal of Applied Physiology, 96(2), 203–8. Kannus, P. (1994). Isokinetic evaluation of muscular performance: implications for muscle testing and rehabilitation. International Journal of Sports Medicine, 15 Suppl 1, S11–8. Kellis, E., & Baltzopoulos, V. (1996). The effects of normalization method on antagonistic activity patterns during eccentric and concentric isokinetic knee extension and flexion. Journal of Electromyography and Kinesiology : Official Journal of the International Society of Electrophysiological Kinesiology, 6(4), 235–45. Kellis, E., & Katis, A. (2007). Quantification of functional knee flexor to extensor moment ratio using isokinetics and electromyography. Journal of Athletic Training, 42(4), 477–85. Kelly, A. M. (1998). Does the clinically significant difference in visual analog scale pain scores vary with gender, age, or cause of pain? Academic Emergency Medicine : Official Journal of the Society for Academic Emergency Medicine, 5(11), 1086–1090. Kent, P. M., & Keating, J. L. (2004). Do primary-care clinicians think that nonspecific low back pain is one condition? Spine, 29(9), 1022–31. Kent, P. M., & Keating, J. L. (2005). The epidemiology of low back pain in primary care. Chiropractic & Osteopathy, 13, 13. Klasen, B. W., Hallner, D., Schaub, C., Willburger, R., & Hasenbring, M. (2004). Validation and reliability of the German version of the Chronic Pain Grade questionnaire in primary care back pain patients. Psycho-Social Medicine, 1, Doc07. Koes, B. W., Van Tulder, M. W., & Thomas, S. (2006). Diagnosis and treatment of low back pain. BMJ (Clinical Research Ed.), 332(7555), 1430–1434. Komi, P. V, & Karlsson, J. (1978). Skeletal muscle fibre types, enzyme activities and physical performance in young males and females. Acta Physiologica Scandinavica, 103(2), 210–8. Kondraske, G. V, Deivanayagam, S., Carmichael, T., Mayer, T. G., & Mooney, V. (1987). Myoelectric spectral analysis and strategies for quantifying trunk muscular fatigue. Archives of Physical Medicine and Rehabilitation, 68(2), 103–10. König, N., Reschke, A., Wolter, M., Müller, S., Mayer, F., & Baur, H. (2013). Plantar pressure trigger for reliable nerve stimulus application during dynamic H-reflex measurements. Gait & Posture, 37(4), 637–9. Kubo, T., Hoshikawa, Y., Muramatsu, M., Iida, T., Komori, S., Shibukawa, K., & Kanehisa, H. (2011). Contribution of trunk muscularity on sprint run. International Journal of Sports Medicine, 32(3), 223–8. Kumar, S. (1990). Cumulative load as a risk factor for back pain. Spine. Langrana, N. A., & Lee, C. K. (1984). Isokinetic evaluation of trunk muscles. Spine, 9(2), 171–5. Langrana, N. A., Lee, C. K., Alexander, H., & Mayott, C. W. (1984). Quantitative assessment of back strength using isokinetic testing. Spine, 9(3), 287–90. Larivière, C., & Arsenault, A. B. (2008). On the use of EMG-ratios to assess the coordination of back muscles. Clinical Biomechanics (Bristol, Avon), 23(10), 1209–19. Larivière, C., Arsenault, A. B., Gravel, D., Gagnon, D., & Loisel, P. (2002). Evaluation of measurement strategies to increase the reliability of EMG indices to assess back muscle fatigue and recovery. Journal of Electromyography and Kinesiology, 12(2), 91–102. Larivière, C., Arsenault, A. B., Gravel, D., Gagnon, D., & Loisel, P. (2003). Surface electromyography assessment of back muscle intrinsic properties. Journal of Electromyography and Kinesiology, 13(4), 305–318. Larivière, C., Gagnon, D., Arsenault, A. B., Gravel, D., & Loisel, P. (2005). Electromyographic activity imbalances between contralateral back muscles: An assessment of measurement properties. Journal of Rehabilitation Research and Development, 42(2), 235–50. Larivière, C., Gagnon, D., Gravel, D., & Bertrand Arsenault, A. (2008). The assessment of back muscle capacity using intermittent static contractions. Part I - Validity and reliability of electromyographic indices of fatigue. Journal of Electromyography and Kinesiology : Official Journal of the International Society of Electrophysiological Kinesiology, 18(6), 1006–19. Larivière, C., Gagnon, D., & Loisel, P. (2000a). An application of pattern recognition for the comparison of trunk muscles EMG waveforms between subjects with and without chronic low back pain during flexion-extension and lateral bending tasks. Journal of Electromyography and Kinesiology, 10(4), 261–273. Larivière, C., Gagnon, D., & Loisel, P. (2000b). The comparison of trunk muscles EMG activation between subjects with and without chronic low back pain during flexion-extension and lateral bending tasks. Journal of Electromyography and Kinesiology, 10(2), 79–91. Lee, H. J., Lim, W. H., Park, J.-W., Kwon, B. S., Ryu, K. H., Lee, J. H., & Park, Y. G. (2012). The Relationship between Cross Sectional Area and Strength of Back Muscles in Patients with Chronic Low Back Pain. Annals of Rehabilitation Medicine, 36(2), 173–81. Lee, J. H., Hoshino, Y., Nakamura, K., Kariya, Y., Saita, K., & Ito, K. (1999). Trunk muscle weakness as a risk factor for low back pain. A 5-year prospective study. Spine, 24(1), 54–7. Lehman, G. J., & McGill, S. M. (1999). The importance of normalization in the interpretation of surface electromyography: a proof of principle. Journal of Manipulative and Physiological Therapeutics, 22(7), 444–6.
103
Leino, P., Aro, S., & Hasan, J. (1987). Trunk muscle function and low back disorders: a ten-year follow-up study. Journal of Chronic Diseases, 40(4), 289–96. Lenman, J. a R. (1959). a Clinical and Experimental Study of the Effects of Exercise on Motor Weakness in Neurological Disease. Jnnp, 22, 182–194. Lexell, J. E., & Downham, D. Y. (2005). How to assess the reliability of measurements in rehabilitation. American Journal of Physical Medicine & Rehabilitation / Association of Academic Physiatrists, 84(9), 719–23. Lindeman, E., Spaans, F., Reulen, J. P., Leffers, P., & Drukker, J. (1999). Surface EMG of proximal leg muscles in neuromuscular patients and in healthy controls. Relations to force and fatigue. Journal of Electromyography and Kinesiology : Official Journal of the International Society of Electrophysiological Kinesiology, 9(5), 299–307. Linton, S. J., & Halldén, K. (1998). Can we screen for problematic back pain? A screening questionnaire for predicting outcome in acute and subacute back pain. The Clinical Journal of Pain, 14(3), 209–15. Lippold, O. C. J. (1952). The relation between integrated action potentials in a human muscle and its isometric tension. The Journal of Physiology, 117(4), 492–9. Lund, H., Søndergaard, K., Zachariassen, T., Christensen, R., Bülow, P., Henriksen, M., … Bliddal, H. (2005). Learning effect of isokinetic measurements in healthy subjects, and reliability and comparability of Biodex and Lido dynamometers. Clinical Physiology and Functional Imaging, 25(2), 75–82. Lund, J. P., Donga, R., Widmer, C. G., & Stohler, C. S. (1991). The pain-adaptation model: a discussion of the relationship between chronic musculoskeletal pain and motor activity. Canadian Journal of Physiology and Pharmacology, 69(5), 683–94. Luoto, S., Aalto, H., Taimela, S., Hurri, H., Pyykkö, I., & Alaranta, H. (1998). One-footed and externally disturbed two-footed postural control in patients with chronic low back pain and healthy control subjects. A controlled study with follow-up. Spine, 23(19), 2081– 9; discussion 2089–90. Luoto, S., Heliövaara, M., Hurri, H., & Alaranta, H. (1995). Static back endurance and the risk of low-back pain. Clinical Biomechanics, 10(6), 323–324. MacDonald, M. J., Sorock, G. S., Volinn, E., Hashemi, L., Clancy, E. A., & Webster, B. S. (1997). A descriptive study of recurrent low back pain claims. Journal of Occupational and Environmental Medicine / American College of Occupational and Environmental Medicine, 39(1), 35–43. Magnusson, M. L., Aleksiev, A. R., Wilder, D. G., Pope, M. H., Spratt, K., Lee, S. H., … Weinstein, J. N. (1996). European Spine Society--the AcroMed Prize for Spinal Research 1995. Unexpected load and asymmetric posture as etiologic factors in low back pain. European Spine Journal : Official Publication of the European Spine Society, the European Spinal Deformity Society, and the European Section of the Cervical Spine Research Society, 5(1), 23–35. Magora, A. (1972). Investigation of the relation between low back pain and occupation. 3. Physical requirements: sitting, standing and weight lifting. IMS, Industrial Medicine and Surgery, 41(12), 5–9. Maniadakis, N., & Gray, a. (2000). The economic burden of back pain in the UK. Pain, 84(1), 95–103. Mannion, A. F., Dolan, P., & Adams, M. A. (1996). Psychological questionnaires: do “abnormal” scores precede or follow first-time low back pain? Spine, 21(22), 2603–11. Mannion, A. F., Kaser, L., Weber, E., Rhyner, A., Dvorak, J., Muntener, M., … Müntener, M. (2000). Influence of age and duration of symptoms on fibre type distribution and size of the back muscles in chronic low back pain patients. European Spine Journal : Official Publication of the European Spine Society, the European Spinal Deformity Society, and the European Section of the Cervical Spine Research Society, 9(4), 273–81. Mannion, A. F., Weber, B. R., Dvorák, J., Grob, D., & Müntener, M. (1997). Fibre type characteristics of the lumbar paraspinal muscles in normal healthy subjects and in patients with low back pain. Journal of Orthopaedic Research : Official Publication of the Orthopaedic Research Society, 15, 881–887. Marras, W. S., Davis, K. G., & Jorgensen, M. (2003). Gender influences on spine loads during complex lifting. The Spine Journal : Official Journal of the North American Spine Society, 3(2), 93–99. Marras, W. S., King, A. I., & Joynt, R. L. (1984). Measurement of loads on the lumbar spine under isometric and isokinetic conditions. Spine, 9(2), 176–87. Marras, W. S., Lavender, S. A., Leurgans, S. E., Fathallah, F. A., Ferguson, S. A., Allread, W. G., & Rajulu, S. L. (1995). Biomechanical risk factors for occupationally related low back disorders. Ergonomics, 38(2), 377–410. Marshall, P. W. M., & Murphy, B. (2010). Delayed abdominal muscle onsets and self-report measures of pain and disability in chronic low back pain. Journal of Electromyography and Kinesiology, 20(5), 833–839. Mauchly, J. W. (1940). Significance Test for Sphericity of a Normal n-Variate Distribution. The Annals of Mathematical Statistics, 11(2), 204–209. Maul, I., Läubli, T., Oliveri, M., & Krueger, H. (2005). Long-term effects of supervised physical training in secondary prevention of low back pain. European Spine Journal, 14(6), 599–611.
104
Mayer, F., Baur, H., Hirschmuller, A., Heitkamp, H., Horstmann, T., & Dickhuth, H.-H. (2001). The quantification of reciprocal shoulder strength relation in various working modes at different movement velocities. Isokinetics and Exercise Science, 9(2-3), 73–77. Mayer, F., Horstmann, T., Kranenberg, U., Röcker, K., & Dickhuth, H.-H. (1994). Reproducibility of isokinetic peak torque and angle at peak torque in the shoulder joint. International Journal of Sports Medicine, 15 Suppl 1, S26–S31. Mayer, J. M., Graves, J. E., Clark, B. C., Formikell, M., & Ploutz-Snyder, L. L. (2005). The use of magnetic resonance imaging to evaluate lumbar muscle activity during trunk extension exercise at varying intensities. Spine, 30(22), 2556–63. McCormack, H. M., Horne, D. J., & Sheather, S. (1988). Clinical applications of visual analogue scales: a critical review. Psychological Medicine, 18(4), 1007–19. McGill, S. M. (1991). Electromyographic activity of the abdominal and low back musculature during the generation of isometric and dynamic axial trunk torque: implications for lumbar mechanics. Journal of Orthopaedic Research : Official Publication of the Orthopaedic Research Society, 9(1), 91–103. McIntosh, G., Hall, H., & Boyle, C. (2008, September). Outcomes Based on a Low Back Pain Classification System. The Spine Journal. McNeill, T., Warwick, D., Andersson, G., & Schultz, A. (1980). Trunk strengths in attempted flexion, extension, and lateral bending in healthy subjects and patients with low-back disorders. Spine, 5(6), 529–38. Miller, A. E., MacDougall, J. D., Tarnopolsky, M. A., & Sale, D. G. (1993). Gender differences in strength and muscle fiber characteristics. European Journal of Applied Physiology and Occupational Physiology, 66(3), 254–62. Miller, E. M., Slota, G. P., Agnew, M. J., & Madigan, M. L. (2010). Females exhibit shorter paraspinal reflex latencies than males in response to sudden trunk flexion perturbations. Clinical Biomechanics (Bristol, Avon), 25(6), 541–5. Milner-Brown, H. S., Mellenthin, M., & Miller, R. G. (1986). Quantifying human muscle strength, endurance and fatigue. Archives of Physical Medicine and Rehabilitation, 67(8), 530–5. Milner-Brown, H. S., & Stein, R. B. (1975). The relation between the surface electromyogram and muscular force. The Journal of Physiology, 246(3), 549–69. Mirka, G. A. (1991). The quantification of EMG normalization error. Ergonomics, 34(3), 343–352. Moreau, C. E., Green, B. N., Johnson, C. D., & Moreau, S. R. (2001). Isometric back extension endurance tests: a review of the literature. Journal of Manipulative and Physiological Therapeutics, 24(2), 110–22. Moritani, T., & deVries, H. A. (1978). Reexamination of the relationship between the surface integrated electromyogram (IEMG) and force of isometric contraction. American Journal of Physical Medicine, 57(6), 263–77. Moseley, G. L., & Hodges, P. W. (2006). Reduced variability of postural strategy prevents normalization of motor changes induced by back pain: a risk factor for chronic trouble? Behavioral Neuroscience, 120(2), 474–6. Müller, J., Müller, S., Stoll, J., Fröhlich, K., Baur, H., & Mayer, F. (2014). Reproducibility of maximum isokinetic trunk strength testing in healthy adolescent athletes. Sport-Orthopädie - Sport-Traumatologie - Sports Orthopaedics and Traumatology, 30(3), 229–237. Müller, S., Baur, H., König, T., Hirschmüller, A., & Mayer, F. (2007). Reproducibility of isokinetic single- and multi-joint strength measurements in healthy and injured athletes. Isokinetics and Exercise Science, 15(4), 295–302. Müller, S., Mayer, P., Baur, H., Müller, S., Mayer, P., Baur, H., & Mayer, F. (2011). Higher velocities in isokinetic dynamometry: A pilot study of new test mode with active compensation of inertia. Isokinetics and Exercise Science, 19(2), 63–70. Müller, S., Stoll, J., Müller, J., & Mayer, F. (2012). Validity of isokinetic trunk measurements with respect to healthy adults, athletes and low back pain patients. Isokinetics and Exercise Science, 20, 255–266. Murray, C. J. L., Atkinson, C., Bhalla, K., Birbeck, G., Burstein, R., Chou, D., … Murray. (2013). The state of US health, 1990-2010: burden of diseases, injuries, and risk factors. JAMA, 310(6), 591–608. Murray, C. J. L., Vos, T., Lozano, R., Naghavi, M., Flaxman, A. D., Michaud, C., … Memish, Z. A. (2012). Disability-adjusted life years (DALYs) for 291 diseases and injuries in 21 regions, 1990-2010: a systematic analysis for the Global Burden of Disease Study 2010. Lancet, 380(9859), 2197–223. Nachemson, A. (1985). Lumbar spine instability. A critical update and symposium summary. Spine, 10(3), 290–1. Nachemson, A., & Bigos, S. (1984). The low back. (J. Cruess & W. Rennie, Eds.). New York: Churchill-Livingstone: Adult Orthopaedics. Nachemson, A., & Lindh, M. (1969). Measurement of abdominal and back muscle strength with and without low back pain. Scandinavian Journal of Rehabilitation Medicine, 1(2), 60–3. Nachemson, A., Waddell, G., & Norlund, A. (2000). Epidemiology of neck and low back pain. In A. Nachemson & E. Jonsson (Eds.), Neck and back pain: The scientific evidence of causes, diagnosis and treatment (pp. 165–188). Philadelphia: Lippincott Williams & Wilkins. Nelson-Wong, E., Alex, B., Csepe, D., Lancaster, D., & Callaghan, J. P. (2012). Altered muscle recruitment during extension from trunk flexion in low back pain developers. Clinical Biomechanics, 27(10), 994–998.
105
Nelson-Wong, E., & Callaghan, J. P. (2010). Is muscle co-activation a predisposing factor for low back pain development during standing? A multifactorial approach for early identification of at-risk individuals. Journal of Electromyography and Kinesiology : Official Journal of the International Society of Electrophysiological Kinesiology, 20(2), 256–63. Nevill, A. M., & Atkinson, G. (1997). Assessing agreement between measurements recorded on a ratio scale in sports medicine and sports science. British Journal of Sports Medicine, 31(4), 314–318. Newton, M., Thow, M., Somerville, D., Henderson, I., & Waddell, G. (1993). Trunk strength testing with iso-machines. Part 2: Experimental evaluation of the Cybex II Back Testing System in normal subjects and patients with chronic low back pain. Spine, 18(7), 812–24. Newton, M., & Waddell, G. (1993). Trunk strength testing with iso-machines. Part 1: Review of a decade of scientific evidence. Spine, 18(7), 801–11. Nicolaisen, T., & Jørgensen, K. (1985). Trunk strength, back muscle endurance and low-back trouble. Scandinavian Journal of Rehabilitation Medicine, 17(3), 121–7. Niemistö, L., Lahtinen-Suopanki, T., Rissanen, P., Lindgren, K.-A., Sarna, S., & Hurri, H. (2003). A randomized trial of combined manipulation, stabilizing exercises, and physician consultation compared to physician consultation alone for chronic low back pain. Spine, 28(19), 2185–91. Nordander, C., Willner, J., Hansson, G.-A., Larsson, B., Unge, J., Granquist, L., & Skerfving, S. (2003). Influence of the subcutaneous fat layer, as measured by ultrasound, skinfold calipers and BMI, on the EMG amplitude. European Journal of Applied Physiology, 89(6), 514–9. Nouwen, A., Van Akkerveeken, P. F., & Versloot, J. M. (1987). Patterns of muscular activity during movement in patients with chronic lowback pain. Spine, 12(8), 777–82. O’Sullivan, P. B., Grahamslaw, K. M., Kendell, M., Lapenskie, S. C., Möller, N. E., & Richards, K. V. (2002). The effect of different standing and sitting postures on trunk muscle activity in a pain-free population. Spine, 27(11), 1238–44. Oddsson, L. I., & De Luca, C. J. (2003). Activation imbalances in lumbar spine muscles in the presence of chronic low back pain. Journal of Applied Physiology (Bethesda, Md. : 1985), 94(4), 1410–20. Oddsson, L. I., Giphart, J. E., Buijs, R. J., Roy, S. H., Taylor, H. P., & De Luca, C. J. (1997). Development of new protocols and analysis procedures for the assessment of LBP by surface EMG techniques. Journal of Rehabilitation Research and Development, 34(4), 415– 26. Ogon, M., Krismer, M., Söllner, W., Kantner-Rumplmair, W., & Lampe, A. (1996). Chronic low back pain measurement with visual analogue scales in different settings. Pain, 64(3), 425–8. Oksa, J., Paasovaara, S., & Ollila, T. (2012). Intermittently increased repetitive work intensity and neuromuscular function in the cold. Industrial Health, 50(4), 307–15. Panjabi, M. M. (1992). The stabilizing system of the spine. Part I. Function, dysfunction, adaptation, and enhancement. Journal of Spinal Disorders, 5(4), 383–9; discussion 397. Panjabi, M. M. (2003). Clinical spinal instability and low back pain. Journal of Electromyography and Kinesiology : Official Journal of the International Society of Electrophysiological Kinesiology, 13(4), 371–9. Panjabi, M. M. (2006). A hypothesis of chronic back pain: ligament subfailure injuries lead to muscle control dysfunction. European Spine Journal : Official Publication of the European Spine Society, the European Spinal Deformity Society, and the European Section of the Cervical Spine Research Society, 15(5), 668–76. Patsika, G., Kellis, E., & Amiridis, I. G. (2011). Neuromuscular efficiency during sit to stand movement in women with knee osteoarthritis. Journal of Electromyography and Kinesiology : Official Journal of the International Society of Electrophysiological Kinesiology, 21(5), 689–94. Peach, J. P., & McGill, S. M. (1998). Classification of low back pain with the use of spectral electromyogram parameters. Spine, 23(10), 1117–23. Pengel, L. H. M., Herbert, R. D., Maher, C. G., & Refshauge, K. M. (2003). Acute low back pain: systematic review of its prognosis. BMJ (Clinical Research Ed.), 327(7410), 323. Pieber, K., Herceg, M., Quittan, M., Csapo, R., Müller, R., & Wiesinger, G. F. (2014). Long-term effects of an outpatient rehabilitation program in patients with chronic recurrent low back pain. European Spine Journal : Official Publication of the European Spine Society, the European Spinal Deformity Society, and the European Section of the Cervical Spine Research Society, 23(4), 779–85. Pincus, T., Burton, A. K., Vogel, S., & Field, A. P. (2002). A systematic review of psychological factors as predictors of chronicity/disability in prospective cohorts of low back pain. Spine, 27(5), E109–20. Piper, H. (1912). Elektrophysiologie Menschlicher Muskeln. Berlin: Springer. Pope, M. H., Bevins, T., Wilder, D. G., & Frymoyer, J. W. (1985). The relationship between anthropometric, postural, muscular, and mobility characteristics of males ages 18-55. Spine, 10(7), 644–8. Porter, R. W. (1989). Mechanical disorders of the lumbar spine. Annals of Medicine, 21(5), 361–6.
106
Potvin, J. R., Norman, R. W., & McGill, S. M. (1991). Reduction in anterior shear forces on the L 4L 5 disc by the lumbar musculature. Clinical Biomechanics (Bristol, Avon), 6(2), 88–96. Radebold, A., Cholewicki, J., Panjabi, M. M., & Patel, T. C. (2000). Muscle response pattern to sudden trunk loading in healthy individuals and in patients with chronic low back pain. Spine, 25(8), 947–54. Radebold, A., Cholewicki, J., Polzhofer, G. K., & Greene, H. S. (2001). Impaired postural control of the lumbar spine is associated with delayed muscle response times in patients with chronic idiopathic low back pain. Spine, 26(7), 724–730. Reeves, N. P., Cholewicki, J., & Milner, T. E. (2005). Muscle reflex classification of low-back pain. Journal of Electromyography and Kinesiology, 15(1), 53–60. Reeves, N. P., Cholewicki, J., & Silfies, S. P. (2006). Muscle activation imbalance and low-back injury in varsity athletes. Journal of Electromyography and Kinesiology : Official Journal of the International Society of Electrophysiological Kinesiology, 16(3), 264–72. Renkawitz, T., Linhardt, O., & Grifka, J. (2008). Electric efficiency of the erector spinae in high performance amateur tennis players. The Journal of Sports Medicine and Physical Fitness, 48(3), 409–16. Revill, S. I., Robinson, J. O., Rosen, M., & Hogg, M. I. (1976). The reliability of a linear analogue for evaluating pain. Anaesthesia, 31(9), 1191–8. Ripamonti, M., Colin, D., & Rahmani, A. (2011). Maximal power of trunk flexor and extensor muscles as a quantitative factor of low back pain. Isokinetics and Exercise Science, 19(2), 83–89. Roland, M. O. (1986). A critical review of the evidence for a pain-spasm-pain cycle in spinal disorders. Clinical Biomechanics (Bristol, Avon), 1(2), 102–9. Roland, M. O., & Morris, R. (1983). A study of the natural history of low-back pain. Part II: development of guidelines for trials of treatment in primary care. Spine, 8(2), 145–150. Roy, S. H., De Luca, C. J., & Casavant, D. A. (1989). Lumbar muscle fatigue and chronic lower back pain. Spine, 14(9), 992–1001. Roy, S. H., De Luca, C. J., Emley, M. S., & Buijs, R. J. (1995). Spectral electromyographic assessment of back muscles in patients with low back pain undergoing rehabilitation. Spine, 20(1), 38–48. Roy, S. H., De Luca, C. J., Snyder-Mackler, L., Emley, M. S., Crenshaw, R. L., & Lyons, J. P. (1990). Fatigue, recovery, and low back pain in varsity rowers. Medicine and Science in Sports and Exercise, 22(4), 463–9. Roy, S. H., & Oddsson, L. I. (1998). Classification of paraspinal muscle impairments by surface electromyography. Physical Therapy, 78(8), 838–51. Samanta, J., Kendall, J., & Samanta, A. (2003). 10-minute consultation: chronic low back pain. BMJ (Clinical Research Ed.), 326(7388), 535. Schmidt, C. O., Raspe, H., & Kohlmann, T. (2010). Graded back pain revisited - do latent variable models change our understanding of severe back pain in the general population? Pain, 149(1), 50–6. Schmidt, C. O., Raspe, H., Pfingsten, M., Hasenbring, M., Basler, H. D., Eich, W., & Kohlmann, T. (2007). Back pain in the German adult population: prevalence, severity, and sociodemographic correlates in a multiregional survey. Spine, 32(18), 2005–2011. Schultz, A., Andersson, G. B., Ortengren, R., Björk, R., & Nordin, M. (1982). Analysis and quantitative myoelectric measurements of loads on the lumbar spine when holding weights in standing postures. Spine, 7(4), 390–7. Schultz, A., Cromwell, R., Warwick, D., & Andersson, G. (1987). Lumbar trunk muscle use in standing isometric heavy exertions. Journal of Orthopaedic Research, 5(3), 320–329. Scott, J., & Huskisson, E. C. (1976). Graphic representation of pain. Pain, 2(2), 175–184. Scott, J., & Huskisson, E. C. (1979). Vertical or horizontal visual analogue scales, (1974), 1979. Shafat, A., Butler, P., Jensen, R. L., & Donnelly, A. E. (2004). Effects of dietary supplementation with vitamins C and E on muscle function during and after eccentric contractions in humans. European Journal of Applied Physiology, 93(1-2), 196–202. Shrout, P. E., & Fleiss, J. L. (1979). Intraclass correlations: uses in assessing rater reliability. Psychological Bulletin, 86(2), 420–8. Sihvonen, T., Partanen, J., Hänninen, O., & Soimakallio, S. (1991). Electric behavior of low back muscles during lumbar pelvic rhythm in low back pain patients and healthy controls. Archives of Physical Medicine and Rehabilitation, 72(13), 1080–7. Silfies, S. P., Squillante, D., Maurer, P., Westcott, S., & Karduna, A. R. (2005). Trunk muscle recruitment patterns in specific chronic low back pain populations. Clinical Biomechanics (Bristol, Avon), 20(5), 465–73. Sjölie, A. N., & Ljunggren, A. E. (2001). The significance of high lumbar mobility and low lumbar strength for current and future low back pain in adolescents. Spine, 26(23), 2629–36. Smith, B. H., Penny, K. I., Purves, A. M., Munro, C., Wilson, B., Grimshaw, W. J., … Smith, W. C. (1997). The chronic pain grade questionnaire: Validation and reliability in postal research. Pain, 71(2), 141–147. Smith, S. S., Mayer, T. G., Gatchel, R. J., & Becker, T. J. (1985). Quantification of lumbar function. Part 1: Isometric and multispeed isokinetic trunk strength measures in sagittal and axial planes in normal subjects. Spine, 10(8), 757–64.
107
Solomonow, M., Baratta, R., Zhou, B. H., Shoji, H., Bose, W., Beck, C., & D’Ambrosia, R. The synergistic action of the anterior cruciate ligament and thigh muscles in maintaining joint stability. The American Journal of Sports Medicine, 15(3), 207–13. Spitzer, W., Leblanc, F., & Dupuis, M. (1987). Report of the Quebec Task Force on Spinal Disorders. Scientific approach to the assessment and management of activity-related spinal disorders: A monograph for clinicians. Spine, 12(7 Suppl), S1–59. Stark, T., Walker, B., Phillips, J. K., Fejer, R., & Beck, R. (2011). Hand-held dynamometry correlation with the gold standard isokinetic dynamometry: a systematic review. PM & R : The Journal of Injury, Function, and Rehabilitation, 3(5), 472–9. Steenstra, I. a, Verbeek, J. H., Heymans, M. W., & Bongers, P. M. (2005). Prognostic factors for duration of sick leave in patients sick listed with acute low back pain: a systematic review of the literature. Occupational and Environmental Medicine, 62(12), 851–860. Stokes, I. A., Rush, S., Moffroid, M., Johnson, G. B., & Haugh, L. D. (1987). Trunk extensor EMG-torque relationship. Spine, 12(8), 770–6. Stokes, M., & Young, A. (1984). The contribution of reflex inhibition to arthrogenous muscle weakness. Clinical Science (London, England : 1979), 67(1), 7–14. Swami, V., Einon, D., & Furnham, A. (2006). The leg-to-body ratio as a human aesthetic criterion. Body Image, 3(4), 317–23. Taimela, S., Diederich, C., Hubsch, M., & Heinricy, M. (2000). The role of physical exercise and inactivity in pain recurrence and absenteeism from work after active outpatient rehabilitation for recurrent or chronic low back pain: a follow-up study. Spine, 25(14), 1809–16. Taimela, S., Osterman, K., Alaranta, H., Soukka, A., & Kujala, U. M. (1993). Long psychomotor reaction time in patients with chronic lowback pain: preliminary report. Archives of Physical Medicine and Rehabilitation, 74(11), 1161–4. Tan, J. C., Parnianpour, M., Nordin, M., Hofer, H., & Willems, B. (1993). Isometric maximal and submaximal trunk extension at different flexed positions in standing. Triaxial torque output and EMG. Spine, 18(16), 2480–90. Taylor, J. B., Goode, A. P., George, S. Z., & Cook, C. E. (2014). Incidence and risk factors for first-time incident low back pain: a systematic review and meta-analysis. The Spine Journal : Official Journal of the North American Spine Society. Tesch, P. A., Dudley, G. A., Duvoisin, M. R., Hather, B. M., & Harris, R. T. (1990). Force and EMG signal patterns during repeated bouts of concentric or eccentric muscle actions. Acta Physiologica Scandinavica, 138(3), 263–71. Thorstensson, A., & Arvidson, A. (1982). Trunk muscle strength and low back pain. Scandinavian Journal of Rehabilitation Medicine, 14(2), 69–75. Todd, K. H., Funk, K. G., Funk, J. P., & Bonacci, R. (1996). Clinical significance of reported changes in pain severity. Annals of Emergency Medicine, 27(4), 485–489. Travell, J., Rinzter, S., & Herman, M. (1942). Pain and disability of the shoulder and arm. JAMA, 120, 417–422. Triano, J. J., McGregor, M., Cramer, G. D., & Emde, D. L. (1993). A comparison of outcome measures for use with back pain patients: results of a feasibility study. Journal of Manipulative and Physiological Therapeutics, 16(2), 67–73. Troup, J. D., Martin, J. W., & Lloyd, D. C. (1981). Back pain in industry. A prospective survey. Spine, 6(1), 61–69. Van Damme, B. B. L., Stevens, V. K., Van Tiggelen, D. E., Duvigneaud, N. N. P., Neyens, E., & Danneels, L. A. (2013). Velocity of isokinetic trunk exercises influences back muscle recruitment patterns in healthy subjects. Journal of Electromyography and Kinesiology : Official Journal of the International Society of Electrophysiological Kinesiology, 23(2), 378–86. Van Dieën, J. H., Cholewicki, J., & Radebold, A. (2003). Trunk muscle recruitment patterns in patients with low back pain enhance the stability of the lumbar spine. Spine, 28(8), 834–41. Van Dieën, J. H., Selen, L. P. J., & Cholewicki, J. (2003). Trunk muscle activation in low-back pain patients, an analysis of the literature. Journal of Electromyography and Kinesiology : Official Journal of the International Society of Electrophysiological Kinesiology, 13(4), 333–51. Van Tulder, M. W., Becker, A., Bekkering, T., Breen, A., Del Real, M. T. G., Hutchinson, A., … Malmivaara, A. (2006). Chapter 3. European guidelines for the management of acute nonspecific low back pain in primary care. European Spine Journal : Official Publication of the European Spine Society, the European Spinal Deformity Society, and the European Section of the Cervical Spine Research Society, 15 Suppl 2, S169–91. Veiersted, K. B. (1991). The reproducibility of test contractions for calibration of electromyographic measurements. European Journal of Applied Physiology and Occupational Physiology, 62(2), 91–8. Verbunt, J. A., Seelen, H. A., Vlaeyen, J. W. S., Van de Heijden, G. J., Heuts, P. H., Pons, K., & Knottnerus, J. A. (2003). Disuse and deconditioning in chronic low back pain: concepts and hypotheses on contributing mechanisms. European Journal of Pain (London, England), 7(1), 9–21. Vink, P., Van der Velde, E. A., & Verbout, A. J. (1987). A functional subdivision of the lumbar extensor musculature. Recruitment patterns and force-RA-EMG relationships under isometric conditions. Electromyography and Clinical Neurophysiology, 27(8), 517–25. Vlaeyen, J. W. S., Seelen, H. A., Peters, M., De Jong, P., Aretz, E., Beisiegel, E., & Weber, W. E. (1999). Fear of movement/(re)injury and muscular reactivity in chronic low back pain patients: an experimental investigation. Pain, 82(3), 297–304. Von Korff, M. (1992). Korff Questionnaire Summary. Pain, 50(1), 133–149.
108
Von Korff, M. (1994). Studying the natural history of back pain. Spine, 19(18 Suppl), 2041S–2046S. Von Korff, M., Dworkin, S. F., & Le Resche, L. (1990). Graded chronic pain status: an epidemiologic evaluation. Pain, 40(3), 279–291. Von Korff, M., Ormel, J., Keefe, F. J., & Dworkin, S. F. (1992). Grading the severity of chronic pain. Pain, 50(2), 133–149. Waddell, G. (1987). 1987 Volvo award in clinical sciences. A new clinical model for the treatment of low-back pain. Spine, 12(7), 632–44. Waddell, G. (2004). The back pain revolution (2nd ed.). Edinburgh, Scotland: Churchill Livingstone. Walker, B. F. (2000). The prevalence of low back pain: a systematic review of the literature from 1966 to 1998. Journal of Spinal Disorders, 13(3), 205–17. Walker, B. F., Muller, R., & Grant, W. D. (2004). Low back pain in Australian adults: prevalence and associated disability. Journal of Manipulative and Physiological Therapeutics, 27(4), 238–44. Walsh, K., Cruddas, M., & Coggon, D. (1992). Low back pain in eight areas of Britain. Journal of Epidemiology and Community Health, 46(3), 227–30. Watson, K. D., Papageorgiou, A. C., Jones, G. T., Taylor, S., Symmons, D. P. M., Silman, A. J., & Macfarlane, G. J. (2002). Low back pain in schoolchildren: occurrence and characteristics. Pain, 97(1-2), 87–92. Weishaupt, D., Zanetti, M., Hodler, J., & Boos, N. (1998). MR imaging of the lumbar spine: prevalence of intervertebral disk extrusion and sequestration, nerve root compression, end plate abnormalities, and osteoarthritis of the facet joints in asymptomatic volunteers. Radiology, 209(3), 661–6. Winkel, J., & Mathiassen, S. E. (1994). Assessment of physical work load in epidemiologic studies: concepts, issues and operational considerations. Ergonomics, 37(6), 979–88. Woods, J. J., & Bigland-Ritchie, B. (1983). Linear and non-linear surface EMG/force relationships in human muscles. An anatomical/functional argument for the existence of both. American Journal of Physical Medicine, 62(6), 287–99. Wyke, B. D. (1987). The neurology of back pain. In M. I. V Jayson (Ed.), The Lumbar Spine and Back Pain. Edinburgh, Scotland: Churchill Livingstone. Yahia, A., Jribi, S., Ghroubi, S., Elleuch, M., Baklouti, S., & Habib Elleuch, M. (2011). Evaluation of the posture and muscular strength of the trunk and inferior members of patients with chronic lumbar pain. Joint Bone Spine, 78(3), 291–297. Yang, J., & Winter, D. A. (1983). Electromyography reliability in maximal and submaximal isometric contractions. Archives of Physical Medicine and Rehabilitation, 64(9), 417–20. Yang, S., Werner, B. C., Singla, A., & Abel, M. F. (2015). Low Back Pain in Adolescents: A 1-Year Analysis of Eventual Diagnoses. Journal of Pediatric Orthopedics. Zetterberg, C., Andersson, G. B., & Schultz, A. (1987). The activity of individual trunk muscles during heavy physical loading. Spine, 12(10), 1035–40. Zuniga, E. N., & Simons, E. G. (1969). Nonlinear relationship between averaged electromyogram potential and muscle tension in normal subjects. Archives of Physical Medicine and Rehabilitation, 50(11), 613–20.
109
APPENDIX ABBREVIATIONS ALLext
extensor muscle equivalent
ISM
isometric
ALLflx
flexor muscle equivalent
LD
M. latissimus dorsi
ANOVA
analysis of variances
LoA
limits of agreement
AP
acute (low back) pain
M
males
CON
concentric
MU
motor unit
CV
coefficient of variation
MVA
moving average
ECC
eccentric
MVC
maximum voluntary contraction
EMG
electromyography
NME
neuromuscular efficiency
ES
M. erector spinae
NP
no (low back) pain
ESL
M. erector spinae lumbar
OE
M. obliquus externus
EST
M. erector spinae thoracic
OI
M. obliquus internus
EXT
extension
RA
M. rectus abdominis
F
females
RMS
root mean square
F/E
flexion/extension
ROM
range of motion
Fig.
figure
SD
standard deviation
FLX
flexion
SMVC
submaximal voluntary contraction
GBD
Global Burden of Disease study
Tab.
table
GCPS
graded chronic pain scale
TRV
test-retest variability
ICC
intraclass correlation coefficient
RQ
research question
110
LIST OF FIGURES Figure 1: The global prevalence of low back pain ................................................................................... 9 Figure 2: Motor adaptation to pain model (Hodges & Tucker, 2011) .................................................. 18 Figure 3: The role of neuromuscular deficits in low back pain ............................................................. 19 Figure 4: Example of EMG differences in LBP (Roy et al., 1989) ........................................................... 25 Figure 5: Linear tension-to-EMG relationship (Lippold, 1952; Bigland & Lippold, 1954) ..................... 27 Figure 6: Curvilinear muscle tension-to-EMG relationship (Zunig & Simons, 1969) ............................ 28 Figure 7: Flowchart of overall thesis measurements ............................................................................ 36 Figure 8: Flowchart of strength-activation (SAR) protocol ................................................................... 37 Figure 9: Trunk strength dynamometer (Con-Trex MJ with TP module) .............................................. 38 Figure 10: Target torque corridor given by dynamometer software.................................................... 39 Figure 11: EMG electrodes and hardware (myon 320) ......................................................................... 40 Figure 12: Surface electromyography (EMG) setup .............................................................................. 41 Figure 13: Flowchart of isometric SAR protocol (S1a)............................................................................ 47 Figure 14: Peak torque analysis of maximum voluntary contractions (MVC) in isometric mode ........ 47 Figure 15: Flowchart of MVC contraction mode comparison protocol (S1b) ......................................... 49 Figure 16: Peak torque analysis of maximum voluntary contractions (MVC) in isokinetic mode ........ 49 Figure 17: Flowchart of isokinetic SAR protocol (S2)............................................................................. 52 Figure 18: Flowchart of isokinetic SAR protocol (S3)............................................................................. 55 Figure 19: Graded Chronic Pain Scale (alias Korff, German version) .................................................... 57 Figure 20: Visual Analogue Scale for pain (VAS, German version) ....................................................... 58 Figure 21: Strength-activation relationship (SAR) pilot single case comparison (S1a) .......................... 60 Figure 22: Antagonistic co-activation pilot single case comparison (S1a) ............................................. 61 Figure 23: Maximum EMG activity contraction mode comparison (S1b) .............................................. 62 Figure 24: MVC reliability - Bland-Altman plot EMG sex comparison (S2) ............................................ 63 Figure 25: Strength-activation relationship (SAR) sex comparison ES (S2) ........................................... 64 Figure 26: SAR of individual muscles during sex comparison (S2) ........................................................ 65 Figure 27: Antagonistic co-activation sex comparison (S2) ................................................................... 66 Figure 28: Pain intensity rating (GCPS and VAS1-4) comparison AP vs. NP (S3) ..................................... 67 Figure 29: MVC reliability - Bland-Altman plot EMG pain status comparison (S3) ............................... 68 Figure 30: MVC reliability - Bland-Altman plot EMG pain status comparison (S3) ............................... 69 Figure 31: Strength-activation relationship (SAR) pain status comparison ALLext (S3) .......................... 70 Figure 32: SAR of individual muscles LBP patients (S3) ......................................................................... 72
111
Figure 33: Strength-activation relationship (SAR) difference AP in %NP (S3) ....................................... 73 Figure 34: SAR compared between pain status and sex (S3)................................................................ 74 Figure 35: SAR differences of AP in %NP compared between sexes (S3).............................................. 74 Figure 36: Antagonistic co-activation of trunk flexors in LBP patients (S3) .......................................... 75 Figure 37: Antagonistic co-activation of ALLflx in LBP patients - sex comparison (S3) ........................... 76 Figure 38: Synergistic co-activation in LBP patients stacked bars (S3) .................................................. 77 Figure 39: Synergisic co-activation of individual muscles during SAR protocol (S3) ............................. 77 Figure 40: Pain intensity rating correlation GCPS vs. VAS1 / VAS1-4 (S3).............................................. 114
112
LIST OF TABLES Table 1: EMG amplitude predictions by pain models compared to asymptomatic participants ......... 17 Table 2: Anthropometric data S1a ......................................................................................................... 46 Table 3: Anthropometric data S1b ......................................................................................................... 48 Table 4: Anthropometric data S2........................................................................................................... 51 Table 5: Anthropometric data S3........................................................................................................... 54 Table 6: Normalized EMG activation during SAR protocol pilot study (S1) ........................................... 60 Table 7: MVC peak torque of trunk extension during different contraction modes (S1b) .................... 62 Table 8: Reliability data of torque output (MVC1-MVC2) during sex comparison (S2) .......................... 63 Table 9: Reliability data of EMG activation (MVC1-MVC2) during sex comparison (S2) ........................ 63 Table 10: Normalized EMG activation during SAR protocol compared between sexes (S2)................. 64 Table 11: Normalized EMG activation during SAR protocol compared between sexes (S2)................. 65 Table 12: Abdominal co-activation during trunk extension compared between sexes (S2) ................. 66 Table 13: Self-graded LBP intensity data GCPS and VAS (S3) ................................................................ 67 Table 14: Reliability data of torque output (MVC1-MVC2) during pain status comparison (S3)............ 68 Table 15: Reliability data of EMG activation (MVC1-MVC2) during pain status comparison (S3) .......... 69 Table 16: Normalized EMG activation of ALLext during SAR protocol in LBP patients (S3) .................... 70 Table 17: Normalized EMG activation of ESL, EST, LD during SAR protocol in LBP patients (S3) .......... 71 Table 18: Summary of the main SAR results ......................................................................................... 79
113
COMPLEMENTARY DATA 1. Complementary plots for correlation of pain measurement tools (Chapter 3.3) Correlation of pain intensity between GCPS and VAS (S3) GCPS vs. VAS1
A
GCPS vs. VASmean1-4 A
B
Figure 40: Pain intensity rating correlation GCPS vs. VAS 1 / VAS1-4 (S3)
Figure 40: Comparison of self-graded LBP rating by GCPS (“Korff”, [/10]) and VAS (VAS 1 ([A]: at beginning, VASmean1-4 [B] : mean of all four time points, [/100]) for acute (AP) and no LBP (NP) testing day for N = 8 participants. The values on the right represent: M = slope; B = y-intercept, R = Spearman’s correlation coefficient.
114
ACKNOWLEDGEMENTS First, I would especially like to express my gratitude to my advisor Prof. Dr. Frank Mayer for providing me with the opportunity to prepare my PhD thesis at the University Outpatient Clinic Potsdam of which he is the director. After having awakened my desire to become a researcher during my Bachelor studies at his Professorship, he created the optimal framework for reaching this goal by establishing and supervising the international Master/PhD-program Clinical Exercise Science (CES) at the Department of Sports- and Health Sciences at the University of Potsdam. I am especially grateful for his guidance and encouragement to develop my scientific thinking, for his critical yet always constructive feedback, and for raising the pressure at the right time so that I was able complete my thesis. Further, I would like to thank all staff members, colleagues and fellow students of the University Outpatient Clinic Potsdam and the CES-Program for the constantly supportive cooperation and the great working atmosphere during my studies and work as a scientific assistant there. In particular, special thanks are directed to Dr. Steffen Müller for initially providing my PhD topic and for his essential advice as the co-supervisor of my thesis. My warmest thanks go also to Jun.-Prof. Dr. Anja Carlsohn, Dr. habil. Heiner Baur, Dr. Michael Cassel, Prof. Dr. Friederike Scharhag-Rosenberger and Prof. Dr. Jürgen Scharhag, who I highly appreciate both from scientific and personal perspective. Moreover, all study participants contributed to the successful achievements of my investigations. Of course, many special thanks go to my present and past fellow CES-students and friends Tilman Engel, Monique Wochatz, Lucie Risch, Martin Wolter, and Niklas König. I really enjoyed our countless scientific and private discussions at the Loft, during our projects and conference journeys and any other kind of time together. I just could not imagine how I would have come this far without you. CES 4 Life! I also want to thank all my present and past colleagues from the Research Group Heterogeneity and Inclusion (FGHI), especially PD. Dr. Julia Festman, for the support and for covering of my back during the final stage of my thesis.
115
I further want to express appreciation for the support by the Potsdam Graduate School (PoGS) and the German Academic Exchange Service (DAAD). Their ongoing funding allowed me to experience national and international conferences, helped me with publishing costs and gave me the opportunity to develop my scientific skills during relevant seminars. Last but foremost, I would like to deeply thank my friends and family, especially my parents, for their love, support and never-ending patience before and during my studies. Most of all, I want to express my eternal gratitude to my dearest beloved wife Tina, for all her love and inexhaustible trust in me.
116
AFFIDAVITS According to the doctoral degree regulations (§ 4 (2), sentences No. 4 and 7) of the Faculty of Human Sciences, University of Potsdam: I hereby declare that this thesis entitled “The neuromuscular efficiency of lower back muscles in low back pain” is the original work of the author. I did not receive any help or support from commercial consultants. All sources and/or materials applied are listed and specified in the thesis. All parts or single sentences which have been taken analogously or literally from other sources are identified as citations. Furthermore, I declare that this thesis or parts thereof have not yet been submitted for a doctoral degree to this or any other institution neither in identical nor in similar form.
Place, Date
Stephan Kopinski
117