MEASURING POVERTY USING QUALITATIVE PERCEPTIONS OF CONSUMPTION ADEQUACY Menno Pradhan and Martin Ravallion* Abstract —We show that subjective poverty lines can be derived using simple qualitative assessments of perceived consumption adequacy based on a household survey. We implement the method using survey data for Jamaica and Nepal. Respondents were asked whether their consumptions of food, housing, and clothing were adequate for their family’s needs. The implied poverty lines are robust to alternative methods of dealing with other components of expenditure. The aggregate poverty rates accord quite closely with those based on independent ‘‘objective’’ poverty lines. However, there are notable differences in the geographic and demographic poverty pro les.
I.
Introduction
T
HE most common practice in drawing a poverty line starts with a predetermined set of basic needs for good health and an active life; nutritional requirements normally gure prominantly. The poverty line is then de ned as the value of a monetary measure of individual economic welfare, such as expenditure on all goods and services, at which these basic needs are met at given prices and reference tastes. People are deemed to be poor if and only if their expenditure is below this line, and a poverty measure is estimated on the censored distribution (such as the headcount index given by the proportion below the line). Methodological differences within this approach are known to yield different poverty measures.2 However (as has been noted before), there is an inherent subjectivity and social speci city to any notion of basic needs, including nutritional requirements. For example, psychologists, sociologists, and others have argued that the circumstances of the individual relative to others in some reference group in uence perceptions of well-being at any given level of individual command over commodities.3 By this view, ‘‘the dividing line . . . between necessities and luxuries turns out to be not objective and immutable, but socially determined and ever changing’’ (Scitovsky, 1978, p. 108). Some have taken this view so far as to abandon any attempt to rigorously quantify a de nition of poverty. Poverty analysis (particularly, but not only, for developing
Received for publication August 27, 1997. Revision accepted for publication September 20, 1999. * Economic and Social Institute at Free University Amsterdam and World Bank, respectively. These are the views of the authors and need not re ect those of the World Bank. For their helpful comments, the authors are grateful to Kees Burger, Klaas de Vos, Francisco Ferreira, Emmanuel Jimenez, Arie Kapteyn, Peter Lanjouw, Remco Oostendorp, Lant Pritchett, Dominique van de Walle, Bernard van Praag, three anonymous referees, and participants at the 1998 Conference of the International Association for Research on Income and Wealth, Cambridge, England. 2 Ravallion (1994) gives examples. See Ravallion (1998) for a critical overview of alternative methods of setting poverty lines found in practice in both developing and developed countries. 3 Runciman (1966) provided an in uential exposition and supportive evidence. Also see van de Stadt, Kapteyn, and van de Geer (1985) and Easterlin (1995).
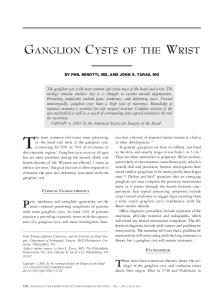
countries) has become polarized between the objectivequantitative schools and the subjective-qualitative schools, with rather little effort at cross-fertilization. An intermediate approach has emerged in a segment of the developed country literature on poverty. Subjective poverty lines have been based on answers to the minimumincome question (MIQ), such as the following (paraphrased from Kapteyn et al., 1988): ‘‘What income level do you personally consider to be absolutely minimal? That is to say that with less you could not make ends meet.’’ One might de ne everyone as poor whose income is less than the amount they give as an answer to this question as poor. However, this would almost certainly lead to inconsistencies in the resulting poverty measures, in that people with the same income, or some other agreed measure of economic welfare, will be treated differently (Ravallion & Lokshin, 1999). Clearly an allowance must be made for heterogeneity, such that people at the same level of living may well give different answers to the MIQ, but must be considered equally ‘‘poor’’ for consistency. Past empirical work has found that the expected value of the answer to the MIQ conditional on income tends to be an increasing function of income.4 Past studies have tended to nd a relationship such as that depicted in gure 1, which gives a stylized representation of the regression function on income for answers to the MIQ. The point z* in the gure is an obvious candidate for a poverty line; people with income above z* tend to feel that their income is adequate, while those below z* tend to feel that it is not. In keeping with the literature, we term z* the subjective poverty line (SPL).5 Common practice is to estimate z* using a regression equation such as zi 5 a 1 b yi 1 yx 1 e i (or a nonlinear form) where y is actual income, x is a vector of household characteristics deemed relevant to needs (such as family size and demographic composition), and e is a zero mean error term orthogonal to y and x. We call this the MIQ regression. The social subjective poverty line is then evaluated at the mean of e i and any given x, giving z* 5 (a 1 yx)/(1 2 b ). The answers to the MIQ are sometimes interpreted as points on the consumer’s cost function (giving the minimum expenditure needed to assure a given level of utility) at a point of ‘‘minimum utility,’’ interpreted as the poverty line in utility space.6 The way z* varies with x then 4 Contributions include Groedhart et al. (1977), Colastanto, Kapteyn, and van der Gaag (1984), Danziger et al. (1984), Kapteyn et al. (1985), Kapteyn, Kooreman, and Willemse (1988), Stanovnik (1992), and Kapteyn (1994). 5 The term social subjective poverty line might be preferable to distinguish it from the individual subjective poverty lines. However, the meaning will be clear from the context. 6 On the use of subjective welfare assessments to identify cost and/or utility functions, see van Praag (1991) and Kapteyn (1994).
The Review of Economics and Statistics, August 2000, 82(3): 462–471 r 2000 by the President and Fellows of Harvard College and the Massachusetts Institute of Technology
MEASURING POVERTY USING QUALITATIVE PERCEPTIONS OF CONSUMPTION ADEQUACY FIGURE 1—THE SUBJECTIVE POVERTY LINE (Z *)
pitfalls, however. Income is not a well-de ned concept in most developing countries, particularly (but not only) in rural areas. It is not at all clear whether one could even get sensible answers to the MIQ. Our main aim in this paper is to develop and implement a qualitative model of perceived consumption needs that allows us to identify the subjective poverty line without the MIQ. We argue here that the qualitative idea of the adequacy of consumption is, in many settings, a more promising approach than the MIQ. We will demonstrate that one can still estimate the SPL without the MIQ; less-demanding qualitative questions suffice. The following section outlines our qualitative model of the subjective poverty line. In section III, we present our results for two (quite different) developing countries, Jamaica and Nepal. Section IV concludes. II.
identi es the equivalence scale (including an allowance for any scale economies of family size). It seems without exception that the MIQ regression has been estimated assuming that the measure of income obtained from the survey is the concept of ‘‘income’’ that respondents have in mind when they answer the MIQ. The survey-based income estimate is typically based on an economic concept of income as the maximum consumption that is possible without depleting current wealth. The estimate is typically built up from many survey questions; no respectable household survey would ever try to obtain its income estimate from just one or two questions. 7 Yet the standard practice in the MIQ assumes that the household that responds to that question already knows its income. More plausibly, different households have different concepts of income, which will not often correspond to the concept of income used by the analyst of the MIQ. Some respondents will perceive their own income to be lower than it actually is (as de ned by an economist); for example, they might include only cash income, excluding imputed income from own housing or own production activities (such as a family farm). Some will include asset sales or ignore certain production costs, thus overestimating their actual income. These issues are of particular concern in developing countries. While the MIQ has been applied in a number of OECD countries, 8 we know of no attempts to apply it in a developing country. Doing so has a number of potential 7 For example, in the analysis of the World Bank’s Living Standards Measurement Surveys, it generally requires many pages of programming code to obtain the income and expenditure aggregates from the survey responses. 8 See, for example, Hagenaars (1986) for a cross-European comparison and De Vos and Garner (1991) for a U.S.-Dutch comparison.
463
A Qualitative Model of Subjective Pover ty Lines
We assume that each individual has his or her own reasonably well-de ned consumption norms at the time of being surveyed. At the prevailing incomes and prices, there can be no presumption that these needs will be met at the consumer’s utility-maximizing consumption vector. Let the consumption vector of a given individual be denoted y, and let z denote the matching vector of consumption norms for that individual. The subjective basic need for good k and household i is given by zki 5 w
k( yi,
xi) 1 e
ki
(k 5
1, . . . , m; i 5
1, . . . , n) (1)
where w k (k 5 1, . . . , m) are continuous functions, and x is a vector of indicators of economic welfare at a given consumption vector. We assume that each w k has a positive lower bound as actual consumptions approach zero, and that the function is also bounded above as consumptions approach in nity. The error terms, e ki, are assumed to have zero mean and to be independently and identically normally distributed for all i with variance s 2k. The distribution functions of the standard normal error terms ( e ki /s k ) are denoted Fk (k 5 1, . . . , m). We de ne the subjective poverty line as the expenditure level at which the subjective minimums for all k are reached in expectation, for a given x. A household is poor if and only if its total expenditure is less than the appropriate SPL for a household with its characteristics. Thus, the SPL satis es
o
z*(x) 5
m k5 1
z*k(x)
(2)
where z*k (x) is de ned implicitly by the xed-point relationship: z*k(x) 5 w
k(z* 1(x),
. . . , z*m(x), x)
(k 5
1, . . . , m).
(3)
464
THE REVIEW OF ECONOMICS AND STATISTICS
A solution of this equation will exist as long as the functions w k are continuous for all k.9 This provides a multidimensional extension to the onedimensional case based on the MIQ, as illustrated in gure 1. The SPL is the level of total spending above which respondents say (on average) that their expenditures are adequate for their needs. However, we do not assume that the MIQ is answerable, and so we cannot observe zki directly. Rather, we know from a purely qualitative survey question whether actual expenditure on good k by the ith sampled household ( yki ) is below zki. The probability that the ith household will respond that actual consumption of the kth good is adequate will then be given by Prob( yki .
zki) 5
Fk[yki/s
k
k(y i,
w 2
xi)/s k].
(4)
As long as the speci c parameterizations of the function w k are linear in parameters (although possibly nonlinear in variables), one can estimate the model as a standard probit. Let us follow the literature on the MIQ and assume a log-linear speci cation for the individual subjective poverty lines. Equation (1) is then ln zki 5
a k1
b 8k8yi 1
p 8k xi 1
(k 5
1, . . . , m; i 5
e
ki
(5)
1, . . . , n)
where y8 ; (ln y1, . . . , ln ym ). If we observed the values of zki (analogously to the answers to the MIQ), then a unique solution for the subjective poverty line could be obtained by directly estimating equation (5) and solving, assuming that the following matrix is nonsingular (in obvious notation):
[
12
B5
2
b
11
b
· · ·
···
2 b
1m
· · · · ··· 12 b ··
m1
mm
The (unique) solution for z* ; given by (in obvious notation) z* 5
B2 1( a 1
]
(ln z*1, . . . , ln z*m) is then
P x)
(6)
However, the parameters B, a , and p are not identi ed when we have only qualitative data on consumption adequacy relative to latent norms. Equation (4) becomes Prob(yki .
zki) 5
Fk(ln yki)/s
k2
(a
k
1
b k8 yi 1
p k8 xi)/s k].
(7)
As in any probit, we do not identify the parameters of the underlying model generating the latent continuous variable (equation (5)), but only their values normalized by s k. Thus, 9 This follows from the Brouwer xed-point theorem given our boundedness assumptions. Stronger assumptions are needed to rule out multiple solutions.
armed with only the qualitative welfare assessments (telling us Prob( yki . zki )), we cannot identify the parameters of the model determining the individual basic needs. That fact does not, however, limit our ability to identify the SPL. To see why, consider rst the special case of one good with ln z 5 a 1 b ln y 1 e . The log SPL is a /(1 2 b ). The probability of reporting that actual consumption is adequate is F[ln y(1 2 b )/s 2 a /s ], which allows us to identify only (1 2 b )/s and a /s . Nonetheless, a /(1 2 b ) is still identi ed. This property carries over to the more general model with more than one good, and other sources of heterogeneity in welfare, as in equation (5). In this case, de ne the estimable normalized matrix Bs , obtained by postmultiplying the B matrix by the column vector formed by s 2k 1 (k 5 1, . . . , m). Similarly de ne the normalized vector a s and parameter matrix IIs (so, for example, the kth element of a s is a k/s k.) It is clear that we can always rewrite the solution for the SPLs given by equation (6) in terms of the observed (normalized) parameters: z* 5
B2s 1( a s
1
P s
x)
(8)
Thus, we can solve for the subjective poverty line without the MIQ as long as we have the qualitative data to determine Prob( yki . zki ) for all i, k. Instead of asking for the minimum income, we simply ask the simple qualitative question as to whether current consumptions are adequate. III.
Results
For the purpose of this paper, qualitative questions on perceptions of consumption adequacy were added to both the Jamaica Living Conditions survey of 1993 and the Nepal Living Standards Survey of 1995/96. The questions asked are given in table 1. To limit the number of questions, only broad aggregates for the main categories of spending were included. This creates a practical problem of how to deal with the remaining types of spending. We consider alternatives below. In the survey schedule, these questions came after a detailed consumption module. The expenditure aggregate includes imputed values for consumption in kind as well as cash expenditures. 10 For house owners, a rent is imputed based on the quality of the house, facilities, and location of the residence. Consumption in kind (including from home production) is valued at local market prices. Other information was also collected on a wide range of household characteristics. Aside from the addition of the ‘‘consumption adequacy’’ questions, the surveys followed the reasonably standard practices of the surveys conducted under the 10 Deaton and Zaidi (1998) discuss the construction of the expenditure aggregates in LSMS surveys.
MEASURING POVERTY USING QUALITATIVE PERCEPTIONS OF CONSUMPTION ADEQUACY TABLE 1.—QUESTIONS
ON
I would like to ask your opinion of your family’s standard of living.
Concerning your family’s food consumption over the past one month, which of the following is true? Concerning your family’s housing, which of the following is true? Concerning your family’s clothing, which of the following is true? Concerning the health care your family gets, which of the following is true? Concerning your children’s schooling, which of the following is true?
auspices of the World Bank’s Living Standards Measurement Study.11 Table 2 summarizes the answers to the questions in table 1. In all categories that can be compared, a higher percentage of respondents in Nepal than Jamaica said that their consumption was less than adequate. For Nepal, the percentages range from 42% to 59%, while in Jamaica they range from 20% to 42%, with schooling the lowest and housing the highest in both countries (although other categories are ranked differently).12 Relatively few respondents in either country deemed their consumptions ‘‘more than adequate’’ in either country. Nonetheless, we considered it preferable to keep the information in this category and use an ordered probit estimator. In deriving subjective poverty lines, we have to take account of the fact that the subjective adequacy questions did not span the entire consumption space. We consider two methods of dealing with this missing data. A. Method (1)
Method (1) anchors the subjective poverty lines to the perceived adequacy of food consumption alone. We ignore the answers given to the other questions in table 1 and simply regress the answers to the food adequacy question on total expenditure on consumption and the demographic and regional variables. This method is of interest because it corresponds closely to a widely used practice in constructing objective poverty lines in which the poverty line is a level of total expenditure or income at which food spending is sufficient to assure that food consumption is deemed nutritionally adequate by predetermined ‘‘objective’’ criteria of requirements for good health and normal activity levels. (For a discussion of this method, see Ravallion (1998).) The difference here is that we abandon nutritional requirements 11 For further information on these surveys, see Grosh and Glewwe (1995). 12 In Nepal, the survey also asked about the adequacy of income; 69% said their income was less than adequate, appreciably higher than for any consumption components. We will not use these answers, however, because it is implausible that respondents will have similar ideas about what income means; no doubt, many were answering about their cash income only.
465
CONSUMPTION ADEQUACY
It was less than adequate for your family’s needs It was just adequate for your family’s needs It was more than adequate for your family’s needs Not applicable ‘‘Adequate’’ means no more nor less than what the respondent considers to be the minimum consumption needs of the family
1 2 3 4
in favor of the information contained in the subjective qualitative assessments of food adequacy.13 B. Method (2)
Method (2) uses the answers on perceived adequacy of other non-food consumptions, as described in section II. All consumption which falls under the headings in table 1 is called core expenditure and the rest is lumped into a remainder.14 We include an allowance for the remainder consistent with spending behavior in the data. Speci cally, in method (2), we estimate a reduced-form Engel curve for the remainder as a function of core expenditure and the demographic and regional variables. The Engel curve is thus used to make an allowance for the remaining components of spending which is an estimate of the expected value for someone consuming the subjective poverty-line levels for core expenditure. 15 As regressors we use log actual household expenditure (in total for method (1), and by component for method (2)), log household size, demographic composition variables, and regional dummy variables. To allow for relative-income effects, we also include log mean expenditure in the primary sampling unit. Table 3 gives summary statistics on the 13 Blaylock and Smallwood (1986) also use a food adequacy question in deriving poverty measures, although their approach is quite different to our method (1). Blaylock and Smallwood use an ordered probit model of survey responses on food adequacy to predict the probabilities of inadequate food consumption at given poverty lines, which are chosen to correspond to predetermined food shares (by inverting an estimated Engel curve for food, at the given food share). So, in their method, the food share de nes the underlying reference welfare level to which the poverty line is anchored. Our method (1), by contrast, derives a poverty line in the consumption space which assures food adequacy in expectation. This is the more natural analogue of the idea of the subjective poverty line, as discussed in the introduction. 14 We did not use health care and schooling in either core expenditure or the remainder because these are, to a large extent, public goods for which the perception of adequacy is not necessarily related to private consumption. We will be analyzing these data in future work. 15 The working paper version (Pradhan & Ravallion, 1998) gives results for an alternative method in which we do not use the Engel curve allowance for remaining consumption, but simply exclude the remaining consumption from both the poverty lines and the welfare indicator. Because the welfare indicator changes, this method entails a different de nition of poverty. However, the poverty measures turned out to be very similar to method (2).
466
THE REVIEW OF ECONOMICS AND STATISTICS
TABLE 2.—PERCEIVED ADEQUACY Percentages Food Jamaica Nepal Housing Jamaica Nepal Clothing Jamaica Nepal Transport Jamaica Healthcare Jamaica Nepal Schooling Jamaica Nepal
OF
CONSUMPTION
IN
JAMAICA
AND
NEPAL
Less than Adequate
Just Adequate
More than Adequate
Not Applicable
39 47
55 51
6 2
0 0
42 59
50 41
8 0
0 0
36 53
57 47
7 0
0 0
48
47
4
0
41 52
55 48
4 0
0 1
20 42
35 38
2 0
43 19
TABLE 4.—ADEQUACY
OF
TABLE 3.—DESCRIPTIVE STATISTICS FOR EXPLANATORY VARIABLES USED IN ANALYSIS Jamaica
Log food consumption log housing consumption log clothing consumption log household size fraction men aged , 18 fraction women aged , 18 fraction men aged [18–60] fraction women aged [18–60] fraction men aged . 60 fraction women aged . 60 log mean consumption of cluster Number of observations
Mean
Std. Dev.
10.14 7.98 8.58 1.11 0.151 0.151 0.290 0.244 0.078 0.086 10.10 1954
0.70 1.20 1.00 0.72 0.185 0.187 0.316 0.241 0.214 0.212 0.42
Note: Natural logarithms are used throughout the paper.
Nepal Mean 9.94 7.87 1.60 0.224 0.205 0.232 0.268 0.033 0.038 8.97 3373
Std. Dev. 0.63 1.37 0.53 0.174 0.176 0.167 0.157 0.097 0.124 0.63
AS A
log total consumption log household size fraction men age , 18 fraction women aged , 18 fraction women aged [18–60] fraction men aged . 60 fraction women aged . 60 log mean consumption of cluster other urban rural Jamaica
variables we will use in attempting to explain the differences in self-rated consumption adequacy. A practical problem arose in the case of transport spending in Jamaica and clothing in Nepal, namely that the relatively large number of zero entries in the data created a very weak relation between actual expenditure and perceived adequacy. In the case of clothing in Nepal, the underlying reason may be that clothing is a durable, bought only infrequently because of the distances to markets (especially in the hills and mountains). In Jamaica, the transport question was phrased as perceived adequacy of access to transport, which could be sufficient even for those who do not use it. The result was a considerable instability in the poverty lines, whereby the allowances for these components could uctuate wildly according to other household variables. We decided not to include these components in the subjective poverty line, although they are included in the expenditure remainder under method (2). Table 4 gives the ordered probit estimates of the parameters of the model for food adequacy as a function of total consumption spending, log household size, demographic variables, the (log) mean expenditure of the primary sam-
FOOD
rural Nepal (west hills)
FUNCTION
OF
Nepal
0.64 (11.69) 2 0.54 (2 8.25) 2 0.13 (2 0.72) 2 0.09 (2 0.48) 0.33 (2.61) 0.12 (0.86) 2 0.01 (2 0.07) 0.07 (0.83) 0.17 (2.13) 2 0.004 (2 0.070)
0.79 (16.01) 2 0.37 (2 5.77) 2 0.35 (2 2.04) 2 0.45 (2 2.60) 0.11 (0.61) 2 0.08 (2 0.34) 0.11 (0.53) 2 0.23 (2 3.33) 2 0.40 (2 3.85)
rural Nepal (east hills) rural Nepal (west Terai) rural Nepal (east Terai) a
1
a
2
McFadden’s pseudo R2
TOTAL CONSUMPTION
Jamaica
6.91 (8.91) 8.92 (11.37) 0.09
2 0.45 (2 3.89) 2 0.58 (2 5.71) 0.003 (0.03) 2 0.15 (2 1.34) 5.08 (8.44) 7.58 (12.41) 0.13
(t-ratios in parentheses)
pling unit, and regional dummy variables. For implementing method (2), table 5 gives the results for the perceived adequacy of food, housing, and clothing in Jamaica, and table 6 gives the corresponding results for food and housing in Nepal. Notice that in these regressions we separately identify the corresponding consumption components. For method (2), we also require the Engel curves for remaining consumption, as given in table 7. The regressions in tables 4 through 7 are self-explanatory, and there are few surprises. Actual measures of consumption tend to be highly signi cant predictors of perceived consumption adequacy. The perceived adequacy of food and housing tends to respond more elastically to actual spending on the corresponding category of goods than to other types of spending (tables 5 and 6). The perceived adequacy of clothing in Jamaica, however, tends to respond more elastically to actual housing expenditure than to spending on clothing; the lack of imputations for clothing services may be the reason. Holding other variables constant, larger households tend to perceive their consumptions as less adequate. Holding per capita expenditure constant, we nd no signi cant economies of scale in Jamaica but we do for Nepal. From table 4, the estimated elasticity of the SPL based on food adequacy in Nepal with respect to family size
MEASURING POVERTY USING QUALITATIVE PERCEPTIONS OF CONSUMPTION ADEQUACY TABLE 5.—PERCEIVED CONSUMPTION ADEQUACY GROUP IN JAMAICA
log food consumption log housing consumption log clothing consumption log household size fraction men age , 18 fraction women aged , 18 fraction women aged [18–60]
2
(2 2
(2 2
(2
fraction men aged . 60 fraction women aged . 60 log mean consumption of cluster other urban rural a
1
a
2
McFadden’s pseudo R2
2
(2 (2
2
BY
COMMODITY
Food
Housing
Clothing
0.24 (4.04) 0.23 (7.51) 0.06 (1.64) 0.39 5.58) 0.31 1.63) 0.19 0.99) 0.15 (1.09) 0.03 0.17) 0.26 1.54) 0.16 (1.89) 0.14 (1.75) 0.08 (1.10) 5.69 (6.80) 7.73 (9.15) 0.09
0.04 (0.71) 0.47 (14.29) 2 0.02 (2 0.59) 2 0.18 (2 2.64) 2 0.21 (2 1.09) 2 0.27 (2 1.39) 0.04 (0.27) 0.61 (3.66) 0.58 (3.53) 0.02 (0.28) 0.17 (2.07) 0.33 (4.27) 4.05 (4.84) 5.98 (7.09) 0.12
0.13 (2.11) 0.23 (7.60) 0.14 (3.83) 0.29 4.19) 0.57 2.99) 0.17 0.90) 0.09 (0.64) 0.15 (0.92) 0.35 (2.12) 0.16 (1.89) 0.10 (1.24) 0.08 (1.03) 5.17 (6.24) 7.21 (8.61) 0.08 2
(2 2
(2 (2
2
(t-ratios in parenthesis)
TABLE 6.—PERCEIVED ADEQUACY
OF
log food consumption log housing consumption log household size fraction men age , 18 fraction women aged , 18 fraction women aged [18–60] fraction men aged . 60 fraction women aged . 60 log mean consumption of cluster other urban rural west hills rural east hills rural west Terai rural east Terai a
1
a
2
McFadden’s pseudo R2
equals 0.47 (5 0.37/0.79). 16 The demographic compositional effects tend not to be signi cant. Regional effects are stronger in Nepal, which is unsurprising given the country’s much greater geographic diversity. There is also a strong negative effect of neighborhood expenditure on perceived adequacy in Nepal, but not in Jamaica. The implied elasticity of the SPL for Nepal with respect to mean expenditure of the cluster is 0.29 (5 0.23/0.79). The region-speci c SPLs are given in table 8 for both countries and each method. We give the poverty lines at mean points of other variables. However, the calculation of poverty measures (to follow) naturally uses householdspeci c poverty lines rather than the averages in table 8. The last column gives previously established ‘‘objective’’ poverty lines for both countries, which will be discussed later. Method (2) requires the more prior estimation than either of the other methods; it requires both the ordered probits by category of consumption and the Engel curve for the remainder. It is to be expected that this creates imprecision in the resulting estimates. How much so can be seen from 16 It is widely assumed that poor households in low-income countries do not face signi cant economies of scale in consumption because the share of their expenditure going to ‘‘private’’ goods within the household is high. However, this assumption is questionable, and quite a wide range of elasticity values might be defended in such settings (Lanjouw & Ravallion, 1995). Nonetheless, we do nd this size elasticity for Nepal to be surprisingly low. Household size might well be picking up some other factor in uencing subjective perceptions of welfare, although what that factor might be is unclear. We hope to investigate this nding further in future work.
FOOD
AND
HOUSING
467
IN
NEPAL
Food
Housing
0.60 (10.60) 0.32 (12.57) 2 0.37 (2 5.660) 2 0.32 (2 1.84) 2 0.43 (2 2.44) 0.06 (0.35) 2 0.07 (2 0.29) 0.07 (0.34) 2 0.23 (2 3.41) 2 0.34 (2 3.26) 2 0.26 (2 2.19) 2 0.40 (2 3.62) 0.29 (2.14) 0.03 (0.25) 5.40 (8.67) 7.92 (12.55) 0.14
0.22 (3.81) 0.32 (12.03) 2 0.19 (2 2.72) 2 0.43 (2 2.37) 2 0.36 (2 2.00) 2 0.01 (2 0.04) 0.18 (0.70) 0.14 (0.62) 2 0.37 (2 5.16) 2 0.10 (2 0.90) 2 0.75 (2 5.99) 2 0.50 (2 4.30) 2 0.54 (2 3.76) 2 0.25 (2 2.06) 0.75 (1.16) 3.90 (5.87) 0.12
(t-ratios in parenthesis)
TABLE 7.—ENGEL CURVES
constant log core consumption log household size fraction men age , 18 fraction women aged , 18 fraction women aged [18–60] fraction men aged . 60 fraction women aged . 60 other urban rural Jamaica rural Nepal (west hills)
FOR
REMAINING CONSUMPTION Jamaica
Nepal
2 1.02 (2 3.36) 1.08 (36.31) 0.08 (2.11) 2 0.48 (2 4.41) 2 0.34 (2 3.02) 2 0.15 (2 1.95) 2 0.43 (2 5.13) 2 0.53 (2 6.32) 2 0.08 (2 1.74) 2 0.32 (2 8.35)
2 1.78 (2 5.24) 1.09 (34.05) 0.10 (2.20) 2 0.11 (2 0.87) 2 0.18 (2 1.40) 2 0.25 (2 1.82) 2 0.20 (2 1.05) 2 0.38 (2 2.37) 2 0.20 (2 2.64)
rural Nepal (east hills) rural Nepal (west Terai) rural Nepal (east Terai) R2
0.57
2 0.79 (2 11.07) 2 0.56 (2 8.48) 2 0.53 (2 6.48) 2 0.53 (2 7.62) 0.50
Note: Core consumption is food and housing, plus clothing for Jamaica. The dependent variable is total consumption minus core consumption. (t-ratios in parenthesis).
468
THE REVIEW OF ECONOMICS AND STATISTICS
TABLE 8.—SUBJECTIVE POVERTY LINES
FOR
FAMILIES
WITH
AVERAGE CHARACTERISTICS : JAMAICA
AND
NEPAL ( IN JAMAICAN D OLLAR
AND
NEPALESE RUPIAH)
Method (1) Based on Perceived Adequacy of Food Alone
Method (2) Based on Perceived Adequacy of Food, Housing and (for Jamaica) Clothing, and Using an Engel Curve for Remaining Consumption
Independent, Previous Estimates of Objective Poverty Lines; Cost of Basic Needs Poverty Lines, Anchored to Pre-determined Nutritional Requirements
13110 10082 13203
10524 7624 10980
14472 14319 13203
4129 6790 7256 8620 4112 4973
5164 8851 12821 5834 11896 3655
6122 5197 5065 5241 3964 4404
Jamaica Kingston Other urban Rural Nepal Kathmandu Other urban Rural western hills Rural eastern hills Rural western Terai Rural eastern Terai
Note: All poverty lines are per capita per month. Poverty lines for method (1) and (2) were calculated on the basis of country-speci c average household characteristics (see table 3), and normalized by household size. Independent poverty lines pertain to same year.
TABLE 9.—STANDARD ERRORS
Jamaica Kingston Other urban rural Nepal Kathmandu other urban rural western hills rural eastern hills rural western Terai rural eastern Terai
OF THE
SUBJECTIVE POVERTY LINES
Method (1) Based on Perceived Adequacy of Food Alone
Method (2) Based on Perceived Adequacy of Food, Housing and (for Jamaica) Clothing, and Using an Engel Curve for Remaining Consumption
1174 1141 1011
4906 3579 4546
498 643 447 528 387 311
1494 2544 8174 460 11549 317
Note: Standard errors for the SPLs in table 8, calculated using the Delta method.
table 9, which gives standard errors for the SPLs in table 8, calculated by the Delta method. Standard errors increase substantially as one moves from method (1) to method (2). The standard errors for method (1) are of similar magnitude to those obtained using the MIQ.17 The aggregate poverty measures are given in table 10; we give the popular headcount index as well as the poverty gap index and the squared poverty gap index (introduced by Foster, Greer, and Thorbecke, (1984)) which penalizes inequality among the poor. The two methods are in reasonably close agreement. As an aside, it may be noted that the headcount index for method (1) in table 10 is not the same as the percentage of people who say that their food is inadequate, as given in table 2. This is in keeping with the SPL approach, which (as noted in the introduction) identi es the poor as those for whom total income or spending is less than the level which, on average, is deemed to be adequate ‘‘to make ends meet.’’ In applying the minimum income question to the United States and the Netherlands, de Vos and Garner (1991) report standard errors in the range of 7% to 12% of the subjective poverty line. Our estimates from method (1) yield standard errors of similar magnitudes (from 6% to 12% of the SPL). 17
TABLE 10.—AGGREGATE POVERTY MEASURES Percentages Jamaica Method (1) Method (2) Previous estimate Nepal Method (1) Method (2) Previous estimate
Headcount Index
Poverty Gap Index
Squared Poverty Gap Index
34.4 31.5 31.5
11.2 13.2 n.a.
5.3 7.7 n.a.
43.6 43.0 42
14.5 16.7 12.1
6.5 8.6 5.0
Note: See table 7 for description of alternative methods; see text for full details.
Given latent heterogeneity and measurement error, there will be people above this point who still feel that their level of living is inadequate, and people below this point who feel that it is adequate. One cannot predict on a priori grounds whether the proportion of people with expenditure below the SPL will be above or below the proportion who say that their consumption is inadequate. It is striking how close these aggregate poverty rates are to the results obtained by two independent studies of poverty in these countries which have been based on objective poverty lines. The Planning Institute of Jamaica (the statistics office of the government of Jamaica) estimated the incidence of poverty at 31.5% (Social Policy Development Unit, 1994). As part of the World Bank’s Poverty Assessment for Nepal, researchers estimated the headcount index in Nepal to be 42% (Lanjouw, Prennushi, & Zaidi, 1996). Both estimates are based on the same survey but use per capita poverty lines based on a food basket yielding minimum nutritional requirements (2,245 calories per person per day for Jamaica and 2,124 for Nepal).18 The resulting poverty lines are given in the last column of table 8. 18 The Nepal Study employed the same measure of expenditure as this study. The Jamaican Planning Institute constructed its own expenditure measure based on the same survey which was not available to the authors. The results quoted in table 8, 10, and 11 are directly taken from Social Policy Development Unit (1994). Figure 2 is based on the authors’ calculations.
MEASURING POVERTY USING QUALITATIVE PERCEPTIONS OF CONSUMPTION ADEQUACY TABLE 11.—POVERTY PROFILE Percentages
BY
REGION
FOR
JAMAICA
Headcount Poverty Squared Poverty Index Gap Index Gap Index
Method
Kingston
1 2 Previous estimate Other urban 1 2 Previous estimate Rural 1 2 Previous estimate
21.4 18.1 21.8 19.6 13.2 28.9 47.8 46.5 38.9
6.1 5.8 n.a. 5.1 4.3 n.a. 16.7 21.1 n.a.
2.8 3.1 n.a. 1.9 2.2 n.a. 8.2 12.5 n.a.
The regional poverty pro les vary more depending on the method used. Regional poverty pro les can be found in table 11 for Jamaica and table 12 for Nepal. Recall that method (1) controls only for differences in food adequacy. In Nepal, for instance, housing conditions— holding everything else constant—are perceived to be less adequate in the western hills than in the eastern hills, while the opposite holds for food adequacy. As a result, method (2) yields a higher headcount index than method (1) for the western hills, while the opposite holds for the eastern hills. The urban-versus-rural poverty comparisons are of special interest in a developing-country setting. Poverty comparisons between the two sectors have often been controversial, with different measurement methods giving very different results, including rank reversals (Ravallion & Bidani, 1994). It has been argued that, by ignoring relative welfare considerations, conventional approaches based on (objective) absolute poverty lines (which attempt to x the real value of the poverty line between the two sectors) will tend to underestimate poverty in urban areas versus rural areas. The previous estimates we have quoted for both countries follow the conventional approach, and so they could also be criticized from this point of view. Yet, our subjective poverty lines tend to show even larger differences between rural and urban poverty measures than do the more conventional TABLE 12.—POVERTY PROFILE
Percentages
Method
Kathmandu
1 2 Previous Other urban 1 2 Previous Rural western hills 1 2 Previous Rural eastern hills 1 2 Previous Rural western Terai 1 2 Previous Rural eastern Terai 1 2 Previous
estimate estimate estimate estimate estimate estimate
BY
REGION
FOR
NEPAL
Squared Headcount Poverty Poverty Index Gap Index Gap Index 0.7 1.1 4 30.5 39.4 34 71.1 84.7 57 66.7 38.7 33 22.6 62.7 46 31.5 12.2 39
0.2 0.3 0.4 9.1 16.2 10.9 27.9 39.7 21.0 23.5 10.7 9.1 4.5 23.0 11.2 7.0 2.1 8.7
0.0 0.1 0.1 3.8 8.5 4.4 13.6 22.4 9.9 10.8 4.1 3.6 1.4 10.7 3.9 2.3 0.6 2.9
469
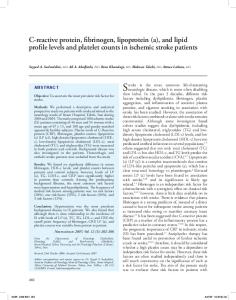
methods. Our results do not suggest that the conventional approach has underestimated urban versus rural poverty when compared to subjective poverty lines incorporating relative welfare effects, consistently with welfare perceptions. Next, we examine differences in the demographic poverty pro le. Standard methods of setting poverty lines typically nd that larger households are poorer in developing countries (Lipton & Ravallion, 1995). The relationship between poverty and household size is known, however, to be sensitive to measurement assumptions even within the class of standard ‘‘objective’’ methods (Lanjouw & Ravallion, 1995). The previous objective poverty lines for both Jamaica and Nepal followed the common practice in developing countries of having a constant per capita value (that is, without any allowance for economies of scale in household consumption). In table 13, we give our subjective poverty lines for various demographic groups and both methods described above. The SPL is found to increase less than proportionately with household size, with somewhat stronger economies of scale indicated for Nepal than for Jamaica. For example, the poverty line for a family of four is (depending on the method) 2.3 to 2.4 times that for a single adult in Nepal, versus 3.1 to 3.9 in Jamaica. The high returns to scale found in Nepal could result either from a high valuation of children or from relatively cheap child-speci c consumption. Given the sizable scale economy in the Nepal SPL, it should not be surprising that this greatly changes the demographic poverty pro le when compared to poverty lines that do not incorporate scale economies. This is con rmed in gure 2, which compares the poverty rates by household size implied by the previous objective poverty lines (table 8) with those based on our SPL.19 The per capita ‘‘objective’’ poverty line suggests that larger households tend to be poorer in both countries. This is also the case for the Jamaican poverty measures based on subjective poverty lines. However, for Nepal, the poverty measures based on our SPL tend to fall as household size increases, although not monotonically. The objective poverty lines indicate that single-person families are the least poor, while the subjective poverty lines for Nepal indicate that they are the poorest. As an aside on methodology, we also estimated our models using a probit estimator combining the ‘‘more than adequate’’ responses with the ‘‘just adequate’’ ones. The results were similar, which was to be expected given that very few households reported their consumption to be more 19 Using method (2), this choice made little difference. The relationship with household size was also similar for the poverty gap and squared poverty gap. The Social Policy Development Unit (1994) does not quote poverty measures by household size for Jamaica. We have calculated our own measures for gure 2. However, because the precise de nition of their expenditure aggregate is not given in Social Policy Development Unit, our expenditure aggregate gives a slightly different (higher) aggregate poverty measure. Full details are available from the authors.
470
THE REVIEW OF ECONOMICS AND STATISTICS TABLE 13.—HOUSEHOLD POVERTY LINES
BY
FAMILY COMPOSITION (IN JAMAICAN DOLLAR
AND
NEPALESE RUPIAH)
Method (1)
Jamaica one prime age man one prime age woman one prime age man plus one prime age woman one prime age man plus one prime age woman plus one male child one prime age man plus one prime age woman plus one female child one prime age man, one prime age woman, one male child, one female child Nepal one prime age man one prime age woman one prime age man plus one prime age woman one prime age man plus one prime age woman plus one male child one prime age man plus one prime age woman plus one female child one prime age man, one prime age woman, one male child, one female child
Method (2)
Family Size
Poverty Line
Index
Poverty Line
Index
1 1 2 3 3 4
16187 9626 22428 36954 36138 50121
1.00 0.59 1.39 2.28 2.23 3.10
8096 5334 12680 22063 22216 31599
1.00 0.66 1.57 2.73 2.74 3.90
1 1 2 3 3 4
11985 10425 15397 22018 22971 28268
1.00 0.87 1.28 1.84 1.92 2.36
10129 9772 12878 19449 18574 23886
1.00 0.96 1.27 1.92 1.83 2.36
Note: All poverty lines are at the household level and should be compared with total household consumption. Poverty lines for method (1) and (2) were calculated on the basis of country-speci c average household characteristics (table 3).
than adequate and the fact that the derivation of the poverty line is based on the rst threshold only. IV.
Conclusions
Methods of poverty analysis have differed radically between the objective-quantitative and the subjectivequalitative schools, with little effort to learn from both. We have suggested a hybrid approach, building on past methods of subjective-welfare measurement, but adapted to a developing-country setting. It is difficult to believe one could get sensible answers to the usual MIQ in most developing countries. The method we have proposed here avoids the need for this question, but still allows one to retrieve the subjective poverty line from simple qualitative questions on perceived consumption adequacy added to an integrated household survey. We have implemented the approach using surveys for Jamaica and Nepal. The aggregate poverty measures implied by our subjective poverty lines accord quite closely with existing ‘‘objective’’ methods for both countries. The aggregate measures are also reasonably robust to whether one uses a single question on the perceived adequacy of food consumption versus a fuller set of consumption components. However, more-notable differences emerge in the geographic and demographic poverty pro les. The poverty measures by region are more sensitive than are the aggregates to the choice of method, although there is still considerable agreement on rankings. Interestingly, our subjective-qualitative approach does not tend to narrow the differentials in poverty measures between ‘‘poor’’ and ‘‘rich’’ areas. For example, our results suggest a larger difference in poverty measures between urban and rural areas than found by more-conventional objective approaches that are based on a concept of basic and absolute consumption needs. People in poor areas perceive themselves to be even poorer than objective comparisons suggest.
FIGURE 2—POVERTY AND HOUSEHOLD SIZE
MEASURING POVERTY USING QUALITATIVE PERCEPTIONS OF CONSUMPTION ADEQUACY
Other differences emerge in the demographic poverty pro le. Our subjective poverty lines indicate sizable scale economies in consumption, particularly for Nepal. Indeed, unlike commonly used ‘‘objective’’ methods, large households do not tend to be any poorer than small households in Nepal, when this is assessed by our objective poverty lines. REFERENCES Blaylock, James R., and David M. Smallwood, ‘‘An Alternative Approach to De ning and Assessing Poverty Thresholds,’’ Western Journal of Agricultural Economics 11 (1986), 100–105. Colastanto, D., Arie Kapteyn, and Jacques van der Gaag, ‘‘Two Subjective De nitions of Poverty: Results from the Wisconsin Basic Needs Study,’’ Journal of Human Resources 19 (1984), 127–138. Danziger, S., J. van der Gaag, E. Smolensky, and M. Taussig, ‘‘The Direct Measurement of Welfare Levels: How Much Does It Take to Make Ends Meet,’’ this REVIEW 66 (1984), 500–505. Deaton, Angus, and Salman Zaidi, ‘‘How to Construct a Consumption Aggregate from Household Survey Data,’’ Development Research Group, World Bank (1998). de Vos, Klaas, and Thesia I. Garner, ‘‘An Evaluation of Subjective Poverty De nitions: Comparing Results from the U.S. and the Netherlands,’’ Review of Income and Wealth 37 (1991), 267–285. Easterlin, Richard A., ‘‘Will Raising the Incomes of All Increase the Happiness of All?’’ Journal of Economic Behavior and Organization 27 (1995), 35–47. Foster, J., J. Greer, and E. Thorbecke, ‘‘A Class of Decomposable Poverty Measures,’’ Econometrica 52 (1984), 761–765. Groedhart, Theo, Victor Halberstadt, Arie Kaptein, and Bernard van Praag, ‘‘The Poverty Line: Concept and Measurement,’’ Journal of Human Resources 12 (1977), 503–520. Grosh, Margaret E., and Paul Glewwe, ‘‘A Guide to Living Standards Measurement Study Surveys and Their Data Sets,’’ Living Standards Measurement Study working paper no. 120, World Bank, Washington, D.C. (1995). Hagenaars, Aldi J. M., The Perception of Poverty (Amsterdam: North Holland, 1986). Kapteyn, Arie, ‘‘The Measurement of Household Cost Functions: Revealed Preference versus Subjective Measures,’’ Journal of Population Economics 7 (1994), 333–350.
471
Kapteyn, Arie, Sara van de Geer, and Huib van de Stadt, ‘‘The Impact of Changes in Income and Family Composition on Subjective Measures of Well-Being,’’ in Martin David and Timothy Smeeding (Eds.), Horizontal Equity, Uncertainty, and Economic Well-Being (Chicago: University of Chicago Press, 1985). Kapteyn, Arie, Peter Kooreman, and Rob Willemse, ‘‘Some Methodological Issues in the Implementation of Subjective Poverty De nitions,’’ The Journal of Human Resources 23 (1988), 222–242. Lanjouw, Peter, Giovanna Prennushi, and Salman Zaidi, ‘‘Building Blocks for a Consumption-Based Analysis of Poverty in Nepal,’’ mimeograph, World Bank, Washington, D.C. (1996). Lanjouw, Peter, and Martin Ravallion, ‘‘Poverty and Household Size,’’ Economic Journal 105 (1995), 1415–1434. Lipton, Michael, and Martin Ravallion, ‘‘Poverty and Policy,’’ in Jere Behrman and T.N. Srinivasan (Eds.), Handbook of Development Economics, Vol. 3 (Amsterdam: North Holland, 1995). Pradhan, M., and M. Ravallion, ‘‘Measuring Poverty Using Qualitative Perceptions of Welfare,’’ policy research working paper no. 2011, World Bank, Washington, D.C. (1998). Ravallion, Martin, ‘‘Poverty Comparisons,’’ Fundamentals of Pure and Applied Economics vol. 56, (Chur, Switzerland: Harwood Academic Press, 1994). ——— ‘‘Poverty Lines in Theory and Practice,’’ LSMS working paper no. 133, World Bank, Washington, D.C. (1998). Ravallion, Martin, and Benu Bidani, ‘‘How Robust is a Poverty Pro le?’’ World Bank Economic Review 8 (1994), 75–102. Ravallion, Martin, and Michael Lokshin, ‘‘Self-Rated Economic Welfare in Russia,’’ mimeograph, World Bank, Washington, D.C. (1999). Runciman, W. G., Relative Deprivation and Social Justice (London: Routledge and Kegan Paul, 1966). Scitovsky, Tibor, The Joyless Economy (Oxford: Oxford University Press, 1978). Social Policy Development Unit, ‘‘Estimates of Poverty in Jamaica: For the Years 1992 and 1993,’’ Planning Institute of Jamaica, Kingston, Jamaica (1994). Stanovnik, Tine, ‘‘Perception of Poverty and Income Satisfaction: An Empirical Analysis of Slovene Households,’’ Journal of Economic Psychology 13 (1992), 57–69. van de Stadt, Huib, Arie Kapteyn, and Sara van de Geer, ‘‘The Relativity of Utility: Evidence from Panel Data,’’ this REVIEW 67 (1985), 179–187. van Praag, Bernard, ‘‘Ordinal and Cardinal Utility: An Integration of the Two Dimensions of the Welfare Concept,’’ Journal of Econometrics 50 (1991), 69–89.