COVER PHOTO ADOBE STOCK
DECEMBER 2016
1616 Rhode Island Avenue NW Washington, DC 20036 202 887 0200 | www.csis.org
The Changing Political Economy of Energy in China authors
Kang Wu Jane Nakano A REPORT OF THE
CSIS ENERGY AND NATIONAL SECURITY PROGRAM
Blank
DECEMBER 2016
The Changing Political Economy of Energy in China Market Dynamics and Policy Developments AUTHORS Kang Wu Jane Nakano
A Report of the CSIS ENERGY AND NATIONAL SECURITY PROGRAM
About CSIS For over 50 years, the Center for Strategic and International Studies (CSIS) has worked to develop solutions to the world’s greatest policy challenges. Today, CSIS scholars are providing strategic insights and bipartisan policy solutions to help decisionmakers chart a course toward a better world. CSIS is a nonprofit organization headquartered in Washington, D.C. The Center’s 220 fulltime staff and large network of affiliated scholars conduct research and analysis and develop policy initiatives that look into the future and anticipate change. Founded at the height of the Cold War by David M. Abshire and Admiral Arleigh Burke, CSIS was dedicated to finding ways to sustain American prominence and prosperity as a force for good in the world. Since 1962, CSIS has become one of the world’s preeminent international institutions focused on defense and security; regional stability; and transnational challenges ranging from energy and climate to global health and economic integration. Thomas J. Pritzker was named chairman of the CSIS Board of Trustees in November 2015. Former U.S. deputy secretary of defense John J. Hamre has served as the Center’s president and chief executive officer since 2000. CSIS does not take specific policy positions; accordingly, all views expressed herein should be understood to be solely those of the author(s).
© 2016 by the Center for Strategic and International Studies. All rights reserved.
Acknowledgments This report is made possible by general support to CSIS. No direct sponsorship has contributed to its publication. In addition, the authors wish to thank Sarah O. Ladislaw, senior fellow and director of the CSIS Energy and National Security Program, for her intellectual guidance, and Suzanne B.S. Freeman, program intern, for the editorial assistance.
Center for Strategic & International Studies 1616 Rhode Island Avenue, NW Washington, DC 20036 202-887-0200 | www.csis.org
Contents 1
CHAPTER 1 | Introduction
2
CHAPTER 2 | The “New Normal” of the Chinese Energy Economy
6
CHAPTER 3 | Changing Political Economy of Energy in China
15
CHAPTER 4 | Environmental Degradation and Climate Change
19
CHAPTER 5 | Energy Security Still Matters
28
CHAPTER 6 | Key Observations
30
About the Authors
| III
01 Introduction For the last decade, energy markets around the world have been influenced by the rapid rise in Chinese energy consumption. Global and regional energy markets for nearly all energy resources have been affected by the pace and scale of Chinese consumption—especially of oil and coal, but also wind, solar, and nuclear. As China enters a new phase in its economic development, it does so from its position as the largest energy-producing and -consuming country in the world. Just as the energy sector in China was shaped over the last decade by the need to fuel the unrelenting pace of economic growth, it is now being shaped by China’s need to transition its economy to the next stage of economic and social development. China’s main challenge is to shift away from energy-intensive, export-led growth to a less energy-intensive economy led by the service sector. This transition is coupled with the need to ameliorate the energyrelated air, land, and water pollution that poses serious challenges to the quality of life in China, and also to take strong measures to reduce emissions in the fight against global climate change. However, this new normal does not mean that China’s longstanding concerns about security of supply have gone away. China will remain a net energy importer, and given the size of its energy consumption and capacity for external investment, will still have an important role in shaping energy markets going forward, especially in its immediate region. This report provides an overview of China’s energy balance and the various energy-related priorities at play. Whether and how China can successfully navigate this next stage will have important implications for investors, neighboring countries, and energy markets. The objective of China’s energy transition is to have an economy where domestic consumption is the primary driver of growth, energy use is efficient and clean, market forces play a bigger role in all major energy sectors, carbon emissions reach a plateau, and the issue of energy security is elevated to include both supply and environmental security. It is not an easy transition and will thus be a prolonged process. Things to watch and questions to ask are: How far are the Chinese leaders willing and able to liberalize the energy markets? How successful will China be in raising the share of nonfossil energy to cap total carbon emissions by 2030? Will gas replace coal quickly and sufficiently enough for China to both reach peak emissions and allow for projected continuous growth of oil consumption? How will China view and achieve energy security during the transition? What are the implications of China’s overseas energy investment and the promotion of the One-Belt, One Road (OBOR) initiative? This report will explore these issues and questions using the latest energy sector data, forecasting, and policy analyses.
|1
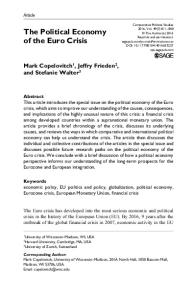
02 The “New Normal” of the Chinese Energy Economy After decades of double-digit economic growth driven by energy-intensive, export-led industrial activity, the Chinese economy has downshifted to a slower rate of growth and is transitioning to a new economic structure. These changes, along with other policy imperatives, will lead to slower growth in Chinese energy consumption. China has a large economy, the result of almost four decades of unprecedented economic growth. Over the last quarter of a century, China’s real GDP grew ten-fold from US$1.0 trillion in 1990 to US$10.9 trillion in 2015 (measured in constant 2015 U.S. dollars). A few years ago, China overtook Japan to become the second-largest economy in the world after the United States. In 2015, China accounted for 15 percent of the world’s GDP, which was still significantly below the share of 24.5 percent held by the United States, but well ahead of 5.6 percent for Japan, the third-largest economy. 1 Until recently, China’s officially reported real GDP growth registered an average of at 9.8 percent per annum since China opened up its economy in the late 1970s. More recently, China reported lower growth rates of 7.3 percent in 2014 and then 6.9 percent in 2015 (Figure 1). This decline in GDP growth rates is driven by a confluence of factors: slowdown in population growth, urbanization rates, and a transition to a consumption-led economy where China is running out of steam to expand its exports as it did for decades in the past. Maintaining high levels of growth has been an important policy objective for Chinese government officials. In recent years Chinese policymakers and party leaders have come to understand that slower growth rates are to be expected both because of the stage of economic development China has reached but also because of the slowdown in population growth that has been experienced and is expected to continue, leading to the lowering of official government growth targets. For example, the economic slowdown has now become a reality to be reflected in China’s official short-term economic planning. In the 13th Five-Year Program (13FYP),2 released in
1
International Monetary Fund (IMF), “World Economic Outlook Database,” April 2016, https://www.imf.org/external/pubs/ft/weo/2016/01/weodata/index.aspx. 2 The document is formally known as the Outlines of the 13th FYP for the People’s Republic of China’s National Economy and Social Developments and is available at http://www.gov.cn/xinwen/201603/17/content_5054992.htm.
2 | Kang Wu and Jane Nakano
March 2016, the Chinese government set 6.5 percent as an average annual growth rate. This figure is the first target below 7 percent 3 in China’s history of issuing such targets. 4
Constant 2015 US$ trillion
Figure 1:
Total GDP and Real GDP Growth in China, 2000–2015
12
15%
11
14%
10
13%
9
12%
8
11%
7
10%
6
9%
5
8%
4
7%
3
6%
2
5% 00 01 02 03 04 05 06 07 08 09 10 11 12 13 14 15 Total GDP
Real GDP Growth
Source: CNBS, PFE.
China’s Energy Mix under Various Economic Development Scenarios/Forecasts Under the base-case scenario, 5 China’s real GDP is expected to be 6.7 percent for 2016 but shift to a low gear of an average annual growth rate (AAGR) of 6.3 percent over 2017–2020, and then to 5.5 percent between 2020–2030. This AAGR projection, however, does not preclude a likelihood that the Chinese economy may shift to an even lower gear. Under the low-case scenario, China is expected to have an AAGR of 4 percent during the 2016–2030 period, as opposed to 5.6 percent under the base-case scenario or 6.2 percent under the high-case scenario (Figure 2). Under the base-case scenario, energy growth is led by nonfossil energy, particularly nuclear power, hydroelectricity, wind power, solar power, and biomass power (Figure 3). The share of fossil energy in China’s total primary energy consumption (PEC) is set to decline, in which 3
The GDP growth rate targets were 7 percent under 10FYP (2006–2010) and 7.5 percent under 11FYP (2011– 2015). 4 The Chinese GDP growth data are questionable to a certain extent. The real growth is likely to be lower than the official growth. In other words, the absolute levels of China’s official GDP growth rates as well as its targets may be irrelevant at times. What is important is the trend. 5 FGE, FGE Databooks Spring 2016 (Honolulu, Hawaii: FGE, April 2016).
The Changing Political Economy of Energy in China | 3
natural gas will have the longest period of growth, compared to coal, which might have reached its peak demand already, and oil whose peak demand will come much earlier than gas.
Real GDP Growth (Percent)
Figure 2:
8.5
China’s Real GDP Growth Under Different Scenarios
Base Case
Low Case
High Case
7.5 6.5 5.5 4.5 3.5 2.5 2010-2015
2015-2020
2020-2025
2025-2030
Source: FGE.
4.5
80%
4.0
70%
3.5
60% 50%
3.0
40%
2.5
30%
2.0
20%
1.5
10%
1.0
2005 2010 Coal Gas Nuclear Non-Commercial
Note: 2016-2030 data are projections. Source: FGE.
4 | Kang Wu and Jane Nakano
2015
2020
2025
2030
Oil Hydro Solar/Wind/Other Renewables PEC
Share
PEC (billion tonnes of oil equvalent or btoe)
Figure 3: Outlook for Primary Energy Consumption (PEC) and Shares of Individual Sources to 2030, Base-Case Scenario
Under the low-case scenario, China is likely to have a notably lower PEC growth in the future corresponding to slower economic growth (Figure 4). Alternatively, China may still have a chance to see its PEC pent up under the high-case scenario where the real GDP growth accelerates with greater difficulties to lower the energy intensity. Figure 4:
Outlook for China’s PEC under Different Scenarios Base Case
Low Case
High Case
4.5 4.3 4.1 PEC (btoe)
3.9 3.7 3.5 3.3 3.1 2.9 2.7 2.5 2010
2015
2020
2025
2030
Source: FGE.
Over the next 10 to 15 years, these forecasts indicate that the gap between PEC and primary energy production (PEP) will widen further to 13.0 mmboe/d 6 by 2020 and 17.2 mmboe/d by 2030. Accordingly, the total energy import dependence ratio is forecast to rise from 14 percent in 2015 to 18 percent in 2020 and 21 percent by 2030. Regardless of the pace of economic growth, China will continue to depend on energy imports and, therefore, energy security will remain an important consideration in China’s energy policymaking.
6
Mmboe/d stands for millions of barrels of oil equivalent per day.
The Changing Political Economy of Energy in China | 5
03 Changing Political Economy of Energy in China While the economic transition will change the rate of growth and fuel composition of China’s energy consumption, China’s political economy is also influenced by changing policy priorities, as shown in the country’s latest five-year program. 7
The 13th Five-Year Program: Main Elements Related to Energy Economy Economic reform has been the main theme of China’s political economy for nearly four decades, since the end of the 1970s. Developing and reforming the economy have been the top priority for the ruling Chinese Communist Party (CCP). Each year, the State Council (equivalent to the U.S. cabinet) approves a policy paper submitted by the National Development and Reform Commission (NDRC)—formerly the State Planning Commission— focusing on the issues of economic reform. It is also the NDRC that oversees the core energy policy affairs and their implementation, as China does not have a single ministry for energy policies. The 13th Five Year Program (13FYP), which was passed by the National People’s Congress— the Chinese parliament—on March 16, 2016, provides national development guidelines, strategies, and policies for 2016–2020. The key social, economic, and energy goals under the 13FYP, shown below, indicate that the government commitment to improving energy usage and environmental situations remains intact (Figure 5): •
Grow GDP from 67.7 trillion yuan (US$10.5 trillion) in 2015 to over 92.7 trillion yuan (US$14.4 trillion in constant 2015 U.S. dollars) with an average annual growth rate (AAGR) of 6.5 percent;
•
Increase service sectors (Tier III) in total GDP from 50.5 percent in 2015 to 56 percent;
•
Raise the urbanization rate from 51.5 percent in 2015 to 56.0 percent;
•
Reduce carbon intensity by 18 percent;
•
Reduce energy intensity by 15 percent;
7
The Chinese government modified the title of its five-year planning documents from the “five-year plan” to the “five-year program” starting with the 13th version.
6 | Kang Wu and Jane Nakano
•
Increase the share of nonfossil fuels in China’s PEC mix from 12 percent in 2015 to 15 percent; and
•
Reduce sulfur emissions by 15 percent and NOx emissions by 15 percent. Figure 5:
A Comparison of Main Targets under China’s 12FYP and 13FYP
Main Indicators
AAGR of Real GDP Urbanization Rate Reduction of Carbon Intensity Reduction of Energy Intensity Share of Non-Fossil Energy in Total PEC Reduction of Sulfur Emissions Reduction of NOx Emissions
12th FYP (2011-2015)
13th FYP (2016-2020)
7.0 percent 6.5 percent From 47.5 percent to 51.5 percent From 51.5 percent to 56.0 percent 17 percent 18 percent 16 percent 15 percent From 8.3 percent to 11.4 percent From 12.0 percent to 15.0 percent 8 percent 15 percent 10 percent 15 percent
Note: AAGR = average annual growth rate for consumption. Source: Complied from the official 13FYP.
Also, insofar as China’s energy policies are dominated by policies for individual energy sectors (e.g., coal, oil and gas, petrochemicals, power, and conservation), the 12FYP and 13FYP are similar. Additionally, the 13FYP document lays out the following nonquantitative key elements concerning energy: •
•
Establish modern energy systems for China by the following means: o
deepening revolutions in the energy sector,
o
promoting energy production innovations,
o
optimizing energy supply structure,
o
raising the efficiency of energy use,
o
establishing modern energy systems that are clean and low carbon as well as reliable and efficient, and
o
ensuring the nation’s energy security.
Upgrade and optimize energy structures by the following means: o
coordinating between hydroenergy development and ecological protection,
o
continuing development of wind and photovoltaic power,
o
supporting solar photovoltaic power,
The Changing Political Economy of Energy in China | 7
o
developing nuclear power with indigenous technologies,
o
accelerating advanced biomass, tidal energy, and geothermal development,
o
optimizing and establishing integrated national energy supply bases,
o
promoting green development,
o
restructuring large-scale coal mines and encouraging new technologies for coal mining,
o
strengthening onshore and offshore oil and gas exploration and development, and opening exploration blocks in an orderly fashion,
o
developing natural gas, coal-bed methane, tight oil, and shale gas,
o
promoting the transformation and upgrading of the refining industry,
o
starting up and implementing action plans to upgrade specifications for refined products, and
o
expanding the use of biofuels as new oil products.
While these elements are somewhat instructive for suggesting the direction of reform for individual sectors or fuels, many of these goals will become meaningful only when more specific targets are set. The targets, which are currently being finalized by the NDRC, are expected to be announced by the end of 2016. The 13FYP also aims to establish modern energy storage and transportation systems for coal, power, oil, gas, and other energy sources. It calls for speeding up the construction of energy storage, reserves, and peak-load infrastructure, and establishing modern energy storage/reserve and transportation networks that are interlinked, open, and secure. The document also emphasizes the importance of strengthening interregional energy transportation networks. Additionally, energy technologies and projects are among those featured as major and mega projects under the 13FYP, which is more ambitious than earlier five-year plans in terms of the country’s desire to become an innovation and technology leader in the world. 8 In fact, the 13FYP lists approximately 75 priority technologies—compared to 57 under the 12FYP—and each of these 75 technology areas includes a range of specific technologies and products. 9 For example, energy storage and distribution, and new-energy vehicles (NEV), are among six general areas of “strategic emerging industries” that the officials see to propel the country’s next phase of industrial modernization and technological development. For example, the
8
Scott Kennedy and Christopher K. Johnson, Perfecting China, Inc.: The 13th Five-Year Plan (Washington, DC: CSIS, May 2016), 27, https://csis-prod.s3.amazonaws.com/s3fs-public/publication/ 160521_Kennedy_PerfectingChinaInc_Web.pdf. 9 Ibid.
8 | Kang Wu and Jane Nakano
2020 target for NEVs under the 13FYP is to have 5 million NEVs on road. It is worth nothing that China broadly defines NEVs as including all types of electric cars as well as LNG (liquefied natural gas), CNG (compressed natural gas), hybrid (powered by gasoline as primary power), solar, and other new-energy vehicles; however, NEVs promoted under the 13FYP refer only to electric cars, particularly battery electric vehicles and plug-in hybrid electric vehicles. Among these major and mega projects under the 13FYP, those concerning energy are (1) efficient smart-power system; (2) use of coal that is efficient and clean; (3) renewable energy; (4) nuclear power; (5) unconventional gas; (6) corridors for energy transportation; (7) infrastructure for energy reserves; and (8) key energy technologies, including fourthgeneration nuclear technologies and ultra-super critical coal power. Developing and commercializing these technologies have become an important agenda under the latest economic vision and the government has reportedly budgeted RMB500 billion (US$75.8 billion) to spend on those promoted under the 13FYP in 2016—where energy-related technologies are just one of the many categories. 10 Such demonstrated levels of focus and support indicate China’s emergence as a major supplier of some of these energy technologies in the global marketplace. Nuclear is a case in point. China’s nuclear industry, which enjoys both a robust domestic expansion and the status of a strategic industry for exports, has been busy marketing its nuclear technologies abroad to compete with the established technology suppliers. About a dozen agreements are in place with countries around the world, ranging from Argentina to the United Kingdom, which may push China to become a leader in the global nuclear industry. 11 As in the past, energy conservation is also a high priority. The 13FYP calls for a society-wide campaign to conserve energy, and sets 5 billion tons of coal equivalent as the ultimate target of energy use for China by 2020. Based on the FGE reference case forecast, the 2020 primary energy consumption goal is likely to be achievable.
Market and Nonmarket Forces Impacting Chinese Political Economy of Energy The country’s latest direction in its economic reform and energy-sector reform is clearly stipulated in the 13FYP, but some of the priorities warrant further discussion.
Structural Shift in Economy Changes in China’s economy are not limited to the ones brought about by a natural economic slowdown but also by government measures to aid the transition. The country’s energy intensity (i.e., energy consumption per unit of GDP) is decreasing as the government has instituted structural changes in its economy. China has made significant strides in reducing energy intensity since its economic opening under Deng Xiaoping in the late 1970s. 10
Ibid. World Nuclear Association, “Nuclear Power in China,” October 2016, http://www.worldnuclear.org/information-library/country-profiles/countries-a-f/china-nuclear-power.aspx.
11
The Changing Political Economy of Energy in China | 9
For example, the energy intensity declined by 80 percent between 1980 and 2015. Also, China delivered an 18.6 percent reduction in its energy intensity during the 12FYP (2011– 2015), against the announced target of 16 percent for this period. As of 2015, however, China had the third-highest energy intensity in the world—just behind India and Russia, significantly higher than Japan and the United States, and over 50 percent higher than the world average. 12 The latest push for reducing energy intensity centers around shifting China’s economic structure away from the energy-intensive sector to the less-intensive sector. The Chinese economy is broadly and officially divided into three tiers: Tier I includes agriculture and related sectors, Tier II includes all industrial sectors, and Tier III contains the service sectors. Over the last decade, the industrial sector has experienced the fastest rate of growth at 10.4 percent, compared to 10.3 and 4.1 percent for the service and agriculture sectors. 13 However, this is beginning to change. In fact, the recent economic slowdown is driven in large part by a slowdown in industrial growth. During 2015, the year-over-year growth of the industrial sector was 6 percent—the lowest since 1990—while the service sector was the fastest-growing segment of the economy at 8.3 percent. 14 More importantly, in 2015, the share of the service sector passed the 50 percent mark for the first time in history and reached 50.5 percent of GDP, up from 32 percent in 1990. In the same year, the industrial and agricultural sectors accounted for 41 percent and 9 percent, respectively. Under the 13FYP, the government’s target is to raise the share of the service sector in total GDP to 56 percent. While the structural shift is likely carried out to serve multiple purposes— including the alleviation of manufacturing overcapacity as well as energy intensity reduction—Chinese economic growth is expected to be less energy intensive going forward as the service sector is less energy intensive than the industrial sector. The outcome of this transformation will be a significant determinant for the success of the 15 percent target for reducing energy intensity under the 13FYP (2016–2020). While there appears a general consensus that China’s energy demand will grow more slowly in the future, the extent of such slowdown and its impact on the Chinese energy sector are harder to ascertain, given that the extent of economic slowdown and the success of structural reform are far from clear. For example, the uncertainty over the extent of slowdown in the Chinese economic growth as well as the state of global economy in the near future—which affects the demand for goods and services that originate in China—could render questionable the achievability of the 6.5 percent growth rate without extensive government intervention. A resultant, steeper slowdown in economic growth can in turn
12
BP, BP Statistical Review of World Energy 2016 (London: BP, June 2016), https://www.bp.com/content/dam/ bp/pdf/energy-economics/statistical-review-2016/bp-statistical-review-of-world-energy-2016-full-report.pdf; International Monetary Fund (IMF), “World Economic Outlook Database,” April 2016; Population Reference Bureau (PRB), “2015 World Population Data Sheet,” August 2015, http://www.prb.org/pdf15/2015-world-population-datasheet_eng.pdf. 13 China National Bureau of Statistics (CNBS), Indicators of National Accounts (in Chinese), August 31, 2016, http://data.stats.gov.cn/tablequery.htm?code=AD02. 14 China National Bureau of Statistics (CNBS), “2015 National Economic and Social Development Statistics Bulletin” (in Chinese), February 29, 2016, http://www.stats.gov.cn/tjsj/zxfb/201602/t20160229_1323991.html.
10 | Kang Wu and Jane Nakano
suppress the country’s energy demand. Another major uncertainty concerns the future of state-owned enterprises (SOEs). Their traditional preference for infrastructure investment and their predominance in many energy-intensive industries, particularly oil and gas, do not make the success of structural transition a foregone conclusion.
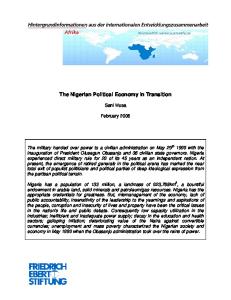
Reforms of State-Owned Enterprises in the Oil and Gas Sector Until the “open-door” policy of 1978, energy policy was part of China’s overall planning economy; also, the formulation of energy policy was heavily rooted in the Soviet-style central planning system, which was adopted in the early 1950s, as well as the “self-reliant” development system, which was adopted in the early 1960s. As China began its sweeping economic reforms in the late 1970s, the government came to officially recognize the importance of energy and the salience of meeting the country’s huge energy requirements for China’s ability to realize its ambitious economic targets. Consequently, the government embarked upon energy-sector reforms in the early 1980s. Since then, the Chinese government’s term for the economy has evolved from a “socialist commodity economy” to a “socialist market economy” today. The latter term assumes that state corporations can act as profit-making entities under loose government guidelines. Since the 1990s, this policy has led to the transformation of China’s energy state-owned enterprises (SOEs) from pure implementers of government plans to active market participants. This process has been accelerated by China’s entry into the World Trade Organization (WTO) at the end of 2001. After decades of development, China has a large and well-established oil industry, which plays an important role in China’s national economy and social development. The oil and gas sector in China has gone through many years of reforms with organizational and structural changes, deregulations, and market developments. However, China’s oil and gas business remains dominated largely by the three major national oil companies (NOCs): China National Petroleum Corporation (CNPC) and its publicly listed subsidiary PetroChina; China Petrochemical Corporation (Sinopec) and its publicly listed subsidiary Sinopec Corp.; and China National Offshore Oil Corporation (CNOOC) and its publicly listed subsidiary CNOOC Ltd. 15 These parent NOCs—CNPC, Sinopec, and CNOOC—are fully owned by the Chinese government and are supervised by the State-Owned Assets Supervision and Administration Commission (SASAC) of the State Council.
15 The Chinese petroleum industry has a long history of institutional changes and reform. With regards to the three NOCs, CNOOC was established in 1982, Sinopec in 1983, and CNPC in 1988. The establishment of CNPC was an outcome of state effort to separate government regulatory functions from business operations. The major reorganization of the Chinese oil industry that has shaped the structure today took place in 1998. This reorganization involved ownership transfers of enterprises between CNPC and Sinopec, and reestablishment of these two giants that survived to date. Since the 1998 reorganization, the two integrated companies, CNPC and Sinopec, have further consolidated their assets, while CNOOC has expanded its downstream petrochemical activities and the LNG business. During the 1999–2001 period, all three NOCs also formed full-fledged stock companies and launched initial public offerings (IPOs). The structures of these three NOCs have largely remained to date.
The Changing Political Economy of Energy in China | 11
Figure 6:
China’s Crude Oil and Natural Gas Production by Company, 2015
Crude Oil Production CNOOC 22.2%
CNPC/PetroChina 51.9%
Others 6.5%
Sinopec 19.4%
Note: Total output was 4.3 million barrels per day. Source: International Petroleum Economics.
Natural Gas Production Others 4.4%
CNOOC 9.7%
Sinopec 15.0%
CNPC/PetroChina 70.9%
Note: Total output was 13.0 billion standard cubic feet per day. Source: International Petroleum Economics.
12 | Kang Wu and Jane Nakano
Figure 7:
China’s Refining (Crude Distillation) Capacity by Company at the End of 2015 CNOOC+ Sinochem 7.1%
CNPC/PetroChina 27.4%
Others 25.6%
Sinopec 39.9%
Note: Total capacity was 14.5 million barrels per day. Source: FGE
In the upstream sector, the production of both crude oil and natural gas is dominated by the three NOCs (Figure 6). For example, in 2015, CNPC/PetroChina, CNOOC/CNOOC Ltd., and Sinopec Corp. accounted for more than 93 percent of China’s crude oil production (of some 4.3 million barrels per day)—and near 96 percent of gas production (of 13.0 billion standard cubic feet per day). 16 Meanwhile, the refining sector is now dominated by Sinopec and CNPC/PetroChina (Figure 7). At the end of 2015, Sinopec owned about 40 percent of China’s total refining capacity at 14.1 mmbd, while CNPC/PetroChina owned about 27 percent. 17 CNOOC and its local Chinese partners owned 5 percent, and Sinochem along with its local Chinese partners 2 percent. 18 The remaining 26 percent is owned by local governments and private Chinese companies. 19 The reform of SOEs has been on the agenda for some time, and the latest round of SOE reforms began with the inauguration of the government of President Xi Jinping and Premier Li Keqiang in 2013. The latest SOE reform concerning oil and gas, as well as electric power, is to reduce the scope of monopoly of the SOEs in these areas in order to increase competition among the companies. The government aims to open up competitive business to nonstate participants and expand the room for private and nonstate business so as to break up
16
FGE, FGE Databooks Spring 2016. Ibid. 18 Ibid. 19 Ibid. 17
The Changing Political Economy of Energy in China | 13
administrative monopoly by SOEs, but progress in both sectors has been relatively slow and limited. In the oil sector the five designated state oil trading companies still monopolize crude oil trading, but from the second half of 2015, the Chinese government began giving permits to independent refining (or “teapot”) companies that are owned by local or municipal governments to allow them to import crude oil to refine into products. 20 At the same time, the government urged the NOCs to divest in nonessential areas, for example, for CNPC/PetroChina to sell parts of its pipeline assets and for Sinopec to create mixed ownership of at least one of its subsidiaries. CNPC/PetroChina may also spin off some of its oil-field service companies. In the upstream sector, the government is experimenting on opening up certain conventional oil and gas fields in the remote Xinjiang Autonomous region. In the natural gas sector, the government is gradually opening up the LNG-importing business to independent players. 21 The NDRC also urged the three NOCs to allow access by independent players to their existing LNG import terminals if they have spare capacity. The government is also in the process of opening up shale gas exploration and development to nonstate oil companies. However, all these processes are still ongoing and may be prolonged or interrupted. A full liberalization of the gas market is still many years off. The state, through the NOCs, continues to exercise a significant influence on the oil and gas industry, ranging from upstream exploration, development, and production to midstream pipelines and other means of energy transportation to downstream oil refining, and oil and gas retail marketing. During the past couple of years, the oil and gas industry’s reform has accelerated to reduce the monopolistic power of the NOCs, but the progress is uneven and lacks coordination. Currently, the Chinese government is mulling over the final version of an official guidance for reforming China’s petroleum and gas governing regimes, which could include the following provisions: a separation of oil and gas pipelines from the Chinese majors to establish independent pipeline companies; the merging of residential sector gas prices with those of nonresidential sectors; further opening of the upstream sector; and promotion of mixed ownerships (i.e., state and nonstate ownerships) in all segments of the oil and gas business. The timeframe for release of the final document is unclear but many in industry expect reforms to be gradual and contain a compilation of plans and programs already underway. It will likely stop short of a full liberalization of gas prices or a complete spin-off of the pipeline assets from the Chinese NOCs because of the resistance of these majors and the concern of the top political leaders over social stability. This will mean that the role played by the NOCs will continue to be essential for the Chinese oil and gas sector going forward.
20
Fereidun Fesharaki and Kang Wu, “Letters from Beijing II: China’s De-monopolization Strategy I: Oil Refining and Teapots (Unintended Consequences),” Chairman’s Corner (Honolulu, Hawaii: FGE, May 2016). 21 Fereidun Fesharaki and Kang Wu, “Letters from Beijing III: China’s De-monopolization Strategy II: Private LNG Imports Pros and Cons (Unintended Consequences),” Chairman’s Corner (Honolulu, Hawaii: FGE, May 2016).
14 | Kang Wu and Jane Nakano
04 Environmental Degradation and Climate Change Rapid economic growth has come at the expense of severe degradation of the natural environment in the country. China, which consumed less than half of the primary energy consumed by the United States in 2000, has risen to be the world’s largest carbon dioxide (CO2) emitter in 2007, and the largest energy user in 2009. The qualitative degradation of air, land, and water now poses a persistent threat to the lives and well-being of Chinese people. For example, total sulfur dioxide (SO2) emission in China increased by 53 percent between 2000 and 2006. 22 Also, outdoor and household air pollution are considered accountable for over 2 million premature deaths, and average life expectancy in China is reduced by almost 25 months due to poor air quality. 23
Air Pollution and China’s “War on Pollution” As the situation has worsened, environmental mitigation has become a crucial challenge for the country’s political leadership. Against the background of growing public awareness over the adverse environmental consequences of the country’s rapid economic growth, official acknowledgments of the environmental plight have culminated into the issuance of the Action Plan for Air Pollution Prevention and Control in 2013 as well as the notable declaration of a “war on pollution” by Chinese Premiere Li Keqiang in March 2014. The action plan included various measures, such as the phase-out of coal-fired boilers and industrial furnaces, and technology retrofits in key industries, including steel, cement, and petrochemical, in an effort to reduce emissions intensity by over 30 percent by 2017 compared with 2012. 24 Also, the action plan mandated nationwide upgrade by the end of 2017 of vehicle sulfur concentration standards on a par with those in Europe, Korea, and Japan—the most stringent values in the world. 25 Moreover, in an effort to address ineffective implementation and enforcement, two chronic areas of weakness in China’s vast energy sector, the central government revised the country’s Environmental Protection Law in April 2014 to tighten the punishments for individuals that commit environmental wrongdoings, including higher fines, detentions, and criminal 22 Zifeng Lu et al., “Sulfur dioxide emissions in China and sulfur trends in East Asia since 2000,” Atmospheric Chemistry and Physics 10, no. 13 (July 2010): 6311–31, http://www.atmos-chem-phys.net/10/6311/2010/. 23 International Energy Agency (IEA), Energy and Air Pollution: World Energy Outlook Special Report (Paris: IEA, 2016), https://www.iea.org/publications/freepublications/publication/ WorldEnergyOutlookSpecialReport2016EnergyandAirPollution.pdf. 24 Ibid. 25 Ibid.
The Changing Political Economy of Energy in China | 15
charges. Also, local officials found guilty of misconduct, including data falsification and failure to publicize environmental information required under the law, may now be demoted or fired. Yet, the transition to a low-carbon future is a long road and air pollution is a formidable challenge, as exemplified by Beijing’s issuance of the “red alert” in early December 2015, when the Air Quality Index (i.e., daily concentrations of PM2.5 and PM10,26 and other pollutants) in Beijing reached 308—“hazardous” by the U.S. standard. 27 Also, the construction of coal-to-gas conversion plants, which had been suspended due to concerns over its net pollution risk, water impact, and economic viability, has resumed since spring 2016 as the government seeks a soft landing for the coal sector. 28
Push for Nonfossil Fuels under the 13FYP Nuclear power development has accelerated since the early 2000s due to the rapid growth of power demand and measures to promote it as a noncarbon-emitting source of electricity. As of June 2016, there were 30 nuclear reactor generators in operation, with a combined capacity of 28.4 gigawatts (GW). 29 In 2015, the share of nuclear power in China’s PEC exceeded 1 percent for the first time. Moreover, a total capacity of at least 27.6 GW is under construction and more is approved and being planned. According to the government plans, such as National Mid-to-Long Program for Nuclear Power Industry Development (2011– 2020) and the Action Plans for Energy Development Strategies 2014–2020, China could have 58 GW of installed nuclear power capacity by 2020—a reasonable target given the current pace of construction. Additionally, China has been aggressive in promoting the development of other forms of low-emission energy such as wind power, solar power, and biofuels. In fact, China was the top investor in clean energy in 2015, spending US$110.5 billion—a 17 percent increase from 2014. 30 At the start of 2016, China had the world’s largest installed wind- and solar-powergenerating capacity at around 129 GW—nearly one-third of the global share—and 43 GW, respectively. Despite the fast capacity buildup, however, in recent years China has suffered from low utilization of the wind farms and solar power since only limited power can be connected to grids due to their remote locations and the low demand growth for power for the country as a whole. To address the issue, the NDRC has begun requiring national power grid companies to purchase the minimum hours of wind power necessary for the power
26
PM 2.5 and PM 10 are particulate matter 2.5 and 10 micrometers in diameter, potentially causing serious health damage. 27 Edward Wong, “Smog So Thick, Beijing Comes to a Standstill,” New York Times, December 8, 2015, http://www.nytimes.com/2015/12/09/world/asia/beijing-smog-pollution.html?_r=0. 28 Kathy Chen and David Stanway, “China resumes environmental approval of coal-to-gas projects,” Reuters, May 20, 2016, http://www.reuters.com/article/us-china-coal-gas-idUSKCN0YB0UD. 29 Kang Wu, “Nuclear Power in China: An Update,” FGE China Energy Series—Gas Edition 100 (June 8, 2016). 30 Jennifer MacDonald, “Clean Energy Defies Fossil Fuel Price Crash to Attract Record $329bn Global Investment in 2015,” Bloomberg, January 14, 2016, https://data.bloomberglp.com/bnef/sites/4/2016/01/BNEF-2015-AnnualInvestment-Numbers-FINAL.pdf.
16 | Kang Wu and Jane Nakano
generators to earn the set internal rate of return. 31 Beyond the minimum hours, wind power needs to compete for grid connections. While this policy helps wind and solar power to a certain extent, it does not fundamentally improve their utilization rates. It remains to be seen if the government can come up with additional policy measures to lessen the threat of air pollution under the 13FYP timeframe.
Climate as an Emerging Policy Area in Its Own Right Climate change has also emerged as an important issue for China. In fact, controlling environmental pollution had become increasingly difficult in the absence of control over the country’s overall energy use, particularly of fossil energy. Yet, China’s leaders have come to realize that often carbon reduction strategies and policies can have complementary benefits of reducing local air pollutants as well. Consequently, the Chinese government has become increasingly serious about controlling carbon emissions through the capping of fossil energy in the coming years. The shift in posture has led to the Chinese decision to reduce its carbon emissions intensity by 40–45 percent by 2020 against the 2005 levels, as announced in November 2009—only a month before the world leaders gathered in Copenhagen, Denmark, to discuss the best path forward for the post-Kyoto Protocol global efforts to address climate change at the UN Climate Conference (the so-called “COP 15”).
Emissions Trading System One of the more notable measures adopted by China in its effort to control carbon emissions is the carbon trading system. Following the launch of pilot programs for carbon trading in seven provinces and cities in 2013 (Beijing, Shanghai, Guangdong, Shenzhen, Tianjin, Hubei, and Chongqing), China has decided to take it to the national level, starting in 2017. The nationwide emissions trading, first mentioned in the U.S-China joint communique of September 2015 and reiterated by Chinese President Xi Jinping at the COP21 meeting in Paris, in December 2015, is considered very challenging to successfully formulate and administer. Moreover, though it will help, it is often questionable whether the carbon-trading scheme can effectively restrain carbon emissions any time soon. The main reasons are twofold. For one, China is new to this and it will take time to fully establish any carbontrading scheme. For another, carbon tariffs need to be high enough to be effective in reining in carbon emissions but China is unlikely to impose such high carbon tariffs, at least not initially. Under any circumstances, it is likely to take many years to see the real impact of a carbon-trading system on the country’s emission controls but China is moving in the right direction. The year of 2016 is considered critical for preparation of the launch of the nation-side carbon trading and relevant government agencies have been busy at work. For example, the NDRC has ordered all provinces, state-owned companies, and others that are under its supervision to prepare themselves for the launch in 2017. Also, the NDRC has identified emission-intensive sectors, such as petrochemicals, chemicals, building materials, steel, 31
National Development and Reform Commission (NDRC), “Regulatory Provisions Regarding Guaranteed Purchase of Minimum Renewable Energy Power” (in Chinese), March 28, 2016, http://www.nea.gov.cn/201603/28/c_135230445.htm.
The Changing Political Economy of Energy in China | 17
nonferrous metals, paper mills, electric power, and aviation, as targeted industries. The nationwide trading aims to bring into the system all companies that individually emitted 10,000 tons or more of carbon for any year during the 2013–2015 period. China now aims to cap its overall carbon emissions by 2030, and the commitment under the 13FYP to reduce carbon intensity by 18 percent by 2020 (against the 2005 level) constitutes an important component of the larger aim. The 2030 emissions cap, first pledged by President Xi Jinping during his talk with President Obama following the Asia-Pacific Economic Cooperation (APEC) meeting in Beijing in November 2014, has since been repeated numerous times. This is a tall order for China to meet, however, as capping the overall carbon emissions by 2030 would require, in our view, not only its coal use to peak definitively, but also its oil consumption to peak around 2035, followed by gas consumption peaking in the 2040s. In other words, this scenario will require China’s coal consumption to decline continuously to leave space for oil and gas use to grow after 2030. During this process, the most effective ways for China to achieve carbon-emissions goals are to restructure the economy continuously and to improve the efficient use of energy, coupled with carbon trading, stricter emission standards, and other protective measures.
18 | Kang Wu and Jane Nakano
05 Energy Security Still Matters China has been undertaking a range of efforts that aim to curve energy consumption growth. Yet, the sheer size of its economy and population render energy security a persistent concern to its policymakers.
Rising Import Dependence As the pace of China’s economic development moderates, its growth in energy consumption is also forecast to moderate. However, the PEC and import dependence are forecast to grow continuously for China, which until 1993 was a net exporter of oil, and until 2009 was a net exporter of coal. The position of net energy surplus China long enjoyed has reversed since the mid-1990s and the deficit is on track to expand. By 2015, China’s PEC exceeded its primary energy production (PEP) by 9.4 mmboe/d, 32 which translates into the total energy import dependence of 14.3 percent (Figure 8). This level of dependence is roughly triple the level in 2000 (4.6 percent) and 50 percent higher than the 2010 level (10.4 percent). 33 Figure 8:
3.5
China’s Growing Gap between PEC and PEP, 2000–2015 PEP
PEC
PEP/PEC (btoe)
3.0 2.5 2.0 1.5 1.0 00 01 02 03 04 05 06 07 08 09 10 11 12 13 14 15 Source: CNBS, FGE.
32
The actual imports in 2015 included 204 million tons (mmt) of coal (exports: 5 mmt), 7.8 million barrels per day (mmbd) of crude oil and refined products (exports: 786 kb/d), and 6 billion standard cubic feet per day (bscf/d) of natural gas (exports: 0.3 bscf/d). 33 FGE, FGE Databooks Spring 2016.
The Changing Political Economy of Energy in China | 19
The shift has been particularly pronounced for oil. For most years since 1970, China was a net oil (crude and products) exporter until 1993, and a net crude oil exporter until 1996. Even today, the country ranks fourth in total crude oil production after Saudi Arabia, Russia, and the United States, and second in both consumption of petroleum products and capacity of refinery distillation after the United States. Driven by the transportation, petrochemical, and residential sector demands, however, China’s use of petroleum products has been growing rapidly for the past two decades while the country’s output from domestic production has been outpaced by demand, forcing it to become increasingly dependent on imported oil since the early 1990s. Specifically, China’s net oil imports as a share of total oil consumption increased from 7 percent in 1995 to 44 percent in 2005 and 67 percent in 2015—the highest among all types of energy in China (Figure 9). This trend is likely to be irreversible as China’s domestic oil production is expected to decline gradually mainly due to production declines in aging fields, particularly the Daqing oil field, 34 while production increases from fields offshore China, as well as from the Ordos and Tarim basins, have been inadequate to make up for the lost volume. One measure undertaken by the Chinese government in an effort to address its growing import dependence was to establish strategic petroleum reserves (SPRs). After a decade of consideration and preparation, the SPR program was launched in the early 2000s. As of September 2016, China has four SPR sites under Phase I and another seven sites under Phase II completed, amounting to a total of 234 million barrels of capacity—all in the form of crude oil—representing roughly 26 days of net oil imports based on the 2015 net import level. Another two sites under Phase II, totaling 75 million barrels of capacity, are under construction. In the meantime, work for Phase III has started, though none is under construction yet. With the completion of Phase III, China’s total SPR capacity may exceed 540 million barrels, which may be an equivalent of over 60 days of net oil imports by 2020. 35 China has a target to have reserves equivalent to 90 days of net oil imports by 2020. However, it remains unclear what types of reserves other than SPRs—for example, nongovernment-held petroleum product reserves—may be accounted for into the future target. A shift has been equally notable for coal, which has long dominated both energy production (67 percent) and supply (60 percent) mixes in China. China’s net coal import level has rapidly grown over the past decade, as fuel was dominant in both the power-generation and industrial sectors. For the past decade, the Chinese government has been trying to limit coal use and promote other energy sources. These efforts have begun to see some successes in recent years. For example, the share of coal use in the residential sector has gone down dramatically, from 11 percent in 1995 to 5 percent in 2005 and less than 3 percent in 2015. 36 Use of coal in the industrial sector is also being replaced by cleaner energy fuels and by 34
Discovered in the late 1950s, the Daqing maintained output at above 1 mmbd for over 20 years, but its production fell below 800 k/d by 2015; it may decline to below 650 kb/d in 2020 and below 500 kb/d in 2030. 35 The 60-day net equivalent estimated is made by FGE, based on its projection for China’s oil demand and domestic production levels in 2020. 36 FGE, FGE Databooks Spring 2016.
20 | Kang Wu and Jane Nakano
electricity, which is generated from a variety of sources including coal itself. For instance, the share of direct coal burning in the industry is estimated to be 20 percent in 2015, down from 32 percent in 1995 and 22 percent in 2005. 37 While the government effort to reduce coal dependency has seemingly led to the decline of coal imports from an all-time high of 327 million tons (mmt) in 2013, to 204 mmt in 2015,38 the country’s dependence for imported coal is expected to continue as the decline in exports appears irreversible while the costcompetitiveness of the fuel sustains its attractiveness. Figure 9:
Crude Oil and Refined Product Exports and Imports for China, 1995–2015
1.0 Imports/exports (mmb/d)
(1.0) (2.0) (3.0) (4.0)
Product Imports Crude Imports Product Exports Crude Exports Net Oil Imports
(5.0) (6.0) (7.0)
2015
2014
2013
2012
2011
2010
2009
2008
2007
2006
2005
2004
2003
2002
2001
2000
1999
1998
1997
1996
1995
(8.0)
Source: Compiled from Chinese Customs.
Compared with coal and oil, the domestic market for natural gas demand and supply is much smaller. But, China is emerging as a key gas consumer and importer as natural gas has emerged as a fuel of interest among policymakers in recent years due to its lower environmental impact and attendant viability as an alternative to coal for power generation. For example, China recently surpassed Japan to become the largest natural gas consuming country in Asia. While the share of natural gas in China’s PEC has been on a steady growth, from 2.5 percent in 2002, to 3.8 percent in 2010, to 5.7 percent in 2015, the use of gas is significantly limited against the world average (23.8 percent) or the Asia-Pacific region’s average (11.5 percent). 39 Moreover, China’s total gas consumption in 2015 of 20 billion 37
Ibid. FGE, China Oil Monthly, September 2016, https://www.fgenergy.com/services-products/oil-gasservices/china-oil-service/china-oil-monthly.aspx. 39 BP, BP Statistical Review of World Energy 2016. 38
The Changing Political Economy of Energy in China | 21
standard cubic feet per day was some 10 percent below the target set by the government under the 12FYP. 40 The main reason for this discrepancy was strong competition from coal, which easily beats gas economically—for power generation in particular. Although the government has a high target, the policy support for gas consumption was not sufficient, and since late 2014, the gas-pricing policy has also been unsupportive of demand as prices stay high. As such, it remains highly uncertain whether the share of natural gas can rise to 10 percent of its PEC by 2020, as stipulated under the 13FYP. While the government is keen on increasing gas production (including unconventional gas) and consumption dramatically as the fuel can help reduce the country’s dependence on coal, China’s gas imports appear to be on a healthy growth trajectory. In 2015, China consumed 193 bcm of natural gas,41 of which nearly one-third was imported—from Turkmenistan and Kazakhstan via pipelines (accounting for 57 percent of the gas imports) and LNG from suppliers around the world (representing the remaining 43 percent of the imports). Of the two types of gas imports, LNG deserves special attention (Figure 10). China only became an LNG importer in 2006—much later than Japan (1969), Korea (1986), and Taiwan (1989)—but imports have grown rapidly, up from under 1 mmt in 2006 to 9.4 mmt in 2010 and 19.9 mmt in 2014. In 2015, China’s import of LNG had a rare decline because of the weak energy demand. It imported 19.7 mmt of LNG, or 8 percent of the global LNG market, ranking as a third in Asia after Japan (37 percent) and Korea (15 percent). Since the beginning of 2016, China’s LNG imports has risen again and are expected to resume the double-digit growth, partially driven by the long-term LNG contracts signed by Chinese NOCs in the past.
40
FGE, FGE Databooks Spring 2016. Kang Wu and W. Huang, “China’s Gas Market: Review of 2015 and a Look Ahead Towards 2016/2017,” China Energy Series: Gas Edition 96 (January 11, 2016). 41
22 | Kang Wu and Jane Nakano
Figure 10:
China’s LNG Imports, 2006–2015
24.0 20.0
LNG imports (mmt)
16.0 12.0 8.0
Others* PNG Yemen Malaysia Indonesia Qatar Australia
4.0 2006
2007
2008
2009
2010
2011
2012
2013
2014
2015
*Abu Dhabi, United States, Oman, Algeria, Nigeria, Trinidad & Tobago, Egypt, Equatorial Guinea, Russia, Peru, Angola, and others.
Source: Complied from Chinese Customs.
Implications of Low Oil Prices As a major energy consumer and importer, China is not insulated from the economic and energy impacts of the recent dramatic changes in global oil prices and their implications may be wide-ranging for the Chinese economy. On the positive side, low oil prices have resulted in lower imports of oil in dollar amount, stimulating GDP growth—albeit moderately—as well as facilitated efforts by the Chinese government to reform the country’s tax and fiscal systems. In fact, low oil prices provide a rare opportunity for the government to reform its tax and fiscal systems and the oil price regime. The government has already begun undertaking such reforms by raising consumption taxes on gasoline and diesel three times since November 2014. 42 Low oil prices have also resulted in lower imported LNG prices for China. Taking this opportunity, the Chinese government completed the final step of its three-step plan for reforming natural gas prices for nonresidential use by merging the two price tiers into one on April 1, 2015, and lowered prices on November 20, 2015. Prices for the residential sector are set at lower levels by the government at present, but the plan is to merge them with prices of the nonresidential sector in a couple of years. A negative implication for the Chinese economy, however, is that low oil prices have increased fear of deflation. Also, low prices have reduced the profit margins for Chinese oil and gas companies and thus investment toward domestic energy output, particularly oil and gas production, leading to lower contributions from these sectors to China’s GDP growth. 42
The consumption taxes were raised on November 28 and December 13, 2014, as well as on January 12, 2015.
The Changing Political Economy of Energy in China | 23
Additionally, low oil prices pose a challenge for the Chinese government to carry out some of its environmental policies and targets as low prices stimulate demand for fossil fuels and hamper incentives to conserve, though the impact may vary from one fuel to another. Low oil prices may also accelerate the import dependence as low oil prices hamper domestic oil production by reducing capital and operational expenditure available to Chinese producers while also making imported oil comparatively cheaper. The opportunity, however, is that low oil prices reduce the cost of China’s ongoing effort to fill up its strategic petroleum stocks as well as give Chinese companies opportunities to acquire more overseas energy assets, though the situation is more complicated than simply cheap assets may suggest.
China’s Global Energy Investments and the OBOR Initiative Energy trade is an important element of China’s energy and economic policy as a net importer of all forms of hydrocarbon resources. Investments in overseas energy, particularly oil and gas, have been led by the major Chinese NOCs—including those dominant in the domestic upstream and midstream mentioned earlier, sovereign wealth funds, and financial institutions. Although overseas investments are linked to China’s energy security as well, the decision to pursue individual projects has often been made by individual companies, which also have their own agenda and global ambitions. Since the late 1990s, China’s cumulative energy investments have amounted to more than US$170 billion in various segments of the oil and gas sectors globally. In particular, during half a decade before the collapse of global oil prices in 2014, China’s overseas oil and gas upstream acquisitions totaled approximately US$115 billion. 43 Consequently, by 2015, China’s equity oil production from overseas operations reached an all-time high of 2.3 mmbd, equivalent to 53 percent of China’s domestic production of some 4.3 mmbd, 44 from 450 kb/d in 2005 (equivalent of 12 percent of domestic production) and 1.3 mmbd in 2010 (equivalent to 31 percent of China’s domestic production). 45 The Chinese oil investment is around the world, with heavy concentrations in Africa, the Middle East, Latin America, and North America (Figure 11). As Chinese companies continue to expand their overseas investments, they are turning to areas such as shale gas, deepwater drilling, Canadian oil, as well as the oil and gas potential in the Arctic.
43
Julie Jiang and Chen Ding, Update on Overseas Investments by China’s National Oil Companies: Achievements and Challenges since 2011 (Paris: IEA, 2014), 35–38, https://www.iea.org/publications/freepublications/ publication/PartnerCountrySeriesUpdateonOverseasInvestmentsbyChinasNationalOilCompanies.pdf. 44 FGE, 26th Annual Pacific Insiders Briefing, September (Singapore: FGE, September 2016). 45 Ibid.
24 | Kang Wu and Jane Nakano
Figure 11:
China’s Overseas Equity Oil Production by Region in 2015
Middle East 22%
Africa 27%
FSU 20%
North America 9% Asia 1% Europe 6%
Latin America 15%
Note: Total is 2.3 mmb/d, estimated by FGE. Source: Compiled from various sources.
In recent years, China’s outbound energy upstream investment has slowed down for several reasons. First and foremost, the collapse of global oil prices since the second half of 2014 has reduced the profit margins of Chinese NOCs and, as a result, their capital spending budgets. Specifically, PetroChina saw its net profit decline by 67 percent on year in 2015, to 35.5 billion yuan (US$5.28 billion) 46 and a 98 percent decline to 531 million yuan (US$80 million) in the first half of 2016 47; at the same time, CNOOC saw its net profit decline by 66.4 percent a year to 20.2 billion yuan (US$3.1 billion) in 2015. 48 The steep decline in net profit levels has led the two major oil producers to reduce capital expenditures in the first half of 2016 by 17.5 percent (PetroChina) and 33 percent (Cnooc). 49 Meanwhile, low feedstock prices have somewhat moderated the profit decline for Sinopec, the largest oil refiner in the world, at 8.9
46
Brian Spegele, “PetroChina Net Profit Plunged Nearly 70% in 2015,” Wall Street Journal, March 23, 2016, http://www.wsj.com/articles/petrochina-net-profit-plunged-nearly-70-in-2015-1458728573. 47 Aibing Guo, “China Oil Giants Unmoved by Bull Rally after Worst Earnings,” Bloomberg, August 24, 2016, http://www.bloomberg.com/news/articles/2016-08-24/china-oil-giants-unmoved-by-bull-rally-after-worstever-earnings. 48 Xinhua, “CNOOC profits plunge on lower oil prices,” March 24, 2016, http://news.xinhuanet.com/english/201603/24/c_135220286.htm. 49 Guo, “China Oil Giants Unmoved by Bull Rally after Worst Earnings.”
The Changing Political Economy of Energy in China | 25
percent in 2015 50 and 22 percent in the first half of 2016. 51 Yet, Sinopec, too, saw its capital spending declined, by 40 percent, to 13.5 billion yuan (US$2 billion) in the first half of 2016. 52 Additionally, the wave of corruption investigations across the energy sector since 2013 has led to companies to refrain from undertaking energy investments that by nature tend to be large in monetary value and thus prone to attracting scrutiny from concerned authorities. Since China continues to depend on hydrocarbon imports, the outbound upstream investment will remain important to China and the country may resume its investment activities as the oil price recovers or the price volatility as well as the anticorruption campaign are perceived to be over. Yet, the focus of Chinese outbound energy investment may be shifting to midstream and downstream projects in the coming years under the auspices of The Silk Road Economic Belt and the 21st-Century Maritime Silk Road, or so-called “One Belt, One Road” (OBOR) initiative. Formally introduced by the Chinese government in March 2015, 53 the OBOR has been strongly endorsed and championed by Chinese President Xi Jinping, who first raised the idea in fall 2013 when visiting Central Asian and South Asian countries. While no authoritative and definitive geographical definition is available, the “Silk Road Economic Belt” generally refers to the economic zone from China through Central Asia and Russia to Europe, through Central Asia and West Asia to the Persian Gulf and the Mediterranean, and to Southeast Asia, South Asia, and the Indian Ocean. The geographical coverage under the “Maritime Silk Road” generally extends from Chinese ports through the South China Sea to the Indian Ocean with an extension to Europe and through the South China Sea to the South Pacific. Since the launch of the OBOR initiative, the Chinese government has expanded the areas of coverage to include more provinces and cities inside China and additional countries and regions around the world. Building up infrastructure along the onshore and maritime silk roads is a main feature of the OBOR where energy is an important area, including oil, gas, coal, and electricity. For example, energy is featured in all six economic corridors under the OBOR 54 and either Chinese or China-led financial institutions have financed some of these infrastructure projects. Of particular note are the Silk Road Fund, established in December 2014 with a registered capital of US$40 billion, and the Asian Infrastructure Investment Bank (AIIB), 50
Oceana Zhou, “China’s Sinopec expects steady throughput, 5% lower crude output in 2016,” S&P Global Platts, March 30, 2016, http://www.platts.com/latest-news/oil/hongkong/chinas-sinopec-expects-steady-throughput5-lower-27408416. 51 Aibing Guo, “Sinopec Profit Slips as Oil Crash Drags Down Refining Gains,” Bloomberg, August 28, 2016, http://www.bloomberg.com/news/articles/2016-08-28/sinopec-profit-slips-as-refining-fails-to-counter-oil-scrash. 52 Ibid. 53 Ministry of Commerce, “Vision and Actions Outlined on Jointly Building Silk Road Economic Belt and 21st Century Maritime Silk Road” (in Chinese), March 30, 2015, http://zhs.mofcom.gov.cn/article/ xxfb/201503/20150300926644.shtml. 54 The six economic corridors and the types of energy projects featured are China-Pakistan Economic Corridor (e.g., LNG terminal and gas pipeline), China-Mongolia-Russia Economic Corridor (e.g., oil and LNG, gas pipelines, and processing), the New Euro-Asia Continental Bridge (energy transportation), Bangladesh-China-India Economic Corridor (infrastructure), China and Indo-China Peninsula Economic Corridor (e.g., oil and gas pipelines, trade, new energy, and renewable energy), and China-Central Asia-West Asia Economic Corridor (e.g., gas pipelines, energy development, and energy trade).
26 | Kang Wu and Jane Nakano
formally founded in January 2016 with a registered capital of US$100 billion, of which China’s share is 29.78 percent. The Silk Road Fund is set up specifically for the OBOR initiative while AIIB is closely related to the OBOR initiative. Below are some of the examples of energy deals related to the OBOR initiative: •
Yamal LNG project. In December 2015, the Silk Road Fund provided a US$12 billion, 15year loan to Novatek and acquired 9.9 percent stake in the Russian company’s US$27.5 billion, 16.5 million tons per annum (mta) Yamal LNG Project; the lead shareholder is Novatek with 50.1 percent, followed by France's Total and CNPC at 20 percent each. This follows two 15-year loans of US$10.6 billion and US$1.5 billion provided in April 2015, by the Export-Import Bank of China and the China Development Bank, respectively.
•
China-Central Asia Gas Pipeline, Line D. In September 2013, China signed intergovernmental agreements with Uzbekistan, Tajikistan, and Kyrgyzstan to build the fourth line—a 1,000-km line with a transmission capacity of 30 bcma—for the estimated cost of US$10 billion. The construction is reportedly on hold.
•
Gwadar-Nawabshal LNG Terminal & Pipeline project. Part of the China-Pakistan Economic Corridor scheme, the LNG terminal and pipeline project was signed in April 2015 for an estimated total value of US$46 billion; the project to build an LNG terminal in the Balochistan province and a gas pipeline between Iran and central Pakistan was announced in October 2015.
•
Refinery project at Yanbu. In January 2016, the joint-venture refinery project between Sinopec and Aramco became operational at Yanbu, Saudi Arabia. Although this is a commercial project between state-owned Saudi Aramco and Sinopec of China, Saudi Arabia is one of the important countries identified by China on the OBOR routes.
•
Clean energy projects. In March 2016, China General Nuclear Power Corporation (CGN) acquired 13 gas-fired power projects in five countries along the OBOR (Malaysia, Egypt, Bangladesh, UAE, and Pakistan) from Edra Global Energy Bhd of Malaysia for US$2.3 billion. The acquisition raised CGN’s overseas installed capacity to 8.85 GW.
In sum, the wealth of hydrocarbon resources in the countries along the OBOR routes, combined with the highest level of political support for the OBOR initiative within China, is providing new impetus for the Chinese oil companies, particularly the NOCs, to revive their overseas energy investment. The companies will receive the highest support from the Chinese government, some new funds, and reasons to initiate new projects. However, ultimately the Chinese oil companies need to have the financial strength to do big energy investments at the time of low oil prices. As such, it will require some time before the quantitative and qualitative effects of the OBOR initiative on China’s overseas energy investment are seen.
The Changing Political Economy of Energy in China | 27
06 Key Observations China’s energy economy has gone through a remarkable transition in the past few decades. Once a net exporter of coal, and self-sufficient in oil and natural gas, China has emerged as a leading energy importer in the world. The transition is far from over, though with different characteristics and drivers today. Marked by economic slowdown and environmental challenges, China strives to navigate the current period of uncertainty in the global energy market by shifting its economic structure to one that is much less energy intensive than before as well as meeting its energy needs for sustained economic growth. A few key observations arise from the examination of China’s changing political economy of energy, including the economic slowdown, rising import dependence, role of SOEs, emergence of environmental and climate awareness, and new context for China’s outbound energy investments. •
The Chinese economy has entered a low gear of growth since 2014. Also, the structure of the Chinese economy is changing, away from heavy industries and toward the service sectors. These economic and policy forces will slow the growth of its energy demand in the future.
•
China’s energy policies have long been dominated by policies for individual energy sectors, that is, coal, oil and gas, power, hydro, renewables, as well as energy conservation. The situation is likely to continue for the foreseeable future because each of these sectors is huge with a long history. As such, China is in urgent need of coordinated policies for the energy sector as a whole, so as to avoid conflicts of policy goals and measures, and to achieve the overriding targets more effectively.
•
China’s oil and gas business is dominated largely by the three major NOCs, but the role of independent players is expanding. The outcomes of ongoing efforts to reform SOEs significantly affect the future of energy sector in China. The progress has varied from area to area, with each facing challenges of its own. Overall, it is too early to say that the Chinese government is determined to fully liberalize the oil and gas market and significantly reduce the monopolistic power of SOEs. The process leading to these destinations will be long and tortuous.
•
China is facing severe air, soil, and water pollution. The major challenge is the sheer scale of energy use in China and the dominance of fossil fuel. China has been slow to make effective climate policies to deal with the issue of carbon emissions. To cap carbon emissions by 2030, coal use has to reach the peak now or soon, oil consumption growth has to slow down by 2030 and peak during the mid-2030s, while gas consumption continues to flourish in the long run.
28 | Kang Wu and Jane Nakano
•
As China’s PEC is increasingly exceeding its PEP, the country’s import dependence is on the rise. While China’s coal imports may be heading down, driven by its environmental and climate concerns, the country will continue to import larger volumes of oil and natural gas at least for the next decade.
•
Energy plays a key role in China’s OBOR initiative. Building up infrastructure along the onshore and maritime silk roads is a main feature of the initiative where energy— including oil, gas, coal, and power—is an important area. Moving forward, while OBOR will remain an important vision under the leadership of Xi Jinping, it will take many years to see the real effect on the pace and scope of China’s outbound investment.
The Changing Political Economy of Energy in China | 29
About the Authors Kang Wu has over 20 years of energy research and consulting experience and has been with FGE since the early 1990s. He conducts studies of energy policies, security, demand, supply, and trade focusing on oil, gas, and market developments in the Asia-Pacific region. Dr. Wu has responsibilities over FGE’s Asia operations in general and supervises the company’s China energy (oil and gas) practices in particular. His China work covers a variety of issues related to China’s economic, energy (with a special emphasis on oil and gas), and environmental developments. In 2003, Dr. Wu testified before the U.S.-China Economic and Security Review Commission on Capitol Hill in Washington, D.C., on the impact of China’s energy sector and market developments on the rest of the world. In 2013, he was appointed as an honorable adviser to a prestigious petroleum research institute in China. He holds Ph.D. and M.A. degrees in economics from University of Hawaii at Manoa and a B.A. in international economics from Peking University. Dr. Wu was a visiting fellow (1991–1993), fellow (1993– 2010), and senior fellow (2010–2013) at the East-West Center in Honolulu, Hawaii. Jane Nakano is a senior fellow in the Energy and National Security Program at the Center for Strategic and International Studies (CSIS) in Washington, D.C. Her areas of interest include U.S. energy policy, global oil and gas markets, energy security issues in Asia, and global nuclear energy trends. She frequently writes and speaks on these issues at conferences and to the media. Also, she has testified before Congress on energy issues in Asia. Prior to joining CSIS in 2010, Ms. Nakano was with the U.S. Department of Energy (DOE) and served as the lead staff on energy engagements with China and Japan. She was responsible for coordinating DOE engagement in the U.S.-China Strategic Economic Dialogue, U.S.-China Energy Policy Dialogue, and U.S.-Japan Energy Dialogue. She also worked on U.S. energy engagement with Indonesia, North Korea, and the Asia-Pacific Economic Cooperation forum. From 2001 to 2002, she served at the U.S. embassy in Tokyo as special assistant to the energy attaché. Ms. Nakano graduated from Georgetown University’s School of Foreign Service and holds a master’s degree from Columbia University’s School of International and Public Affairs.
30 | Kang Wu and Jane Nakano
Blank
COVER PHOTO ADOBE STOCK
DECEMBER 2016
1616 Rhode Island Avenue NW Washington, DC 20036 202 887 0200 | www.csis.org
The Changing Political Economy of Energy in China authors
Kang Wu Jane Nakano A REPORT OF THE
CSIS ENERGY AND NATIONAL SECURITY PROGRAM