Challenging Glass 3 – Conference on Architectural and Structural Applications of Glass, Bos, Louter, Nijsse, Veer (Eds.), TU Delft, June 2012. Copyright © with the authors. All rights reserved.
Tensile Loading of Silicone Point Supports – Revisited Anneliese Hagl Test-Ing+ Material GmbH, Germany, www.test-ing-material.de Oliver Dieterich A. Hagl Ingenieurgesellschaft mbH, Germany, www.a-hagl-ingenieure.de Dr. Andreas Wolf Dow Corning GmbH, Germany,
[email protected] Sigurd Sitte Dow Corning GmbH, Germany,
[email protected] An advanced high performance silicone film adhesive is ready to be exploited for challenging glazing applications. This silicone adhesive differs in many aspects from conventional silicones as it provides transparency and superior mechanical characteristics. Furthermore, the transparent silicone material shows the tendency of loosing transparency in highly loaded operating conditions (“stress whitening”). Due to these specific characteristics, comparisons of the mechanical performance of the film adhesive with commercially available structural sealants for glass façades are of major interest. The paper compares the performance of conventional, gungrade silicone sealants with that of the novel silicone film adhesive for bonding point supports on glass by evaluating various load schemes and bond thicknesses. Keywords: Bonded Point Support, Point Support, Silicone Sealant Glazing (SSG), Transparent Structural Silicone Adhesive (TSSA)
1. Introduction During the last decades the performance, application and appearance of structural silicone glazing (SSG) applications showed continuous but small improvements. Now – with the launch of a new transparent structural silicone adhesive [1] – an advanced high performance silicone material is ready to be exploited for challenging glazing applications. This silicone film adhesive differs in many aspects from conventional silicone sealants by combining excellent transparency and superior mechanical characteristics. The adhesive material is based on a heat-curing one-component material produced in thin sheets ready for application. Thus – compared to conventional silicone adhesives – the bond thickness is much smaller. Due to these specific characteristics, comparisons of the mechanical performance with conventional structural sealants widely introduced into the market for glass façades are of major interest. The transparent silicone film adhesive shows the tendency of loosing transparency in highly loaded operating conditions. This unique feature allows tracing the spread of the loading within the material on a local level up to the point of failure with increasing loads In addition, this phenomenon of changing transparency is
Challenging Glass 3
reversible i.e. the transparency is regained by unloading which can be demonstrated by adequate cyclic test procedures. From previous test campaigns on circular point supports bonded with a widely available two-component conventional silicone adhesive for SSG applications it is known that for point supports of 50 mm diameter the cohesive failure of the silicone material initiates in an annular zone that falls between approximately 30% and 60% of the point support radius. The stress whitening observed with the transparent silicone film adhesive allows monitoring of this behavior based on the change in transparency. 2. Next Generation of SSG Sealants – Transparent Structural Silicone Adhesive (TSSA) The TSSA material is manufactured as a film adhesive of 1 mm nominal thickness. The one-part material is based on a heat-activated addition-cure mechanism that requires temperatures of 120°C-130°C for a period of 20-30 min. During the curing process a pressure of typically 0.15-1.3 MPa is applied e.g. in an autoclave as used for the production of laminated glass. The following characteristics of the cured silicone film adhesive are presented in [1]: Table 1: Typical properties of cured silicone film adhesive (extracted from [1]). Property
Test Method
Typical Value
Unit
Indentation Hardness
JIS K 6253 [2] Durometer
70
JIS A
100% Modulus
JIS K 6251 [3] (dumbbell #3)
4.0
MPa
Young’s Modulus
ISO 527 Parts 1 and 2 [4, 5]
9.3
MPa
Max. Tensile Strength
JIS K 6251 (dumbbell #3)
9.0
MPa
Elongation at break
JIS K 6251 (dumbbell #3)
250
%
Tear Strength
JIS K 6252 [6] (crescent specimen)
35
N/mm
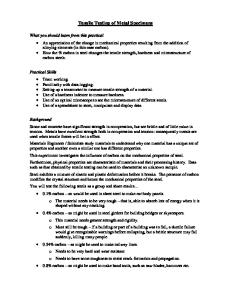
The physical properties of the silicone film adhesive show a low dependency on temperature. Furthermore, the structural silicone film adhesive combines high transparency, strong adhesion performance, thermal stability and excellent weatherability as reported in [1]. The TSSA material shows stress whitening when subjected to significant loads, e.g., during dog-bone tests, as can be seen in Figure 1. On the other hand, dog bone testing does not show any peculiarities with respect to the stress-strain relationship as it displays the typical elongation and failure behavior observed for elastomers. The stress whitening phenomenon occurs for loads below the ultimate failure load and it is typically not related to a special loading scheme. Stress-whitening is well understood for thermoplastic materials as it is related to micro-cracking (crazing), however, for elastomers it is less understood and interpreted as related to micro-void formation at the polymer/filler interface [7]. The whitening phenomena was reported in reference [1] as starting at loads of around 2.0-2.5 MPa regardless whether the specimen was subjected to tensile or shear load schemes and independent of the test temperature. Furthermore,
Tensile Loading of Silicone Point Supports – Reviewed
the stress whitening phenomenon is reversible i.e. it disappears and re-appears under cyclic loading histories.
Figure 1: Transparent structural silicone adhesive (TSSA) dog-bone tests: Stress-whitening of specimen.
3. Point Support Results for Conventional Structural Silicone Adhesives The behavior of point supports based on conventional two-component structural silicone sealants was investigated and presented in detail in several papers, see for instance references. [8, 9]. In contrast to dog bone tests the stress-strain curves show three distinct phases in case of continuously increasing loads, as shown in Figure 2: The initial phase features high stiffness and fully functional adhesive, the second phase shows a significantly lower stiffness obviously related to some kind of micro-damage in the adhesive material and the third and final – phase is related to total rupture of the specimen. Furthermore, the experimental results lead to the hypothesis suggesting that macroscopic breakage obviously starts in an annular range of 30%-60% of the total radius for point supports of 50 mm diameter and 5 mm bonding thickness as indicated in Figure 3. Load - N
3000
region 3
2000
Phase 1
Phase 3
Beginning of macro cracks at an inner circle
Finally the core fails
region 2
1000 region 1
Phase 2 Displacement - mm
0 0
1
2
3
4
5
Figure 2: Tensile test characteristics of d=50 mm point support bonded with conventional silicone sealant (thickness 5 mm).
Crack-progress to inside and outside
Figure 3: Point support failure hypothesis of conventional silicone sealant.
4. Experimental Results for TSSA Bonded Point Supports Primary application fields identified for the market penetration of TSSA are point supports in their multiple design varieties. Initial experimental and analytical activities are related to circular point supports of 20 mm, 50 mm and 80 mm diameter in order to cover a large range of potential applications. As TSSA is provided as a film of 1 mm thickness, the baseline bond thickness of the point support specimens was selected as
Challenging Glass 3
one layer of TSSA. Nevertheless – in order to study the effect of bonding thickness variations –samples were laminated also for 3 mm thickness corresponding to three layers of TSSA. The experimental campaign comprised tensile, shear and eccentric shear loading schemes which introduces additional bending moments, see Figure 4. Special attempts were made in the test set-up in order to keep the adhesive visible for monitoring its transparency during the tests in order to allow identification of the whitening phenomenon by synchronizing the video stream from a web cam to the load versus deflection curve. The lever arms for the eccentric shear tests were varied between 29 mm and 49 mm length for the point supports of 50 mm diameter and between 26 mm and 46 mm length for 20 mm diameter. Although additional tests were performed with respect to durability and cyclic loading histories, this paper reports test results without considering water immersion and cyclic loading, since the results were not significantly be influenced by aging. Video Extensiometer
Measurement plane
Test load Support of specimen in testing machine
Fixing in testing machine Video Extensiometer
Measurement plane
Test load
Support of specimen in testing machine Test load with eccentricity Ex1 = 29 mm Ex2 = 39 mm Ex3 = 49 mm
Support of specimen in testing machine
1 18 Support of specimen in testing machine
Figure 4: Experimental set-up for tension, shear and eccentric shear tests.
Tensile Loading of Silicone Point Supports – Reviewed
Nevertheless, the whitening point did not appear in all tests performed. Obviously, rapid crack growth masked the appearance of the whitening point for two of the investigated test configurations: shear applied to 50 mm and to 80 mm diameter point supports. Point supports of large diameter exposed to shear only show a behavior where the whitening point could not be observed. Nevertheless, the terminus “shear only” is not totally appropriate as the load is introduced at the metal section of the point support with an offset of at least half of the adhesive thickness with respect to the adhesive center plane. Interestingly, the offset eccentric introduction of bending tensile stresses allows a clear observation of the whitening phenomenon. Furthermore, it should be noted that the appearance of the whitening phenomenon within the test campaign is not linked to water immersion or cyclic load histories. The ratio of the load level related to the occurrence of the whitening phenomenon as compared to the ultimate failure load is compiled in Table 2 for the baseline tests (without water immersion and load cycles). The number of specimens also is recorded so as to allow judgment of statistical robustness. Table 2: Comparison of whitening phenomena and ultimate load levels.
Test set-up: Tensile tests 20 mm diameter, 1 mm thickness 50 mm diameter, 1 mm thickness 50 mm diameter, 3 mm thickness 80 mm diameter, 1 mm thickness 80 mm diameter, 3 mm thickness
Whitening point observable observable observable observable observable
Number of specimens 10 8 4 4 2
Load ratio % 38 40 39 19 58
observable not observable not observable
10 10 4
32 n/a n/a
observable observable observable observable observable observable
5 4 3 3 3 4
24 25 32 33 30 29
Test set-up: Shear tests 20 mm diameter, 1 mm thickness 50 mm diameter, 1 mm thickness 80 mm diameter, 1 mm thickness Test set-up: Eccentric shear tests 26 mm offset, d=20 mm, t=1 mm 36 mm offset, d=20 mm, t=1 mm 46 mm offset, d=20 mm, t=1 mm 29 mm offset, d=50 mm, t=1 mm 39 mm offset, d=50 mm, t=1 mm 49 mm offset, d=50 mm, t=1 mm
As next step, the load curves of the tensile tests are investigated. When compared to conventional silicone bonding applications, the higher stiffness of the TSSA material in combination with the lower bond thickness results in a quite stiff bond. The compliances in the test set-up, e.g., in the attachments to the testing machine, are no longer negligible. In order to account for this behavior, video-extensometry was applied especially for the tensile tests. Nevertheless the resolution of the video-extensometer
Challenging Glass 3
also posed constraints for very stiff bond behavior and small displacements. In order to allow comparison of the different bond geometries the loading is plotted in Figure 5 as stresses σ versus strains ε for representative specimens of 20 mm, 50 mm and 80 mm diameter and bond thickness values of 1 mm and 3 mm.
σ =
Ftensile ATSSA
ε=
(1)
Δ tensile t TSSA
(2)
Although the ratio of bond thickness to diameter covers a large range from 1:20 to 1:80, the similarity of the curves is quite remarkable, which means that the impact of the free (unconstrained) surface of the TSSA that allows lateral contraction appears to be small. 6
Stress - MPa
5 4 20-Z
3
50-Z-1
2
50-Z-3 80-Z-1
1
80-Z-3
Strain 0 0
0.2
0.4
0.6
0.8
1
Figure 5: Representative tensile test characteristics of 20, 50, and 80 mm diameter point support of TSSA with thicknes of 1 and 3 mm. (Z: Tensile test)
Similarly, the shear test results were post-processed for specimens of 20 mm diameter, 50 mm diameter and 80 mm diameter – all specimens featuring 1 mm bond thickness.
τ=
Fshear ATSSA
(3)
γ =
Δ shear tTSSA
(4)
According to Figure 6, the shear behavior of point support configurations of 50 mm and 80 mm diameter show a high level of similarity, while deviations are visible for the 20 mm configuration as already explained before, the shear load is introduced at least with an offset of the bond thickness, which is nominally the same for all specimens. On the other hand, the resistance against bending due to this load introduction offset is smallest for the 20 mm configuration. The extraordinary behavior of the 20 mm shear test configuration was already highlighted in view of the appearance of the whitening phenomenon, which occurred for 20 mm point supports but not for the other configurations. For the eccentric shear tests, both shear stresses and maximum bending stresses are plotted versus the related strain measures in Figure 7. While the calculation of the shear stresses and strains is quite straight forward assuming simple shear relationships, maximum bending stresses obtainable using classical beam bending theory, i.e., assuming the interfaces to glass and steel remain planar but are rotated, lead to a linear strain distribution which can be derived by kinematic analysis assuming rigid glass and point support.
Tensile Loading of Silicone Point Supports – Reviewed 6
Stress MPa
5 4 3
20-S
2
50-S
1
80-S Strain
0 0
0.5
1
1.5
2
2.5
3
3.5
4
Figure 6: Shear test characteristics of 50 mm diameter point support bonded with TSSA.
Assuming linear stress-strain relationship which is an approximation for the hyperelastic behavior, the maximum (engineering) bending stress can be related to the bending moment by equation (5): As expected, bending stresses increase with increasing eccentricity, while shear stresses decrease accordingly. Such kind of results might allow assessing the applicability of mixed ultimate loads, governed by laws such as shown in equations (6) and (7).
σ =
M ecc F l ecc = WTSSA WTSSA
(5)
⎛ σ ⎜⎜ ⎝ σ max
2
⎞ ⎛ τ ⎟⎟ + ⎜⎜ ⎠ ⎝ τ max
2
⎞ ⎟⎟ = 1 ⎠
⎛ σ ⎜⎜ ⎝ σ max
(6)
n
⎞ ⎛ τ ⎟⎟ + ⎜⎜ ⎠ ⎝ τ max
n
⎞ ⎟⎟ = 1 ⎠
(7)
Bending Stress max - MPa
15.0 12.5 20mm - 26mm offset
10.0
20mm - 36mm offset 20mm - 46mm offset
7.5
50mm - 29mm offset 50mm - 39mm offset
5.0
50mm - 49mm offset
2.5 Bending Strain max 0.0 0.0
0.5
1.0
1.5
2.0
2.5
3.0
3.0
Shear Stress - MPa
2.5 20mm - 26mm offset
2.0
20mm - 36mm offset 20mm - 46mm offset
1.5
50mm - 29mm offset
1.0
50mm - 39mm offset 50mm - 49mm offset
0.5 Shear Strain 0.0 0
1
2
3
4
Figure 7: Eccentric shear test characteristics of 50 mm diameter point support bonded with TSSA.
In order to check the applicability of equation (6) and (7) for the point supports, the ultimate load levels in tension and shear are plotted in Figure 8. As the eccentric shear test results – with the test specimens experiencing both tensile and shear loads – do not fall within the set of results obtained in shear and tensile tests, it is obvious that equations (6) and (7) do not apply. The ultimate bending stresses plotted in Figure 7 for eccentric shear lead to the assumption that the limits are dominated by the bending
Challenging Glass 3
moment stresses and thus by the bending moments of the point supports – approximately independent from the eccentricity itself.
Shear Stress - MPa
10.0 shear
7.5
tension t=1 shear
tension t=3
5.0
eccentr. 1
eccentric shear
2.5
eccentr. 2 eccentr. 3
Tensile Stress - MPa
tension
0.0 0.0
2.5
5.0
7.5
10.0
12.5
15.0
17.5
Figure 8: Ultimate load conditions of tensile, shear and eccentric shear tests
5. Numerical Analysis of TSSA Point Supports As a first step, the hyperelastic material laws are derived from material tests of TSSA such as dog-bone tests (uni-axial loading schemes), equi-biaxial loading schemes and pure shear loading schemes. Hyperelastic material laws based on elastic energy principles adequately describe elastic non-linearities regarding stress-strain relationships but neglect plasticity and viscous flow phenomena which are related to load histories and load rates. In case of the monotonous loading of the test specimens, softening phenomena typically known as Mullins effect which are usually covered by a damage parameter need not be taken into account. The following results demonstrate that the behavior of TSSA can be adequately described by the Neo-Hooke material law for tensile strains up to 250% elongation in dog bone tests: The Neo-Hooke law relates the strain energy density W to the principal stretch ratios λi via the shear modulus G. For higher strains the extension of the Mooney-Rivlin material law by considering additional strain energy terms will easily improve the correlation but is considered not to be required within this research.
W=
(
)
G 2 λ1 + λ22 + λ32 − 3 2
(8)
Eng. stress - MPa
10 8 L006 10mm/min 6
L007 10mm/min L008 10mm/min
4
analytical 2 Eng. Strain 0 0
0.5
1
1.5
2
2.5
3
Figure 9: Comparison of dog bone experimental results with Neo-Hooke material law.
The various test configurations presented above were analyzed by means of FEA. Glass and metallic sections of the point supports are assumed to be very stiff compared to the
Tensile Loading of Silicone Point Supports – Reviewed
silicone material and thus treated as rigid. For both the whitening load levels (if identified) and the ultimate load levels, stress and strain distributions are of interest for comparison purposes. Nevertheless it has to be noted that the behavior in region 2 of the tensile test (and also region 3) is not covered by hyperelastic material laws. While the analysis of the stresses and strains related to the ultimate loads might give indications of the strength limits of the adhesive material, a comparison of the experimentally obtained whitening patterns with the calculated stress and strain distributions shall provide insight in the whitening phenomenon from a mechanical point of view. For the FE analysis of tensile tests, axisymmetry can be assumed for the solution and thus 2D axisymmetric FE models or – if not available – a small wedge of a 3D model with adequate boundary conditions taking into account axisymmetry are adequate for analysis. Figure 10 presents the tensile stress distributions in half cross sections of the 50 mm diameter point supports with thicknesses 1 mm and 3 mm for load levels corresponding to the appearance of the whitening. Due to the axisymmetry the stress states depend only on radial positions and the coordinate in thickness direction. The following observations can be made: First, the smaller the bond thickness, the more uniform is the stress distribution. This phenomenon can be expected, as then the free surface is smaller compared to the diameter. Thus, the material has less possibility to laterally contract. Second, the stress levels obtained are higher for the specimens with 3 mm than 1 mm bond thickness.
2.562
2.065
1.567
1.07
0.573
0.0754
3.389
2.771
2.153
1.535
0.917
0.299
4
sig zz - MPa
t = 3 mm 3
t = 1 mm
2 1
r - mm 0 0
5
10
15
20
25
Figure 10: Tensile stress distribution of 50 mm point support for tensile loading according to whitening point (symmetry=center plane)
Figure 11 shows the beginning of the whitening phenomenon for both 1 mm and 3 mm bond thickness. It is interesting to note that for the 1 mm specimens the whitening appears at approximately 60% radius while for the 3 mm specimen the whitening seems to start in the center region. This observation corresponds in some degree to the numerical results as for the 3 mm configuration the center stresses are indeed higher.
Challenging Glass 3
Nevertheless, no direct indication from the stress analysis can be found why for 1 mm bond thickness, the whitening starts at approximately 60% radius.
t = 1 mm
t = 3 mm
Figure 11: Tensile Test Characteristics of 50 mm Diameter Point Support of TSSA: Whitening.
Regarding shear loading, the numerical model has to be modified to a half model as in this case, only symmetry aligned to the load direction can be exploited. Please note that the rotation of the point support is not constrained and that the load introduction point – as already mentioned – is offset to the glass surface. Figure 12 presents the shear stress distribution with peak stress amplitudes at the edge region close to the symmetry plane. This concentration of high stress levels in small regions near the edge might explain why for these samples whitening could not be observed easily during testing. Therefore, the numerical model was loaded by the ultimate load level. Please note that different to what was observed in the tensile tests, no softening of the specimen behavior is noted for high loading according to Figure 6. Thus, it can be assumed that the hyperelastic material law of the numerical model is valid up to the ultimate loads. -1.713 -2.481 -3.248 -4.016 -4.783 -5.551 -6.318 -7.086 -7.853 -8.621 -9.388 -10.16 -3 Top Surface
tau xz - MPa
Bottom Surface
-5
-7 x - mm -9 -25
-20
-15
-10
-5
0
5
10
15
20
25
Figure 12: Shear stress distribution, 50 mm point support for ultimate shear loading (top and bottom surface)
The eccentric shear tests are – from a numerical point of view – similarly treated as the shear cases with the distinction that the load introduction point is offset. The stress distributions in Figure 13 show that the loading related to the appearance of the whitening phenomenon is mainly linked to the bending stresses and not to the shear stresses according to the almost constant levels of bending stresses. Furthermore, the shear stresses are significantly smaller compared to the maximum bending stresses.
Tensile Loading of Silicone Point Supports – Reviewed 6.1 5.182 4.264 3.345 2.427 1.509 0.591 -0.327 -1.245 -2.164 Shear, Eccentricity 1 29 mm
Shear, Eccentricity 2 39 mm
-3.082
Shear, Eccentricity 3 49 mm
-4.0
5 29 mm offset
sig z - MPa
39 mm offset
2.5
49 mm offset
x - mm 0 -25
-20
-15
-10
-5
0
5
10
15
20
25
-2.5
-5
0.5 x - mm
29 mm bottom
tau xz - MPa
0 -25
-20
-15
-10
-5
0
5
10
15
20
-0.5
25
29 mm top 39 mm bottom 39 mm top
-1
49 mm bottom
-1.5
49 mm top
-2
Figure 13: Tensile and shear stress distributions of 50 mm point supports for eccentric shear loading (top and bottom surface)
Figure 14 presents the advancement of the whitening during uploading with the sequence of loading being from left to right. The figure on the left shows the first occurrence of the whitening phenomenon for a still fully functional adhesive. Interestingly, the phenomenon is obviously linked to tensile stresses but not to compressive stresses. In the subsequent figure, the whitening has advanced substantially across the adhesive. The two figures on the right show three distinct zones with the ruptured adhesive on top, the whitening zone in the middle, and the still intact transparent adhesive on the bottom. With increasing load levels, the borderlines between the zones will move downwards as shown by the figure on the extreme right. Whitening
Rupture
Figure 14: Eccentric shear test (49mm offset) for 50 mm point support of TSSA. Whitening
Challenging Glass 3
6. Comparison of Conventional and Next Generation Silicone Adhesives Due to differences in the bonding process, applications of the conventional and the transparent silicones significantly differ in bond thickness. Representative thickness values for point supports of conventional silicones amount to approximately 5 mm while the transparent silicone is typically applied with 1 mm thickness. Nevertheless, similarities are obtained especially in view of the behavior under tensile loading schemes. Both silicone adhesives show three distinct zones: The first zone is linked to high stiffness related to fully functional adhesives. Afterwards, the adhesive reacts significantly softer, although no cracks are visible on a macroscopic level. Finally, the adhesive suddenly fails. Another interesting detail is the comparison of the results obtained for the TSSA film adhesive with the failure hypothesis developed for the conventional silicone: An initiation of the cohesive failure was assumed at approximately 60% of the total radius of the point support. This hypothesis is obviously coherent with the appearance of the whitening phenomenon of the transparent silicone at 1 mm thickness. Further studies are required in order to explain the dependency on bond thickness. 7. Conclusions For circular point supports of varying diameter, tests for a new transparent structural silicone adhesive were performed for tensile, shear and eccentric shear loading schemes. Special focus was directed at the whitening phenomenon indicating highly strained regions. The test showed several similarities to conventional silicone adhesives. Furthermore, bending moments were identified as critical load parameters for mixed loading of point supports. The next steps will consist of a deeper analysis of the appearance of the whitening phenomenon with respect to stress-strain curves. For conventional silicone sealants, a decrease of the tangent stiffness is clearly visible for tensile loading. This leads to the question whether this effect is also visible for the transparent silicone and in case of a positive answer whether the stiffness decrease coincides with the whitening phenomenon. 8. References [1] [2] [3] [4] [5] [6] [7] [8] [9]
Sitte, S., Brasseur, M.J., Carbary, L.D., and Wolf, A.T., Preliminary Evaluation of the Mechanical Properties and Durability of Transparent Structural Silicone Adhesive (TSSA) for Point Fixing in Glazing, Journal of ASTM International, Vol. 8, No. 10, 2011, Paper ID JAI104084. JIS Standard K 6253, 2006, Rubber Vulcanized or Thermoplastic – Determination of Hardness, Japanese Standards Association, Akasaka Minato-ku, Tokyo, Japan. JIS Standard K 6251, 2004, Rubber Vulcanized or Thermoplastics – Determination of Tensile StressStrain Properties, Japanese Standards Association, Aksasaka Minato-ku, Tokyo, Japan. ISO Standard 527-1, 1993, Plastics – Determination of Tensile Properties – Part 1: General Principles, International Standardization Organization (ISO), Geneva. ISO Standard 527-2, 1993, Plastics – Determination of Tensile Properties – Part 2: Test Conditions for Moulding and Extrusion Plastics, International Standardization Organization (ISO), Geneva. JIS Standard K 6252, 2007, Rubber Vulcanized or Thermoplastics – Determination of Tear Strength, Japanese Standards Association, Aksasaka Minato-ku, Tokyo, Japan.. Nathani, H., Dasari, A. and Misra, R.D.K., “On the Reduced Susceptibility to Stress Whitening Behavior of Melt Intercalated Polybutene – Clay Nanocomposites during Tensile Straining”, Acta Mater., Vol.52, 2004, pp. 3217-3227. Hagl, A., “Beyond ETAG 002: U-type Bonding Geometries for Structural Glazing”, Steel Construction, Vol.1, Issue 1/2009. Hagl, A., “Bonded Point-Supports: Understanding Today – Optimizing for the Future”, Challenging Glass 2, Delft, 2010