Tamil Nadu Agricultural Development
Final Report
November 30, 2004
ACRONYMS
AAY AP APL BPL DOA DPAP
Antyodaya Anna Yojana Andhra Pradesh Above poverty line Below poverty line Department of Agriculture Drought Prone Area's Programme
MSP NDDB NPC NSS O&M PCMS
Minimum Support Price National Dairy Development Board Nominal Protection Coefficient National Sample Survey Operation and Maintenance Primary Co-operative Marketing Societies
GCA
Gross Cropped Area
GDP GFCF
Gross Domestic Product Gross Fixed Capital Formation Government of India Government of Tamil Nadu Food Corporation of India
PDS SGDP TPDS T&V TNAU TNERC
Public Distribution System State Gross Domestic Product Targeted Public Distribution System Training and Visitation Tamil Nadu Agricultural University Tamil Nadu Electricity Regulatory Commission
GoI GoTN FCI FMIS
Farmer Management of Irrigation Systems
WRO
Water Resources Organization
IMT
Irrigation Management Transfer
WUA
Water Users' Association
Unit Measurements ft Ha hp kg
feet hectare horse power kilogram
Kwh mt
kilowatt hour metric ton
TABLE OF CONTENTS Executive Summary ....................................................................................................................... iv 1. Introduction ............................................................................................................................. 1 2. Overview ................................................................................................................................. 6 Agro-climatic Zones of Tamil Nadu ........................................................................................... 6 Major Crops................................................................................................................................. 8 Output Price Incentives: Nominal Rates of Protection for Major Commodities....................... 13 Agricultural Inputs: Fertilizer Use and Mechanization ............................................................. 14 Land........................................................................................................................................... 15 Livestock ................................................................................................................................... 17 Fisheries..................................................................................................................................... 18 The Rural Non-farm Sector ....................................................................................................... 18 3. Water for Agriculture ............................................................................................................ 22 Water Resources........................................................................................................................ 22 Overview of Water Use in Agriculture..................................................................................... 23 Rainfed Agriculture ............................................................................................................... 24 Irrigated Agriculture.............................................................................................................. 26 Institutions ................................................................................................................................. 27 Water and Electricity Charges................................................................................................... 29 Technology................................................................................................................................ 39 Environmental Management ..................................................................................................... 40 4. Public Expenditures and Agricultural Extension................................................................... 41 Public Expenditures on Agriculture and Irrigation.................................................................... 41 Tamil Nadu’s Public Distribution System................................................................................. 43 Agricultural Extension............................................................................................................... 45 5. Agricultural Markets and Market Policies............................................................................. 50 Market Structure: Regulated and Private Markets .................................................................... 50 Rice Markets.............................................................................................................................. 52 Markets for Sugar Cane and Milk ............................................................................................. 56 Commodity Marketing Boards .................................................................................................. 57 Contract Farming....................................................................................................................... 57 Rural Infrastructure ................................................................................................................... 58 6. Agricultural Growth and Rural Poverty ................................................................................ 60 Rural Poverty............................................................................................................................. 60 Labor Markets ........................................................................................................................... 62 Technological Change and Rural Poverty ................................................................................ 64 7. Conclusions and Policy Options............................................................................................ 66 Increasing the Efficiency of Water Use..................................................................................... 66 Increasing the Effectiveness of Public Expenditures and Agricultural Extension .................... 70 Promoting the Development of Well Functioning Agricultural Markets .................................. 71 Maximizing Real Income Growth for the Poor ......................................................................... 72 8. References ............................................................................................................................. 74 This report was prepared by a team led by Paul Dorosh and Mona Sur, with contributions from S.Rajagopal (water/irrigation), Jyoti Sriram (Bt Cotton), C. Ramasamy (Consultant, Tamil Nadu Agricultural Background Study), Burt Swanson (Consultant, agricultural research and extension), P.N. Mathur (Consultant, agricultural research and extension). Lili Liu, Dina Umali-Deininger and K. Palinisami (TNAU) provided valuable comments on various drafts. Peer reviewers for the study are Derek Byerlee (Lead Economist, ARD), Peter Hazell (International Food Policy Research Institute) and S. Mahendra Dev (Centre for Economic and Social Studies, Hyderabad).
Table of Figures Figure 1.1: Sectoral Contributions to GDP, 1980-2000 ................................................................. 1 Figure 2.1: Agro-climatic Zones of Tamil Nadu............................................................................ 6 Figure 2.2: Distribution of Gross Cropped Area by Crop .............................................................. 8 Figure 2.3: Irrigated Area by Crop (1999-2000) ............................................................................ 8 Figure 2.4: Growth in Fisheries SGDP......................................................................................... 18 Figure 2.5: Non-farm Income Share in Rural Tamil Nadu, 1993/94............................................ 19 Figure 2.6: Employment and Earnings in Khadi and Village Industries, 2000/01....................... 20 Figure 2.7: Value Added in the Agro-Processing Sector by Industry .......................................... 21 Figure 3.1: Rainfall and Agricultural & Allied GSDP ................................................................. 22 Figure 3.2: Area Cultivated by Share of Irrigated Land Per Farm ............................................... 24 Figure 3.3: Net Irrigated Area by Source of Irrigation................................................................. 26 Figure 3.4: Irrigation Costs for Rice Cultivation in India (Rs 1999-2000/ha) ............................. 40 Figure 3.5: Irrigation Costs and Gross Profits for Rice Cultivation in India................................ 40 Figure 4.1: Total Expenditures (Capital and Revenue) on Agriculture and Irrigation .................. 41 Figure 4.2: Gross Fixed Capital Formation (GFCF) in Agriculture............................................. 42 Figure 5.1: Rice Prices in Chennai 1994: 2003 ........................................................................... 54 Figure 6.1: Productivity and Rural Poverty.................................................................................. 61 Figure 6.2: Real Paddy Prices and Rural Wage Rates in Tamil Nadu ......................................... 63 Figure 7.1: Alternatives for Public-Private Financing and Provision of Extension Services....... 71 Table of Tables Table 1.1: Population, Labor Force and Agriculture in Tamil Nadu and Other States .................. 2 Table 2.1: Agro-climatic Zones of Tamil Nadu ............................................................................. 7 Table 2.2: Gross Area Cultivated and Cropping Patterns by Agro-ecological Zone (2001-02) .. 7 Table 2.3: Area and Share of Gross Cropped Area (GCA) by Crop ............................................ 10 Table 2.4: Growth rates of real Market Prices of Major Commodities ....................................... 10 Table 2.5: Tamil Nadu: Share of Area Cultivated by Agro-ecological Zone for Major Crops.... 11 Table 2.6: Distribution of Gross Irrigated Area by Major Crops (1999-2000) ........................... 11 Table 2.7: Growth Rates in Area, Yields and Production: 1980s and 1990s ............................... 13 Table 2.8: Nominal Protection Coefficients for Major Crops in Tamil Nadu, 1980-2002........... 14 Table 2.9: Characteristics of Agriculture in Various States (1998).............................................. 15 Table 2.10: Land Distribution in Tamil Nadu, 1995-96............................................................... 16 Table 2.11: Employment by Major Agro-processing Industries, 1989/90-1996/97..................... 20 Table 2.12: Value Added in the Agro-processing Sector by Major Agro-processing Industries, 1989/90-1997/98 (Rs Billion in constant 1993/94 Rupees) ................................................. 21 Table 3.1: Rainfall in Tamil Nadu................................................................................................ 23 Table 3.2: Access to Irrigation by Farms ..................................................................................... 24 Table 3.3: Irrigation Expenditures and Revenues (1998/99-2000/01) ......................................... 30 Table 3.4: Distribution of Canal Irrigation Subsidies in Tamil Nadu (2001/02)......................... 31 Table 3.5: Distribution of Agricultural Power Subsidies in Tamil Nadu (2001/02) .................... 32 Table 3.6: Irrigation Costs by Crop and Type of Irrigation.......................................................... 36 Table 3.7: Financial and Economic Returns by Crop and Type of Irrigation .............................. 38 Table 3.8: Estimated Input Subsidies for Various Crops in Tamil Nadu, 2000-01...................... 39 Table 4.1: Breakdown of Expenditures on Agriculture and Allied Activities (1997-2001)......... 42 Table 4.2: Estimates of the Impact of Policy Reforms on GOTN Costs of Rice Procurement .... 46 Table 4.3: Estimates of the Impact of Policy Reforms on GOTN Fiscal Costs of Rice Distribution ............................................................................................................................................... 47
ii
Table 5.1: Marketed Surplus and Market Channels of Major Crops in Tamil Nadu, 2001-02 .... 52 Table 5.2: Estimated Net Trade in Rice for Tamil Nadu (thousand tons), 1997/98 - 2002/03 ..... 53 Table 5.3: Estimates of Marketing Channels for Major Crops (Percentage of Farm Sales) ........ 55 Table 6.1: Poverty Estimates for Tamil Nadu (1999/2000) ........................................................ 60 Table 6.2: Farm Income Shares in Tamil Nadu............................................................................ 62 Table 6.3: Real rural wages in Tamil Nadu, 1986-2001 .............................................................. 63 Table 7.1: Selected Country Experiences with Agricultural Subsidy Reform ............................. 69 Table of Text Boxes Text Box 2.1: Bt Cotton in Tamil Nadu ...................................................................................... 12 Text Box 3.1: Pro-poor Irrigation Management Transfer ............................................................ 29 Text Box 4.1: The ATMA Approach to Extension ...................................................................... 49 Text Box 5.1: Contract farming in Tamil Nadu: New Initiatives for Rice................................... 59 Text Box 7.1: Pilot Initiatives in Reforming Power Supply to Farmers ...................................... 68 Text Box 7.2: Contract Farming in Punjab................................................................................... 72 Text Box 7.3: Role of Government in Agro-Food System and Agro-Enterprise Development .. 73 Text Box 7.4: Promoting the Rural non-farm Economy: Lessons from Latin America and the Caribbean............................................................................................................................... 73
iii
TAMIL NADU AGRICULTURE DEVELOPMENT EXECUTIVE SUMMARY Achievements and Challenges in Tamil Nadu Agriculture (i) Agriculture in Tamil Nadu has enjoyed three decades of growth based largely on rapid technological change. Food security has also increased due to rapid increases in food grain output, sales from the Public Distribution System (supplied by Food Corporation of India stocks), targeted feeding and employment programs, and well-functioning rice markets that have enabled price-stabilizing inflows of rice from neighboring states in years of local production shortfalls. Partly because of agricultural growth, rural poverty rates declined from 38.5 percent to 24.3 percent between 1993/94 and 1999/2000 (Deaton and Drèze estimates). The state’s agriculture has a strong base for continued growth in terms of a strong agricultural research system, an extensive road network, and a relatively well-educated rural labor force. (ii) While agricultural sector growth rates in Tamil Nadu were among the highest in India during the 1980s and early 1990s, deceleration in growth since the mid-1990s is of increasing concern to policymakers. During the 1980s agricultural GSDP grew at 3.4 percent, exceeding the all-India agricultural growth of 2.9 percent. Adequate rainfall contributed to even higher growth in the early 1990s: between 1989/90 and 1994/95 agriculture grew by 7.2 percent in Tamil Nadu, compared with 3.1 percent in all of India. But between 1994/95 and 1999/2000 agriculture in Tamil Nadu suffered from severe consecutive droughts and grew only 1.3 percent a year, compared with 2.9 percent for all of India. As a result, the state’s agricultural growth rate during the 1990s was only 2.9 percent a year, compared with 3.2 percent for all of India. (iii) Faster growth in agriculture is central to rural development and poverty reduction in Tamil Nadu. Although agriculture accounts for only 15.7 percent of total GSDP, farm income accounts for about half of household income for 35 million people (56 percent of the state’s population) who live in rural areas. Much of this rural population is poor, with estimates ranging from 7.4 million people (20.6 percent of the rural population) to 11.4 million (31.8 percent of the rural population). For the poorest rural quintile (approximately 1.5 million households, or 7.5 million people), more than three-quarters of income is derived from agriculture, with agricultural wage labor alone accounting for half of household income. Given the importance of agriculture in the incomes of the poor in Tamil Nadu, growth in labor-intensive agriculture could further reduce rural poverty through higher yields to small producers, higher real wages to agricultural laborers, and increased income and employment opportunities with forward and backward links to the rural nonfarm sector. (iv) Traditional sources of growth in agriculture face major constraints such as growing water scarcity, increasing land degradation, declining farm sizes, and rising costs of labor. Tamil Nadu is one of the driest states in India, averaging only 925 millimeters of rainfall a year. The state’s dry season lasts five months (January through May) even in good years, and severe droughts occur in 3 of 10 years, severely limiting cultivation of crops between June and September. Per capita availability of water resources in Tamil Nadu is only 900 cubic meters a year, compared with 2,200 cubic meters for all of India. Irrigation through a combination of 1 canals, wells, and tanks increases the reliability and availability of water for farming and is 1
A tank is a small-scale surface water reservoir constructed on a gentle slope, designed so that water flows out of the tank through the force of gravity.
iv
essential for cultivating crops in much of the state. But the seasonality and scarcity of supply limit 2 cultivation to only one crop per plot for most of the state. The agricultural sector faces increasing competition for water from industry and domestic users and intensifying interstate competition for surface water resources. In many parts of the state, the rate of extraction of groundwater has exceeded recharge rates, contributing to falling water tables. Water quality is also a growing concern. Effluents discharged from industries and heavy use of pesticides and fertilizers have had a major impact on surface water quality, soils, and groundwater. (v) Agricultural land resources have also come under increasing pressure because of rapid population growth and urbanization. Between 1971/72 and 1997/98 the available cultivable land per rural resident declined from 0.22 hectares per capita to 0.15 hectares per capita. The growing pressures on land, skewed pricing policies, and rural poverty have all contributed to land and soil degradation. As a result, poor soil fertility, salinity, water logging, overgrazing, and deforestation are growing problems and pose serious constraints to the performance of the agricultural sector in some parts of the state. (vi) Seasonal labor shortages and rising real agricultural wages during the past two decades, in part caused by rapid rural-urban migration, have contributed to higher incomes for agricultural laborers, but make future agricultural growth more difficult by reducing the competitiveness of Tamil Nadu’s agriculture vis-à-vis other agricultural producers. Higher labor costs, due in part to rapid growth in demand for nonagricultural labor, have increased the cost of cultivation, especially for labor-intensive crops. In 1999–2000 rural wages for male agricultural labor in the kharif season in Tamil Nadu averaged Rs.62.2 a day, compared with only Rs.45.3 a day in Andhra Pradesh and Rs.42.8 in Karnataka. These higher labor costs encourage mechanized land preparation and harvesting, but small farm sizes constrain the rate of mechanization. (vii) Given the constraints, diversification into higher value, less water-intensive products, such as fruits, vegetables, spices, and livestock products, may be one of the most promising sources of agricultural growth. Tamil Nadu’s agro-climatic conditions are well suited for diversified agriculture. Rapidly increasing incomes and changing patterns of food demand also provide strong impetus for diversification. Increased agricultural diversification and private investments in processing for many of the higher value agricultural commodities are likely to generate new rural nonfarm employment opportunities and contribute to higher rural incomes. (viii) Against this background this study assesses agricultural policies in Tamil Nadu and the implications of these policies for future agricultural growth, food security, and rural poverty reduction, and recommends reform options. This report focuses on selected critical issues rather than a comprehensive review of the agricultural sector in the state. It analyzes the structure of the agricultural economy, water management, agricultural subsidies, agricultural marketing and regulations, and implications of policy reforms for food security and consumption of the poor. The Structure of Agriculture in Tamil Nadu (ix) Rice dominates both food consumption and agricultural production, accounting for about a third of total gross cropped area and nearly 60 percent of irrigated area in Tamil Nadu (over 90 percent of paddy is irrigated). Pulses (18 percent of total cropped area), millet (11 percent), and groundnuts (10 percent) require less water than rice or sugar cane, and millet and pulses are grown almost exclusively on nonirrigated land. About 5 percent of total cropped area is 2
In 1998/99 average cropping intensity was only 1.20 in Tamil Nadu, compared with 1.34 for all of India.
v
devoted to sugar cane, all of it irrigated (accounting for almost 10 percent of irrigated land). Cotton occupies about 3 percent of cropped area, and about a third of the cotton crop is irrigated. (x) The livestock and fisheries subsectors are also important in Tamil Nadu. The state 3 ranks second among Indian states in egg production and ninth in milk production. In 2001/02 Tamil Nadu accounted for approximately 6 percent of national milk production and 11.9 percent of egg production. The state is also relatively well endowed with fisheries, accounting for 13.2 percent of total marine fish production and 4 percent of in-land fish production in India. In all, crop agriculture, livestock, and animal husbandry account for 92.2 percent of total value added in agriculture and allied activities, with fishing accounting for 4.5 percent and forestry for 3.3 percent. (xi) The average size of individually held farms is only 0.91 hectares, with over half the farms smaller than 0.5 hectares. Nearly three-quarters of farms are smaller than 1 hectare, accounting for only 30.2 percent total cultivable land. In comparison, the average farm size in India is 1.41 hectares, with 62 percent of farmers holding less than 1 hectare. Water for Agriculture (xii) Agriculture is the single largest consumer of water in the state, using 75 percent of the state’s water. Despite limited water resources, Tamil Nadu has a high percentage of net sown area that is irrigated (54 percent). In 1999/2000 the state had a net irrigated area of 3 million hectares. Today the state relies equally on surface and groundwater sources for irrigation, though its reliance on groundwater has been steadily increasing. Approximately 30 percent of the net irrigated area is watered by canals and 21 percent by tanks, while 49 percent is fed by wells. The remaining area is irrigated by other sources such as streams and springs. Rainfed agriculture, employing approximately 25 percent of farmers, accounts for 46 percent of the net sown area of 5.5 million hectares. Institutional Issues (xiii) Institutional weaknesses have undermined proper management and development of water resources in the state. As is common in many Indian states, inadequate priority to and funding for operations and maintenance led to rapid deterioration of surface irrigation. There was also minimal involvement of farmers in the operations and maintenance of irrigation systems. But recent efforts have been made to address many of the issues plaguing the water sector. (xiv) The Government of Tamil Nadu is now undertaking comprehensive water planning on a river basin basis and has decentralized water resource management along river basins. In 1995 the Public Works Department was divided into the Water Resources Organization (WRO) and the Buildings Organization. The WRO is to be formalized in 2004 as a separate agency with a specialized cadre of staff, with Chief Engineers reorganized around river basins. The Palar Basin Development and Management Board and the Thambaraparani Basin Development and Management Board were established in January of 2000. Preparation of macro-level basin development plans and formulation of decision support systems for development and management of the water resources of the state have been under way since 1997. The state has drafted a Water Policy, initiated steps for irrigation management transfer, and passed a Groundwater Regulation and Management Act, one of the first states in India to do so. The State Legislative Assembly passed the Tamil Nadu Farmers Management of Irrigation 3
Ranks are computed based on average production in Indian states between 1999 and 2001.
vi
Systems Bill in May 2000. Substantial progress has been made in the environmental aspects of water resources development. (xv) Tamil Nadu has implemented a number of centrally sponsored and donor funded watershed development schemes to improve the production potential of rainfed agriculture. The government recently launched the Comprehensive Wasteland Programme, which will cover 2 million hectares through a watershed development project. Watershed projects in India have enjoyed relatively little success in curbing land degradation, improving the productivity of rainfed agriculture, and reducing rural poverty, and remain to be carefully evaluated in Tamil Nadu.
Economic Incentives for Water Use: Taxes and Implicit Subsidies (xvi) Under the current system of economic incentives (prices, subsidies, taxes) the cost of water for farmers and other water users does not reflect the scarcity value (opportunity cost) of water. Throughout India, farmers using surface water for irrigation from canals or tanks are implicitly subsidized because water charges fall short of operations and maintenance expenditures. Between 1990 and 2002 farmers using groundwater for irrigation in Tamil Nadu also benefited from free agricultural power supply. Subsidizing irrigation water means that the environmental costs of water use are not being internalized, reducing incentives for water conservation, encouraging the cultivation of water-intensive crops, and contributing to environmental degradation. The irrigation and agricultural power subsidies have contributed to the state’s large fiscal deficit. These subsidies also have a high opportunity cost in terms of other social and economic expenditures foregone, and few poor directly benefit from them. (xvii) In 2002, the Government of Tamil Nadu announced increases in irrigation water charges and reintroduced a tariff for agricultural power consumers. These reforms— charging for water on a per area basis (as is the case for surface irrigation) or on a flat rate basis (for agricultural power consumers)—were a step in the right direction. But even these reforms did not result in economically efficient pricing, because the marginal cost for water was almost zero and thus demand for irrigation water was not affected. (xviii) Prior to 2003, water charges were levied by the Government of Tamil Nadu at a base rate (which varied according to crop, season, and soil quality) plus an additional charge equivalent to six times the base rate. This additional charge was transferred to the local panchayats. Beginning in July 2003, an additional water charge of Rs.150 per hectare was imposed, de-linked from any additional cess. Thus, farmers were to pay the original charge plus the Rs.150 per hectare. In addition, the FMIS Act empowered water user associations to charge users between Rs.250 and Rs.500 per hectare. This fee could be retained by the associations for operation and maintenance of the systems turned over to them. (xix) The agricultural power tariff introduced in 2003 included a flat rate for unmetered connections of Rs.250 per horsepower a year and Rs.0.20 per kilowatt-hour for metered connections. Along with the reintroduction of the agricultural power tariff, the government announced an income support scheme for smallholders and marginal farmers. Under the income support scheme, the Government of Tamil Nadu was to provide smallholders and marginal farmers a transfer of up to Rs.1,250 a year. This was a significant step toward creating a more direct and transparent system of subsidies to farmers and other target groups and ensuring the separation of commercial operation of the power utility from the need for subsidy. However, the reintroduction of agriculture power tariff became a highly contentious issue in Tamil Nadu during the recent national election, forcing the government which suffered severe electoral loss for the national parliament seats to reverse the policy.
vii
(xx) Nonetheless, the analysis in this report suggests that introduction of a flat rate charge of Rs.250 a year for a five horsepower pumpset would have only a small effect on net returns to land and management, reducing them by only 4.9 to 6.5 percent. Costs of crop cultivation using well irrigation would rise by only Rs.625 per hectare (annual charge pro-rated for one season) to Rs.1,250 per hectare (for sugar cane grown over eleven months). (xxi) Raising electricity charges to the estimated marginal economic price of electricity to agriculture of Rs.3.1 per kilowatt-hour, though, would increase irrigation costs to about Rs.4,600 per hectare for paddy and sugar cane, reducing returns to land and management by 35.9 percent for paddy and by 23.8 percent for sugar cane. Likewise, total returns to land, labor, and capital (value added) would fall sharply for paddy and sugar cane irrigated by wells if farmers bore the cost of electricity for pumping, strengthening the case for a compensating income support scheme in this scenario. Other Public Expenditures on Agriculture and Food (xxii) Although public expenditures on agriculture in Tamil Nadu are high, the quality of expenditures is a cause for concern. Expenditures on agriculture, allied activities, and irrigation as a share of agricultural GSDP are higher in Tamil Nadu than in most major agricultural states in India (World Bank 2003). Between 1998 and 2000 public expenditures on agriculture equaled 11 4 percent of total agricultural GSDP in Tamil Nadu, compared with 7.8 percent in all of India. Public agricultural capital expenditures in the state are relatively low compared with the all-India average, while the opposite is true of revenue (i.e. current) expenditures as a share of agricultural GSDP. This is a situation for concern since capital investments are important for future growth. Furthermore, a large share of revenue expenditures are incurred on staff salaries, and food and irrigation subsidies, leaving operating expenses under funded. Gross fixed capital formation in agriculture increased by 15 percent during the 1990s, due primarily to private capital formation, which accounted for 88 percent of gross fixed capital formation in agriculture. (xxiii) The agricultural extension system in Tamil Nadu is still organized around a modified Training and Visit approach and continues to focus on major food-grains. There is little coordination among line departments (agricultural, animal husbandry, fisheries) in their extension approach. The extension system is slowly changing, however, and the promotion of public-private partnerships in extension is encouraging. The Government of Tamil Nadu also plans to link agricultural, horticultural, and agricultural engineering extension systems and units to improve the extension capacity for horticultural development. (xxiv) Reforms of the public procurement system and improvements in targeting are reducing state expenditures on food subsidies. The Government of Tamil Nadu estimates that the food subsidy will fall from Rs.15 billion in 2001/02 to Rs.7 billion in 2003/04. Cessation of local procurement (except on behalf of the Food Corporation of India) reduced government expenditures on procurement by an estimated Rs.6.8 billion by eliminating the costs of paying extra procurement incentives and of milling the paddy into rice. Additional savings came from reducing the subsidy per kilogram of rice sold and the number of cards (and ultimately the sales of rice). The total estimated reduction in subsidy (from both reforms on procurement and 4
Agricultural public expenditures as a share of expenditures on Economic Services and Agricultural GSDP are averages of data from 1998/99–2000/01.
viii
distribution) was about Rs.9.92 billion, with about two-thirds due to the cessation of Government of Tamil Nadu procurement on its own behalf. Development of Agricultural Markets (xxv) In the past decade Tamil Nadu has increased private sector participation in marketing and eliminated government restrictions. Unlike most Indian states, where wholesale marketing is restricted to regulated markets, Tamil Nadu permits traders to transact sales outside of regulated markets. Private markets account for about 90 percent of the statewide trade in major crops. Regulated markets, in which licensed traders bid for farmer produce through a tender system, account for only 10 percent. (xxvi) In May 2003, following the February 2002 central Government order removing licensing restrictions on rice and 13 other crops, the state Government withdrew its licensing system for these crops. Restrictions on purchase, movement, stocking, and sales of these commodities have been removed, though some provision remains for Government intervention in the case of high market prices for goods distributed through the public distribution system. (xxvii) Greater private sector participation in markets has enhanced food security in Tamil Nadu. Increases in state production of major staples (especially rice), sales of subsidized rice through the public distribution system, school feeding programs, and targeted relief programs have increased access to food. During the drought of 2002/03 the wholesale prices of rice only rose 2.8 percent in real terms above the previous year’s prices despite a 34 percent fall in paddy production in the state. This was because private sector inflows from neighboring Andhra Pradesh and Karnataka and the availability of rice through the public distribution system helped to maintain access to food for poor consumers. (xxviii) Private investments in processing and marketing horticultural and export crops have enjoyed some success (for example, tumeric exports from Erode). Contract farming involving business agreements for the purchase of outputs and often the provision of inputs and extension advice is increasing, particularly for sugarcane, cotton, and horticultural crops.
Policy Reform Options in Tamil Nadu’s Agriculture (xxix) Reducing rural poverty, accelerating growth in agricultural production, and overcoming the constraints faced by the agricultural sector in Tamil Nadu require appropriate policies and investments in four priority areas: improving the efficiency of water use, increasing the effectiveness of public expenditures and agricultural extension, spurring the development of agricultural markets, and maximizing the real income growth of the rural poor. Improving the Efficiency of Water Use (xxx) Long-term growth in agriculture and rural incomes depends in large part on using water efficiently. Water management options include scaling up the pilot river basin framework for managing water resources holistically, allowing interagency coordination and public-private partnerships; introducing specific, legally enforceable water entitlements to various users in a river basin and or aquifer framework; adjusting electricity, water, and crop prices to change the
ix
financial incentives for irrigation and crop choice; and improving management practices and irrigation technologies (such as drip and sprinkler irrigation) and investing in canals and water storage (coupled with improved operation and maintenance). (xxxi) Public administration in the water sector could be improved by separating responsibilities for water resource management and irrigation service delivery. Tamil Nadu is the only state in India without a separate department of irrigation, now a part of the Department of Public Works. Two new agencies are needed: a regulatory agency to allocate the share of water resources to agriculture, industry, and other uses, and an irrigation department focusing on irrigation delivery systems. A separate irrigation department would allow for the creation of a specialized cadre of irrigation specialists, instead of the current setup that relies on staff from the Department of Public Works (which also includes administration of public buildings). (xxxii) Irrigation management transfer is at an early stage in Tamil Nadu and water user associations are not yet fully functional. The transfer of irrigation management to farmers in line with the FMIS Act should be expedited to make water distribution more efficient and equitable. (xxxiii) Providing the right economic incentives (prices, subsidies, taxes) that recognize the opportunity cost of water is essential for improving water use efficiency. Raising electricity charges to the estimated marginal economic price of electricity to agriculture of Rs.3.1 per kilowatt-hour may not be politically feasible, but moving gradually toward marginal cost pricing (perhaps combined with compensation to farmers in the form of income transfers or a more reliable electricity supply) would help rationalize water use in Tamil Nadu. Paying greater attention to market infrastructure, strengthening research and extension to meet the needs of diversified agriculture, developing tools for farmers to better manage risks, and improving irrigation pumpset efficiency are likely to make higher power charges more palatable to farmers. If farmers’ costs and incomes varied according to the amount of electricity (and water) used with well irrigation, they would have an incentive to shift some land from water-intensive crops (rice and sugar cane) toward less water-intensive crops (including cotton, maize, and vegetables). (xxxiv) Increases in electricity charges would have little effect on overall rice production and market prices but a major effect on sugar cane production. Since only about 10 percent of rice area cultivated is irrigated with well water (about 200 thousand hectares), changes in electricity pricing would have only marginal effects on production. And since rice is also supplied by net public distribution (averaging 1.2 million tons a year from 1997/98 to 2001/02, 18 percent of net production) and private market trade from neighboring states (estimated at 1.0–1.3 million tons in the drought year 2002/03), the effect of lower rice production from well irrigated areas on market prices of rice would likely be small. Impacts on sugar cane production would be much greater, however, as essentially all sugar cane is irrigated in part with well water. (xxxv) The current provisions for irrigation water charges allow full cost recovery of required operations and maintenance expenditures. The extent to which farmers are actually being charged the proposed water rates remains unclear. (xxxvi) Greater attention is also needed for modernizing irrigation infrastructure and scaling up the adoption of water saving irrigation technologies. While the use of sprinkler and drip technology has been promoted in the state, the high capital cost of these technologies constrains widespread adoption by smallholders and marginal farmers. More affordable technology or a suitable system of targeted subsidies should be developed to increase the use of sprinkler and drip systems.
x
(xxxvii) Past experience reveals that extensive community participation with sound technical inputs are necessary for successful watershed programs. A basin perspective should be adopted to ensure that these initiatives do not have negative impacts on downstream human and ecological uses. Increasing the effectiveness of public expenditures and agricultural extension
(xxxviii) Responding to the needs of diversified agriculture requires a highly effective research and agricultural extension system. An assessment of the state’s comparative advantage in producing higher value crops for the domestic and export markets would also help in setting future research and development priorities. Re-orienting agricultural research to make it more farmer-responsive would likewise improve the output of a system that has enjoyed much success in rice technology development in the past. Similarly, the current extension system in the state remains organized around a modified Training and Visit approach and continues to be highly focused on major food-grains, though the promotion of public-private partnerships in extension is a very encouraging recent development and offers potential for both cost-savings and greater efficiency. Thus, it is recommended that the GoTN develop a new agricultural extension strategy to meet the changing needs of farmers. This could include adopting an integrated and decentralized extension system that could help build farmer organizations that could link with private firms to increase economic growth in rural areas. (xxxix) Rationalizing public expenditures and shifting expenditures from subsidies to investments in key public goods such rural roads, markets and agricultural research and extension will facilitate productivity improvements and diversification of agriculture to higher value products. Tightening competition for limited fiscal resources heightens the urgency of appropriate public expenditure reallocation. Institutional reforms within government departments to ensure improved quality of delivery of rural-related public goods and services is also important. Promoting the development of well functioning agricultural markets (xl) Well functioning agricultural markets are also important for successful agricultural diversification. If recent policy reforms removing restrictions on purchase, movement, stocking and sales of paddy and 13 other crops are consistently implemented at the local level, they can be expected to improve marketing efficiency, reducing the margin between producer and consumer/export prices. Reductions in marketing costs are also necessary in order for production increases to lead to higher agricultural incomes, particularly for perishable high-value products (e.g. fruits, vegetables, animal products). Contract farming and other private sector initiatives should be encouraged, though the impact of these business arrangements on farmer incomes should be evaluated, as well . (xli) There remain, however, important roles for the public sector in promoting agrofood system and agro-enterprise development In addition to policies that establish “rules of the game” and address market failures, public investments in rural roads to strengthen rural connectivity can contribute to reduced costs of marketing. Although Tamil Nadu has an extensive road network, further attention to maintenance and upgrading of rural roads in some regions may be warranted. Given the rapidly changing nature of markets in Tamil Nadu, an indepth study of market structure and investment needs would be useful.
xi
(xlii) Increasing agricultural diversification will not compromise Tamil Nadu’s food security objectives given an effective PDS , well-functioning markets and targeted nutrition programs. Greater food security has largely been achieved through increases in state production of major staples (especially rice), sales of subsidized rice through the PDS, school feeding programs, and targeted relief programs during droughts. During the recent drought of 2002/03 the wholesale prices of rice only rose 2.8 percent (in real terms) above the previous year’s price, despite a 34 percent fall in paddy production in the state, helping to maintain access to food for poor consumers. This was largely due to private sector inflows from neighboring states of Andhra Pradesh and Karnataka and the availability of rice through the PDS.
Maximizing Real Income Growth for the Poor (xliii) Increasing employment and earnings in the dry season is especially important for the rural poor. Increased availability of water and greater efficiency of water use in the dry season (for example, through the widespread adoption of drip irrigation) could enable cultivation of crops year-round, providing employment in agricultural production and processing. Dissemination of new production technology and establishing markets for dry season crops remains an important unresolved issue, however. Contract farming may help overcome these problems, if competition between firms helps farmers maintain their share of the value of the final product sales. The experience of Latin America and the Caribbean suggests that education, transport infrastructure, and engines of non-farm growth that promote female employment are key aspects of a success strategy to promote non-farm growth and rural poverty reduction. (xliv) Whether agricultural diversification reduces poverty in Tamil Nadu will depend on the extent to which small farmers adopt new technologies and have access to markets, the magnitude of employment and real wage rate gains, and the size of linkage effects with rural non-agriculture. The implications of an agricultural diversification strategy involving higher risk crops and capital-intensive technologies (drip irrigation) must be assessed. This assessment should review crop and drought insurance instruments, and the potential for innovations in these instruments to enable rural farmers, particularly poor farmers, to better manage risks.
xii
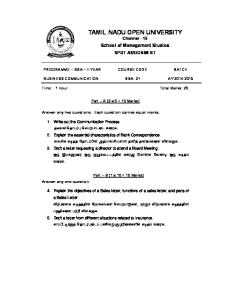
TAMIL NADU AGRICULTURAL DEVEL0PMENT 1. Introduction 1.1 The agricultural sector in Tamil Nadu has a long history of notable achievements and significant progress. Construction of the Grand Anicut (dam) on the Cauvery river in the second century AD permitted a large expansion of irrigated area and rice cultivation, and a flourishing of the Chola kingdom. Centuries later, rapid expansion of green revolution technology (improved seeds, increased fertilizer use, and irrigation) enabled the state to increase average rice yields by 74.4 percent between the trienniums ending 1972/73 and 2001/02, enabling production to increase by 36.2 percent in spite of a 21.9 percent decrease in area cultivated with rice. 1.2 While agricultural sector growth rates in Tamil Nadu were among the highest in India during the 1980s and early 1990s, deceleration in growth since the mid-1990s is of increasing concern to policymakers. During the 1980s agricultural GSDP grew at 3.4 percent, exceeding the all-India agricultural growth of 2.9 percent. Adequate rainfall contributed to even higher growth in the early 1990s: between 1989/90 and 1994/95 agriculture grew by 7.2 percent in Tamil Nadu, compared with 3.1 percent in all of India. But between 1994/95 and 1999/2000 agriculture in Tamil Nadu suffered from severe consecutive droughts and grew only 1.3 percent a year, compared with 2.9 percent for all of India. As a result, the state’s agricultural growth rate during the 1990s was only 2.9 percent a year, compared with 3.2 percent for all of India. 1.3 In contrast to the uneven growth in agriculture, the non-agricultural economy of Tamil Nadu has expanded rapidly, leading to a sharp decline in the share of agriculture in total output (Figure 1.1). The agricultural and allied services (livestock, forestry and fisheries) sector’s contribution to GSDP has declined from 24.3 percent in 1980/81 to 15.7 percent in 2001/02, one of the lowest shares in the country. By comparison, between 1980/81 and 2001/02 the services sectors share of GSDP increased from 40.7 percent to 51.5 percent, while the share of industry decreased slightly, from 35 percent to 32.8 percent.
Rs. Billion (Constant 1993-94 Rupees)
Figure 1.1: Sectoral Contributions to GDP, 1980-2000
900 800 700 600 500 400 300 200 100 0 2000-01
Services
1998-99
1996-97
1994-95
Industry
Source: World Bank States Database
1
1992-93
1990-91
1988-89
1986-87
1984-85
1982-83
1980-81
Agriculture and allied
1.4 Despite its declining importance in the overall economy, however, agriculture remains a major source of employment and earnings for the rural poor. About 56 percent of the state’s population of 62 million (2001 Census) resides in rural areas and close to half (14.4 million workers) of an estimated 29 million workers are employed in agriculture (Table 1.1). For the poorest rural quintile (approximately 1.5 million households with about 7.5 million people), more than three-quarters of income continues to be derived from agriculture, with agriculture wage labor alone accounting for half of household income. Agricultural labor accounts for 49.5 percent of the labor force in the state, less than the all-India average of 59.2 percent. Unlike most of India (with the exception of Andhra Pradesh), agricultural laborers outnumber cultivators by a 1.69:1 ratio (compared with a 0.88:1 ration across India), further highlighting the importance of returns to labor for poverty reduction. Table 1.1: Population, Labor Force and Agriculture in Tamil Nadu and Other States Andhra Pr. Maharashtra Punjab
Karnataka Tamil Nadu
All India
Population (2000 census) Total (mns) Rural (mns) Urban (mns) % rural
75.7 55.2 20.5 72.9%
96.8 55.7 41.0 57.6%
24.3 16.0 8.2 66.1%
52.7 34.8 17.9 66.0%
62.1 34.9 27.2 56.1%
1027.0 741.7 285.4 72.2%
Labor force in agriculture as percentage of total Cultivators (% of total) Agric laborers (%of total) Agric laborers/cultivators
62.3% 22.7% 39.6% 1.75
55.4% 28.6% 26.8% 0.94
39.4% 23.0% 16.4% 0.71
55.9% 29.5% 26.4% 0.90
49.5% 18.4% 31.2% 1.69
59.2% 31.6% 27.6% 0.88
GSDP/capita (2001)
11,154
17,394
17,436
13,335
14,393
11,752
Share of agric&allied Agric&allied/capita Agricultural GSDP/worker
28.0% 3,121 6,779
12.6% 2,199 5,059
38.7% 6,740 17,909
28.5% 3,805 8,530
17.3% 2,486 5,552
24.2% 2,847 7,603
45.32
43.74
77.66
42.76
62.19
51.81
Agricultural wage (1999-00) (Kharif, Rs/man-day)
Source: Population Census 2001 ; CMIE 2003 ; Reports of the Commission for Agric Costs and Prices 2001-02 (published 2002), pp.304f.
1.5 Agricultural growth has played a major role in rural poverty reduction in the past in Tamil Nadu, and could make substantial contributions in the future. Analysis based on household surveys indicates that the spread of green revolution technology in the 1970s and 1980s contributed to sizeable increases in returns to land, raising farmer’s incomes. Increasing demand for goods and services by farm households further stimulated expansion of the rural nonfarm economy contributing to poverty reduction. Although rural poverty rates declined by 6.714.2 percent (depending on the definition of the poverty line), between 1993/94 and 1999/00, there remain between 7 and 11 million rural poor in Tamil Nadu (1999/00 data), 21-32 percent of the rural population. Increases in agricultural production, processing and trade could enable further declines in rural poverty.
2
Fostering Agricultural Growth in Tamil Nadu 1.6 Yields of major crops in Tamil Nadu are among the highest in India, but productivity growth has slowed in recent years. By the late 1990s, yields of major crops grown in Tamil Nadu including paddy, sugar cane, cotton and groundnut were among the highest across major Indian states. In 1998-99, Tamil Nadu had the highest rice, sugar cane and groundnut yields in India and cotton yields in the state were second only to Gujarat. Increases in yields enabled land productivity to grow by 6.1 percent per year between 1987/88 and 1993/94 from Rs 16,423/ha to Rs 23,459/ha (in constant 93/94 Rs), but by only 2.4 percent per year between 1993/94 and 1999/00 (to Rs 27,099/ha in constant 93/94 Rs). Likewise, average labor productivity in agriculture increased by an average of 4.6 percent per year between 1987/88 and 1993/94 from Rs 6,881 per worker to Rs 9,024 per worker (in constant 93/94 Rs), but by only 2.4 percent per year between 1993/94 and 1999/00 to Rs 10,434 per worker (in constant 93/94 Rs). 1.7 Traditional sources of agricultural growth face major constraints including growing water scarcity, increasing land degradation and declining farm sizes, and rising costs of agricultural labor. Tamil Nadu is one of the driest states in India, with an average of only 925 millimeters of rainfall per year. The state has a dry season that extends over five months of the year (January through May) even in good years, and severe droughts occur in three out of every ten years severely limiting cultivation of crops between the months of June and September. The per capita availability of water resources of Tamil Nadu is only 900 cubic meters compared to an all-India average of 2200 cubic meters per annum. Irrigation through a combination of canals, 5 tanks, and wells, increases the reliability and availability of water for farming, and is essential for successful cultivation of crops in much of the state. Nonetheless, seasonality of supply and 6 scarcity of water limit cultivation to only one crop per plot for most of the state. In addition to growing water scarcity, the agricultural sector faces increasing competition for water from industries and domestic users and intensifying interstate competition for surface water resources. In many parts of the state, the rate of extraction of groundwater has exceeded recharge rates contributing to falling water tables. Water quality issues are also of increasing concern. Effluents discharged from industries as well as heavy use of pesticides and fertilizers have had a major impact on surface water quality, soils and groundwater. 1.8 Agricultural land resources have also come under increasing pressure because of rapid population growth and increasing urbanization. The available cultivable land per rural resident has declined from 0.22 ha/capita to 0.15 ha/capita between 1971/72 and 1997/98. The growing pressures on land coupled with skewed pricing policies and rural poverty have contributed to land and soil degradation. As a result, poor soil fertility, salinity, water logging, over grazing, and deforestation are growing problems and pose serious constraints to the performance of the agricultural sector in some parts of the state. 1.9 Solid growth in agricultural output and employment, rapid growth in the nonagricultural sector, and rural-urban migration have all contributed to rising real agricultural wages over the past two decades. These higher returns to labor have contributed 5
A tank is a manmade small-scale surface water reservoir on a gentle slope, designed so that water may flow out of the tank through the force of gravity.
6
Average cropping intensity in Tamil Nadu is only 1.20, compared to 1.34 (1998-99) for all-India.
3
to the state’s success in raising rural incomes and reducing rural poverty, though unemployment in the dry season remains a major factor underlying low incomes of poor rural households. 1.10 However, high real agricultural wages and seasonal labor shortages have also increased the costs of cultivation, and tended to reduce the competitiveness of Tamil Nadu agriculture vis-à-vis other states and in international markets. Rural daily wage rates for male agricultural labor in the kharif season in Tamil Nadu in 1999-2000 averaged 62.2 Rs/day, compared with only 45.3 and 42.8 Rs/day in Andhra Pradesh and Karnataka, respectively (Table 1.1). These higher labor costs have spurred mechanization of some operations, including field preparation and rice harvesting, but small farm sizes constrain the rate of mechanization. 1.11 Faced with these constraints, the Government has adopted a strategy of agricultural diversification to accelerate agricultural growth. Tamil Nadu’s agro-climatic conditions are well suited to diversified agriculture. Furthermore, rapidly increasing incomes and changing food demand patterns provide strong impetus for diversification. The Government’s 10th plan articulates a strategy to reinvigorate agricultural growth through improved productivity, higher cropping intensities, diversification and increasing commercialization. Efficient land and water management underlie the proposed strategy for growth in agriculture. The Government’s recently announced approach to diversifying agriculture includes area expansion through the development of waste and fallow lands and crop substitution by further developing the horticultural sector. Emphasis is also placed on improving the productivity of water through the promotion of drip and sprinkler irrigation technology and improved irrigation practices. 1.12 In spite of some promising recent steps, current price incentives do not promote efficient water and land resource use, and the research and extension system remains better suited for technology for traditional crops. Existing input subsidies for power, water and fertilizer distort incentives for diversification and sustainable use of natural resources. Further, the agricultural research and extension is not yet in a position to respond to the new demands of diversified agriculture. With its relatively educated rural labor force and growing manufacturing sector, Tamil Nadu is well poised to capture the benefits of rural non-farm growth stimulated by both upstream and down stream linkages with diversified agriculture. Plan of the Report 1.13 Against this background the objectives of this study are to assess agricultural policies in Tamil Nadu and the implications of these policies for future agricultural growth, food security and rural poverty reduction, and to recommend reform options. This report focuses on selected critical issues related to agricultural growth in Tamil Nadu, rather than a comprehensive review of the agricultural sector in the state. The analysis focuses on the structure of the agricultural economy, water management, agricultural subsidies, agricultural marketing and regulations, and implications of policy reforms for food security and consumption of the poor. 1.14 Chapter 2 provides an overview of the structure of the agriculture sector and the rural economy, focusing on the major crops and cropping patterns, livestock and fisheries. Chapter 3 examines the importance of water for agriculture. Chapter 4 discusses public policies and agricultural research and extension issues. Chapter 5 focuses on agricultural markets and marketing policies. Chapter 6 discusses issues related to food security and rural poverty. The conclusion and policy options are presented in Chapter 7. 1.15 This paper is based on the missions’ discussions with various stakeholders, including the Government of Tamil Nadu, farmers, agricultural laborers, private sector representatives and academics. This work also draws on a background paper, “Promoting Agricultural Development
4
in Tamil Nadu: Perspectives, Dimensions and Potentials,” prepared by a team of researchers at Tamil Nadu Agricultural University led by Professor C. Ramasamy. The study complements other concurrent analytic work (particular, the papers on poverty and investment climate) on Tamil Nadu.
5
2. Overview 2.1 Tamil Nadu’s agriculture, though dominated for centuries by rice cultivation in river basins, varies considerably across the state’s major agro-climatic zones. Although water availability limits cultivation on most land to a single crop, technological change in agriculture has enabled increased yields and production over a wide range of crops. Livestock sector growth, particularly poultry and dairy products, has also accelerated in the 1990s. Agro-climatic Zones of Tamil Nadu 2.2 Tamil Nadu is divided into seven agro-climatic zones based on rainfall distribution, 7 irrigation patterns, soil types, and other ecological characteristics (Figure 2.1, Table 2.1). The Cauvery Delta which forms its own agro-ecological zone, enjoys relatively high rainfall relative to most of Tamil Nadu (1101 millimeters per year), and irrigation water through canals for six to seven months in good rainfall years in the catchment area of the Cauvery river. The Northeast, which includes Chennai, includes the Palar river basin and surrounding hillsides. Sufficient concentrated rainfall and slow drainage enable irrigation from natural and man-made tanks. Average annual rainfall is slightly less in the North zone (849 millimeters); the western zone which receives very little rainfall from the southwest monsoon is the driest region, with only 714 millimeters of average annual rainfall. Total rainfall in the Southern zone is similar to that of the north zone, but there are few large river basins, apart from the Tambraparni which flows south in Tirunelveli district. The two remaining zones receive more rainfall than the rest of the state. The High Rainfall zone, located in the southern tip of Tamil Nadu (Kanniyakumari district), receives heavy rainfall from the southwest monsoon, (annual average rainfall of 1457 millimeters). In the Hilly zone that includes the mountains in Western Tamil Nadu, (Nilgiris district and the western edge of several other districts), numerous types of tree crops are cultivated. Figure 2.1: Agro-climatic Zones of Tamil Nadu
7
Rainfall data in Table 2.2 and other data on area, yield and production of crops by agro-climatic zones are based on data for the districts indicated. These figures are only approximate indicators of the characteristics of the zones, however, since actual boundaries of agro-climatic zones do not coincide exactly with district boundaries.
6
2.3 Rice is the major crop in the Cauvery delta zone and the Northeast zone, (52.4 and 42.3 percent of gross area cultivated, respectively), but plays a smaller role in the farming systems of the drier Western and Northwestern zones (9.6 and 15.9 percent of gross area cultivated, respectively) (Table 2.2). In these latter areas, other cereals, (millets, sorghum and maize) account for 18.8 and 24.6 percent of gross area cultivated, respectively. Cropping patterns are more diversified in the Western, South, and High Rainfall zones, where the share of crops other than cereals, pulses, sugar cane, cotton and groundnuts, is 38.1, 27.9 and 46.2 percent, respectively. Tree crops dominate the cropping patterns in the Hilly zone. Table 2.1: Agro-climatic Zones of Tamil Nadu Zone
Districts
Geographical area
Rainfall
Million Ha
Percent
mm
31.2 18.3 15.6 19.2
24 14.1 12 14.8
1109 849 714 1101
41.5
31.9
814
1.7 2.5 130
1.3 2 100
1457 1857 925
Northeastern (Yellow)
Kancheepuram, Thiruvallur, Vellore, Thiruvannamalai, Villupuram, Cuddalore Northwestern (Orange) Dharmapuri, Salem, Namakkal, Perambalur Western (Brown) Erode, Coimbatore, Karur, Dindigul Cauvery Delta (Green) Thiruchirapalli, Thanjavur, Thiruvarur, Nagapattinam Southern (Red) Theni, Madurai, Pudukottai, Ramanathapuram, Sivagangai, Virudhunagar, Thirunelveli, Thoothukudi High rainfall (Dark Green) Kanniyakumari Hill (Blue) The Nilgiris, Western ghats Total Tamil Nadu
Note: Data in Table 2.1 correspond to the boundaries of zones defined by the Department of Agriculture as shown in Figure 1.1. Other tables showing data by agro-climatic zone use slightly different definitions from Tamil Nadu Agricultural University (2003); (see Appendix Table 1).
Table 2.2: Gross Area Cultivated and Cropping Patterns by Agro-ecological Zone (2001-02) GCA ('000 has) Paddy
Other Cereals
Pulses
Sugar GroundOther Cane nuts Cotton Crops All Crops
1. Northeast 2. Northwest 3. Western 4. Cauvery Delta 5. Southern 6. High Rainfall 7. Hilly
1,600 766 638 1,281 1,404 98 77
42.3% 15.9% 9.6% 52.4% 35.5% 28.7% 2.8%
7.5% 24.6% 18.8% 8.5% 9.9% 0.0% 0.0%
13.6% 20.9% 13.3% 19.0% 14.2% 25.0% 0.0%
8.8% 5.7% 7.7% 3.4% 3.1% 0.0% 0.0%
18.6% 20.9% 9.5% 5.1% 4.9% 0.1% 0.0%
1.1% 3.8% 3.1% 2.7% 4.5% 0.0% 0.0%
8.2% 8.1% 38.1% 8.8% 27.9% 46.2% 97.1%
100.0% 100.0% 100.0% 100.0% 100.0% 100.0% 100.0%
All Tamil Nadu
6,226
33.1%
11.3%
18.0%
5.2%
10.6%
2.6% 19.1%
100.0%
2.4 Multiple cropping in Tamil Nadu is severely limited by the relatively low levels of rainfall, concentrated in only a few months of the year. Only one crop per year can be grown in the upland areas in most parts of the state. Even in river valleys, water availability through
7
surface irrigation in canals is sufficient for two crops in only a few areas, and depends heavily on the extent and timing of the southwest monsoons. Likewise, water availability through irrigation from tanks or wells is limited in the dry season. Thus, although 55 percent of net area cultivated in Tamil Nadu is irrigated, the cropping intensity is only 1.2. In the drier south region (zone 6), the cropping intensity is only 1.06 (Ramasamy et. al., 2003) . Major Crops 2.5 Rice dominates both agricultural production and food consumption, accounting for about one-third of total gross cropped area and nearly 60 percent of irrigated area in Tamil Nadu (Figure 2.2, Table 2.3). About 5 percent of total cropped area is devoted to sugar cane, all of it irrigated (accounting for almost 10 percent of irrigated land). Pulses (18 percent of total cropped area), millets (11 percent) and groundnuts (10 percent) require less water that rice or sugar cane, and, millets and pulses are grown almost exclusively on non-irrigated land. Cotton occupies only about 3 percent of cropped area; about one third of the cotton crop is irrigated (Figure 2.3). Water shortages, ample supplies of Food Corporation of India rice stocks, and potential for cultivation of higher value crops underlie the Tamil Nadu government’s policy of promoting crop diversification.
Gross Cropped Area ('000 Hectares)
Figure 2.2: Distribution of Gross Cropped Area by Crop 7,000 Other crops
6,000
Sugarcane 5,000
Cotton
4,000
Other cereals Pulses
3,000
Millets
2,000
Cholam (Sorghum) Groundnut
1,000
Paddy
0 1980-81
1990-91
2001-02
Source: Ramasamy et. al, 2003
Figure 2.3: Irrigated Area by Crop (1999-2000) Paddy Groundnut Millets Cropped Area
Pulses
Irrigated Area
Sugar Cane Cotton Other Crops 0
500
1000
1500
2000
Area ('000 Hectares)
8
2500
Source: Ramasamy et. al, 2003
2.6 In most of Tamil Nadu, a single rice crop is grown, planted some time between August and October in anticipation of the onset of the northeast monsoons and harvested 8 four to five months later. In the Cauvery delta region, which accounted for 33 percent of rice area cultivated in 2001/02, two rice crops are grown on land where sufficient water is available. On about 120 thousand hectares of cultivated land, the kuruvai (June/July – October/November) rice crop is followed by thaladi (October/November – February/March) in the four major 9 districts . On another 200-240 thousand hectares of land, there is generally insufficient water for two crops (because of drought or lack of canal water), and a single samba crop (August-January) 10 is grown. Total gross cultivated area of rice in these districts is thus 440-480 thousand hectares. 2.7 Rice production increased rapidly in Tamil Nadu from the 1950s to the 1970s, as green revolution technology (high-yielding varieties, fertilizer, and irrigation) spread. Area planted to paddy in Tamil Nadu expanded by 52.6 percent from 1.73 million hectares in 1950/51 to an average of 2.64 million hectares in 1970s, in part due to increased well irrigation. Yields also increased, from an average of 1.31 tons of paddy (in rice equivalent) in the 1950s to 1.94 tons in the 1970s. As a result, average production in the 1970s was 87 percent higher than that of the 1950s (Rajagopalan, 2000). 2.8 Area planted to paddy peaked in 1979/80 (2.906 million hectares), but has declined steadily since that time, from 2.82 million hectares for the triennium ending (TE) in 1979/80 to 2.13 million hectares for the triennium ending in 2001/02 (a 24.4 percent decline in total). Yield increased by 67.6 percent over the same period (from 2.02 to 3.39 tons/ha), more than outweighing the decline in area. The most rapid period of yield growth occurred in the late 1980s: from the triennium ending in 1985/86 to 1990/01, yields increased by 44.1 percent from 2.14 to 3.08 tons/hectare. Overall for the entire period (1979/80 to 2001/02), production of rice increased 26.7 percent, reaching a peak of 8.14 million tons in 1998/99. 2.9 Sugar cane, with a duration of 11 months, is grown on land irrigated by canals and 11 wells. About 10 percent of irrigated area is planted with sugar cane and the crop requires, on average 1800 millimeters of water per unit area cultivated. Given that a single crop remains in the field year-round, however, its total water use per crop per year is less than two crops of paddy, but still greater than any other crop. Over all, sugar cane, which accounted for 5.16 percent of gross cropped area in 2000-2001 used an estimated 14.0 percent of irrigation water resources. Sugar cane yields in Tamil Nadu (109 tons/ha) are the highest in India (all-India yield is 68 tonnes/ha). Four-fifths of sugar cane is sold directly to sugar mills; the remainder is used to make jaggery (i.e. gur or unrefined sugar). Government support prices have maintained output price incentives for sugar production over time. While real market prices for paddy have declined
8
The timing of the cropping seasons shown here and elsewhere in this report are approximate, and vary somewhat across regions and according to the timing of the monsoon rains.
9
Figures on crop area by season are for the four districts of the Cauvery delta as defined by the Department of Agriculture: Thiruchirapalli, Thanjavur, Thiruvarur, and Nagapattinam. Two other districts, Karur and Perambular, districts are included in the Cauvery Delta agro-climatic zone in the tables in this report.
10
See Hazell and Ramasamy (eds.), (1991) for a detailed description of cropping patterns in North Arcot (Vellore and Thiruvannamalai districts).
11
A second ratoon crop, grown from the roots and base of the stalks from the first harvest, is cultivated on approximately 70-80 percent of the area planted to sugar cane.
9
by an average of 4.8 percent per year from 1990 to 2000, real prices of sugar cane have increased slightly over the same period (0.5 percent per year) (Table 2.4). Table 2.3: Area and Share of Gross Cropped Area (GCA) by Crop 1980-81 1990-91 2001-02 000 ha % GCA 000 ha % GCA 000 ha % GCA Paddy Cholam (Sorghum) Cumbu (Pearl Millet) Ragi (Finger Millet) Maize
2,299 591 328 197 19
35.54 9.14 5.07 3.04 0.29
1,856 541 274 170 27
28.07 8.18 4.15 2.57 0.42
2,060 317 125 125 13
33.08 5.09 2.01 2.01 0.21
Other cereals
266
4.11
169
2.56
66
1.05
Total cereals
3,703
57.23
3,038
45.95
2,766
44.43
Total pulses
544
8.41
847
12.81
1,122
18.03
4,247 183
65.64 2.83
3,885 233
58.76 3.52
3,888 321
62.45 5.16
Vegetables Cotton
221
3.41
147 239
2.22 3.62
216 164
3.46 2.64
Groundnut Coconut
842 112
13.01 1.73
963 180
14.56 2.72
663 336
10.65 5.39
Fodder crop
106
1.63
210
3.17
200
3.22
23
0.36
4
0.05
8
0.13
6,470 1,109 5,360
100 -
6,612 1,033 5,578
100 -
6,226 1,054 5,172
100 -
1.2
-
1.19
-
1.2
-
Total food grain Sugarcane
Green manure Gross cropped area Area cropped more than once Net cropped area Cropping intensity Source: Ramasamy et. al, 2003
Table 2.4: Growth rates of real Market Prices of Major Commodities Year 1980-1990 1990-2000 1980-2000
Paddy Cholam Groundnut Cotton Sugar Cane -3.00% -2.90% -1.50% -1.60% -2.20% -4.80% 1.00% -2.60% 0.70% 0.50% -2.70% -1.40% -1.60% 0.30% 0.00%
Source: Paddy data from Raveendaran (1994) and Department of Agriculture. All other crops from TNAU Agriculture Report
2.10 Cotton cultivation declined during the 1990s by 2.38 percent per year due to increased incidence of pests and diseases, the high cost of pesticides, and unstable output prices. Cotton is cultivated throughout the state except in the high rainfall zones, with the largest concentration in the drier southern zone (Table 2.5). Although cotton requires less water than rice (about 600 millimeters per season), it is a longer duration crop (six months) than rice (generally 4 months). Thus, cotton cultivation in most of Tamil Nadu requires some irrigation.
10
Nonetheless, it does not grow well in water-logged soils, making cotton cultivation difficult in canal systems with heavy soils and lack of water control. As a result, cotton cultivation is concentrated in the western zone, where irrigation in drier months is supplied by well water. Biological control methods that include intercropping of cotton with other plants have enabled a reduction in pesticide use in recent years. Commercial cultivation of genetically modified Bt cotton commenced in Tamil Nadu during 2002. (Text Box 2.1). Only about 50,000 tons of the 600,000 tons of cotton lint used annually by the state’s textile factories (mainly around Coimbatore) are produced in the state; the bulk of the cotton lint derives from Maharashtra, other Indian states, and imports. Table 2.5: Tamil Nadu: Share of Area Cultivated by Agro-ecological Zone for Major Crops (2001-02) Other Paddy Cereals Pulses
GCA 1. Northeast 2. Northwest 3. Western 4. Cauvery Delta 5. Southern 6. High Rainfall 7. Hilly
27.3% 13.1% 10.9% 21.8% 23.9% 1.7% 1.3%
32.8% 5.9% 3.0% 32.6% 24.2% 1.4% 0.1%
All Tamil Nadu 100.0% 100.0% Source: Ramasamy et al. , 2003
17.7% 27.9% 17.7% 16.1% 20.6% 0.0% 0.0%
23.4% 17.2% 9.1% 26.2% 21.4% 2.6% 0.0%
Sugar Cane
Groundnuts Cotton
43.8% 13.7% 15.4% 13.7% 13.5% 0.0% 0.0%
100.0% 100.0% 100.0%
45.7% 24.5% 9.2% 10.1% 10.5% 0.0% 0.0%
10.4% 17.9% 12.2% 20.9% 38.6% 0.0% 0.0%
Other Crops 9.4% 7.2% 21.2% 12.1% 38.4% 3.0% 8.7%
100.0% 100.0% 100.0%
Table 2.6: Distribution of Gross Irrigated Area by Major Crops (1999-2000) Cropped Area '000 has
Share of Cropped Irrigated Irrigated Irrigated/ Water Irrigated Area Area Area Total Area Requirement Water Use percent '000 has percent percent mms percent
Paddy Millets
2164 776
33.20% 11.90%
Pulses Cotton Sugar Cane Groundnut Other Crops
693 178 316 759 1633
10.60%--2.70% 4.80% 11.60% 25.00%
Total
6519
Current Fallow Other Fallows
1085 1139
100.00%
2016 93
58.70% 2.70% ---
93.20% 12.00%
1350 500
67.10% 1.10%
400 650 1800 500 800
1.00% 14.00% 3.30% 13.50%
---
62 316 265 684
1.80% 9.20% 7.70% 19.90%
34.80% 100.00% 34.90% 29.40%
3436
100.00%
52.70%
100.00%
Note: Irrigated area under other crops includes pulses. Water requirements for other crops estimated at 800 mms, given water requirements of chilies and turmeric (850) and tomatos (550). Share of water use estimated using water requirement times irrigated area. This estimate assumes that each irrigated crop receives the same share of its water requirements from irrigation. Source: GoTN, 2002b.
11
2.11 Production of cholam (sorghum/jowar), cumbu (pearl millet/bajra), and ragi (mundua/finger millet) increased slightly in the 1980s, but declined in the 1990s, registering overall growth rates of -2.33, -2.05 and -1.02 per cent respectively over the entire period. These crops (included along with maize in the broad category of “millets” in Tamil Nadu), are grown almost exclusively on non-irrigated land, as cumbu and ragi are particularly drought tolerant. Often planted on non-irrigated land in December/January after the northeast monsoon has ended, the crop survives on residual moisture and is harvested in the dry season (around April). Shifts in food habits due to increased income and urbanization have reduced demand for these crops, and real prices of cholam declined by 1.4 percent per year over the 1980s and 1990s, despite the slow growth in production (Table 2.4). Text Box 2.1: Bt Cotton in Tamil Nadu Genetically modified Bt cotton has been grown commercially in Tamil Nadu since 2002 and is currently the only biotech crop that has been approved for commercial cultivation in the state. Bt cotton contains the gene for Cry1AC which provides a high degree of resistance to the bollworm, a common pest whose larvae feed on cotton bolls. The technology introduced into India through a collaboration between Monsanto and the Maharashtra Hybrid Seed Company (Mahyco) received commercial approval in 2002 with farmers in Tamil Nadu harvesting their first crop of Bt cotton in January/February, 2003. According to data from Mahyco Monsanto Biotech (India) Ltd. (MMB) 295 farmers have planted Bt Cotton over an area of 374 hectares in Tamil Nadu. Of the 925 packets of seed sold during the 2002 Kharif crop, 745 were of the MECH 162 variety, with the remaining 180 being of the MECH 184 variety. Early experience from the state indicates that pesticide use against bollworms dropped by 65-70 percent on most farms and farmers realized an average yield increase of 30 percent (MMB). As a result of the drought in Tamil Nadu last year the pest pressure was low resulting in the Bt cotton crop faring fairly well in the state in comparison to other southern states which grew Bt cotton. Normally farmers spray 8-10 times for controlling bollworms in their cotton crop. As many as 15 sprays may be needed in some districts of Tamil Nadu. Farmers cultivating Bollgard in 2002-03 managed their crop with a maximum of 4 sprays. In most cases farmers only used 2-3 sprays in the Bollgard Cotton crop, compared to 6-8 sprays used in other commercial cotton crops. As pest related damage on cotton plots in India is fairly high (averaging 50-60 percent), the yield effects of Bt cotton in field trials in India have been larger than those observed in countries such as China and the United States where pest pressure is lower and farmers exhibit a higher rate of pesticide adoption. It is still too early to assess the real success of Bt cotton in Tamil Nadu. Increasing bollworm resistance to Bt resulting from poor farm management practices is growing cause for concern.
2.12 Maize production has increased very rapidly (by 8.25 percent per year) over the last two decades from just 20 thousand tons in 1980-81 to 118 thousand tons in 2001-02, due to an increase in demand from the poultry and other livestock feed industries. Production is concentrated in western and southern zones, the two zones with the lowest annual rainfall. There has been little change in average yields, which have hovered at about 1.6 tons/hectare. 2.13 Groundnut production increased by 5.07 percent per year in the 1980s, but stagnated during the 1990s (declining by 0.50 percent year), due to a decline in area cultivated (Table 2.7). Slack demand for groundnuts, reflected in an average decline in real market prices of 2.6 percent year in the 1990s, has reduced producer incentives, as well (Table 2.4). Nonetheless, yields have increased by an average of 3.32 percent over the 1980s and 1990s. Groundnuts require far less water than rice and do not perform well in water-logged soils, so they 12
are typically grown from December through April, after the heavy monsoon rains. Nonetheless, for 35 percent of area cultivated, supplemental irrigation is used in the dry season. Groundnut cultivation is concentrated in the Northeast and North zones which account for 70 percent of groundnut area cultivated, (45.7 and 24.5 percent, respectively). 2.14 The share of gross cultivated area devoted to horticultural and other crops has increased from 15.1 percent in 1980-81 to 19.5 percent in 1990-91, but has remained at only 19.1 percent in 2001-02. In 2002-03 approximately 815,000 hectares (12.5 percent of total cropped area) was under horticultural crops. Plantation crops accounted for 29 percent of the horticultural crop area with fruits, vegetables and spices accounting for a further 28 percent, 22 percent and 19 percent, respectively. The recently announced Comprehensive Wasteland Programme aims at promoting perennial horticulture crops on 2 million hectares of cultivable wastelands in the state. The state has also been promoting the cultivation of medicinal and aromatic plants with these crops accounting for approximately 5000 hectares (less than 1 percent of total cropped area). There is a growing interest in bio-fuel crops (Jatropha and Paradise Tree) although these crops are yet to be grown commercially in the state. Table 2.7: Growth Rates in Area, Yields and Production: 1980s and 1990s
Rice Cholam Cumbu Ragi Maize Red gram Green gram Black gram Horse gram Sugarcane Turmeric Coriander Groundnut Gingelly Cotton Tapioca Banana Tomato Onion Other Crops Total
% GCA Area Yield Production 2001-02 1980's 1990's Overall 1980's 1990's Overall 1980s 1990s Overall 1.03 -0.24 7.54 0.87 2.87 4.82 1.90 2.62 33.08 -2.53 -0.99 -4.92 -3.99 5.85 -0.73 1.74 4.8 -5.61 -2.33 5.09 -4.41 4.2 3.09 2.48 1.57 -3.23 -2.05 2.01 -2.52 -6.13 -3.23 3.99 0.20 2.29 1.72 -4.39 -1.02 2.01 -2.18 -4.58 5.88 10.35 8.00 1.00 -0.11 0.23 6.94 10.23 8.25 0.21 5.43 -5.87 0.06 2.02 1.13 0.18 7.56 -4.81 0.24 1.02 3.89 -1.4 2.85 4.38 -0.06 2.08 8.44 -1.45 4.99 2.07 7.98 -2.59 1.95 3.72 -1.26 1.66 11.99 -3.81 3.64 4.27 -4.8 -6.06 -4.17 2.9 1.72 2.99 -2.05 -4.45 -1.31 1.61 2.83 3.7 3.4 0.52 0.78 0.59 3.36 4.51 4.01 5.16 3.2 11.35 2.57 3.38 1.35 0.63 6.69 12.85 3.22 0.38 -3.65 -0.32 0.67 -3.28 -1.2 -3.99 -6.81 0.48 -0.89 -4.62 2.33 -3.83 0.32 2.68 3.47 3.32 5.07 -0.50 3.65 10.65 5.00 -4.72 0.62 -2.2 4.77 2.22 2.69 -0.18 2.85 1.35 3.00 -2.57 0.4 4.5 0.2 0.93 7.64 -2.38 1.34 2.64 3.78 1.26 3.61 2.12 0.77 1.85 5.98 2.04 5.52 1.73 0.22 3.65 3.15 6.94 3.2 4.48 7.17 6.96 7.77 6.68 8.14 7.29 -0.06 0.06 -7.12 7.12 0.43 1.12 3.22 2.34 0.57 0.41 -1.07 1.7 3.64 1.25 0.46 25.35 100
Source: Ramasamy et al, 2003
Output Price Incentives: Nominal Rates of Protection for Major Commodities 2.15 For most of the last two decades, producers of rice and cotton in Tamil Nadu have been implicitly taxed through price and trade policies that kept domestic prices below
13
12
border prices. The nominal protection coefficient (NPC) for paddy, calculated as the domestic price (in this case the procurement price for common variety paddy), divided by the border price, averaged only 0.64 in the 1990s; i.e. the procurement price was on average 36 percent below the border price (Table 2.8). Similarly, cotton (kapas) prices were 26 percent below border prices (average across India). Sugar prices, however, were 21 percent higher than border prices in the 1980s and only 8 percent below border prices in the 1990s. 2.16 There has been no implicit taxation of rice in Tamil Nadu through price and trade policies in recent years, however. NPC’s for paddy in 2001-02 are, in fact, slightly positive. 13 Cotton (all-India average) remains taxed relative to international prices, as does groundnut. Prices of refined sugar are likewise near (import parity) border prices. Thus, estimated trade distortions for the two most water-intensive major crops in Tamil Nadu (paddy and sugar cane) have declined, and were minimal in 2001 and 2002. Table 2.8: Nominal Protection Coefficients for Major Crops in Tamil Nadu, 1980-2002 Riceb Cotton Cotton Sugar Sugar Groundnut Ricea (paddy) (paddy) (kapas) (kapas) (refined) (refined) (pods) Importable / Exportable 1981-1990 1991-2000 2001-2002
Import
Import
Export
Import
Export
Import
Import
0.83 0.64 1.03
1.20 0.76 1.06
0.97 0.80 0.65
0.87 0.74 0.59
1.58 1.21 1.47
1.21 0.92 1.04
1.31 0.83 0.79
Note: a Using procurement price of paddy (common variety). b Using wholesale price of paddy (common variety). All NPCs except for cotton are measured at TN rural markets, assuming that rural market exports to Chennai. NPCs for cotton are national averages. Rice: 15% broken, FOB Bangkok. Groundnuts: C&F Rotterdam (kernels) converted to pods using 0.7 kgs kernel/ kg pods. Cotton: World prices of lint cotton, converted to value of seed cotton (kapas; Sugar: FOB Europe, refined sugar. Source: Gulati and Marayanan (2003); authors' calculations
Agricultural Inputs: Fertilizer Use and Mechanization Average fertilizer consumption in Tamil Nadu has increased over the years with consumption per hectare increasing from 107.86 Kg in 1986/87 to 121.03 Kg in 1999/00, an average annual growth rate of 1.90 percent per annum. Average per hectare consumption was 66.7 Kg for Nitrogen, 28.33 Kg for Potash and 26.01 Kg for phosphorous. Approximately 67 percent of households growing crops report use of fertilizers (Table 2.9). The proportion of farmers reporting use of fertilizers is slightly lower than Punjab and AP, but higher states such as Maharashtra and Karnataka.
12
Note that the nominal protection coefficients do not include any adjustment in exchange rates. Accounting for the overvaluation of the rupee in the 1980s and early 1990s would raise the estimated border price in rupee terms and lower the nominal protection coefficients in this period. Thus, the degree of taxation on Tamil Nadu agriculture in the 1980s and early 1990s is understated in Table 2.8.
13
The estimated 21 percent implicit taxation of groundnuts relative to world prices may reflect domestic constraints in processing and marketing, as well as differences in quality of groundnuts for alternative end uses (direct consumption and crushing for groundnut cake and oil).
14
Table 2.9: Characteristics of Agriculture in Various States (1998)
Principal Cropped Area (ha) Households Using Tractors/Power Tillers Households Using Fertilizers
Andhra Pradesh Karnataka Maharashtra Punjab Tamil Nadu 1.33 2.09 1.72 2.60 0.86 43.53% 70.59%
16.11% 53.40%
13.75% 92.38% 56.25% 72.10%
49.96% 67.16%
Households Using Pesticides
82.14%
63.04%
49.74% 86.86%
86.40%
Households Using Improved Seeds
69.70%
69.17%
70.31% 80.05%
66.93%
Households Using Weedicides
24.32%
27.97%
15.08% 78.58%
52.70%
Households that Own Electric Pumps
30.21%
19.36%
28.77% 51.03%
32.69%
5.82%
2.30%
3.85% 38.10%
14.71%
Households that Own Diesel Pumps
Source: Authors’ calculations using the 54th round of the NSS (1998). Households reported area cultivated under five principal crops and the use of various inputs for each principal crops.
2.17 Rates of pesticide consumption appear to be declining over time with growing awareness of the deleterious health effects of exposure to chemicals, the use of organic pesticides and the adoption of pest resistant varieties of crops. Despite this farmers in Tamil Nadu appear to be more likely to use pesticides and weedicides as compared to farmers in Neighboring states such as AP, Karantaka and Maharashtra. Approximately 53 percent of farmers in Tamil Nadu report using weedicides and about 86 percent report using pesticide, insecticides, fungicides etc. The proportion of households reporting using pesticides is comparable to Punjab. Approximately 67 percent of farmers report using improved varieties of seeds. The proportion of farmers using improved varieties of seeds in Tamil Nadu is less than most southern Indian states and Punjab where close to 80 percent of farmers use improved seed varieties. 2.18 The degree of mechanization in agriculture in Tamil Nadu is still relatively low although it is higher than most southern states. According to data from the 54th round of the NSS (1998), only 50 percent of agricultural households in the state used tractors or power tillers (Table 2.9). While the degree of mechanization is relatively low compared to Punjab where more than 90 percent of agricultural households reported using tractors/power tillers it is higher than most southern state including Andhra Pradesh, Maharashtra and Karnataka. The majority of households (89 percent) using tractors or power tillers in Tamil Nadu rented these services. Land 2.1 Current land distribution and use in much of Tamil Nadu reflect centuries old 14 patterns of settlement and cultivation in the valleys and plains. In pre-colonial society, 14
Baker (1984) distinguishes a third major region, Kongunad, in western Tamil Nadu (approximating the modern districts of Coimbatore and Erode), as a mix of plains and valley geography and society. P.93f
15
river valley villages, where agriculture centered on irrigated rice, were divided into two exclusive groups: the land owning Brahman and Vellala (nobles), and the outcaste laborers (usually Pallan or Paraiyan) (Baker, 1984:87). The economy of the drier plains with generally poor soils outside 15 the valleys was based on livestock, hunting, cultivation of millet, and non-agricultural activities. 2.2 The average farm size (individual holdings) in 1995-96 was only 0.91 hectares, with 52.5 percent of farms less than 0.5 hectares (Table 2.10). 74.3 percent of farms were less than 1.0 hectare, accounting for only 30.2 percent of the land. Table 2.10: Land Distribution in Tamil Nadu, 1995-96 Size of holding (hectares)
Number Of farms
Percentage of farms
Area Area Area (Ha) (hectares) (percent) (average)
Less than 0.5 0.5-1.0 1.0 - 2.0 2.0 - 4.0 4.0 - 10.0 Greater than 10.0
4,205,413 1,745,691 1,233,836 600,833 199,791 26,268
52.49 21.79 15.40 7.50 2.49 0.33
982,356 1,227,988 1,721,288 1,622,810 1,134,853 613,911
13.45 16.81 23.57 22.22 15.54 8.41
0.23 0.70 1.40 2.70 5.68 23.37
Total (all sizes) Source: GoTN, 2002a
8,011,832
100.00
7,303,206
100.00
0.91
Land Resource Policy and Administration 2.19 There is no explicit statement of State Land Use policy in Tamil Nadu; the policies are implicit in the legislative and administrative measures related to the regulation of land use. The Revenue Department administrates all the government lands including those vested with the various departments of the state government. Following the Tamil Nadu Patta Pass Book Act, 1983, private owners of agricultural land are issued Patta pass books. These serve as evidence of ownership that facilitates loans from financial institutions, co-operative banks and commercial bank. 2.20 Land reforms in India were designed to (1) to enhance the productivity of land (2) to ensure distributive justice (3) to create a system of peasant proprietorship and (4) to transfer the incomes of the few to many so that the demand for consumer goods would be created. By 1972, laws had been passed in all the States to abolish intermediaries. In Tamil Nadu, Karnataka, Kerala, Andhra Pradesh and Orissa, measures in the form of an order for staying ejection have been adopted to give temporary protection to the tenants. As a result of these measures, 92 per cent of the holdings in India are wholly owned and self-operated. By the year 1972, ceiling legislation had been passed in all the States. Land ceilings in Tamil Nadu (4.86 hectares for irrigated land with two crops; 12.14 hectares for irrigated land with one crop and 24.28 hectares for dry land) have relatively little effect on land distribution, however, due to registration of land in the names of various family members, and reportedly even in the names of
15
“The importance of agriculture in the valleys made control of land the crucial feature of social organiztion. By contrast the crucial feature in the plains was control of men… The importance of military service and, to a lesser extent, the production of goods and services, laid great stress on the control of men and their ability to work or fight.” Baker, p. 90.
16
workers (with their knowledge). Nonetheless, the number of farms greater than 10 hectares is rather small (0.33 percent), accounting for only 8.41 percent of area (Table 2.10). Livestock 2.21 The performance of the livestock sector has been strong. The livestock sector (including animal husbandry, poultry and dairy) is an important contributor to Tamil Nadu’s agricultural growth. This sectors is also important for rural livelihoods offering a source of income and employment. For many rural households livestock are the main instrument for savings and insurance. Livestock also provide a source of power for tilling land and organic fertilizer (manure). According to the last census, TN had about 5.3 percent of India’s livestock population. Thirty-eight percent of the livestock population comprises of cattle, 11 percent of 16 buffaloes, 25 percent goat, 20 percent sheep and 2 percent pigs (Livestock Census, 1997). TN 17 ranks second among Indian states in egg production and nineth in terms of milk production. Approximately 6 percent of national milk production came from TN in 2001/02 and the state accounted for 11.9 percent of India’s egg production. 2.22 There is significant growth potential for the livestock and poultry sectors arising from growing consumer demand. With increasing urbanization and growing per capita incomes, the demand for animal products (meat, eggs and dairy) in Tamil Nadu have been increasing. Production of the main animal products has also been increasing to meet consumer demand. Milk production in the state has increased from 3.29 million tones in 1986-87 to 4.90 million tones in 2000-2001. Milk production increased at an average annual rate of 4 percent. Egg production has also increased by approximately 4 percent per annum in the 1990s. Growth of meat production has been much slower averaging 1 percent per annum between 1996/97-99/00. Cross bread cows contribute to approximately 37 percent of the milk produced in the state, while indigenous breads and buffaloes contribute roughly 26 percent and 37 percent, respectively. Milk yields (yield per animal) from crossbred cows of 5.72 Kg/day are slightly lower than the all-India average of 6.36 Kg/day, but significantly lower than yields in Punjab (8.7 Kg/day). The same trend can be observed for yields from buffaloes which is 3.68 Kg/day. Yield from indigenous cows (2.4 Kg/day) are comparatively high compared to most India states. 2.23 Most of the poultry production in the state derives from large commercial units. 70 percent of poultry products are produced by commercial farmers with the remaining 30 percent being produced by small holders (personal communication with Secretary, Animal Husbandry). While this increases efficiency in production, food safety concerns and concerns for animal welfare will increase. Environmental effects, particularly eutrophication from high levels of phosphorous and nitrogen runoffs, could become problematic without proper regulation. Smallholders may be crowded out of the sector since by its structure the industry lends itself to economies of scale. The growth in the poultry industry has contributed to rapidly increasing demand for maize as poultry feed. 2.24 Unlike poultry production, the dairy industry is still dominated by small-holders. Much of the milk produced in the state is marketed through milk producers cooperatives. In 20012002 the state had 8,238 Dairy Cooperative Societies with a membership of approximately 2.04 million members. The number of dairy cooperatives and farmer members in Tamil Nadu has almost quadrupled since the early 1980s (NDDB, Annual Report, 2000/01). The commercial sector produces 30 percent of milk, with small holders (who have an average of 1-3 cows) 16 17
Livestock population refers to cattle, buffalo, goats, sheep and pigs. Ranks are computed based on average production in Indian states between 1999 and 2001.
17
producing 70 percent of milk in the state (personal communication with Secretary, Animal Husbandry). Recent drought in the state has reduced fodder production which has implications for the quality of milk yields from cows and buffaloes. Adequate cold storage and further improvements in veterinary services are needed for this sector to realize its full potential. Fisheries 2.25 Tamil Nadu’s fisheries sector has significant potential, but its performance has been mixed. The state has a coastal length of 1,076 km, equivalent to 15% of India’s coast line and is also well-endowed in terms of in-land fisheries. The inland fisheries sector has about 370,000 ha of water spread area, comprising of 52,000 ha of reservoirs, 97,700 ha of major irrigation and long seasonal tanks, 158,100 ha of short seasonal tanks and ponds and 63,000 ha under estuaries, backwaters and swamps. Figure 2.4: Growth in Fisheries SGDP
Growth in Fisheries SDP
10.00% 8.00% 6.00% 4.00%
Tamil Nadu
2.00%
All-India
0.00% -2.00%
198081/84-85
85/8689/90
90/9194/95
95/9699/00
-4.00%
Source: India States Database
2.26 The contribution of the fisheries sector to total agricultural and allied sector GDP has decreased over the past two decades from roughly 7% in the early 1980s to 4.5% in 2001/02 (Figure 2.4:). Growth in the fisheries sub sector has fluctuated and growth rates consistently fall below all-India averages. Production is around 0.5 million tones with four-fifths of fish production from wild fisheries (marine fisheries). The state’s fish production accounts for 13.2 percent of total marine fish production and 4 percent of total in-land fish production in India (GoTN, 2001c). 2.27 Marine fisheries are an important export earner for the state and accounted for 5.5% of total export earnings in 2001. The coast of Tamil Nadu has also become attractive for investment in shrimp culture. However growth in shrimp production has slowed down since a ban was imposed on shrimp culture in the Coastal Regulation Zone (area within 50 metres of the coast line) due to growing problems with salinity (GoTN, 2001c).
The Rural Non-farm Sector 2.28 The non-farm sector is an important source of income and employment for rural households in Tamil Nadu. Data from 1993/94 indicate that on average income from non-farm sources accounted for 46.4 percent of rural households incomes. The average real per capita
18
income in 1993/94 was Rs 4,867. In Tamil Nadu the share of non-farm income increases monotonically with households wealth. For the lowest expenditure quintile, non-farm incomes accounted for 19.8 percent of household incomes, on average. In contrast, income from non-farm sources contributed slightly more than half of household income for the wealthiest quintile. 2.29 The Government of Tamil Nadu has encouraged development of the non-farm sector through the Tamil Nadu Khadi and Village Industries Board established in 1960. The Board promotes Khadi and Village Industries in order to create employment opportunities for rural artisans. Khadi industries are involved in the production of cotton, wool, silk and muslin while village industries engage in production activities that are mineral-, forest-, polymer and chemical-, agro-, engineering-, textile-, and service-based. The Board provides financial assistance to artisans to start their own industries. In 2000-01 Khadi and Village Industries provided employment for approximately 1 million workers. Among the various industries, almost 71 percent of employment was in agro-based industries with Palm Gur production alone accounting for 60 percent of employment in Khadi and Village industries (Figure 2.6:). Total earnings of the Khadi and Village based industries in 2000/01 amounted to approximately Rs 2.7 billion. Other important industries in terms of employment creation were pottery, bee-keeping and village leather production.
Percentage of Household Income
Figure 2.5: Non-farm Income Share in Rural Tamil Nadu, 1993/94 60 50 40 30 20 10 0
Incom e Quintiles Cultivation
Agriculture w age Labour
Total Nonfarm sources
Other sources
Source: Lanjouw, Jayaraman and Kijima, 2003
2.30 Continued growth of the agro-processing sector is likely. Value added in the agroprocessing sector in Tamil Nadu grew by 3.4 percent between 1989/90 and 1997/98, the latest year for which data is available (Table 2.12). Population growth, rising incomes, and increased urbanization will foster an increasing shift in demand from raw, unprocessed products to high value processed foods. Food products and cotton textiles accounted for 10 percent and 28 percent of net value added by the industrial sector in the late 1990s (1997/87). By 1997/98 four agro-processing industries, cotton spinning, weaving and processing, processing, manufacture and refining of sugar, processing and blending of tea and grain milling accounted for 87 percent of value added in the agro-processing sector and close to 80 percent of employment in the sector (Figure 2.7:). 2.31 In order to encourage growth of the agro-processing sector Tamil Nadu has recently launched the New Anna Marumalarchi Thittam. The 2002-03 Budget speech announced the restructuring of the existing Anna Marumalarchi Thittam scheme into the New
19
Anna Marumalarchi Thittam which will place special emphasis on the agro-processing sector. The new scheme in effect since June 2002 encourages the development of small scale agro-based industries such as processing of horticultural products, flower based extracts, coir and food processing. Under the scheme, investment in agro-based industries will be encouraged in each of the 385 Blocks of Tamil Nadu through a packages of subsidies and incentives.
80 60 Employment
40
Earnings
20 Textile Industries
Engineering and Nonconventional
Agro-based industries
Polymer and chemical
Forest based Industries
Mineral based Industries
0
Khadi
Share of Employment and Earnings (%)
Figure 2.6: Employment and Earnings in Khadi and Village Industries, 2000/01
Type of Village Industry
Source: Authors’ calculations using data in Ramasamy, et al., 2003.
Table 2.11: Employment by Major Agro-processing Industries, 1989/90-1996/97 (Millions of Man Days) Manufacture Processing and Cotton Spinning, and Refining Blending of Weaving and of Sugar Tea Processing in Mills Other
Grain Milling
total
89-90
4.9
6.7
2.3
55.1
13.4
82.4
90-91
4.8
6.7
2.9
50.1
16.7
81.2
91-92
5.1
6.1
2.6
51.5
17.5
82.9
92-93
5.9
6.1
2.8
3.5
19.0
37.4
93-94
6.1
7.2
3.4
62.9
21.0
100.6
94-95
4.8
6.3
2.9
62.5
22.5
99.0
95-96
5.0
5.9
3.0
56.9
23.4
94.2
96-97
6.1
6.3
3.6
68.1
20.2
104.2
Growth (%)
1.8
-1.0
4.6
6.9
6.7
4.8
Source: Authors’ calculations using data in Ramasamy, et al., 2003.
20
Table 2.12: Value Added in the Agro-processing Sector by Major Agro-processing Industries, 1989/90-1997/98 (Rs Billion in constant 1993/94 Rupees)
Grain Milling
Cotton Spinning, Manufacture Processing Weaving and and Refining of and Blending Processing in Mills Sugar of Tea
Other
total
89-90
0.2
2.7
1.6
11.6
2.7
18.8
90-91
0.4
1.7
1.3
12.5
2.4
18.4
91-92
0.6
2.2
2.3
9.4
2.5
17.0
92-93
0.4
2.9
1.3
10.6
1.8
17.1
93-94
0.6
2.4
1.5
12.7
2.3
19.4
94-95
0.6
2.8
2.1
12.3
2.5
20.2
95-96
0.7
2.0
1.2
9.8
2.2
15.9
96-97
0.8
2.4
1.6
12.2
2.8
19.9
97-98
0.6
2.5
1.5
20.5
3.6
28.8
4.1
2.9
3.4
12.6 1.1 -1.2 Growth (%) Source: Authors’ calculations using data in Ramasamy, et al., 2003.
100% 80%
Other
60%
Cotton Spinning, Weaving and Processing in Mills
40%
Processing and Blending of Tea
20%
Manufacture and Refining of Sugar
0% 97-98
95-96
93-94
91-92
89-90
Share of Value Added in AgroProcessing Sector
Figure 2.7: Value Added in the Agro-Processing Sector by Industry
Year
Source: Authors’ calculations using data in Ramasamy, et al., 2003.
21
Grain Milling
3. Water for Agriculture 3.1 Tamil Nadu is a water scarce state. The annual per capita availability of water resources of Tamil Nadu is only 900 cubic meters compared to an all-India average of 2200 cubic meters. The rainfall received by the state is highly variable and drought conditions prevail in three out of every 10 years. Water is an essential factor of production for agriculture, which consumes 75% of the state’s water resources. Faced with growing scarcity, increasing demand for water from industries and commercial uses, and intensifying interstate competition for water, improving the productivity of water (“getting more crop from every drop”) in irrigated and rainfed agriculture is of great urgency in Tamil Nadu. 3.2 Improving the productivity of water in agriculture needs commitments to policy, institutional and management reforms as well as investments in crop research, technology and infrastructure. Tamil Nadu has already embarked on a process of reform including decentralizing water resources management along river basins, formalizing irrigation management transfer to users, revising water tariffs, and promoting water saving technologies. Commencing with a brief introduction to water resources in the state, the following chapter elaborates on recent reforms and the challenges that lie ahead for the state to increase agricultural growth while meeting the needs of other uses. Water Resources 3.3 Geographically, most of Tamil Nadu is a dry plain, with river valleys surrounded by low hills. The normal rainfall in the plains in the state is 925 millimeters per year, concentrated 18 during two monsoon seasons-the southwest and the northeast monsoon (Agrostat, 2001). Most of the rains from the southwest monsoon extending from June through September are blocked by mountains (the Western Ghats), on Tamil Nadu’s western border with Kerala and Karnataka. Except in the southern tip of Tamil Nadu (especially Kanniyakumari district), the southwestern monsoons are highly variable. The northeast monsoon rains, from October through December are more reliable and on average account for 47 percent of annual rainfall in the state. Little rain falls during the winter (January-February) or summer (March-May).
2000
1998
1996
1994
1992
1990
Total Rainfall
1988
1986
1984
1982
18
40% 30% 20% 10% 0% -10% -20% -30%
1980
3.4 Rainfall in the state is highly variable and has a pronounced effect on the performance of the agricultural sector (Figure 3.1, Table 3.1). In six years between 1980 and 2001 total rainfall was less than 90 percent of the average for the two decades. For these years, real agricultural GDP was on average 8.1 percent below trend GDP. A regression analysis shows that a one percent increase in rainfall relative to the mean is associated with a 0.3 percent increase in real agricultural GDP relative to the trend agricultural 19 GDP.
Percentage Deviation from the Mean
Figure 3.1: Rainfall and Agricultural & Allied GSDP
Agricultural & Allied GSDP
Source: Authors’ calculations
India’s average annual rainfall is 1,100 mm per year.
19
The regression equation is y=0.001+ 0.298x where y is the percent deviation in agricultural GDP from its logarithmic trend value, and x is the percent deviation in total rainfall from its mean value over the period. The standard deviation of the estimated coefficient on x is 0.100, t-statistic is 2.97 and the R2=0.31.
22
Table 3.1: Rainfall in Tamil Nadu
Season
Months
Winter rains Summer rains Southwest monsoon Northeast monsoon
Jan – Feb Mar – May Jun – Sep Oct – Dec
Share of Normal Normal Rainfall Annual Rainfall (mms) (percent)
Total Rainfall
42.2 136.5 307.6 438.7
4.5 14.8 33.3 47.4
925
100
3.5 Tamil Nadu has 17 river basins (including groups of minor basins), all flowing eastwards 20 The major rivers in the state are the Cauvery, from the Western Ghats and Deccan plateau. Palar, Vellar, Vaigai and Tambaraparani. The Cauvery delta, the largest river basin in the state, has been the rice bowl of Tamil Nadu for over 1500 years since the construction of the Grand Anicut (dam), which diverted water from the Cauvery to a system of irrigation canals. Water from the Cauvery is used to irrigate approximately 20 million hectares of land in Tamil Nadu. Cauvery water is shared with Karnataka (located upstream) and is the subject of ongoing disputes between the two states. 3.6 The state’s water resources are divided nearly evenly between surface water (23.6 billion cubic meters) and groundwater (22.3 billion cubic meters). Utilization rates are estimated to be 93% for surface water and 60% for groundwater. In many parts of the state, the rate of extraction of groundwater has exceeded recharge rates contributing to falling water tables. Out of 385 blocks in the state 23 percent are dark (extraction exceeding 100 percent of the recharge), another 23 percent of blocks are grey (extraction exceeding 65 percent of the recharge). The dark and grey blocks are particularly concentrated in the Western and NorthWestern Zones. 3.7 Water quality issues are of increasing importance. Effluents discharged from industries involved in dying and bleaching, as well as increasing use of fertilizers and pesticides, have had a major impact on surface water quality, soils and groundwater. For example, in the Noyyal river, a tributary of the Cauvery river, uncontrolled discharge of total dissolved solids have adversely affected agriculture as pollutants have contaminated water sources and soils. Overview of Water Use in Agriculture 3.8 Most farmers own only irrigated land or non-irrigated land; few farmers own significant amounts of both irrigated and non-irrigated land. According to data from the 55th round of the Indian National Sample Survey (NSS), in 1999/00 approximately 25 percent of farms in Tamil Nadu used little or no irrigation; by contrast, 65 percent of farms consisted of almost entirely irrigated land. Only about 10 percent of farms had significant shares (at least 20 percent) of both irrigated and non-irrigated land. Thus, agricultural programs that focus on irrigated crops will generally not directly benefit 25 percent of farm households. Similarly, 20
Some of these basins, including the Cauvery, are partially located in neighboring states.
23
programs that focus on non-irrigated crops will generally not directly benefit the 65 percent of farm households with essentially no non-irrigated land (Figure 3.2,Table 3.2) Figure 3.2: Area Cultivated by Share of Irrigated Land Per Farm 90 Thousand Hectares
80 70 60 50
Irrigated
40
Non-irrigated
30 20 10 0 0-20% 20-40% 40-60% 60-80%
80100%
Irrigated Area as a Share of Cultivated Area
Table 3.2: Access to Irrigation by Farms Percent of Cultivated Average share of irrigated land Distribution of Average Farm Size Area Farms (%) (Ha) Irrigated per farm (%) 0-20% 0.43 24.80 0.69 20-40% 30.75 2.27 1.7 40-60% 51.19 4.09 1.34 60-80% 67.99 4.15 1.53 80-100% 99.23 64.69 0.85 Total 71.69 100.00 0.88 Source: Authors’ Calculations from the 55th Round of the NSS (1999/00)
Rainfed Agriculture 3.9 Rainfed agriculture accounts for 45 percent of the gross cultivated area of 6.5 million hectares in Tamil Nadu and approximately 25 percent of farmers in the state are engaged in rainfed agriculture. Despite its importance as a source of income and employment, productivity in rainfed agriculture has been low. Tamil Nadu has implemented a number of centrally sponsored and donor funded watershed development schemes aimed at improving the production potential of rainfed agriculture. These schemes include the Drought Prone Areas Programme (DPAP), the National Watershed Development Project for Rainfed Areas (NWDPRA), the Integrated Wasteland Development Programme (IWDP) and the DANIDA funded Comprehensive Watershed Development Projects. 3.10 The DPAP implemented in Tamil Nadu since the early 1970s promotes natural resource management in watersheds so as to mitigate the adverse effects of drought, prevent further degradation and generate employment through non-farm activities. IWDP has the broad
24
objectives of sustainability, equity and environmental conservation to meet timber, fodder and fuel needs and to increase employment opportunities for Schedule Caste and Schedule Tribes and other socio-economically disadvantaged groups. This program has been implemented in the state since 1993/94 in non-DPAP blocks. NWDPRA focuses on sustainable production of biomass and restoration of ecological balance in watersheds and has been operational since 1990-91. This initiative has recently been restructured into the Watershed Areas Rainfed Agricultural Systems Approach (WARASA). All of these programs are jointly funded by the Central government and GoTN, with the center responsible for at least 75 percent of the costs. 3.11 The recently launched Comprehensive Wasteland Programme is a major initiative promoted by the GoTN which holds potential for improving water productivity in rainfed lands. The program aims to reclaim current fallow wastelands through a micro watershed development program focusing on soil and water conservation. Roughly 17 percent of Tamil 21 Nadu’s land area is classified as wastelands. The program has two main components. The first 22 promotes participatory watershed development of patta lands. The second component seeks to encourage development of government owned wastelands by corporate houses, small companies, cooperatives and Federations of Women’s Self Help Groups. 3.12 Farmers participating in the participatory watershed approach will receive a subsidy to partially cover costs for planting and irrigating horticultural and agro-forestry crops such as mangoes, cashew, sapota, tamarind, neem, silk cotton in the watersheds. The involvement of corporations in wasteland development will be encouraged by offering 30 year leases for wastelands of up to 1,000 acres to corporations that are interested in raising horticultural crops or bio-mass plantations on wastelands. Corporations leasing land under this program will pay concessional amounts of rent proportional to land value for use of the land. 3.13 Although watershed projects have been widely promoted throughout India the success of these projects in terms of curbing land degradation, improving the productivity of rainfed agriculture and reducing rural poverty has been limited. Reviews of watershed development programs in India have found that successful approaches to watershed development have entailed extensive community participation with sound technical inputs. The evidence also reveals that benefits of these projects have been skewed towards landowners, with landless people benefiting indirectly. In some cases women and landless may have actually been made worse off as their access to common property resources may be restricted as a result of project interventions. Adequately addressing these equity issues remains a challenge for governments and NGOs involved with implementing watershed projects. It has also been found that subsidies for soil and water conservation, and the opportunities for employment, can induce farmers to accept soil conservation strategies that they do not really want and are hence difficult to sustain in the long run once the project ends (Kerr et al, 2002). Tailoring conservation strategies to practices that farmers really want will be important in ensuring the success and long run sustainability of future initiatives. For programs such as the Comprehensive Wasteland Programme, it is also important that the state adopts a basin perspective in implementation to ensure that these initiatives do not have negative impacts on downstream human and ecological uses. 3.14 Rainwater harvesting is being promoted on a large scale in the state in an effort to supplement ground water resources. As much of the rainfall is received in a very short period, 21
Wastelands include barren and uncultivable land, cultivable waste, permanent pastures and other grazing lands, other fallow lands, 50 per cent of current fallows and 40 per cent of dry land. 22
Private lands where owners are issued a Patta Pass Book
25
rain water harvesting offers the ability to capture a transitory resource and can provide sufficient 23 water to grow less water-intensive crops. In urban areas, rainwater harvesting is a potential source of water for consumption purposes. As of July, 2003, the Government of Tamil Nadu has passed an ordinance requiring all buildings in the state to install rainwater harvesting structures before the monsoon. Irrigated Agriculture 3.15 Tamil Nadu has a net irrigated area of 3 million hectares (1999/00). Most irrigated lands are only irrigated for a single season and the state’s irrigation intensity of 121 percent is relatively 24 low. Today the state is equally reliant on surface and groundwater sources for irrigation, although its reliance on groundwater sources has been steadily increasing (Figure 3.3). Approximately 30 percent of the net irrigated area is irrigated by water from canals. An additional 21 percent is irrigated by tanks, while wells are used to irrigate 49 percent of the net irrigated area. The remaining area is irrigated by other sources such as streams and springs. Net irrigated area has increased by about 10 percent in the past two decades from 2.7 million ha in 1981/82, due mainly to a 39 percent increase in area irrigated by wells. Over the same period, area irrigated by canals and tanks decreased by approximately 4 percent and 14 percent, respectively. Figure 3.3: Net Irrigated Area by Source of Irrigation
Net Irrigated Area (Millions of Hectares)
3.5 3.0 2.5
Other
2.0
Wells
1.5
Tanks
1.0
Canals
0.5 1981-82
1991-92
1999-2000
Source: CMIE Yearbook, Various Years
Surface irrigation 3.16 Tamil Nadu has constructed more than 85 large and medium dams since independence. As the surface irrigation potential has virtually been exhausted, modernizing and rehabilitating existing systems is crucial to improve the efficiency of surface irrigation. The majority of canal systems in the state are old and have very poor efficiency as a result of seepage and silting in the canals (GoTN, 2001a). In recent years the state has undertaken some major canal modernization projects with the aide of World Bank funding under the Water Resources Consolidation Project.
23
On average there are 30 rainy days during the southwest monsoon and 55 rainy days during the northeast monsoon.
24
The all-India irrigation intensity is 132%.
26
3.17 In the 1960s, tank irrigation accounted for almost 37 percent of net irrigated area in Tamil Nadu. Area irrigated with tanks has steadily declined over time, however, because of siltation in tank beds and supply channels, encroachments in the tank bund, foreshore, and supply channels, and damaged sluices, weirs and bunds,. There are currently 41,948 tanks in the state of TN irrigating an area of 0.63 million hectares, the average area irrigated by a tank is 15.1 ha. Due to water shortages a large number of tanks in the state are defunct. A recent study found that in a 10 year period, tanks are only full for 2 years, they are partially full for 5 years and fail for 3 out of 10 years. Water markets are becoming increasingly important in the tank command areas and provide a means to supplement inadequate tank irrigation water particularly at the end of the paddy season. Farmers normally spend about 20 percent of their rice crop income on buying water from well owners. Since only 15 percent of farmers own wells in the tank command, demand for supplemental irrigation is high (Palanisami, 2003). Groundwater Irrigation 3.18 Factors including rural electrification, the availability of affordable irrigation pump sets and cheap or free electricity for agriculture have contributed to the increasing reliance on groundwater for irrigation in Tamil Nadu. Both the number of wells and area irrigated by them registered significant increases over the years. The number of wells (dug and tube wells) had increased from 1.68 million during 1981-82 to 1.83 million in 1999-2000, the area irrigated by them rose from 1.05 million ha. to 1.45 million ha. 3.19 Overexploitation of groundwater resources is a major problem facing the state. Of a total of 1.8 million wells in the state, approximately 10 percent are now defunct. The depth of bore wells in hard rock area has increased to as much as 600ft to 1000ft. Today, use of dug wells as a source of irrigation is only possible in canal and tank command areas; only bore wells remain 25 Due to acute water operational in hard rock areas (mainly in the western part of the state). scarcity the Government of Tamil Nadu has recently announced its plans to ban the drilling of bore wells, particularly in hard rock areas. This however has had a perverse effect as farmers are rushing to drill additional wells before the ban is officially imposed. Spacing norms have been prescribed based on the guidelines issued by NABARD (National Bank for Agricultural and Rural Development). Dug wells must be at least 150 m apart; deep tube wells must be at least 600 m apart. These spacing norms for the construction of new structures for minor irrigation purposes are applicable throughout the state for wells that are constructed with the aide of institutional finance. Institutions 3.20 Institutional weaknesses undermined proper management and development of water resources in Tamil Nadu. Institutional arrangements did not adequately address water resources management, allocation and planning. There has also been a lack of expenditure prioritization; inadequate priority to and funding for operations and maintenance (O&M) has led to rapid deterioration of surface irrigation. Farmer involvement in the operation and maintenance of irrigation systems has been minimal. Recently, however, effort has been made to address many of the policy and institutional issues plaguing the water sector. 3.21 The state is now undertaking comprehensive water planning on a river basin basis and has decentralized water resource management along river basins. The Public Works Department has been divided into the Water Resources Organization (WRO) and the Buildings 25
Personal communication with K. Palanisami (TNAU).
27
Organization in 1995. The WRO is to be formalized as a separate agency with a specialized cadre of staff in 2004. Chief Engineers of the WRO have been reorganized along a river basin basis and Government Orders setting up the Palar Basin Development and Management Board and the Thambaraparani Basin Development and Management Board were issued in January, 2000. Preparation of macro-level basin development plans and formulation of decision support systems for development and management of the water resources of the state has been underway since 1997. 3.22 The state has also drafted a Water Policy and steps for irrigation management transfer have also been initiated. The Tamil Nadu Farmers Management of Irrigation Systems Bill was passed by the State Legislative Assembly in May, 2000. The state was one of the first in India to pass a Groundwater Regulation and Management Act. Development of requisite skills in environmental aspects of water resources for staff in specified units of the Public Works Department has been a substantial achievement. Irrigation Management Transfer 3.23 Traditionally rural communities have played a central role in the management of water resources in Tamil Nadu. Informal arrangements under the system of “kudimaramathu’ were widespread for the maintenance and management of irrigation tanks up until the middle of the 19th century. Various other spontaneously created farmer organizations also played an important part in the management of canal systems, as well. 3.24 Between 1988 and 1994 as part of the Command Area Development Programme, the Tamil Nadu Agricultural Engineering Department organized Water User Associations in five major systems. By 1994, 3,300 outlet level WUAs and 118 distributory canal level WUAs had been formed, though most were not functioning well (Brewer et al., 1999). The motivation for formally transferring irrigation management to canal irrigation users in the state was largely driven by the pressure of maintaining canal systems in a situation of fiscal stress, increasing inter-sectoral competition for water resources, and advice from the World Bank as part of the WRCP project. 3.25 To enable management transfer to farmers, the Tamil Nadu Farmers Management of Irrigation Systems Bill was passed by the State Legislative Assembly in May, 2000. This Act will be in force in an area covering 1.5 million hectares in the system command areas under the management and control of WRO. 3.26 The Tamil Nadu Farmers Management of Irrigation Systems' (FMIS) Bill created a threetier system management organization, including WUAs at the outlet, WUAs at the 500 hectare command levels and a joint management committee(JMC) (a committee including representatives 26 of the WUAs and of key government agencies) at the project level. The Bill also allows for the full or partial transfer of O&M responsibilities to these bodies. Each WUA has complete responsibility for water distribution and maintenance in the area under its jurisdiction. The JMC is afforded the responsibility of deciding on water allocations and distribution each season and for solving problems as they arise. 3.27 Irrigation Management Transfer (IMT) is at an early stage in Tamil Nadu and evaluations of its impact in Tamil Nadu are yet to be carried out. However, there is a growing body of evidence on the impact of IMT from other states in India which is likely to be relevant for Tamil
26
The JMC’s are known as Farmer Councils
28
Nadu as WUAs and JMCs begin to play a larger role in the management of irrigation systems (Text Box 3.1). Text Box 3.1: Pro-poor Irrigation Management Transfer A recent study undertaken by the International Water Management Institute (IWMI) and the Gujarat Institute of Development Research (GIDR) sheds some important insights into pro-poor IMT in large-scale canal irrigation systems. The study is based on a survey of 700 landowning and tenant farmers from seven WUA’s in the two states. The study found that IMT in AP and Gujarat led to improved access to water for 15% and 25% of farmers surveyed and extension of the irrigated area for 2% and 3% of farmers in the two states, respectively. However, the authors also find that poor farmers are less informed about their rights and tend to loose out on many of the potential benefits of IMT. The report makes the following recommendations in terms of making IMT more pro-poor. 1. 2.
3.
4.
The rights of farmers need to be clearly defined. Individual farmers within the WUA should have equal decision making power regardless of farm size. The awareness of poor farmers and access to information on the IMT process should be raised. Differences in access to information between poor and wealthy farmers contribute to inequities. Wealthy farmers tend to be better informed of their rights and responsibilities as WUA members and participate more in the decision-making processes. Small farmers were more likely to be unaware of the existence of WUAs. The absence of small farmers from committee and general meetings means that they are excluded from key decisions taken within the WUA including decisions on the use of funds, site selection for R&R (Resettlement and Rehabilitation), future self-management of water distribution etc. The election process within the WUA should be competitive and transparent. Election of new presidents and committee members should be vote-based rather than consensusbased, to promote competition between several candidates. The levels of participation (in WUA elections, decision-making processes, fee collection etc) by farm size and location should be monitored.. Farm size has proven to be a good indicator of relative wealth and monitoring participation by farm size provides a good indicator of equity trends.
Source: van Koppen, Parathasarathy and Safiliou, 2003.
Water and Electricity Charges 3.28 Tamil Nadu has an extremely complicated system of water charges for surface irrigation compared to most Indian states. Currently there are 188 water rates (133 for wet lands and 55 for dry lands) for farmers depending on soil type, irrigation source, crop grown, season etc. Currently water rates form part of the land revenue collected from farmers by village administrative officers. Apart from the basic water rate there is a local cess and a local cess surcharge levied as a multiple of the basic water rate paid by farmers. The revenue from the local cess and local cess surcharge is transferred to Panchayat bodies for general expenditures. 3.29 At present the revenue department is involved in both assessments of water charges and collection. The VAOs (village officials) are supposed to inspect the field and record the cropped area, the area under government sources of irrigation (e.g. canals, tanks, etc.) and crop conditions. A sample check is conducted by higher officials such as the Revenue Inspector/Deputy Tasildars.
29
At the end of the agricultural year (fasli year), the accounts are prepared and water charges are collected along with the land revenue. The myriad of water rates provide considerable discretionary power to assessors. 3.30 Until recent revisions, water rates had been untouched since 1962. Beginning in July 2003, however, an additional water charge of Rs 150/ha ,de-linked from any additional cess, was imposed. Thus the farmer will pay the original charge plus the Rs 150/ha. In addition, the FMIS Act empowers the water users’ associations to charge users between Rs 250/ha to Rs 500/ha. This additional charge can be retained by the WUA for operation and maintenance of the systems turned over to them. 3.31 In 1999/00 total O&M expenditures on irrigation amounted to Rs 45.6 Crores. Total revenue collected was roughly Rs 11 Crores. Hence cost recovery was less than 25 percent (Table 3.3). Table 3.3: Irrigation Expenditures and Revenues (1998/99-2000/01) Command O&M expenditures and O&M expenditures Area Recoveries (Rs/ha) ('000 ha) (Rs. Crore) 98/99 99/00 00/01 98/99 99/00 00/01 O&M Works Expenditures Major Medium Minor Total Cost Recovery Recovery from major & medium Recovery from minor Total Recovery Cost recovery as percent O&M works expenditure
737.8 824.4 729.9 2292.1
36.89 18.34 11.20 66.43
14.11 18.21 12.23 44.55
15.09 18.26 12.23 45.58
8.25 2.63 10.88 16%
8.25 2.60 10.85 24%
8.50 2.49 10.99 24%
500 222 153 290
191 221 168 194
205 221 168 199
Sources: Expenditure data from WRO, GOTN; Revenue data from RBI Bulletin on State Finances, Dec. 2000 as cited in Palanisami, 2002.
3.32 Low water charges and poor cost recovery has meant that canal irrigation users have received an implicit subsidy. In 2000/01 the implicit irrigation subsidy (defined as the difference between O&M expenditures and actual collection of water charges) amounted to Rs 333.5 million. Based on an estimated gross canal irrigated area of 0.87 million hectares this 27 translates into a per hectare subsidy of Rs 649. 3.33 The vast majority of rural households in Tamil Nadu do not benefit directly from canal irrigation subsidies; in fact only 7 percent of rural households (15 percent of households cultivating crops) enjoy these implicit subsidies. However, the distribution of canal irrigation subsidies among households that use canal irrigation is less regressive than in other major Indian states (World Bank, 2003a). In Tamil Nadu over 90 percent of farmers using canal irrigation are marginal and small farmers and these farmers capture approximately 76 27
Exact data on gross canal irrigated area are not available. Gross canal irrigated area is computed as the net canal irrigated area multiplied by the intensity of irrigation (1.2062).
30
percent of the canal irrigation subsidy. The average subsidy received by households using canal irrigation in 2000/01 was Rs 493.67. Owing to larger farm sizes, large farmers enjoy average subsidies that are more than four times as large as those enjoyed by marginal and small farmers (Table 3.4). Table 3.4: Distribution of Canal Irrigation Subsidies in Tamil Nadu (2001/02)
Size of landholding All Marginal (


![Coastal processes in Tamil Nadu [ ]](https://kipdf.com/img/300x300/coastal-processes-in-tamil-nadu-_5ae957c67f8b9aa00f8b4573.jpg)