Skvortsovia: 3(1): 04 – 19 (2016) Copyright: © 2016 Russian Academy of Sciences
Skvortsovia http://skvortsovia.uran.ru/
ISSN 2309-6497 (Print) ISSN 2309-6500 (Online)
Article Variability of characters in reproductive organs of three taxa within Agropyron Gaertn.: Mathematical analysis Sergey I. Neuymin,1,* Sergey A. Shavnin,1 Andrey A. Montile,1 Andrey I. Montile2 and Simha I. Katsman3 1Russian
Academy of Science, Ural Branch: Institute Botanic Garden, 8 Marta St., 202a, 620144, Yekaterinburg, Russia State Forest Engineering University, Sibirskiy trakt, 37, 620100, Yekaterinburg, Russia 3Ural Federal University, Mira St., 19, 620002, Yekaterinburg, Russia *Corresponding author. E-mail:
[email protected] 2Ural
Received: 16 July 2016 | Accepted by Keith Chamberlain: 05 October 2016 | Published on line: 10 October 2016
Abstract Our mathematical-statistical approach to the classification of character elements is based on Vavilov's Law of Homologous Series. Character elements are formally expressed as frequency values of Integral Parameter in the Compression Mapping System (IPCMS). Consistent general patterns of IPCMS numerical values are revealed. Characteristics of each set of values depict infraspecific variability caused by variation of environmental conditions affecting representatives of a certain species. Upon sequential ordering of the coefficient mean values, species-specific changes in the distribution of frequencies are revealed. The potential of this method for studying infra- and inter-specific variability in phenotypic characters is demonstrated using an example of three taxa within Agropyron, wheatgrass. Keywords: Agropyron, character elements, discrete system, homologous series, infraspecific variability, inter-specific variability phenotypic variability, reproductive organs Introduction The creation of abstract systems that bring various processes, objects, or structures to a certain order, based on some chosen sets of characters which tend to have periodically recurrent values, has proved to be a productive approach in science. Observed periodical repetitions, in other words, homological variability of qualitative characters in various species and genera has been employed in biology since the 19th century. The Law of Homologous Series in Inherited Variability formulated by Vavilov (1920) permitted the organization of voluminous plant material. Later on, homology was traced and employed for depicting variability within an ever wider range of living organisms. Special emphasis has been laid on the homologous nature of phenotypic variability in taxonomic groups. The notion of radical is the key one, as it allows a connection between heredity and certain character values varying in a particular manner to be drawn, and helps separate taxa and 4
attribute organisms to species. A radical is a certain character, more often a qualitative one, whose presence or extent of expression provides grounds for unequivocal attribution of an individual to a certain genus or species. The Law of Homologous Series describes certain fixed sets of qualitative characters in species during certain moments of their development. Existing approaches to the study of phenotypic variability are based on the ability of organisms to adapt to environmental conditions in certain ways, which are determined by their heredity. In this respect, the phenotype can be interpreted as a realization of the inheritance information in a particular environmental situation (Lewontin, 1974; Li, 1976; Gould and Lewontin, 1979). Contemporary models of natural selection in population genetics evaluate an overall adaptability value by dividing it into a number of components determined by certain morphological, physiological, or phenotypic parameters that are readily observed and appear meaningful when interactions between organisms and species or their relations to environment are considered. According to Cherdantsev (2003: 8), a model should contain a relatively small number of components, that is, “such limiting link whose change should inflict an adequate change in the general adaptability; components that don't correlate but instead compete with each other.” One must note that “competition” among phenotypic modifications implies realization of a single direction of adaptation out of many possible directions. It is not only the characters' variability range but also the very sets of characters that are specific for each of these adaptation directions (i.e., for each “component”). As an integral system, an organism reacts to environmental changes by coherent changes in its qualitative and quantitative characters, which collectively produce the phenotype. Dynamic parameters of biological processes constantly taking place at various integration levels and thus providing for adaptations appear to be an essential part of heredity. In any concrete situation, depending on similarities and differences in their genotypes (i.e., in character subsets), two different species may react in a similar manner in one respect, yet differently in another. Remarkably, the very segregation of character subsets corresponding to certain environmental factors may depict inherited differences. An elementary evolutionary process, namely, the formation of varieties within a population has been described by a number of models dealing with dynamic aspects of speciation (Kreslavskiy, 1987, 1991; Sinskaya, 2002, 2003). Developing Vavilov's idea, we may expand the notion of radical coined by him, once we realize that not only the values and ranges of certain qualitative or quantitative characters are affected by heredity but also the very 5
sets of these variable characters are determined by it. This extension results in new opportunities for taking into account any similarities or differences in certain character groups playing a major role in adaptation to environmental conditions. It is important to keep in mind that employment of traditional methods of multiple regression analysis (such as analysis of variance, factor, or discriminant analysis) for depicting and describing mechanisms of phenotypic variability is not always sufficient, since these methods fail to take full account of the hierarchical nature of characters, their multi-level dependency on one another. The standard methods of ranging significance of characters during the analysis are also insufficient. All characters are usually considered even-handedly, representing a single level of description, and the ranging is undertaken within the framework of a rather restricted model, most of the time one-dimensional. Substantial difficulties arise when analyzing a set consisting of subsets of elements measured in an individual phenotype. These difficulties lead to the necessity of considerable averaging and result in subsequent work with averaged values. Previous research by the authors included a study of patterns in the dynamics of “relatively spatially oriented” (RSO) phenotypic traits in wheatgrass (Neuymin et al., 2011a, 2011b). We applied this approach to the study of complexes of phenotypic characters by developing new methods to help analyze measurements of spatially oriented traits in the reproductive organs of plants. The method enables calculation of a “generalized character” (or radical) by way of transformation of the measured character elements and their sets, while taking into account the value of the contribution made by each individual morph within the population to the generalized morphotype. This work was followed by the analysis of element character sets using the previously introduced Integral Parameter in the Compression Mapping System (IPCMS) (Neuymin et al., 2007, 2009). The goal of the current work is the analysis of variability within a complex of characters belonging to the reproductive sphere in two species of Agropyron Gaertn. This is achieved through generalization of IPCMS frequency values and employing discrete systems of character elements, which allow for computing the complex radical value for each individual plant.
Materials and Methods Two species of wheatgrass from the southern Urals, Agropyron desertorum (Fisch. ex Link) Schult. and A. cristatum (L.) Gaertn., the latter represented by two of its three subspecies, A. cristatum ssp. pectinatum (M.Bieb.) Tzvelev and A. cristatum ssp. kazachstanicum Tzvelev, are 6
the objects of this study. Collections were made at standard plots along transects situated at different altitudes in chosen typical habitats. The taxonomic identity of the studied plants was determined in accordance with Tzvelev's system for the grasses (Tzvelev, 1976). 870 individual plants were studied, their reproductive sphere represented by a set of 10 character elements. A total of 170100 measurements of 21 parameters were made. The graphic software package CorelDRAW GraphicsSuite X3 was used for measurements of character element projections. Statistical analysis of the collected data and production of spectrograms was performed with the PAST software package for data analysis (Hammer et al., 2001). Calculation of the IPCMS (Neuymin, 1991, Neuymin et al., 2007) and processing of character element measurements were carried out via a previously developed program module Radical (Shavnin et al., 2011a, b).
Discrete systems of character elements contributing to the complex radical The individual entities that are segregated during phenotype analysis and the sets of such entities are described with combinations of characters, which we have been calling “character elements.” A discrete system is a set of character element values characteristic of each structure within a certain phenotype. A discrete system is characterized by integrity and can be described at the highest level through characters exemplified by its character elements. When introducing the concept of discrete systems, we emphasize the hierarchical subordination of the repetitive character elements of plant structure as well as a certain composition of each phenotypic character formed under the influence of a multitude of external and internal factors. For example, the height of a grass is determined by the sum of internode lengths plus the sum of segment lengths within the major rachis of the inflorescence. Generally, a quantitative characteristic of a discrete system is determined by the sum of its elements or by applying a more intricate formula to them. If more than two subordinate levels are distinguished in the course of the analysis, then it is possible to segregate additional subdivisions, such as, for example, the length of culm and rachis. The introduction of the term “discrete system” emphasizes the abstract semantic notion concerning spatial orientation of character development and its position in the system of parameters and characters of the phenotypic structure. Naturally, the need arises to take the composition of the discrete system in the morphological description of a plant into account and identify phenotypic variability mechanisms. Attempts to consider the properties of certain characters and apply them as radicals were undertaken by a number of researchers as early as 7
the start of the 20th century (Vavilov, 1920; Sinskaya, 1961, 2002). According to them, studies of radicals result in formation of ever more complex notions regarding their composition, oneto-one correspondence, as well as the very possibility of identifying characters of this type in certain taxa. This makes it possible to consider the variability of radicals. Usually a species' radical is represented by more than a single character; it is rather expressed by a series of variants. Sinskaya (1961) discerned 11 frequent types of parallelism in series – those most frequently encountered during population studies and taxonomic research. One of these 11 types is the serial variability of those quantitative characters that are inherited in accordance with the so-called “concept of multiple factors.” For example, within a series a1, a2, a3, a4, a5, etc. a certain character or trait may grow or diminish by discrete amounts. Parallelism may be detected not only with regard to individual characters but also when considering group variability (Sinskaya, 1961). Let us now consider a conversion method for a set of quantitative characters and application of these characters for the production of a numeric radical for each of the following three representatives of the genus Agropyron: A. desertorum, A. cristatum ssp. kazachstanicum, and A. cristatum ssp. pectinatum. Let the population composition be defined by a set of ecomorphs, that is, certain stable states of phenotype that have been realized during ontogenesis, each ecomorph corresponding to an individual organism. Each of the organisms A, B, C, D, etc. can be defined by a series of discrete system (DS) characters a, b, c, d, etc. (Neuymin et al., 2009). By applying sequential combinations of numerical values for DS elements, one can segregate the most informative integrated set judging on their respective contributions to the numerical expression of the radical. Depending on the extent and nature of character expression within morphological structures of the Agropyron taxa under consideration, one may resort to naming a radical either an individual DS character or a subset of characters selected from the initial set with regard to their importance. Table 1 depicts a system of repetitive elements a. Similar tables are to be produced for DS's b, c, d, etc. Plants representing the biomorphs A, B, C, D, etc. are characterized by sets of spatially oriented character elements matching the DS's. In this concrete case, the sets of character elements matching the DS are the following: a – angle between glume and rachis; b – distance between glume origin and origin of awn-like point on lemma; c – length of awn-like point; d – total length of glume. Remarkably, one can readily notice the analogy in repetitive elements corresponding to DS. For example, in ecomorph A, there are analogical series in sequences of recurrent elements. A contains the following sets of character elements: (a1A, a2A, 8
a3A, ..., akA), (b1A, b2A, b3A, ..., bkA), (c1A, c2A, c3A, ..., ckA), (d1A, d2A, d3A, ..., dkA). Similarly, ecomorph B contains: (a1B, a2B, a3B, ..., akB), (b1B, b2B, b3B, ..., bkB), (c1B, c2B, c3B, ..., ckB), (d1B, d2B, d3B, ..., dkB).
Table 1. Example of a system of repetitive elements (DS a). Similar tables can be arranged for other DS's. Ranges of indices remain the same in all tables. Number 1 2 3 …
Ecomorph A B C …
DS a a a a …
a1A a1B a1C …
Repetitive DS Elements a2A a3A … a2B a3B … a2C a3C … … … …
akA akB akC …
Let us consider common patterns in the variability of analogical character elements. The first step would be calculation of mean values ( xa ,i 1,...,k ) for each ecomorph in the i
recurrent sequences of character elements (corresponding to the columns in Table 1):
xai
X A,B,C ,...aiX , N
i = 1, …, k,
(1)
(where N is the number of ecomorphs, that is, individuals representing these ecomorphs;
a iX
are values in the table, summation performed over the index of an ecomorph). Mean values are calculated in this manner for each DS. The next step is the serial conversion of all DS elements present in the table cells to relative values using the formula of the golden section, in accordance with the following formula:
iX
aiX 0.618 , X = A, B, C, … , i = 1, …, k xai
(2)
The employment of the golden section formula is justified by the need to find a suitable proportion in which the converted values would represent 100% (1.0) of the character expression. This conversion should be carried out for all DS's. Next, one should find the sum of all DS sets of character elements (Sum of Character Elements, SCE): a, b, c, etc. The summation is over the elements (
) of each i iA i 1 iA k
ecomorph. Results for two DS's, a and b, are shown in Table 2. 9
Table 2. Systems of summed elements for DS's a and b No. 1 2 3 …
Ecomorph A B C …
DS a a a a …
SCE a Σi αiA Σi αiB Σi αiC …
DS b b b b …
SCE b Σi βiA Σi βiB Σi βiC …
Calculation of the overall mean value S for all ecomorphs and all DS's is made using the following formula:
S
X A, B,C , ... , , , ... i iX Nn
(3)
(where N is the number of ecomorphs, n – the number of DS's). The summation is over two respective indices. Next follows the conversion of the summed character elements (i.e., values Σi χiX in the cells of Table 2) in accordance with their respective contributions to the overall mean S. This conversion employs the golden section formula:
[ a ]X
S
i iX
0.618 , X = A, B, C, … , i = 1, … , k
(4)
The values converted in this manner are then summed for each ecomorph. The result of this operation is a sequence of values, each of which corresponds to its own DS within the entire population: [a]= ΣX[a]X,
[b]= ΣX[b]X,
[c]= ΣX[c]X,
[d]= ΣX[d]X, etc.
The values [a], [b], [c], [d], etc. are then arranged in ascending order. Within the obtained sequence, the hierarchic classification with averaging is applied. For this purpose, the sequence is divided into equidistant classes. The goal of the division is obtaining “natural,” equally spaced classes. This is achieved by using the following method. The sequence that is being classified constitutes an ascending range on the number axis. The initial number of classes is defined by the number of values in the set. Classes are segments of equal length between the maximum and the minimum value of the range. None of the classes should be left empty. In case any segment corresponding to a class falls entirely between two consecutive values in the sequence, the number of classes is diminished by one. This is repeated until each
10
class would contain at least one value. The resulting number of classes may be much smaller than the initial number. Upon completion of the classification, averaging is to be undertaken within each of the obtained groups. The values [a], [b], [c], [d], etc. are to be averaged along with the values [a] X, [b] X, [c] X, [d] X, etc. for each biomorph X. The procedure of classification is then repeated for the sequence of averaged values, followed by a new averaging within groups. This is repeated till the stage is reached where there are only two values left in the sequence. This technique provides hierarchic reduction of DS to a single value of the complex radical. The last remaining value corresponds to those characters that are most pronounced and make the largest overall contribution to a certain morphotype within the analyzed population. This value, unique for each biomorph, is the numerical radical, which can be subsequently employed as a generalized character for comparisons of individual plants as well as ecomorphs within the coenopopulation.
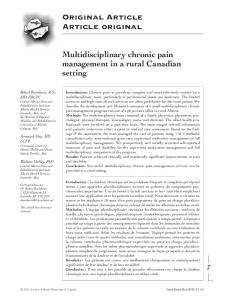
The use of IPCMS frequency spectra for phenotypic variation analysis within a population By the calculation described above, the radical can be obtained, which would be uniform for all groups as regards its composition. This allows for further analysis of the initial measurements representing the DS elements (see Table 1). The algorithm of the analysis employing the obtained radical is shown in Fig. 1. It is applied to numerical value sequences of DS elements grouped separately for each biomorph and includes the following major steps: 1. Initial unification of homologous character element sequences by applying IPCMS. 2. Transposition and addition of radicals (e.g., R1, R2) followed by sequential summation of respective values and standardized data according to the following schema: R1 + R2 = R, R + a = Ra, Ra + b = Rab, Rab + c = Rabc , etc. The symbol Σ in Figure 1 indicates the total sum of values in columns. Finally, IPCMS is to be applied another time, this time to the summed data. 3. Construction of spectra of IPCMS numeric values for each ecomorph with respect to the contribution of the radical. A concrete spectrum consists of a set of IPCMS resulting index values and their respective frequencies. Frequency is defined as the relation of the number of occurrences of a certain IPCMS value in the resulting table to the size of the table arranged for a single plant. In graphic representation, frequency is depicted through gradation of either the line thickness or color intensity within the gray color scale. 11
Results and discussion In the course of quantitative morphometric character analysis for reproductive organs of representatives of the genus Agropyron, certain DS character elements have proved to be contributing the largest share to the numerical radical. These are the angle between the glume and rachis (a) and the length of the awn-like point of the lemma (i). Consequently, the mean value between these parameters was identified as the radical. It is important to note that the obtained radicals are taxon-specific; for example, the radical corresponding to the ecomorph of A. desertorum Ver_10 Des_088_771 is equal to 1.1, while the one corresponding to A. cristatum ssp. pectinatum Ver_10000_1121 is 10.0, and the one for A. cristatum ssp. kazachstanicum Leo_08 Kaz_798 has a value intermediate between the former two (5.8). The numerical value of the radical is crucial for the subsequent analysis of polymorphism within the studied grass sample. During the analysis of element value frequencies after they have been aggregated for the second time with the help of IPCMS, one can observe characteristic peculiarities of their distribution in the frequency space. Figures 2-4 provide examples of results of the study of RSO character elements for individual plants belonging to two Agropyron species. The results are expressed through IPCMS. When presented in graphic form, the frequency spectrum depicts the number of occurrences for certain IPCMS values in the resulting table obtained upon processing of character element measurements using the method described above. A final result of calculations pertaining to an individual plant is presented in Table 3, whose 10 lines correspond to 10 repetitive elements identified within the wheatgrass spike, while columns are identified with variants of character recombination (P’1 through P’11). Cells contain final values of IPCMS. With the help of this table, one can obtain a frequency for each value. For example, the value 554 would have a frequency 7/10x11 = 0.0636. Each frequency spectrum corresponding to an individual representative of a certain ecomorph provides generalized characteristic of data similar to those presented in Table 3. Within the spectrum, there are a few separate localizations of the IPCMS values, which occur with different frequencies. In this case, it is the value of IPCMS that is itself identified as the position for a certain frequency
12
Fig. 1. Control flow chart for processing character elements using two character-radicals with the goal of constructing IPCMS frequency spectra for each ecomorph.
(Fig. 2b). Another way to identify the position is to use the sequential number, starting from the lowest value (Fig. 2c). The manner of localization of the frequency values and index values differs substantially for each of the studied taxa, depicting differences in phenotypic features of 13
plants representing these taxa. It is important to note that both the position along the axis and frequency values are informative.
Table 3. IPCMS values (pertaining to a single individual) calculated during the final step of data processing P’1
P’2
P’3
P’4
P’5
P’6
P’7
P’8
P’9
P’10
P’11
Element 1
496
412
410
421
449
483
514
538
552
557
555
Element 2
496
411
409
422
450
484
515
538
551
556
554
Element 3
497
413
411
423
449
482
513
537
551
556
554
Element 4
497
414
412
423
449
482
513
536
550
556
554
Element 5
497
414
412
422
447
480
513
537
552
557
555
Element 6
497
414
412
423
448
482
513
536
551
556
554
Element 7
497
414
412
422
448
481
513
537
551
556
554
Element 8
497
413
411
422
449
483
514
537
551
556
554
Element 9
496
413
411
422
448
482
514
538
552
557
554
Element 10
495
411
410
422
449
483
515
538
552
557
555
Fig. 2. IPCMS values and RSO character element frequencies for A. desertorum (Fisch. ex Link) Schult., sample Ver_10 Des_088_771. A – photographed spike; B – IP CMS frequency spectrum; C – relative positions (according to range of IPCMS values) and their respective frequencies
14
One can observe that the sample Ver_10 Des_088_771 of A. desertorum is characterized by significant polymorphism as regards the localization (position) of frequencies. The IPCMS values range from 319 to 577 (Fig. 2). The specifics in frequency distribution and their relative positions are also presented in the graphic form. The specific plant characters responsible for these peculiarities are a relatively low magnitude of the angle between the glume and rachis and the absence of the awn-like point on the lemma of A. desertorum. These characters have been treated by the authors as the critical ones, contributing the most to the radical, and thus allowing for separation of the two wheatgrass species. At the same time, A. cristatum, the species represented in the study by the two subspecies, exhibits its own peculiar modes of distribution as regards frequency positions (Fig. 3, 4). The ssp. kazachstanicum demonstrates the IPCMS value range from 411 to 550, while for the ssp. pectinatum, the range is 425 to 546. The two subspecies also differ as far as individual positions of frequencies. Frequency distributions in the spectra of the ecomorphs under consideration can be described as follows. In A. desertorum (ecomorph Ver_10 Des_088_771), one can see two separate intervals of frequency localization: 319–377 and 420–577 (that is, in terms of numbered positions, respectively, 1–50 and 98–250). The highest concentration can be observed in the right-hand part of the spectrum, within the value interval of 520–575 (numerical positions 190–250). The left part of the spectrum (the first localization interval) is characterized by relatively low values of frequencies (0.012–0.025). Peaks of maximal frequencies (0.048) are located near the position 200 (IPCMS = 525). Let us now consider A. cristatum ssp. kazachstanicum (ecomorph Leo_08 Kaz_107_798, Fig. 3). In this case the left part of the spectrum is missing; at the same time the major interval is shifted to the IPCMS range of lower values: 411–550 (positions 85–225). The frequency peaks are considerably higher than those in the previous ecomorph (0.062–0.075) and restricted to the interval extremities. The median positions within the interval are characterized by lower frequencies (0.028–0.034). Similarly to the previous case, the major concentration of occurrences is observed in the right-hand part of the spectrum (IPCMS 520– 550, positions 190–225).
15
Fig. 3. IPCMS values and RSO character element frequencies for A. cristatum subsp. kazachstanicum Tzvelev, sample Leo_08 Kaz_107_798. A, B, C – similar to Fig. 2.
Fig. 4. IPCMS values and RSO character element frequencies for A. cristatum subsp. pectinatum (M.Bieb.) Tzvelev, sample Ver_000_1121. A, B, C – similar to Fig. 2 and 3.
The overall situation for ecomorph Ver_000_1121, A. cristatum ssp. pectinatum (Fig. 4) appears quite similar to that of Leo_08 Kaz_107_798 (ssp. kazachstanicum): the only major interval of frequencies localization (IPCMS = 425–546, positions 100–220) is only slightly narrower than the one shown in Fig. 3; frequency peaks (0.062–0.082) are also restricted to the interval extremities, while minimum values (0.032–0.042) are concentrated at mid-interval and 16
the left part of the spectrum; the major concentration is around IPCMS 520–546 (positions 190–220). On the whole, the spectra of the latter two ecomorphs, which represent two subspecies of a single species, have much more in common than with the first spectrum representing a different species. One can conclude that the numerical value of the radical affects the frequency positions and allows for discriminating between species, while also depicting the infraspecific variability.
Conclusions The method of obtaining the complex radical described in this article is based on selection of a set of discrete system characters. The composition of this set of characters may vary depending on environmental conditions, the time and the place of collection of the plant material. The numerical radical allows for discrimination between inter- and infra-specific polymorphism, while relying on a complex of morphological characters. The radical depicts the composition of a coenopopulation in certain conditions. The method provides for comparisons among sets of ranged, complex frequency characteristics describing certain ecomorphs. These comparisons are based on differences between the radical values. Due to the specifics of the method, it provides new possibilities for the application of Vavilov's Law of Homologous Series to in-depth studies of plants belonging to closely related taxa, either cultivated or in natural populations. The comparative analysis of IPCMS values and their frequency positions for the three studied taxa, has demonstrated significant differences of IPCMS characteristics between species and less obvious, yet also meaningful differences at the infraspecific level. The approach developed for the example of genus Agropyron makes it possible to classify morphological variability at the species level (for closely related species) as well as at the infraspecific level. The method also allows for making predictions of homological (matching) localization intervals for frequencies, while relying on the already known significant intervals containing respective position groups. The proposed method may prove to be useful for studying both genotypic and phenotypic variability in taxonomic groups of plants other than grasses.
Acknowledgements The work was made possible through the Financial Support for Interdisciplinary Projects, the Ural Branch, Russian Academy of Sciences, Grant No. 15–12–4–35. The authors 17
would like to thank the referees and editors for their useful suggestions and comments, especially Irina Kadis for her considerable help with the translation from Russian.
References Cherdantsev, V.G. 2003. Morfogenez i evolyutsiya [Morphogenesis and the evolution]. Tovarishchestvo nauchnykh izdaniy KMK. (In Russian) Gould, S.J. and Lewontin, R.S. 1979. The spandrels of San Marco and the Panglossian paradigm: a critique of the adaptationist programme. Proc. Roy. Soc. London, Ser. B, Biopl. Sci. 205: 581–598. Hammer, Ø., Harper, D.A.T. and Ryan, P.D. 2001. PAST: Paleontological Statistics software package for education and data analysis. Palaeontol. Electronica 4(1):1–9. Kreslavskiy, A.G. 1987. [Selection by structured characters and directed evolution]. Zhurn. Obshchei Biol. 49: 243–250. (In Russian) Kreslavskiy, A.G. 1991. [On the origin of biological innovations]. Sovremennaya evolyutsionnaya morphologiya. Kiev: Naukova dumka: 176–189. (In Russian) Lewontin, R.C. 1974. The genetic basis of evolutionary change. New York: Columbia Univ. Press. Russian Translation, 1978: Mir. (In Russian) Li, C. C. 1976. First course in population genetics. Pacific Grove, California: The Boxwood Press. Russian Translation, 1978: Mir. (In Russian) Neuymin, S.I. 1991. [A system of variability in ethiopian wheat (Triticum aethiopicum Jacubz.)] PhD Thesis. Leningrad. (In Russian) Neuymin, S.I., Montile, A.I. and Shavnin, S.A. 2007. [An integral index working as a model of data compression for a set of epigenetic characters in plants]. Mat. Biol. Bioinf. 2(1): 154– 159. DOI: 10.17537/2007.2.60. (In Russian) Neuymin, S.I., Shavnin, S.А., Montile, A.I. and Montile, A.A. 2009. [Epigenetic patterns in sytems of variability (on the example of Agropyron cristatum (L.) Gaertn.)]. Izv. Samarsk. Nauchn. Tsentra Rossiisk. Acad. Nauk 11, 1(7): 1527–1532. (In Russian) Neuymin, S.I., Temirbekova, S.K. and Kosheleva, E.A. 2011a. [A new approach to the analysis of spatially oriented parameters of the reproductive sphere (on the example of the genus Agropyron Gaertn.)]. Kulturnyye rasteniya dlya ustoichivogo selskogo khozyaistva v 21 veke (immunitet, selektsiya, introduktsiya): k 110-letiyu akademika VASKhNIL i Rosselkhozakademii M.S.Dunina. Vol. 1, Part 2: 270–273. Moscow. (In Russian) Neuymin, S.I., Temirbekova, S.K. and Filatenko, A.A. 2011b. [Recording of ecotypic polymorphism in wheatgrasses Agropyron cristatum subsp. pectinatum (M.Bieb.) Tzvelev and A. desertorum (Fisch. ex Link) Schult.]. Vestn. Rossisk. Akad. Sel’sko-Khoz. Nauk 1: 70–75. (In Russian) Shavnin, S.А., Neuymin, S.I., Montile, A.A., Kosheleva, E.A. and Montile, A.I. 2011. [Employment of patterns in morphological elements during the analysis of measured characters in biological objects (on the example of Silybum marianum (L.) Gaertn.)]. Vestn. Irkutsk. Gosud. Sel’sko-Khoz. Akad. 44(5): 139–149. (In Russian) Sinskaya, Е.N. 1961. [On the levels of group adaptation in plant populations]. In: Problema populyatsiy u vysshikh rasteniy, 1: 65–66. Leningrad. (In Russian) 18
Sinskaya, E.N. 2002. Problemy populyatsionnoi botaniki [Problems in population botany], 1. Yekaterinburg, UrO RAN. (In Russian) Sinskaya, E.N. 2003. Problemy populyatsionnoi botaniki [Problems in population botany], 2. Yekaterinburg, UrO RAN. (In Russian) Tzvelev, N.N. 1976. Zlaki SSSR [Grasses of the USSR]. Leningrad: Nauka. (In Russian) Vavilov, N.I. 1920. Zakon gomologicheskikh ryadov v nasledstvennoi izmenchivosti [Law of homologous series in the inherited variability] Trudy III Vserossiyskogo selektsionnogo syezda v Saratove. Saratov. (In Russian)
19