Original Article Article original THE UROLOGY WORK FORCE IN ONTARIO FOR THE 21ST CENTURY: FEAST OR FAMINE? Kenneth T. Pace, BA, MD;* John L. Provan, MD;†‡ Michael A.S. Jewett, MD* OBJECTIVE: To address the issues of work-force planning and modelling in the 21st century for the specialty of urology in the Province of Ontario. DESIGN: Data (from 1991 to 1995) regarding urology physician resources were gathered from Health Canada, the Royal College of Physicians and Surgeons of Canada, the Ontario Physician Human Resources Data Centre, the Canadian Post-M.D. Education Registry, the System for Health Area Resource Planning (SHARP) database, the Canadian Institute for Health Information and the National Physician Database. Specifically, the age and gender breakdown of currently active Ontario urologists, measures of urologist clinical activity (from Ontario Hospital Insurance Plan billings and questionnaires), inputs into and exits from the active urologist population were gathered, and estimates of future needs for urologist services, based on current population and demographic models, were made. A model to predict the balance between future needs for urology services and future supply of urologists was then created and validated against data drawn from the SHARP database. RESULTS: The model revealed that there will be a significant shortage of urologists in Ontario in the immediate and long-term future; by the year 2010 there will be a shortfall of 101 urologists in Ontario, or 51% of the total needed. CONCLUSIONS: Enlarging the urology training programs in Ontario would help to minimize the estimated shortfall. Systematic modelling of physician work-force needs for the future is necessary for the optimal allocation of health care resources. The methodology of the urology work-force model is generalizable to physician work-force planning for other specialty groups on a provincial or national basis.
OBJECTIF : Aborder les problèmes de planification et de modélisation de l’effectif au XXIe siècle pour la spécialité de l’urologie en Ontario. CONCEPTION : On a réuni des données (de 1991 à 1995) sur les effectifs médicaux en urologie, qu’on a obtenues de Santé Canada, du Collège royal des médecins et chirurgiens du Canada, de l’Ontario Physician Human Resources Data Centre, du Système informatisé sur les stagiaires post-MD en formation clinique, de la base de données du Système pour la planification régionale des ressources de la santé (SPRRS), de l’Institut canadien d’information sur la santé et de la base de données nationales sur les médecins. On a plus précisément ventilé selon l’âge et le sexe les urologues actifs en Ontario, les mesures de l’activité clinique des urologues (à partir des facturations et de questionnaires du Régime d’assurance-santé de l’Ontario), les arrivées dans la population des urologues actifs et les départs, et établi des estimations des besoins futurs en services d’urologie fondées sur la population et des modèles démographiques actuels. On a alors créé un modèle de prédiction de l’équilibre entre les besoins futurs en services d’urologie et l’offre future d’urologues, modèle que l’on a validé en fonction de données provenant de la base de données du SPRRS. RÉSULTATS : Le modèle a révélé qu’il y aura une importante pénurie d’urologues en Ontario, sous peu et à long terme. En 2010, il manquera 101 urologues en Ontario, soit 51 % du total nécessaire. CONCLUSIONS : L’expansion des programmes de formation en urologie en Ontario aiderait à réduire le plus
From the *Division of Urology, †Department of Surgery, University of Toronto, Toronto, Ont. ‡Died in July 1996. Accepted for publication Sept. 31, 1998. Correspondence to: Dr. Michael A.S. Jewett, Toronto Hospital, General Division, 200 Elizabeth St., EN 14-205, Toronto, ON M5G 2C4; fax 416 340-4275,
[email protected] © 1999 Canadian Medical Association (text and abstract/résumé)
CJS, Vol. 42, No. 3, June 1999
181
PACE ET AL
possible la pénurie estimée. Il faut modéliser systématiquement les besoins en effectifs médicaux de l’avenir pour assurer la répartition optimale des ressources consacrées aux soins de santé. La méthodologie de modélisation des effectifs en urologie est généralisable à la planification des effectifs médicaux d’autres spécialités, à l’échelon provincial ou national.
I
ncreasing competition for shrinking federal and provincial health care resources has forced stakeholders in health resource planning to scrutinize each component of the health care budget, including the ways in which physician training, immigration and distribution are undertaken. These issues have been particularly important to those involved in determining the number of postgraduate trainees in residency programs across Canada. The process by which this takes place is under close scrutiny by provincial governments, the Royal College of Physicians and Surgeons of Canada (RCPSC), the College of Family Physicians of Canada, and universities and training programs across the country. Over the last 10 to 20 years, an effort has been made to achieve an “ideal” mixture: 50% of all postgraduate training positions allocated to family practice and the remainder to specialty programs. However, studies designed specifically to determine the number of specialists required to meet future population needs and thereby estimate the “ideal” number of postgraduate trainees necessary to meet this need are rare, although they have been done for pediatric urology in the United States (among other specialties),1 and to a lesser extent for otolaryngology in Canada.2 Watanabe3 demonstrated that surgical specialists in particular have recently faced increasing workloads with increased demands for their services, and provincial governments have been more proactive in their involvement in physician resource planning.4 Yet little objective data are available with which to make decisions regarding allocation of the shrinking 182
JCC, Vol. 42, No 3, juin 1999
number of postgraduate training positions across specialties. These issues are of particular importance to the specialty of urology because of its high service volume, sensitivity to changing demographics in an aging population and high use of new technologies. We describe a comprehensive approach to physician work-force planning for urology in the Province of Ontario, an approach that may be applied nationally and to other specialties in order to make rational decisions regarding allocation of postgraduate training positions. Our goals were to describe the current pool of practising urologists in the province, to estimate how the composition of that pool will change in the future, project future needs for urologist services in the province and create a computer model of the Ontario urologist population to extrapolate the balance between projected needs and supply and to determine the number of postgraduate trainees required to meet future needs.
METHODS The computer model was created in a step-wise fashion as follows: • Describe the current pool of active urologists in Ontario. • Measure the differential clinical activity of groups within the population. • Measure additions (inputs) to and exits from the urologist pool. • Predict the need for urologist services in the future. • Create a computer model to reconcile projected supply with needs. • Verify the model externally. • Estimate the number of postgraduate trainees necessary to meet future needs.
Describe the current pool of active urologists in Ontario To accurately define the current pool of active clinical urologists in Ontario, we had to obtain basic demographic information. A number of organizations have attempted to gather this information; however, before 1992, the databases for the Ontario physician work force were inaccurate (J. Strachan, Health Canada: unpublished data, 1986–1994).5,6 The number of active urologists was falsely inflated by including physicians who were retired, dead or not actually practising urology. In 1992, the newly formed Ontario Physician Human Resources Data Centre (OPHRDC) began to refine the database of active, practising Ontario physicians by specialty by eliminating all physicians who were retired or dead.5 The 1994 data were verified by circulating a list of practising urologists to the urology program directors at each of the 4 urology postgraduate training programs in Ontario (University of Toronto, University of Western Ontario, Queen’s University and University of Ottawa) and to community urologists in northern Ontario and the Niagara region. This verified database is a reliable measure of the active, practising Ontario urologist pool and provides critical demographic information on age, gender and distribution of urologists across Ontario. Measure the differential clinical activity of groups within the population Clinical activity levels were established in 2 ways. First, a voluntary mail survey was conducted by the RCPSC
UROLOGY IN THE 21ST CENTURY
of all Canadian specialists and circulated to all 203 active Ontario urologists to determine the relative time spent by each clinician in a wide range of areas: hospital inpatients, ambulatory care, nonhospital practice, on-call duties, management, education, research and con-tinuing medical education. To calculate the amount of time spent in clinical work, the number of hours worked per week on ambulatory care, hospital inpatients, on-call duties and nonhospital practice were averaged and stratified by age. Second, data were obtained on billings made by Ontario urologists to the Ontario Health Insurance Plan (OHIP), the provincial universal health care payer that reimburses urologists for all services, with the exception of elective circumcision, vasovasostomy and transurethral microwave thermotherapy.7 Measure additions (inputs) to and exits from the urologist pool Inputs to the pool of active Ontario urologists include urologists who elect to move or immigrate to Ontario from the rest of Canada or from abroad, as well as residents or fellows who complete their training and elect to establish a practice in Ontario. These were measured from 1991 to 1995 by the OPHRDC5,8 and by the Canadian Post-M.D. Education Registry (CAPER)9 and were then used to extrapolate the annual average net gain of active Ontario urologists over that 5-year period. Exits from the pool include those who chose to retire, to emigrate from the province or who died. These values were obtained from 1991 to 1994 using data from the OPHRDC5 and Health Canada (J. Strachan, Health Canada: unpublished data, 1986–1994) and tabulated to extrapolate the average annual net loss of active Ontario urologists over that 4-year period. Data from the
OPHRDC for the number of urologists approaching the ages of 65, 70 and 75 years were used to calculate the number of urologists who would retire annually based on a predicted retirement age of 65, 70 or 75 years. Predict the need for urologist services in the future Future projections of the need for urologist services were developed using the current Ontario population-tourologist ratio of 52 234:1 as the ideal. Two models to estimate the future need for urologist services were then created: the first based solely on population growth and the second based on population growth corrected for the predicted demographic shift in composition of the Ontario population due to aging, since the population subgroup over 65 years of age has a greater need for medical services in general and urologist services in particular.10,11 Create a computer model to reconcile projected supply with needs The Ontario urologist work-force projection model (henceforth called the U of T model) was then created and used to estimate the concordance between the future supply of urologists in Ontario and the demand for their services. A number of assumptions were needed to create the U of T model, and for each assumption an effort was made to be conservative: • Future inputs to the pool of active Ontario urologists will be similar to what they were in the period from 1991 to 1995. • Future exits from the pool of active Ontario urologists will be similar to those in the 1991 to 1994 period and will assume a retirement age of 70 years. • Statistics Canada projections of Ontario population growth (which
themselves depend on assumptions of fertility and immigration rates, emigration rates and life expectancy) are accurate. • Those aged 65 years or older have a greater need for urologist services, and the demand for urologic care will increase in direct proportion to population growth and to those aged 65 years or older. • The ideal population-to-urologist ratio is 52 234:1 (the current ratio). A computer model, starting with the current composition of the urologist pool was created and recursively modified annually using inputs and exits from the pool based on 5-year means of data gathered from 1991 to 1995 inclusive. These projections were then reconciled with projected demand based on population growth and demographic shifts. Verify the model externally The results generated by the U of T model were then compared to the results generated by the System for Health Area Resource Planning (SHARP), a generic model used for planning estimates of the health care work force, based on identical population growth and demographic data.12 Estimate the number of postgraduate trainees necessary to meet future needs Finally, the results of the U of T model were used to project the number of Ontario urology residents required to balance projected needs with supply, based on the rate of retention of Ontario urology residents and fellows from the period 1991 to 1995 inclusive.
RESULTS The number of active urologists in Ontario appears to have been rising CJS, Vol. 42, No. 3, June 1999
183
PACE ET AL
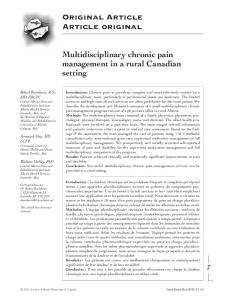
over the last decade. However, old measures of the number of urologists in the province based on data from Health Canada and the College of Physicians and Surgeons of Ontario were inaccurate and overestimated this number by 6.5% and 10.5% respectively when compared with externally validated data from the OPHRDC (Table I [J. Strachan, Health Canada: unpublished data, 1986–1994]5). Based on the OPHRDC data there were 203 (199 men) active urologists practising in 1994, and 83 (41%) were 55 years of age or older (Fig. 1). Clinical activity is substantially decreased among older urologists. Thirtyseven percent of urologists 65 years of age or older bill OHIP for less than $30 000 per year, compared with only 4% of those under the age of 65 years (Table II). Information from the RCPSC specialist questionnaire confirmed the OHIP billing data. The response rate from the survey was 71.4% (145 of 203). The results show that hours spent on clinical activity weekly decrease with age: urologists less than 45 years of age spent approximately 54 hours, 17%
more than the 46 hours per week for urologists 65 years of age or older. Data from the CAPER9 revealed that additions to the pool of active urologists in Ontario come predominantly from residents and fellows who complete postgraduate training in Ontario. Over the 1991 to 1995 period, 44 new active urologists began to practise in Ontario, an average of 9 per year; approximately 7 of these 9 came from Ontario urology training programs. The remainder were either physicians from other Canadian
provinces or the United States. All of the urologists entering practice in Ontario from the United States were Canadian citizens and represent physicians who pursued residency or fellowship training in the United States. At present there is only 1 active Ontario urologist originally from the United States. Of residents and fellows trained in Ontario, only 52% remained in Ontario 2 years after completing their training. The remainder went to other Canadian provinces, the United States or else-
Table I
FIG 1. Age of active Ontario urologists in 1994. Black bars = number of urologists, white bars = percent of urologists.
Number of Active Ontario Urologists by Year Health Canada*
OPHRDC5
Table II
Year
CPSO5
1983
158
1984
163
1985
160
1986
168
172
Age group, yr
1987
173
183
1988
179
188
1989
185
Annual Ontario Hospital Insurance Plan Billings of Active Ontario Urologists by Age Group8 Billing amounts in Canadian dollars, no. (%) of urologists in age group ≤ 30 000
> 30 000
0
0
11 (100)
0
1 (3)
31 (97)
26
0
2 (8)
24 (92)
30
1 (3)
0
29 (97)
No. of urologists
0
30–34
11
35–39
32
199
40–44
1990
193
197
45–49
1991
N/A
201
50–54
21
1 (5)
0
20 (95)
31
2 (7)
0
29 (94)
0
27 (100) 11 (85)
1992
211
204
192
55–59
1993
221
213
200
60–64
27
0
1994
222
203
65–69
13
2 (15)
0
70–74
11
2 (18)
2 (18)
7 (64)
75–79
2
1 (50)
0
1 (50)
*J. Strachan, Health Canada: unpublished data, 1986–1994 CPSO = College of Physicians and Surgeons of Ontario, OPHRDC = Ontario Physician Human Resources Data Centre.
184
JCC, Vol. 42, No 3, juin 1999
UROLOGY IN THE 21ST CENTURY
where. We do not know where 20% of these urologists are currently practising (although we know that they are not practising in Ontario). Thus, of the 13.8 urologists per year who completed training in Ontario, an average of 7.2 remained in the province to practise their specialty (Table III [J. Strachan, Health Canada: unpublished data, 1986–1994]). In terms of exits from the Ontario urologist pool, 17 urologists emigrated from the province between 1991 and 1994 (J. Strachan, Health Canada: unpublished data, 1986–1994), for an average annual loss of 4 urologists; no practising Ontario urologists died between 1990 and 1994. No reliable data are available on the average retirement age of Ontario urologists. However, from the demographics of the current Ontario urologist pool over the next 15
years, an average of 5.5 urologists per year can be expected to retire, using 70 years as the retirement age (since there are 83 urologists 55 years or older, one fifteenth of them, or 5.5 should be at retirement age or older). If the assumption is changed to 65 years as the retirement age, then 25 urologists (12% of the total) are already beyond retirement age, and 104 (or 51% of the total) will reach retirement in the next 15 years, which translates into an average of 6.9 urologists retiring per year (Table IV). The balance sheet of inputs and exits from the pool of active, practising Ontario urologists (Table V) demonstrates that with the assumption of a retirement age of 70 years, there will be an net gain of 0.5 urologist that year. If the assumption is modified to age 65 years, there will be a net loss of 1.5 urologists. Projections of future needs for urol-
Table III Practice Location of Ontario Urology Trainees After Completion of Training, 1991 to 1995* Year Location
1992
1993
Total
%
Ontario
1991 5
5
10
8
8
7.2
36
52
Canada
3
—
2
2
4
2.2
11
16
United States
1
1
2
2
1
1.4
7
10
Other
1
—
—
—
—
0.2
1
1
Unknown
3
—
4
5
2
2.8
14
20
13
6
18
17
15
13.8
69
Total
1994
1995
Mean
*J. Strachan, Health Canada: unpublished data, 1986–1994
Table IV Number and Percentage of Urologists in Ontario in 1994 Approaching Retirement Ages of 65 Years, 70 Years or 75 Years Retirement ages, yr No.
%
Years to retirement
65
70
75
65
70
75
0
25
12
1
12
6
0
5 or less
52
25
12
26
12
6
10 or less
83
52
25
41
26
12
15 or less
104
83
32
51
41
25
ogist services were based on predictions of population growth and demographic changes from the SHARP database, which is based on Statistics Canada data (Table VI12,13). These predictions indicate that the Ontario population will grow from 9.88 million in 1990 to 14.49 million in 2015. Over this same period, the proportion of the population over 65 years of age will increase, from 17.3% in 1990 to 23% in 2015 as life expectancy continues to increase, from 80.4 years for women and 74.4 years for men in 1990 to 82.5 years and 78 years respectively in 2015. By 2010, 259 urologists will be needed in Ontario to meet population growth demands if the current ratio of 52 234:1 is to be maintained (Table VII). However, an increasingly aging population will require additional urologist services; the population aged 65 years and older will grow proportionately faster than the remainder of the population at an annual rate of 0.23%,13 and the model assumes that their need for urologist services will increase in direct proportion to this shift. Thus, by 2010, Ontario will require 309 urologists to meet both population growth needs and demographic shifts (Table VII). The U of T model predicts that from 1994 to 2010 the number of urologists practising in Ontario will rise from 203 to 208. However, the model also predicts a more rapid increase in the demand for urologic services, so that the number of urologists required to meet population growth alone would rise from 203 in 1994 to 259 in 2010, and the number needed to meet both population growth and demographic shifts would rise from 203 to 309 by 2010 (Fig. 2). This would leave a shortfall of 51 and 101 urologists respectively (24% and 48% respectively). If this shortfall were not corrected, the population-to-urologist ratio would rise from 52 234:1 in 1994 to 64 976:1 by 2010 owing to population CJS, Vol. 42, No. 3, June 1999
185
PACE ET AL
growth alone, and to 77 532:1 if adjusted for demographic shifts. The demographics of the urologist population will not change significantly between 1994 and 2010, and as a result the per capita hours of clinical service provided will be the same. Verification with the SHARP database confirmed our predictions. The SHARP model predicted a significant shortfall in the supply of urologist services — a shortage of 119 urologists (56.9%) by 2010 (Fig. 3). An increase in the number of urology postgraduate training positions would correct this shortfall. Assuming a retention rate of 52%, increasing the number of urology residents trained annually in Ontario from 14 to 20 would meet the increased demands of population growth. Increasing to 25 positions would also meet the added demands of an aging provincial population (Table VIII).
Table V Balance Sheet of Mean Entries to and Exits From Ontario of Active Urologists for the Years 1994 to 1995 Change, no. of urologists Action
In
Entries Trainees remaining in Ontario
Out
Net
+7.2
Immigration From other Canadian provinces
+0.7
From abroad
+1.3
Exits Retirement age, yr 65
−7
70
−5.5
75
−3.5 −4
Emigration from Ontario Change Retirement age, yr 65
−2 (+9, −11)
70
−0.5 (+9, −9.5)
75
+1.5 (+9, −7.5)
DISCUSSION Table VI Projected Ontario Population Growth and Demographic Shift 1990 to 201512 Population
Age, % of total
Life expectancy, yr
Year
Total no.
% growth
65+
75+
85+
Males
Females
1990
9 884 000
—
11.7
4.6
1.0
74.4
80.4
1995
10 824 000
9.5
12.2
4.9
1.2
75.3
81.0
2000
11 711 000
8.2
12.5
5.5
1.3
76.0
81.4
2005
12 598 000
7.6
12.7
5.9
1.5
76.7
81.8
2010
13 515 000
7.3
13.2
6.1
1.7
77.3
82.2
2015
14 492 000
7.2
14.5
6.2
1.8
78.0
82.5
Table VII Projected Ontario Population Growth and Number of Urologists Required for the Years 1990 to 2010 Population growth alone
Adjusted for demographic shift
Year
Population
No. of urologists
Population
No. of urologists
1994
10 603 502
203
10 603 502
203
1998
11 356 200
217
11 948 810
229
2002
12 065 800
231
13 384 331
256
2006
12 781 400
245
14 825 990
284
2010
13 515 000
259
16 126 662
309
186
JCC, Vol. 42, No 3, juin 1999
Resource allocation issues are central to health care planning in today’s environment of fiscal constraint and cost rationalization. All models are limited by the validity of the data used to construct them and by their underlying assumptions. The U of T model was created using data (particularly data from the OPHRDC project) that had been externally validated to ensure its accuracy. In addition, whenever extrapolations were made for future predictions based on previous activity (e.g., ultimate destination of practice for Ontario-trained urology residents, or tendency of urologists to immigrate to Ontario) historical data were compiled over at least 4 years to eliminate year-to-year variation. The assumptions inherent in the creation of the model were clearly stated and were devised to ensure the model was conservative. The assumption that inputs into the number of active Ontario urologists will be similar to the
UROLOGY IN THE 21ST CENTURY
FIG. 2. Ontario urology work-force projections (U of T model 1994–2010). Mathematical assumptions inherent in the model include the following: 7 new urologists each year under 45 years of age (former residents or fellows), 2 new urologists each year between 45 and 55 years of age (immigration), 4 urologists aged 45 to 55 years emigrating each year and 0.0667 of urologists over the age of 55 years retire each year (retirement age is 70 years). n = needs (demographically adjusted), n = needs (population growth only), n = projected actual number.
FIG. 3. Ontario urology work-force projections (System for Health Area Resource Planning [SHARP] model 1990-2015). n = projected needs, n = projected availability. y
Table VIII Number of Additional Residents Needed Annually to Correct Anticipated Urologist Shortfall
Residents To remain in Ontario
Current no.
To match population growth
To match demographic shift
14
20
25
10
13
7.2
1991 to 1995 time frame is reasonable. It is unlikely that the number of urology residents trained in Ontario (or elsewhere in Canada) will increase in the future; given the recent 20% cut to medical school enrolment, it is more likely to decrease. Unless the mobility of medical licences changes dramatically in Canada, it is unlikely that the retention rate of Ontario urology residents will change significantly from the current 52% rate. Finally, given the current political and economic environment in the province, it is unlikely that immigration of active urologists will increase in the near future. The assumption that exits from the pool of Ontario urologists will remain similar to the 1991 to 1995 period also seems appropriate. There is no reason to expect that emigration of urologists from Ontario will decrease significantly; in fact, the opposite may occur. Although the population-to-urologist ratio in the United States is much lower than in Canada, in 1995 urology was one of few specialties to provide jobs for all American urology residents completing training.14 Thus, a market still may exist for Ontario urologists there, despite the rapid changes affecting the health care system. A predicted retirement age of 70 years seems reasonable. The model also relies on population and demographic projections from Statistics Canada, which is the most reliable source of data on these matters. The assumption that those aged 65 years or older have a greater need for urologic services is a reasonable one: it has been well documented that the rate of prostate cancer has risen sharply, and transitional cell carcinoma, female incontinence and benign prostatic hypertrophy are all diseases of the elderly.10,11 The weakest assumption of the model is that the current populationto-urologist ratio of 52 234:1 is optimal and should be extrapolated to the future when predicting a “desirable”
CJS, Vol. 42, No. 3, June 1999
187
PACE ET AL
number of urologists for the province. Such ratios have historically been used in work-force projections, but they are flawed. The use of ratios cannot account for changes in technology that might alter the number of professionals required to treat a population. Nonetheless, there is no clear, wellaccepted alternative to the use of population ratios for modelling. If one assumes that the ratios are the most straightforward method for modelling, then the choice of 52 234:1 is appropriate. Population-to-urologist ratios are much lower in the United States than in Canada, with a nationwide average of 30 000:1, and ratios as low as 20 000:1 in large urban areas.1 Furthermore, there is no indication that there is currently an excess of urologists in the province: clinical activity measures are high (Fig. 2), procedures-per-urologist rates are high compared with other surgical specialists and waiting times for elective surgery range from 4 to 12 weeks. Thus, the current ratio appears to be an adequate and conservative estimate of demand for urologic services. The U of T model provided some intriguing data. The fact that 41% of all practising urologists in Ontario are 55 years of age or older is alarming: many of these physicians are approaching retirement age and will need to be replaced in the next 10 to 15 years. Only 2% of all urologists in the province are women; however, women are better represented among younger urologists and in particular among urology residents. Only 52% of Ontario urology postgraduate trainees remain in the province to practise their specialty. The remainder move elsewhere in Canada or to the United States. Part of this discrepancy may relate to the fact that only 55% of Ontario postgraduate urology trainees during this period obtained their medical degrees from Ontario medical 188
JCC, Vol. 42, No 3, juin 1999
schools. The remainder obtained their degrees from elsewhere in Canada (22%) or from abroad (24%). Since Ontario universities provide the critical mass in terms of population catchment areas and collaboration necessary for tertiary and quartenary urology training, it is unlikely that this trend of training many urologists from outside the province will change. International medical graduates (IMGs) make up a significant portion of Ontario trainees; with changes in licensure, fewer of these IMGs remain in Ontario after completing training. Interestingly, if every urology resident and fellow trained in Ontario were to remain in the province permanently, there would be sufficient numbers of future urologists to meet the projected population and demographic demands for urologic services. This possibility seems extremely unlikely. Data on the number of active urologists who leave practice each year can be difficult to gather. Although retirement is the primary reason for urologists to leave practice, physicians often retire without notifying professional bodies, or may simply decrease their workload to a minimal degree. Unfortunately, there are no reliable data on the average retirement age of Ontario urologists. However, our method of projecting retirement by assuming that one fifteenth of the group of urologists aged 55 to 70 years will retire annually is mathematically sound. As Table VIII suggests, the net annual change in the active Ontario urologist pool will vary considerably, depending on which assumption of retirement age is used. If a retirement age of 70 years is selected, then there will be a net loss of 0.5 urologist per year in Ontario, compared with a net loss of 1.5 urologists if the retirement age is set at 65 years. The tendency to an aging population will have a dramatic impact on all
aspects of Canadian life and urology is no exception. The data presented in this study emphasize the growing proportion of the population over 65 years of age and the certainty that this group will continue to consume and require increasingly more health care resources. The model projection not accounting for this eventuality shows a shortage of urologists in the province for the near, short-and longterm; the projection accounting for this change predicts an even more severe shortfall. Correcting this problem can be complex. One approach is to take steps to modify the demand for urologist services through direct or indirect rationing of services, public health measures, increased public education and the de-listing of provincially insured services, but these are beyond the scope of this study. Changes being planned to hospitals in Ontario also fall outside the scope of this study: the rationalization of hospital care and closure of hospitals currently being planned provincially and at the level of district health councils in Ontario will undoubtedly have an impact on the number of urology positions available in the province. Nonetheless, the fact that urology has become more and more of an outpatient, ambulatory specialty with less need for inpatient resources and the fact that population demographic changes will lead to an inexorable rise in demand for urologist services will likely outweigh this concern. Another approach to the projected shortfall of urologists is to increase the supply, either by increased immigration from abroad (which is actually becoming more difficult as licensing rules are being tightened nation-wide), increasing the number of Ontario urology training positions or forcing all Ontario urology trainees to take up practice in Ontario only (likely an illegal measure).
UROLOGY IN THE 21ST CENTURY
CONCLUSIONS Based on the U of T model of future Ontario urologist supply and need for urologist services, there will be a significant shortage of urologists for the foreseeable future. The model makes use of the best data on urology resource allocation currently available and relies on a set of clearly defined and reasonable assumptions regarding the future. The methodology of the U of T model is generalizable and can be applied to work-force projections for other physician groups in Ontario and the rest of Canada. This form of modelling is vital in planning how scarce resources should be allocated today for the future and should be used by federal and provincial authorities in conjunction with all stakeholders in health care allocation management to create a rational and comprehensive strategy for the future. We acknowledge the generous assistance of the following, without whom this project could not have been completed: Kathleen Clements at the Ontario Physician Human Resources Data Centre, Danielle Frechette at the Royal College of Physicians and Surgeons of Canada, A. Dianne Thurber of the Canadian Post-MD Education Registry and Dr. Jim Wilson from Queen’s University, Kingston. We
particularly appreciated the support and inspiration of University of Toronto Dean of Postgraduate Medicine Dr. J. L. Provan, who died in July 1996.
9.
References 1. Shapiro E, Hatch DA. Pediatric urological manpower report. Pediatric Urological Manpower Committee of the American Association of Pediatric Urology. J Urol 1993;150(2 Pt 2):675-9. 2. Ruby RRF. Otolaryngological manpower in Canada in the year 2000. J Otolaryngol 1991;20(5):305-9. 3. Watanabe M. Physician resource planning: quest for answers. Clin Invest Med 1994;17(3):256-67. 4. Adams O. Management of human resources in health care: the Canadian experience. Health Econ 1992;1(2):31-43. 5. Clements K, Johnston N. Physicians in Ontario 1994 [report]. Toronto: Ontario Physician Human Resources Data Centre database, 1992-95. 6. Royal College of Physicians and Surgeons of Canada. Specialty physician resource survey. Ottawa: The College; 1996. 7. Clements K. OHIP billing groups of Ontario urologists by age group. Toronto: Ontario Physician Human Resources Data Centre database, 1992-94. 8. Clements K, Johnston N. Post-gradu-
10.
11.
12.
13.
14.
15.
ate medical trainees in Ontario 1994 [report]. Toronto: Ontario Physicians Human Resources Data Centre database, 1995. Thurber AD. Canadian Post-M.D. Education Registry data, 1991-95. Ottawa: Association of Canadian Medical Colleges; 1995. Levy IG, Gibbons L, Collins JP, Perkins DG, Mao Y. Prostate cancer trends in Canada: rising incidence or increased detection? [see comments]. CMAJ 1993;149(5):617-24. Comments in CMAJ 1993;149(5):569-70; CMAJ 1993;149(10):1375-6. Lu-Yao GL, Greenberg ER. Changes in prostate cancer incidence and treatment in the USA. Lancet 1994;343 (8892):251-4. Denton FT, Feaver CH, Gafni A, Spencer BG. System for health area resource planning (SHARP) 1.2-7.0. Program for quantitative studies in economics and population. Hamilton (ON): McMaster University; 1993. Canadian socio-economic information management system (CanSIM), matrices 6367, 6379 and 6900. Ottawa: Statistics Canada, 1994. American Residency Match Results for 1995. Charlottsville (VA): American Board of Urology, 1995. Strachan J. National physician database (NPDB). Toronto: Canadian Institute for Health Information; 1996.
Books and Other Media Received Livres et autres documents reçus This list is an acknowledgement of books and other media received. It does not preclude review at a later date. Cette liste énumère les livres et autres documents reçus. Elle n’en exclut pas la critique à une date ultérieure.
Échographie opératoire pour chirurgiens — Operative Ultrasound for Surgeons. Volume I. Patrice Lamoureux. CD-ROM. CHUM Communiqué, Montreal; Sponsored by Aloka Science & Humanity, Université de Montréal, Montreal. 1999. Can$150. ISBN 1-896957-16-1
1998. Price not stated. ISBN 5-7982-0011-6
Emergency Abdominal Surgery in Infancy, Childhood and Adult Life. 3rd edition. Edited by Peter F. Jones, Zygmunt H. Krukowski and George G. Youngson. 556 pp. Illust. Chapman & Hall Medical, London, UK; Edward Arnold (Publishers) Ltd., London, UK. 1998. £45.00. ISBN 0-412-81950-3
Intraoperative Irradiation. Techniques and Results. Edited by Leonard L. Gunderson, Christopher G. Willet, Louis B. Harrison and Felipe A. Calvo. 550 pp. Illust. Humana Press, Totowa, NJ. 1999. US$195. ISBN 0-896-03523-9
History of Cardiovascular Surgery. Edited by L.A. Bockeria. 168 pp. Illust. Publishing House of the Bakoulev Scientific Center for Cardiovascular Surgery, RAMS, Moscow.
The Virtual Surgeon — ACL Reconstruction. George Bentley, Russell E. Windsor and Andrew Williams. CD-ROM. TVF Multimedia, London, UK. 1998. Can$250 CJS, Vol. 42, No. 3, June 1999
189