Journal of Life Sciences and Technologies Vol. 1, No. 2, June 2013
Segmentation and Feature Extraction of Heart Murmurs in Newborns Amir Mohammad Amiri and Giuliano Armano University of Cagliari/Department of Electrical and Electronic Engineering (DIEE), Cagliari, Italy Email: {amir.amiri, armano}@diee.unica.it
Abstract—Heart murmurs are typically detected in newborns, in many cases due to the patent ductus arteriosus condition. Hence, providing an automatic tool for heart sound analysis can be helpful to physicians in the diagnosis of heart murmurs in newborns. In this paper we propose a novel method that performs segmentation and feature extraction, aimed at separating heart sound signals in two parts: innocent and pathological murmurs. The segmentation of heart sounds into single cardiac cycles (Systole and Diastole murmurs) uses wavelet transform and k-mean clustering. Feature values are evaluated after segmentation by using time and frequency measures. Sound signal encoding is carried out using Shannon energy, bispectrum, and Wigner bispectrum. A comparative analysis has shown differences in their capability of preserving discriminant information. Experimental results highlight that all cited techniques perform well; however, the best results have been obtained by using Wigner bispectrum.
of a blood vessel (the ductus arteriosis) between these arteries to properly close. In most cases, the only symptom of PDA is a heart murmur until the ductus closes on its own shortly after birth (this often happens in otherwise healthy newborns). Sometimes, especially in premature newborns, it may not close on its own, or it may be large and permit too much blood to pass through the lungs, which can place extra strain on the heart, forcing it to work harder and causing a rise in blood pressure in the arteries of the lungs. If this is the case, a medication or, rarely, surgery may be needed to help close the PDA. An innocent murmur still orders an echocardiogram for reassurance, even though the cost of an echocardiogram is not negligible. The result of this practice is a misallocation of healthcare funds. While it is clearly important to avoid that healthy newborns are sent for echocardiogram (type-I error), it is also important to avoid that a newborn with pathological heart murmur is sent home without proper treatment (type-II error) [1]. Furthermore, auscultation remains the primary tool for screening and diagnosis in primary health care. This is due in part to the higher cost and relatively limited availability of the equipment, and to the special skills necessary to administer and interpret the results of phonocardiography (PCG) and echocardiography. In some circumstances, particularly in remote areas or developing countries, auscultation may be the only means available. The problem of heart sound segmentation in the presence of murmur has been tackled in the last few years using different approaches. A homomorphic filter was introduced in [2], and a decision-tree based segmentation strategy was suggested for the problem in [3]. Simplicity and strength computation was applied in [4]. Many studies have been performed with the goal of providing tools for practical murmur detection and improving the diagnostic accuracy of physicians in small practice settings in time and frequency series. In particular, Ahlstrom et al. [1] investigated the issue of feature extraction for systolic heart murmur classification. For more information on the problem of diagnosing systolic heart murmurs see, for instance, McGee [5]. Heart sounds have been recorded from newborns in other research activities, focusing on adult, child or infant [6] [7]. Different methods are used in time and frequency and time-frequency series for feature extraction of heart
Index Terms—wigner bispectrum, bispectrum, shannon energy, K-means, innocent murmur, pathological murmur
I.
INTRODUCTION
Heart sound contains information which cannot be perceived by the human ear. Recent advances in data recording technology and digital signal processing have made it possible to record and analyze the sound signals from the heart. Two types of murmur can be observed during auscultation: pathological and normal, the latter being called in newborns innocent murmur. Newborns often have heart murmurs that mostly originate from normal flow patterns with no structural or anatomic abnormalities of the heart or vessels. They are referred to as innocent, physiological or normal murmurs; Conversely, murmurs may be created by abnormal flow patterns in the heart and vessels, originate from a congenital heart disease –including regurgitation, stenosis of heart valves, left to right shunt lesions at the atrial, ventricular, or great arterial levels. However, the most common cause of murmur in newborns is when a specific condition called patent ductus arteriosus (PDA) occurs; it is often detected shortly after birth, most commonly in premature newborns. PDA is a potentially serious condition in which blood circulates abnormally between two of the major arteries near the heart, due to the failure Manuscript received Aril 18, 2013; revised June 5, 2013. ©2013 Engineering and Technology Publishing doi: 10.12720/jolst.1.2.107-111
107
Journal of Life Sciences and Technologies Vol. 1, No. 2, June 2013
murmurs, the most important being spectral analysis [8] [9]. To, achieve a high-resolution result for heart murmurs analysis we used high order spectral methods, such as Bispectrum and Wigner Bispectrum. In this paper, we discuss some speech and audio processing techniques for analyzing heart sounds. II.
METHODS
Let us assume that encoding embodies pre-processing and feature extraction. In turn, pre-processing embodies filtering and segmentation activities. In this paper, we consternate on segmentation and feature extraction. A. Pre-processing Filtering: The first step of pre-processing is filtering heart sounds, with the goal of removing the unwanted noise. The recording of PCG usually has a sampling frequency higher than 8000Hz. In the event that the recording environment cannot be controlled enough, noise is coupled into the PCG. To avoid unpredictable effects brought by noise, filtering becomes important for later processing. Since the main spectrum of first and second (S1 and S2 respectively) heart sound occurs within the range of 200Hz, the system filters the original heart sound using 3rd order a band-pass filter Butterworth, with cut-off frequencies at 50Hz and 200Hz. An electronic stethoscope has been used to record heart sounds, giving rise to a dataset at 44k Hz and converted to 4k Hz. Segmentation: The second step of pre-processing for detecting systolic murmurs uses a segmentation method aimed at identifying the heart sound components S1 and S2 (See Fig. 1).
Figure 2. Illustration of wavelet coefficients original signal (top), scale colored (middle), Coefficients line (bottom).
This task is carried out by K-means, a non-hierarchical partitioning method that partitions the observations in the data into K mutually exclusive clusters, and returns a vector of indices indicating to which of the K clusters it has assigned each observation. K-means uses an iterative method that minimizes the sum of distances from each object to its cluster centroid, over all clusters. This process moves objects between clusters until the sum cannot be decreased further. Clustering has been used to identify single cardiac cycles. Each class of heart sounds contains distinctive information that exists in time and frequency domains. The extraction of single cardiac cycle must be performed. The systolic (S1-S2) and the diastolic (S2-S1) time intervals excluding, the S1 and S2 sounds, were calculated after the peak conditioning process. The calculated time intervals were clustered into two clusters.
Figure 1. Sample of two-cycle heart sound, where components S1 and S2 are highlighted.
Currently, the detection can also be manually made to identify S1 and S2 we used an automatic procedure. The segmentation method is based on the timing between high amplitude components. The basis for this process is that the time interval that occurs between S1 and S2 (systole) is always smaller than the one between S2 and S1 (diastole). Even after pre-processing, the actual heart sound signal still has very complicated patterns with numerous small spikes that have little impact on diagnosis but may influence the location of S1 and S2. Peak conditioning was performed for the obtained peaks using wavelet transform, which enabled the cycle detection process. Hence, to find peak location we used the Complex Morlet Wavelet (CMW) transfer (See Fig. 2). ©2013 Engineering and Technology Publishing
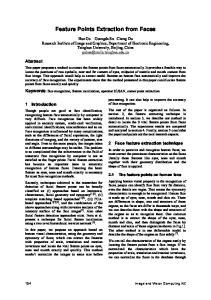
Figure 3. (a) Systolic murmur, (b) Diastolic murmur.
Two consecutive occurrences of cluster 1 (S1-S2) and cluster 2 (S2-S1) indicates a single cardiac cycle. The smaller time interval of a cycle is then identified as systole while the other interval as diastole. Consecutive cluster 1 or cluster 2 occurrences might be due to loss of peak, extra peak or due to equal systolic and diastolic intervals. Single cycles of PCG signals were extracted as shown in Fig. 3 for heart sound with Systolic murmur and Diastolic murmur, respectively [2]. 108
Journal of Life Sciences and Technologies Vol. 1, No. 2, June 2013
B. Feature Extraction This phase is focused on extracting features of the signal that better highlight characteristic properties of the PCG signal, with the goal of diagnosing heart murmurs. In particular, each signal is represented by the features summarized in Table I. As Bispectrum and Wigner distributions have been very important for improving the classification, let us spend a few words on these techniques. TABLE I.
It is worth noting that moments give more accurate results in the analysis of deterministic signals, while cumulants give more accurate results in the analysis of random signals [11]. Power spectrum of random signals is defined in terms of DFT, i.e., discrete Fourier transform (see Equation 5).
B f1 , f 2
Description
Max
Maximum Value Amplitude
Positive Area
Sum of Positive Area
Variance
Energy
Shannon Energy
Bis
Bispectrum
WB
Wigner Bispectrum
(1)
absolute value E x
(2)
(8)
(9)
As bispectrum analysis is not easy to calculate, this slice of spectrum obtained from a bispectrum is used for giving an idea in the analysis of data that do not exhibit nonlinear or Gaussian distribution in the signal. Wigner Bispectrum: Wigner high-order spectrum is an extension of Wigner-Ville distribution. It keeps the advantages of Wigner–Ville distribution and has also the advantages of High-Order Spectra. High-Order Spectra have been widely used in the non-gauss and nonstationary realm, which is quite applicable to PCG signals. In particular, by combining Wigner-Ville distribution, we could get the time-frequency characters at the same time. The study has proved that under low SNR circumstances, the Wigner Bispectrum (WHOS in the third-order moment domain) is better than Wigner-Ville distribution [12]. The High-Order Spectra of Wigner-Ville Distribution of signal x (t) is defined as follows [13]:
Bispectrum: The third-order spectrum, called bispectrum, is a particular example of higher-order spectrum, defined as the Fourier transform of third-order cumulants sequence. The power spectrum is member of the class of higher-order spectra. For the sake of completeness, let us recall that second order statistics such as autocorrelation and power spectrum provide important information in analysis of Gaussian, stationary and linear processes.
W t , f1 , f 2 ,... f k
k
k
x t k 1 i 1
i
k 1 m x* t k 1 m 1
...
1 k 1
k
(10)
j exp j 2 f i i d i .
j 1, j 1
W t , f1 , f 2 ,... f k represents
the
order
k
Fourier
transform of a k-dimensional local function. Let us define (3)
Rkt as follows: k
Rkt x t x t i
(4)
i 1
Higher order statistics, used in the analysis of Gaussian, stationary and non-linear processes, typically allow to obtained important results. Higher order statistics are calculated upon higher order moments (HOM) such as m3 and m4, i.e., third and fourth order moment are defined as follows:
m3 x (i, j ) = E{X (n).X (n+i).X (n+ j )} (5)
where α is a delay of time. Now Wkx can be defined as: Wkx t , f1 , f 2 ... f k k
Rk 1 , 2 ... k exp j 2 f i i d . i 1
1 x t 2 1 2 exp j 2 3
m4 x (i, j,k ) = E{X (n).X (n+i ).X (n+ j ).X ( i, j, k )} (6) 109
(11)
Finally, the definition of Wigner Bispectrum can be given as follows: 1 (12) W2 x t , f1 , f 2 . x* t 1 2 1 2
©2013 Engineering and Technology Publishing
. (7)
B X X * 2
E x 2 log x 2
m2 x (i) = E{ X (n).X (n+i)}
j 2 m f1 n f 2
A diagonal slice of a single variable bispectrum for a special situation at which frequencies are equal can be defined as follows:
Shannon energy: Shannon energy is another applicable method which we made use of. The calculation of the Average Shannon Energy is based on signal segments. Therefore, here we segment the data, 0.02 seconds and with a 0.01- second signal segment overlapping throughout the signal. The average Shannon energy is calculated as (see [10] for more information):
mx E ( x)
x 3
m n
B1 , 2 X 1 X 2 X * 1 , 2
Absolute Negative Absolute Sum of Negative Area Var
In the event that the signal is a stationary random process with real values, we can write:
THE FEATURE THAT HAS BEEN USED IN EXPERIMENTS. Feature Set
C m, ne
3
f1 1 f 2 2 d 1d 2
Journal of Life Sciences and Technologies Vol. 1, No. 2, June 2013
III.
EXPERIMENTAL RESULTS
and S2, together with the feature of heart murmur. For the sake of readability, they are put into deviance for separating innocent and pathological murmurs.
This section reports experimental results and discusses the applications of Shannon energy, Bispectrum, and Wigner bispectrum to the analysis and diagnosis of heart murmurs. Fig. 4 shows the result of applying Shannon energy to the diagnosis of heart murmurs. The frequency domain representations of these sounds make rather clear the differences between normal and pathological systolic murmurs.
Figure 6. Wigner bispectrum of heart sound: (a) Heart sound with innocent murmur (b) Heart sound with pathological murmur.
IV. Figure 4. Shannon energy of heart murmur: (a) Innocent murmur (b) Pathological murmur.
CONCLUSIONS
The analysis of heart sounds in newborns can be very useful for deciding to release or send them to echocardiogram. Hence, it is very important to devise an effective method for analyzing heart sound defects. This paper introduces a new method for heart sound segmentation, and feature extraction which is applicable even in presence of murmurs. Heart murmurs are diagnosed using several features, including Shannon energy, Bispectrum and Wigner bispectrum. Further work is under way to improve feature extraction and classification. The proposed method is for high-volume screening of newborns. The software system depicted in this work can be considered a first release of corresponding diagnostic tool. REFERENCES [1] G. DeGroff, S. Bhatikar, J. Hertzberg, R. Shandas, L. Valdes-Cruz,
[2] Figure 5. Contour plot of bispectrum for (a) normal and (b) pathological heart murmurs.
[3]
Fig. 5 depicts the bispectrum for a normal (Fig. 5a) and a pathological (Fig. 5b) heart murmur. Fig. 5a clearly highlights the existence of significant peaks in the bispectra. Thorough experimental, results show that the same kind of heart murmurs have significant similarities in their bispectra shapes and in the locations of peaks. Fig. 6 illustrates the Wigner bispectrum for normal and pathological heart sounds. Fig. 6 clearly highlights S1
©2013 Engineering and Technology Publishing
[4] [5] [6]
110
and L. Roop, “Artificial neural network-based method of screening heart murmurs in childeren,” Published by the American Heart Association, pp. 2711-2716, 2001. C. N. Gupta, R. Palaniappan, S. Swaminathan, and S. M. Krishnan, “Neural network classification of homomorphic segmented heart sounds,” Applied Soft Computing, vol. 7, pp. 286-297, 2007. S. A. Pavlopoulos, A. C. Stasis, and E. N. Loukis, “A decision tree based method for the differential diagnosis of aortic stenosis from mitral regurgitation using heart sounds,” Bio-Medical Engineering Online, pp. 115, 2005. D. Kumar, P. Carvalho, M. Antunes, R. P. Paiva, and J. Henriques, “An adaptive approach to abnormal heart sound segmentation,” Published by ICASSP, 2011, pp. 661-664. S. McGee, “Etiology and diagnosis of systolic murmurs in adults,” The American Journal of Medicine, vol. 123, no. 10, pp. 913-921, October 2010. M. A. Frommelt, “Differential diagnosis and approach to a heart murmur in term infants,” Published by Predict Clinics in Elsevier, 2004, pp. 1023-1032.
Journal of Life Sciences and Technologies Vol. 1, No. 2, June 2013
[7] E. Loukis and M. Maragoudakis “Heart murmur identification [8]
[9]
[10] [11]
[12] [13]
using random forest in assistive environments,” Samos, Greece, pp. 1-6, 2010. A. Noponen, S. Lukkarinen, A. Angerla1, and R. Sepponen, “Phono-spectrographic analysis of heart murmur in children,” Published by BMC Pediatrics, Biomed Central, June 2007, vol. 11, pp. 1-10. F. Rios-Gutierrez, R. Alba-Flores, and S. Strunic, “Recognition and classification of cardiac murmurs using ANN and segmentation,” Electrical Communications and Computers (CONIELECOMP), IEEE, 2012, pp. 219-223. C. Ahlstrom, P. Hult, P. Rask, et al., “Feature extraction for systolic heart murmur classification,” Annals of Biomedical Engineering, vol. 34, no.11, pp. 1666-1677, November 2006. O. Akgn and H. S. Varol, “Determining the degree of aortic stenosis caused by the bicuspid valve with bispectral analysis of heart sound signals,” Presented at the 5th International Advanced Technologies Symposium (IATS09), Karrabul, Turkey, May 1315, 2009. S. M. Debbal, F. Bereksi, “Time-frequency analysis of the first and the second heartbeat sounds,” Published by Applied Mathematics and Computation, Elsevier Inc, 2006, pp. 1041-1052. L. Song and F. Yu, “The time-frequency analysis of abnormal ECG signals,” Springer-Verlag Berlin Heidelberg, 2010, pp. 6066.
©2013 Engineering and Technology Publishing
111
Amir Mohammad Amiri received the Bachelor degree in Electrical engineering and Master degree in Biomedical engineering, Islamic Azad university of Iran, in 2006 and 2009, respectively. Since 2011, he is a Ph.D. student at the Department of Electronic and Informatics Engineering (DIEE), University of Cagliari. His research interests include pattern recognition, signal processing and intelligent systems, with applications in Biomedical engineering. Author’s formal photo
Giuliano Armano is associate professor of computer engineering at the Dept. of Electrical and Electronic Engineering (DIEE), University of Cagliari, leading also the IASC (“Intelligent Agents and Soft-Computing”) group. His educational background ranges over expert systems and machine learning, whereas his current research activity is focused on machine learning and pattern recognition techniques, mainly experimented in the field of biomedical sciences, information Author’sand formal retrieval, text categorization. photo